
Abstract
The intracellular calcium level was determined in the canine basilar artery to investigate whether Ca2+regulation of its smooth muscle is altered during chronic vasospasm following subarachnoid hemorrhage. A double-hemorrhage model was used. The occurrence of vasospasm was confirmed angiographically 7 days after initial hemorrhage. The intracellular calcium concentration ([Ca2+]i) of smooth muscle was measured using Fura-2. Fluorescence to excitation at 340 and 356 nm was monitored and the ratio R340/356 was used as the indicator of [Ca2+]i. When the extracellular calcium concentration ([Ca2+]e) was increased from pCa 8 to 2, [Ca2+]i also increased. In the spastic arteries, the [Ca2+]e − [Ca2+]i curve was elevated as compared with the normal arteries. Treatment with ionomycin elevated the curve in the normal group, but it had little effect in the spastic arteries. Values of [Ca2+]i, calculated in multiples of Kd, were greater in the spastic arteries. Diltiazem (10;−5 mol/L) partially suppressed the augmented [Ca2+]i signal in the spastic arteries, whereas it did not affect the curve in the control group. These results indicate that calcium regulation of smooth muscle is impaired after subarachnoid hemorrhage, which may contribute to the pathogenesis of chronic vasospasm.
Alterations of properties of cerebral arteries during chronic vasospasm have been studied from various aspects. Changes in pharmacological responsiveness (White and Robertson, 1987; Kim et al., 1988; Nakagomi et al., 1988; Kanamaru et al., 1989), reduction in high energy phosphates and metabolic impairment of the arterial wall (Tsukahara et al., 1988; Kim et al., 1992b; Yoshimoto et al., 1993), derangement of second messenger production and the signal transduction system (Matsui et al., 1991; Kim et al., 1992a; Minami et al., 1992), alterations in the mechanical properties of the arterial wall (Bevan et al., 1987; Kim et al., 1989), as well as morphological transformations (Fein et al., 1974; Tanabe et al., 1978; Hughes and Schianchi, 1978; Eldevik et al., 1981; Pickard et al., 1985; Mayberg et al., 1990) and immunological reactions (Peterson et al., 1990) have been reported. However, the true nature/genesis of the pathological vasoconstriction that characteristically lasts for 2–3 weeks in clinical cases (Saito et al., 1977) and in experimental models (Yoshimoto et al., 1993) remains to be elucidated. Recent studies demonstrated that production of cyclic GMP, the second messenger that mediates NO-induced relaxation (Ignarro and Kadowitz, 1985; Furchgott and Vanhoutte, 1989), is impaired in spastic cerebral arteries (Edwards et al., 1992; Kim et al., 1992a). The amounts of high energy phosphates, creatine phosphate, ATP, and GTP, which is the substrate for cyclic GMP production, are markedly diminished in spastic arteries (Kim et al., 1992b). The temporal profile of the reduction in the phosphates is closely correlated with that of the development of vasospasm (Yoshimoto et al., 1993). These findings signified the presence of a metabolic disturbance in the arterial wall.
Homeostasis of cytoplasmic Ca2+ is maintained against steep Ca2+ gradients across the plasma membrane by energy-dependent mechanisms (Somlyo and Himpens, 1989; Walsh, 1991), such as sarcolemmal Ca2+-transporting ATPase, Na+/Ca2+exchanger, and Ca2+-transporting ATPase on the sarcoplasmic reticulum. In cultured vascular smooth muscle, oxyhemoglobin induces elevation of [Ca2+]i (Steele et al., 1991; Takenaka et al., 1991). It activates phospholipase C and increases inositol triphosphate (Vollrath et al., 1994). In the spastic cerebral arteries, morphological evidence of cytoplasmic deposition of Ca2+(Kohno et al., 1991) and reduction in Ca2+-ATPase activity (Wang et al., 1994) were reported. The present study was undertaken to investigate whether or not actual alterations in the regulation of sarcoplasmic calcium concentration take place in the spastic cerebral arteries.
MATERIAL AND METHODS
Animal model and angiography
The “double-hemorrhage” canine model (Varsos et al., 1983) of subarachnoid hemorrhage (SAH) was used in this study. Mongrel dogs of either sex, weighing 8–13 kg, were randomly assigned to SAH and control groups. Under general anesthesia (pentobarbital, 15 mg/kg and thiopental 15 mg/kg i.v.) and mechanical ventilation, vertebrobasilar angiography was performed to measure the size of the basilar artery. The arterial blood gas was monitored to rule out fluctuation of the diameter of the cerebral artery due to variation in Pco2. The animals in the SAH group then underwent a percutaneous injection of autologous venous blood (8–11 ml) into the cisterna magna (day 0). Two days later, the injection was repeated. Details of the technique have been described elsewhere (Kim et al., 1987, 1988).
The animals underwent angiography again on day 7, and they were killed by an intravenous overdose of sodium pentobarbital. The control group underwent the angiographical examination on the identical schedule but without the subsequent cisternal injection. For quantification of vasospasm, the angiograms were magnified and the images were recorded and digitized using a video tape recording system coupled to a personal computer and an image analyzer. The degree of narrowing was calculated as the ratio of the cross-sectional area to that of the baseline angiogram taken on day 0. It was 100.4 ± 17.2% in the control group and 23.3 ± 8.8% in the SAH group (mean ± SD, n = 16 in each group).
The care of the animals and procedures in the study complied with the “Principles of Laboratory Animal Care” and the “Guide for the Care and the Use of Laboratory Animals” (DHHS publication no. NIH 85–23, revised 1985) and had been approved by the institutional animal care and use committee.
Measurement of intracellular calcium level
Following euthanasia, the brainstem with the basilar artery was promptly dissected and immersed in modified Krebs-Ringer solution (NaCl 118.3 mmol/L, KCl 4.7 mmol/L, CaCl2 2.5 mmol/L, MgSO4 1.2 mmol/L, KH2PO4 1.2 mmol/L, NaHCO3 25.0 mmol/L, glucose 11.1 mmol/L) aerated with 95% O2/5% CO2. The subarachnoid clot on the adventitial surface of the artery and the intraluminal clot were then carefully removed under the microscope. The artery was rinsed in the buffer solution several times. The basilar arteries were cut transversely in equal thickness to obtain ring-shaped preparations. To load the fluorescent dye Fura-2, ring preparations were treated with acetoxymethyl ester of Fura-2 (Fura-2/AM, 20 μmol/L) in calcium buffer solution (see Solutions and Protocol) for 3 h at room temperature in the presence of a minimum amount of detergent Pluronic F127, 0.005%) to increase solubility of the dye. Three-hour loading of the dye did not cause changes in the membrane permeability, as assessed by staining with a hydrophilic DNA-binding dye, ethidium bromide.
The rings were then turned inside out, and the endothelial layer was peeled off using watchmaker forceps under a high magnification (×64) dissecting microscope. The absence of endothelium and the integrity of the medial layer were histologically confirmed. The inside-out rings denuded of endothelium were placed on a stainless-steel wire mount that fit securely into a ultraviolet-grade cuvette. The mount was specially designed to have little compliance against contraction of the arterial preparations. The width of the mount was adjusted to the optimal length for contraction (initial length +1.2 mm in the control group and +0.8 mm in the spastic arteries) (Kim et al., 1989). It was confirmed by preliminary experiments that the difference in the size of the mount did not cause a shift in the [Ca2+]e vs. [Ca2+]i signal curves in the control arteries. The chamber, filled with N-2-hydroxy-ethylpiperazine-N′-2-ethanesulfonic acid (HEPES) buffer, was maintained at 30°C and continuously aerated.
For recording the calcium signal, a spectrofluorometer (CAF-110; Japan Spectroscopic Co., Tokyo, Japan) was used. Excitation light was obtained from a xenon high pressure lamp with a rotating mirror unit and two sets of monochromators. The intensity of Fura-2 fluorescence at 500-nm emission was measured at excitation wavelengths of 340 and 356 nm (F340, F356) and the ratio of the two was calculated (R340/356). The latter wavelength of excitation was chosen to calibrate rigorously against decay of Fura-2, which varies between the two groups. Loss of Fura-2 from the cells is best assessed at the isosbestic point, where fluorescence intensity of Fura-2 is independent of [Ca2+]i. The isosbestic point in our system was determined at 356 nm because fluorescence at this excitation wavelength did not change upon activation by high K+. Decay in F356 was measured in the control and spastic arteries; the fluorescence decay over 30 min was 28.8 ± 16.1 and 27.6 ± 7.4% in the control and spastic arteries, respectively (mean ± SD, n = 8 in each group). The decay over 60 min was 55.7 ± 24.6 and 72.9 ± 5.6% (n = 8, p < 0.05) in the control and spastic arteries. Measurements were completed within 30–40 min. At the end of each experiment, a solution containing MnCl2 (10 mmol/L) was applied to quench Fura-2-derived fluorescence, and then the resulting values of F340 and F356 were used to control for autofluorescence. The relative increase in R340/356 was calculated as (R − Rmin)/(Rmax − Rmin), where Rmin and Rmax are the minimum and maximal values of R340/356 reached by the preparation. R340/356 was used as the signal indicator for intracellular calcium concentration.
An estimate of the value of [Ca2+]i was made using the formula of Grynkiewicz et al. (1985):
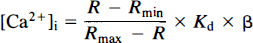
where R is the experimentally determined ratio R340/356 and Kd is the dissociation constant of the Fura-2/Ca2+ complex. Rmax and Rmin were determined in a depolarizing buffer solution and a solution containing ethyleneglycol-bis-(β-aminoethyl ether)-N,N,N,N′-tetraacetate. (EGTA) in the presence of ionomycin (see Solutions and Protocol), β is the ratio of the maximal to the minimal fluorescence excited at the second wavelength, which equals 1 in this protocol since the second excitation wavelength was chosen at the isosbestic point.
Solutions and protocol
Calcium buffer solutions with various values of pCa were prepared by mixing solutions of EGTA (500 mmol/L) and Ca-EGTA (100 mmol/L) (Iino, 1989). The latter was made by mixing CaCO3 and equimolar EGTA and then titrating the pH to 7.0 with NaOH. Ionic constituents were computed by solving multiequilibrium equations using stability constants compiled by Martell and Smith (1974). All solutions contained HEPES 10 mmol/L, NaHCO3 2.7 mmol/L, NaCl 153 mmol/L, and KCl 5.3 mmol/L, except for the depolarizing solution, which contained NaCl 77 mmol/L and KCl 80 mmol/L. The experimental protocol used to examine the [Ca2+]e vs. [Ca2+]i relationship was as follows: The ring-shaped arterial preparations were rinsed several times in a pCa 8 solution prior to loading of Fura-2/AM. They were then incubated with Fura-2/AM (20 μmol/L) in pCa 8 buffer supplemented with MgCl2 (1 mmol/L) for 3 h. The ring preparations were denuded of endothelium, inverted, and placed on a mount, which was then secured in a cuvette. The Ca2+concentration of the solution in the cuvette was changed successively from pCa 8 to pCa 7, pCa 6, pCa 5, pCa 4, pCa 3, and pCa 2. Rmax was determined in a depolarizing (high K+) pCa 2 solution containing ionomycin (10 μmol/L). Subsequently, the preparations were exposed to EGTA (10 mmol/L) solution containing ionomycin to determine the value of Rmin. The protocol was completed by changing the solution to that containing MnCl2 (1 mmol/L) to quench Fura-2-derived fluorescence.
The protocol to observe the effect of ionomycin on the relationship between [Ca2+]e and [Ca2+]i was identical to the protocol described, except that the Fura-2 loading solution and the solutions with various values of pCa contained ionomycin (10 μmol/L).
To examine the effect of calcium channel blocker, diltiazem (10−5 mol/L) was added to the buffer solutions (pCa 8 to 2); [Ca2+]i signal was measured in the identical fashion and the effect in each group was compared.
To measure responses to high K+ stimulation, loading of the dye was performed in a standard solution (HEPES 10 mmol/L, NaHCO3 2.7 mmol/L, NaCl 153 mmol/L, and KCl 5.3 mmol/L) containing 1.8 mmol/L of CaCl2, and the response of [Ca2+]i signal to depolarizing solution (NaCl 77 mmol/L, KCl 80 mmol/L) was then monitored.
Measurement of tension
For the measurement of isometric tension, the preparations without endothelium were mounted on a pair of fine stainless-steel rods, one of which was connected to a miniature strain gauge transducer (Akers, Oslo, Norway), and immersed in organ baths kept at 37°C and filled with HEPES buffer solutions with various values of pCa. The tension was measured at the preparations' optimal length, which was determined for each sample by applying high K+ solution. We then compared the myogenic tone of the arterial preparation at various [Ca2+]e values. Development of tone in each preparation during increases in extracellular calcium concentration was monitored. Myogenic tension was expressed as the percentage of maximal contraction that was determined in 80 mmol/L KCl in the presence of 10 mmol/L of Ca2+ in each preparation.
Drugs and reagents
All chemicals utilized were of the highest degree of purity. The following drugs were used: ionomycin (Sigma Chemical Co., St. Louis, MO, U.S.A.), diltiazem (Sigma), HEPES (Dojindo Laboratories, Kumamoto, Japan), EGTA (Dojindo), and Fura-2/AM (Dojindo). NaCl, KCl, CaCl2, MgCl2, and MnCl2 were obtained from Wako Pure Chemicals (Tokyo, Japan).
Data analysis
Data are expressed as means ± SD. For statistical comparisons of the response of [Ca2+]i signal to various extracellular calcium concentrations, analysis of variance was used. In all cases, p values of <0.05 were considered to be statistically significant. The number of animals in each set of data is indicated by n.
RESULTS
[Ca2+]e vs. [Ca2+]i signal relationship
In the normal arteries of the control group, the [Ca2+]i signal rose as the Ca2+ concentration of the external solution was increased stepwise form pCa 8 to 2 (Fig. 1a). In the spastic arteries of the SAH group, the [Ca2+]i signal was significantly larger than in the control group (p < 0.0005 at pCa 6,5,4, 3, and 2) (Fig. 1a).
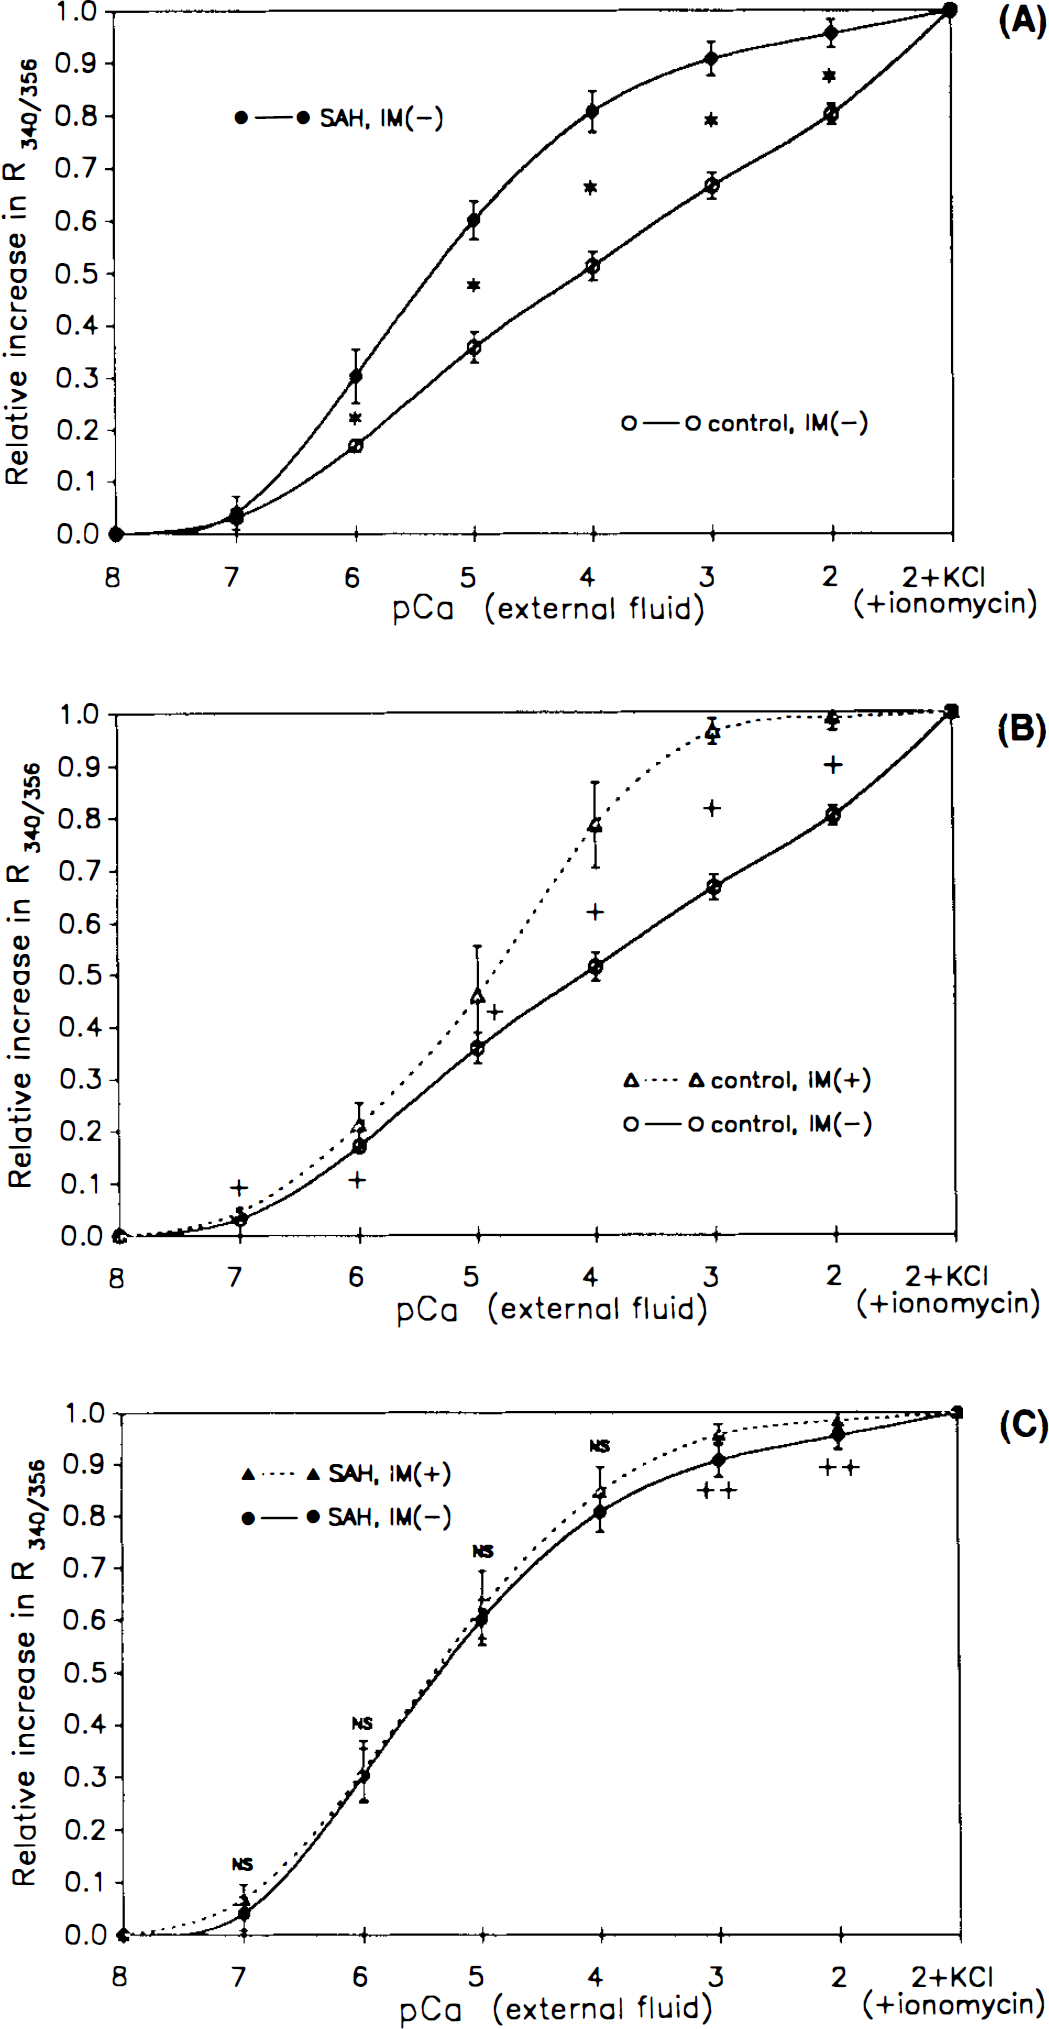
Intracellular calcium ([Ca2+]i) signal measured as the calcium concentration of the external fluid was altered. Results from the normal control arteries and spastic [subarachnoid hemorrhage (SAH)] groups in the absence [IM(−)] and presence [IM(+)] of ionomycin (10 μmol/L) are shown (mean ± SD, n = 6 in each group). The increments in calcium signal (R340/356, the ratio of F340 and F356) were expressed in proportion to the maximal rise in R, which is obtained in pCa 2 solution containing KCl (80 mmol/L) and ionomycin (10 H-mol/L) [namely, as (R − Rmin)/(Rmax − Rmin)]. Values shown are the means ± SD (n = 6). Asterisks indicate significant differences between the control and spastic (SAH) groups in the absence of ionomycin
In the normal arteries, treatment with ionomycin (10 μmol/L) elevated the [Ca2+]i signal curve and shifted it leftward (p < 0.0025 at pCa 7, 0.025 at pCa 6 and 5, 0.005 at pCa 4, 3, and 2; Fig. 1b). By contrast, in the spastic arteries, little change in the [Ca2+]i signal curve was observed after the treatment; no significant effect of ionomycin was observed at pCa 7 to 4, and a small increase in the signal was seen at pCa 3 and 2 (p < 0.025, Fig. 1c).
Estimate of absolute value of [Ca2+]i
Values of [Ca2+]i were estimated using the formula of Grynkiewicz et al. (1985). [Ca2+]i calculated in multiples of Kd was significantly larger in the spastic arteries than in the normal group (Fig. 2, p < 0.0005 at pCa 6, 5, 4, and 3, p < 0.005 at pCa 2).
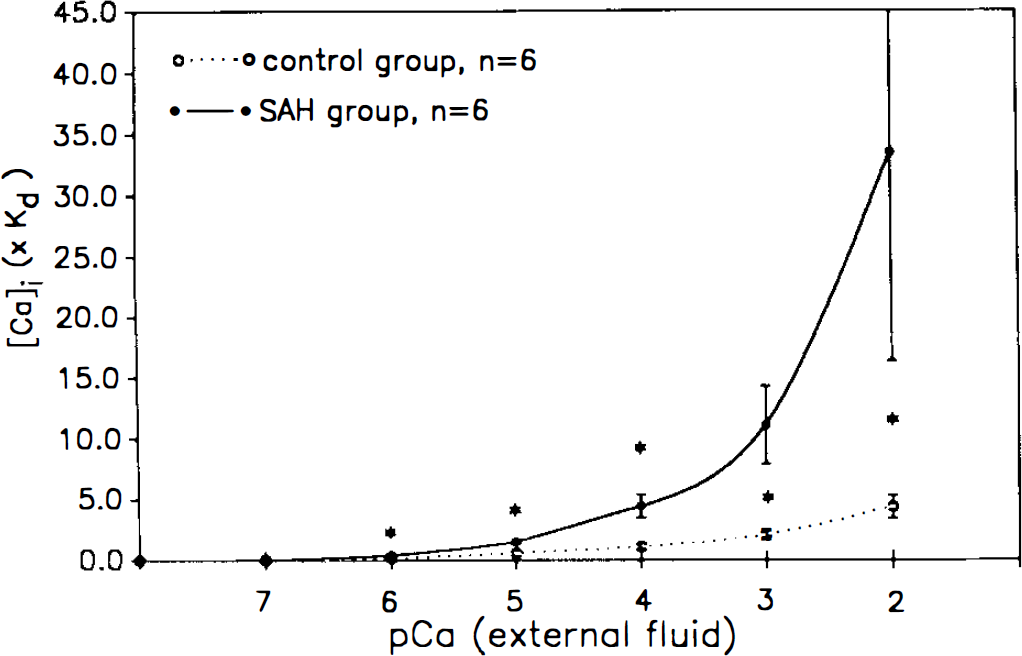
Intracellular calcium concentration ([Ca2+]i) expressed in multiples of dissociating constant (Kd). [Ca2+]i was calculated using the formula of Grynkiewicz et al., (1985) namely, [Ca2+]i = (R − Rmin)/(Rmax − R) × Kd × β, where R is the experimentally determined ratio Rs340/356. Kd is the dissociation constant of the Fura-2/Ca2+ complex. Data shown are the means ± SD (n = 6 in each group). Asterisks show [Ca2+]i was significantly higher in the spastic [subarachnoid hemorrhage (SAH)] group at pCa 6, 5, 4, 3, (p < 0.0005), and 2 (p < 0.005).
When a Kd value of 224 nmol/L was applied, [Ca2+]i in the control group was estimated to be 467 ± 101 nmol/L at pCa 3. [Ca2+]i of the spastic arteries thus calculated was 738 ± 237 nmol/L at pCa 3.
Effect of diltiazem
In the control group, treatment with diltiazem did not cause a shift in the [Ca2+]e vs. [Ca2+]i signal relationship (Fig. 3). The upwardly shifted curve of [Ca2+]i signal in the SAH group was partially shifted downward by treatment with the calcium channel blocker; a significant suppressing effect was observed at pCa 4 and 3. However, [Ca2+]i signal in the SAH group remained significantly larger than in the control group at pCa 7, 6, and 5 (Fig. 3).
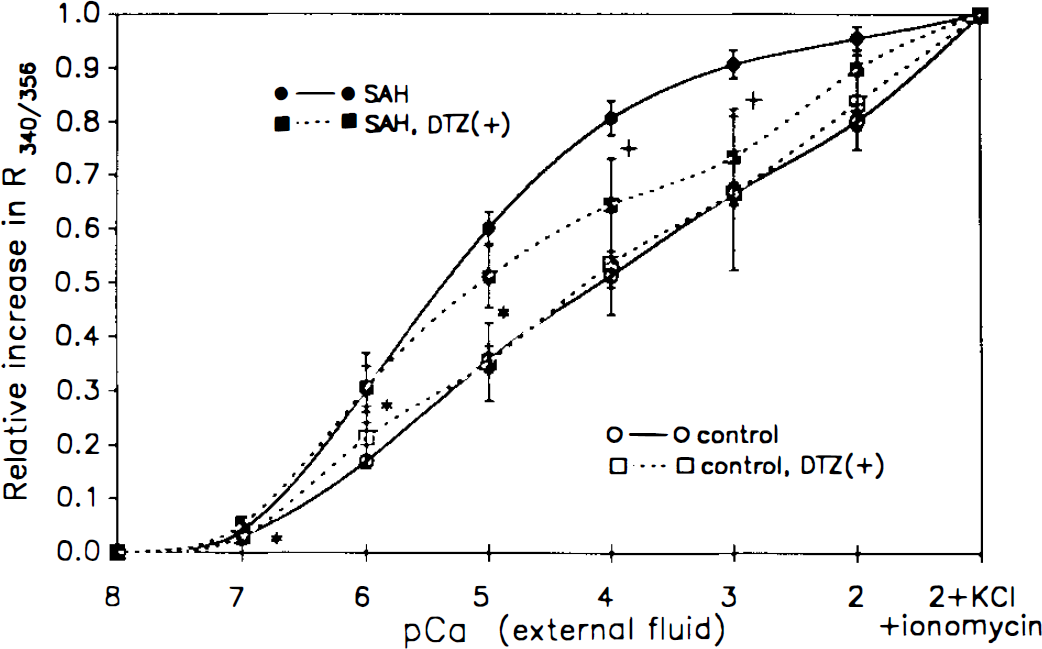
Intracellular calcium signal versus extracellular calcium concentration ([Ca2+]e) relationship and effect of the calcium channel blocker diltiazem (10−5 mol/L). Results from the control and spastic [subarachnoid hemorrhage (SAH)] arteries in the absence and presence [DTZ(+)] of diltiazem are shown. The increments in calcium signal were expressed as described in the legend to Fig. 1. Values shown are the means ± SD (n = 6). Asterisks indicate significant differences between the control and spastic (SAH) groups in the presence of diltiazem (p < 0.05 at pCa 7, 6, and 5, analysis of variance). Crosses indicate a significant effect of diltiazem in the spastic (SAH) group (p < 0.05 at pCa 4 and 3, analysis of variance). No significant effect of the calcium channel blocker was observed in the control group.
[Ca2+]e and development of myogenic tone
In the control group, myogenic tone started to develop at pCa 4 ([Ca2+]e) and reached a plateau at pCa 2.5 (Fig. 4). In the spastic arteries, myogenic tone did not develop significantly until [Ca2+]e was increased to pCa 2, and the force at pCa 2 was significantly smaller than in the control group (Fig. 4).
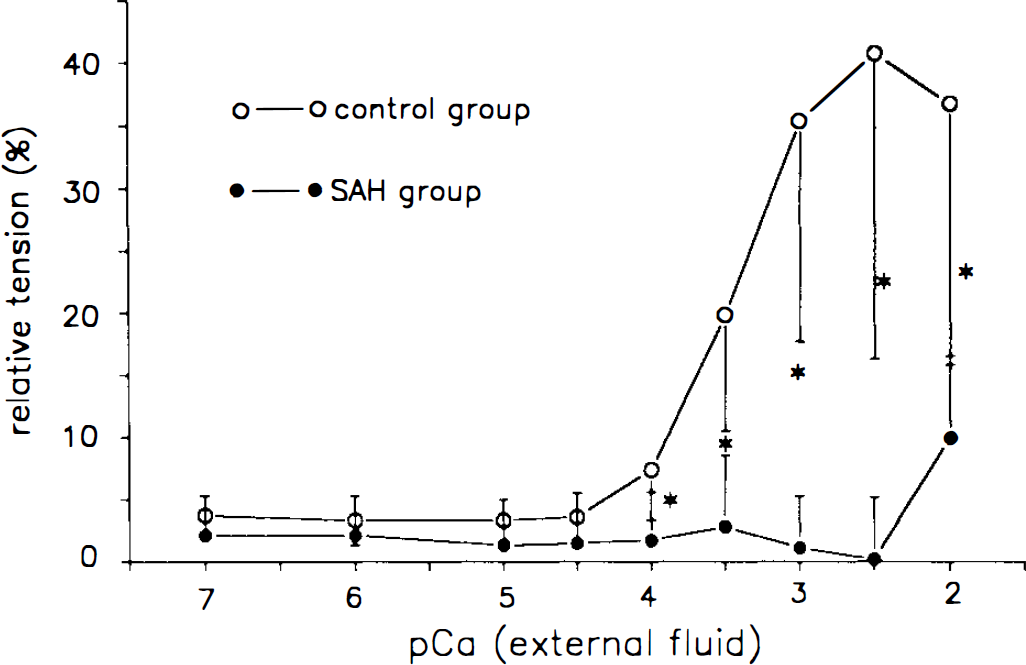
Development of myogenic tone in response to alteration of extracellular calcium concentration ([Ca2+]e) in the control and the spastic [subarachnoid hemorrhage (SAH)] arteries. The isometric force was expressed as the percentage of maximal tension elicited by 80 mmol/L KCl in each preparation. Data shown are the means ± SD (n = 6 in each group). Asterisks indicate significant differences between the two groups (p < 0.05, analysis of variance).
Effect of KCl stimulation on [Ca2+]i and tension
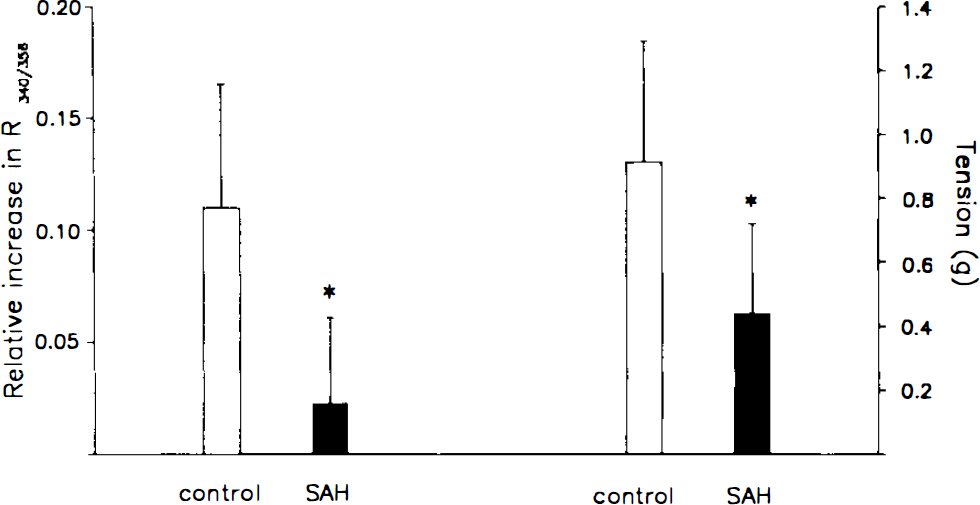
The rise in [Ca2+]i signal after 80 mmol/L KCl stimulation was significantly smaller in the spastic arteries than in the normal arteries (Fig. 5, left). Contraction after stimulation was also smaller in the spastic arteries (Fig. 5, right).
DISCUSSION
The present findings that Ca2+ regulation/homeostasis during chronic vasospasm is disturbed and previous findings that ATP and high energy phosphates are reduced during this condition suggest that chronic vasospasm of the cerebral artery is not a result of activation of physiological contractile mechanisms, but it is a phenomenon concomitant to injury of the smooth muscle cells.
Ca2+plays a pivotal role in the regulation of various cellular functions. A key event in the contraction of smooth muscle is the binding of Ca2+ to calmodulin, which in turn activates myosin light chain kinase, leading to the phosphorylation of myosin and subsequent actin-myosin interaction and contraction. In the present study, we focused on the regulation of [Ca2+]i in smooth muscle during chronic vasospasm. Our experimental protocol was designed to evaluate the capacity of smooth muscle cells to maintain homeostasis of [Ca2+]i, when [Ca2+]e is altered.
Values of [Ca2+]i were estimated using the formula of Grynkiewicz et al. (1985). Values calculated in multiples of Kd were significantly higher in the spastic arteries than in the control group. When a Kd value of 224 nmol/L (Grynkiewicz et al., 1985) was applied, [Ca2+]i in the control group was estimated to be 467 ± 101 nmol/L at pCa 3. [Ca2+]i of the spastic arteries thus calculated was 738 ± 237 nmol/L at pCa 3, significantly higher than in the control group (p < 0.025). The calculation and comparison between groups of arterial preparations are based on the following assumptions: (a) Loading of the dye, distribution of extracellular Ca2+ and EGT A, and the effect of ionophore are uniform throughout the multiple layers of smooth muscle in the arterial wall; and (b) the entire population of smooth muscle cells in the preparations behaves in a similar manner. In layered preparations such as the strips of basilar artery, these assumptions cannot be rigorously verified, especially when comparing pathological and normal groups. Therefore, we preferred to compare the curves of the [Ca2+]e vs. [Ca2+]i signal relationship in correlation with the effects of ionomycin, a calcium ionophore, in each group, rather than comparing the individual [Ca2+]i values. The method also allows safeguarding against the possibility that shift in the curve is caused by fluctuation in the smooth muscle volume.
The results thus obtained clearly demonstrated an alteration in Ca2+regulation/homeostasis in the spastic arteries, illustrated by a [Ca2+]e vs. [Ca2+]i curve that is elevated and shifted to the left. When the normal arteries of the control group were treated with ionomycin, the curve also became elevated and shifted leftward, approaching the curve observed in the spastic arteries. By contrast, and very interestingly, the treatment with ionomycin had little effect on the [Ca2+]e vs. [Ca2+]i curve in the spastic arteries. This finding suggests that a mechanism similar to that of the effect of ionomycin affects [Ca2+]i regulation in spastic arteries, causing increased Ca2+ permeability of the plasma membrane and disturbing regulation/homeostasis of [Ca2+]i.
Diltiazem (10−5 M) partially suppressed the augmentation of [Ca2+]i in the spastic arteries at the values of [Ca2+]e greater than pCa 4. The concentration of the calcium channel blocker was chosen to ensure sufficient effect of the agent both in the control and spastic arteries; it has been demonstrated that exposure to hemoglobin decreases efficacy of Ca2+ antagonists, and in our preliminary study, ED50 of diltiazem in the normal canine basilar artery was 3 × 10⁻⁵ M. Our present result suggests that the membrane potential is depolarized in the range of [Ca2+]e higher than pCa 4 and that the activation of a voltage-dependent channel contributes at least in part to the observed elevation in [Ca2+]i. By contrast, treatment with diltiazem does not affect the curve in the control group. At lower [Ca2+]e, diltiazem does not cause a significant suppression of the [Ca2+]i signal in spastic arteries; the [Ca2+]i signal remained significantly greater than that in the control group despite the treatment at pCa 7, 6, and 5. These data suggest that in this range of [Ca2+]e, the elevation in the [Ca2+]i was not predominantly due to activation of the Ca2+ channel. It may represent an increase in Ca2+permeability due to dysfunction of the plasma membrane; if membrane integrity is affected in the pathological condition as a result of metabolic failure, there can be a disruption of Ca2+homeostasis and further lipolysis can ensue (Siesjö, 1986).
As for the underlying mechanisms leading to the alteration of Ca2+ homeostasis, a diminished supply of ATP (Kim et al., 1992b; Yoshimoto et al., 1993) may be a contributing factor. Three major mechanisms of [Ca2+]i regulation, sarcolemmal Ca2+-transporting ATPase, Na+/Ca2+ exchanger (dependent on Na+ gradient maintained by Na+ K+-ATPase) and Ca2+-transporting ATPase on the sarcoplasmic reticulum, are all ATP dependent (Walsh, 1991). The total adenylate content as well as the ATP/ADP ratio are markedly reduced in the spastic arteries, with a temporal profile closely correlated with the time course of angiographical narrowing (Kim et al., 1992b; Yoshimoto et al., 1993). Cyclic GMP has been shown to lower intracellular free Ca2+levels by stimulating its extrusion via activation of Ca2+-ATPase (Itoh et al., 1985; Rashatwar et al., 1987) and by decreasing the influx of Ca2+ (Collins et al., 1986). In spastic cerebral arteries, the production of cyclic GMP is impaired (Edwards et al., 1992; Kim et al., 1992a), perhaps contributing to the observed alteration in the [Ca2+]e vs. [Ca2+]i relationship.
Conversely or reciprocally, impaired Ca2+ homeostasis may contribute to the reduction of high energy phosphates in the spastic artery. Excess cytoplasmic Ca2+ is sequestered in the mitochondria (Rasmussen and Waisman, 1983), where its accumulation causes a cessation of ATP production (Siesjö, 1986). A condition of calcium overload occurs when the influx exceeds the capacity of extrusion or sequestration, and it can lead into respiratory failure and eventual cell death (Siesjö, 1988).
In a study using a whole-cell voltage clamp in cultured smooth muscle cells, it was demonstrated that oxyhemoglobin causes contraction, an increase in the outward potassium current, a decrease in the membrane resistance, and eventual cell death (Steele et al., 1991). When xanthine and xanthine oxidase were utilized instead of oxyhemoglobin, the same effects were observed. These effects could be prevented by the use of catalase or the use of methemoglobin in the place of oxyhemoglobin. This suggests that they are due to the generation of oxygen free radicals. Following extravasation, oxyhemoglobin in the red blood cell becomes oxidized and converted to methemoglobin. If a significant amount of oxyhemoglobin remained unoxidized in the clot surrounding the cerebral artery 7 days after experimental SAH, it might have contributed to the increase in Ca2+ permeability observed in our study.
We used a fluorescent Ca2+ indicator, Fura-2, to monitor [Ca2+]i. Fura-2 is loaded in a membrane-permeable form, acetoxymethyl ester (Fura-2/AM), which is hydrolyzed by esterase in the cytoplasm, acquiring the capacity to bind Ca2+. During chronic vasospasm, a serious metabolic disturbance takes place in the arterial wall (Kim et al., 1992b; Yoshimoto et al., 1993). Cytological alterations in the pathological arteries may cause impairment of uptake, conversion/activation, and containment of the dye. Affected cells may have altered membrane permeability, allowing leakage of Fura-2 from the cytoplasm. In fact, preliminary experiments that measured decay of fluorescence at the isosbestic point (F356) indicated a trend of greater leakage in the spastic arteries than in the control group. The difference was not statistically significant over a period of 30 min, but when measurement was extended to 60 min, the decay was greater in the spastic group. When F340 and F380 are monitored, alterations in [Ca2+]i result in changes of F340 and F380 that are opposed (“mirror image” response). However, the amount of Fura-2 in the cells is best represented at the isosbestic point. Therefore, we used F356 instead of F380 to calibrate rigorously for variations in the dye concentration.
Morphological changes are known to occur in the adventitial layer and the intimal layer of spastic cerebral arteries. Changes such as infiltration by inflammatory cells of the adventitia and damage of endothelial cells (Hughes and Schianchi, 1978; Tanabe et al., 1978; Peterson et al., 1990) may affect the measurement if it is done through these layers. Because of this concern, fluorescence was monitored on the intimal side of the medial layer after meticulous removal of the endothelium.
Takanashi et al. (1992) quantified [Ca2+]i using Fura-2 in cultured smooth muscle cells and reported an increase in [Ca2+]i after treatment with oxyhemoglobin for 3–7 days. They calculated [Ca2+]i using the formula of Grynkiewicz et al. (1985). Despite the difference in experimental material and method of assessment, their result is consistent with our observation that Ca2+ permeability increases in the actual cerebral artery during chronic spasm after SAH.
The generation of myogenic contraction in response to a rise in [Ca2+]e is significantly smaller in the spastic arteries despite the leftward shift in the [Ca2+]e vs. [Ca2+]i curve. It has been demonstrated that maximum contractility decreases in spastic arteries (Kim et al., 1989). The present results clearly show that this decreased contractility is not caused by decreased availability of sarcoplasmic Ca2+. The changes in contractility may be secondary to metabolic failure in the pathological condition. Diminished contents of ATP in the vasculature can lead to a decrease in available ATP needed as substrate for the actomyosin system. Cascades of protein phosphorylation subsequent to an increase in [Ca2+]i may be impaired. The decrease in high energy phosphates lasting for days may result in a decrease in protein synthesis and turnover, affecting the supply of regulatory and contractile proteins. In fact, alteration/degeneration of cytoplasmic proteins during chronic vasospasm has been reported (Minami et al., 1993).
The increase in [Ca2+]i caused by high K+ stimulation was smaller in the spastic arteries. The response in the group may have been offset by the preexisting activation of a voltage-dependent channel. Contraction due to KCl stimulation was also smaller in the spastic arteries. This finding agrees with previous observations of diminished contractility of cerebral arteries after SAH (Bevan et al., 1987; Kim et al., 1989). Mechanical compliance of the arterial wall is decreased during chronic vasospasm (Kim et al., 1989). If the regulation of the contractile system is offset due to the disturbance of Ca2+ regulation, that may contribute to the impairment of active contraction and reduction of mechanical compliance.