
Abstract
A novel temporal correlation technique was used to map the first-pass transit of iodinated contrast agents through the brain. Transit profiles after bolus injections were measured with dynamic computed tomography (CT) scanning (1 image/s over 50 s). A rabbit model of focal cerebral ischemia (n = 6) was used, and dynamic CT scans were performed at 30, 60, 90, and 120 min postocclusion. Within the ischemic core, no bolus transit was detectable, demonstrating that complete ischemia was present after arterial occlusion. In the periphery of the ischemic distribution, transit dynamics showed smaller peaks, broadened profiles, and overall delay in bolus transit. A cross-correlation method was used to generate maps of delays in ischemic transit profiles compared with normal transit profiles from the contralateral hemisphere. These maps showed that penumbral regions surrounding the ischemic core had significantly delayed bolus transit profiles. Enlargement of the ischemic core over time (from 30 to 120 min postocclusion) was primarily accomplished by the progressive deterioration of the penumbral regions. These results suggest that (a) temporal correlation methods can define regions of abnormal perfusion in focal cerebral ischemia, (b) peripheral regions of focal cerebral ischemia are characterized by delays in bolus transit profiles, and (c) these regions of bolus transit delay deteriorate over time and thus represent a hemodynamic penumbra.
The majority of functional imaging techniques, including ultrafast magnetic resonance imaging and computed tomography (CT), are based on dynamic scanning protocols that monitor the first-pass transit of injected boluses of contrast agents through the brain (Axel, 1980; Berninger et al., 1981; Norman et al., 1981; Rosen et al., 1994; Fischman et al., 1995). Based on traditional Stewart–Hamilton kinetics (Zierler, 1962), one can calculate perfusion-dependent parameters, including relative blood volume and blood flow indexes, from the concentration–time curves of the first-pass transit of injected contrast agents. Although absolute calculations for heterogeneous tissue may be theoretically difficult to achieve (Weisskoff et al., 1993), these approaches can at least provide relative measures of cerebral perfusion.
It has been shown that ultrafast functional imaging can be used to map perfusion deficits in cerebral ischemia (Matthews et al., 1992; Rosen et al., 1994). In principle, the integrated areas under the first-pass concentration–time curves are proportional to blood volume, and the areas divided by mean transit times reveal a relative blood flow index (Zierler, 1962; Axel, 1980). However, in addition to discrete reductions in perfusion, more subtle alterations in perfusion dynamics may also occur in cerebral ischemia. For example, it has been shown that even in areas with apparently normal blood volume and flow indexes, significant alterations in the shape of the bolus transit profile may be present (Roberts et al., 1993). These include broadening of the bolus profile and delays in peak arrival times. It has been hypothesized that these temporal changes may represent sluggish flow and/or collateral supply in the face of abnormal perfusion pressures (Roberts et al., 1993). Therefore, it is possible that alterations in bolus transit dynamics may provide a more sensitive marker for ischemic perturbations than gross reductions in blood volume or flow rates per se. Such alterations may be especially important in the ischemic penumbra (Roberts et al., 1993).
In this report, we describe the use of a novel temporal correlation technique for analyzing the temporal changes in bolus transit dynamics in focal cerebral ischemia. We have previously shown that temporal correlation methods can be used to analyze functional images of the brain (Rogowska et al., 1992, 1994, 1995; Rogowska and Wolf, 1992). We test the hypothesis that our method can define ischemic perturbations based on delays in bolus transit times. We aim to show that a “hemodynamic penumbra” is present in the periphery of a focal ischemic insult. This hemodynamic penumbra can be defined as a region where perfusion deficits are moderate but bolus transit times are delayed. Our experiments were designed to map these regions of bolus transit delay, document their evolution over time, and compare these maps to histological outcomes of ischemic tissue damage.
METHODS AND MATERIALS
Animal model
A previously described rabbit model of focal cerebral ischemia was used (Lo and Steinberg, 1992; Lo et al., 1993, 1994b). Briefly, ischemia was induced in male New Zealand White rabbits (3–3.5 kg) by electrocoagulation of the middle cerebral artery via a transorbital approach. The internal carotid and anterior cerebral arteries were also coagulated to achieve consistent ischemia. Rabbits were anesthetized with halothane (1–2%) and artificially ventilated with an air/oxygen (5:1) mixture. Arterial blood pressure, pH, and gases were monitored and maintained within normal limits. Rectal temperature was monitored with a temperature probe and maintained at 37–38°C with a heat lamp.
Dynamic CT
Dynamic CT scanning (150 mA, 120 kV) was performed with a Toshiba TCT-900S/X system (Toshiba Medical Systems, Tokyo, Japan). Based on sagittal scout images and guided by the location of the craniectomy, a single coronal slice was selected to encompass the middle cerebral artery territory (see Fig. 1). Pixel sizes were 0.15 × 0.15 mm for each 2-mm-thick coronal slice. Dynamic images were collected at a rate of 1 image/s. For each study, a baseline of 10 images was obtained followed by a bolus injection of iodinated contrast agent (1.2 ml/kg Omnipaque; Sterling-Winthrop) via the femoral vein. A total of 50 images were collected for each dynamic study. Each rabbit was scanned at 30, 60, 90, and 120 min postocclusion.
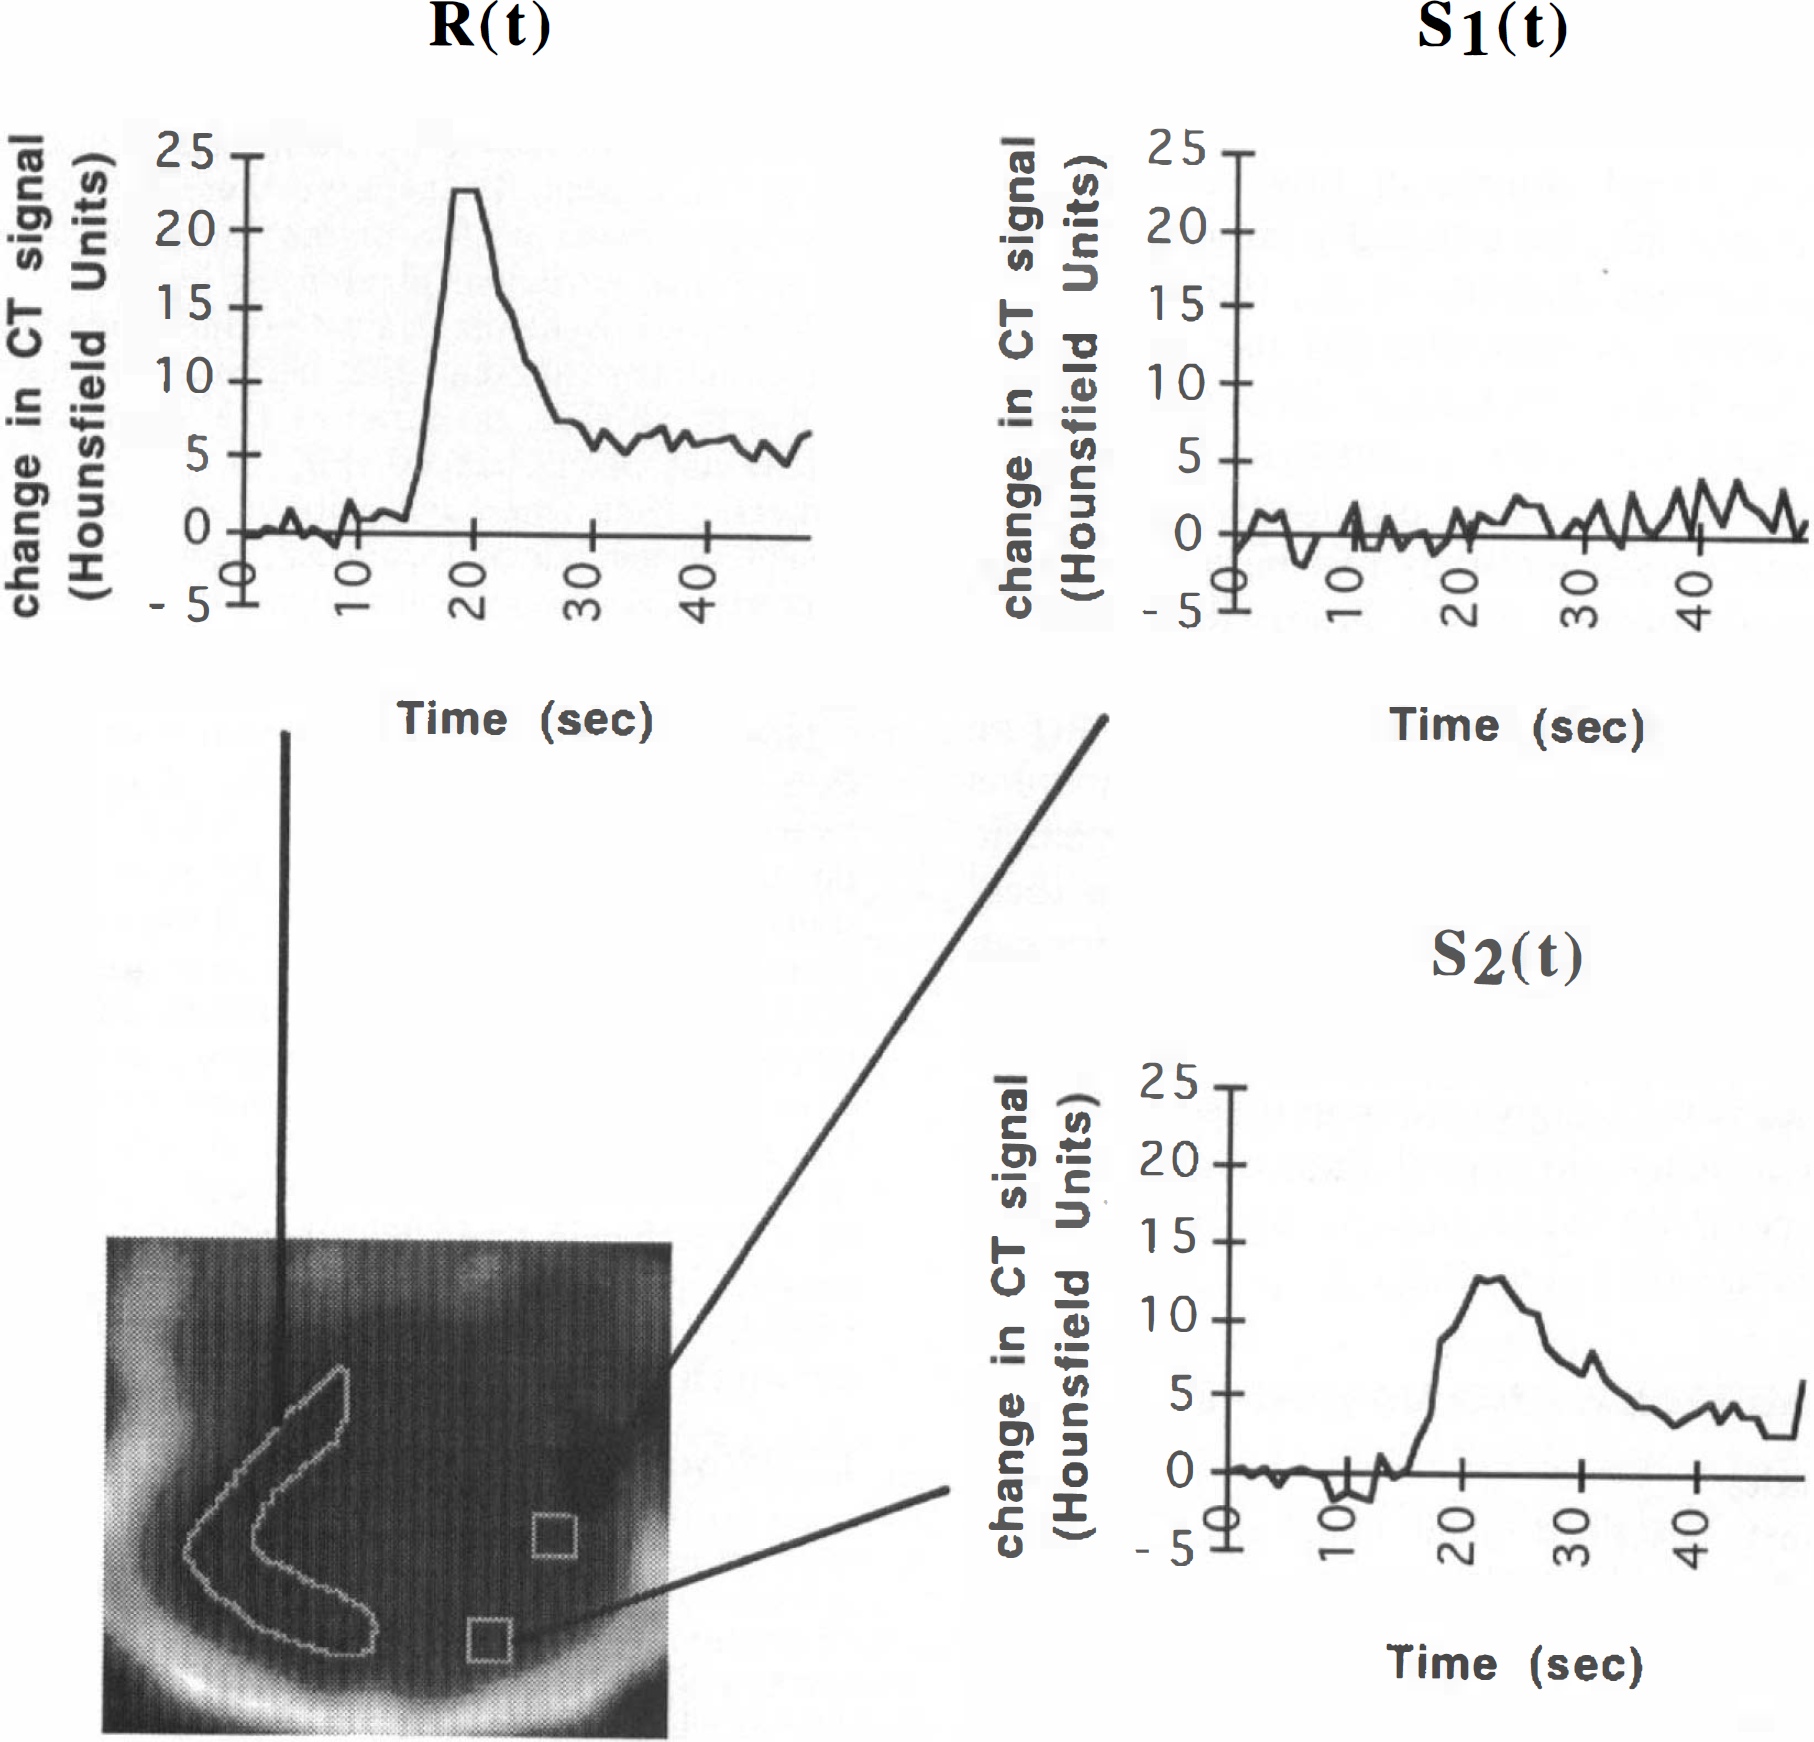
A schematic showing the selection of the reference region of interest that is drawn to encompass the cortical areas of the contralateral hemisphere. The reference transit profile R(t) is obtained from this region. Transit profiles in the ischemic side are different from the reference profile because they are either absent (i.e., no bolus transit is detectable) or bolus transit is delayed so that the shape is changed. Two examples are shown in this figure: S1(t), where no bolus transit is detectable, and S2(t), where bolus transit is delayed. Note that computed tomography (CT) scans are obtained with rabbits in a supine position so that all images are shown with the dorsal surface of the brain on the bottom.
Temporal correlation analysis
Dynamic CT data were plotted as signal intensity versus time curves for each pixel within the brain. CT signal intensity is measured using standard Hounsfield units. During baseline, the curve is flat. When the bolus of contrast agent arrives in the brain, signal intensity goes up. When the bolus leaves the brain, signal intensity comes back down again. Each curve therefore represents the first-pass transit profile of the injected contrast agent through that particular pixel in the brain.
After focal ischemia, transit profiles from the ischemic hemisphere are altered either because they have no bolus transit at all (i.e., no flow) or the shape of the transit profile has been changed (Fig. 1). In the center of the ischemic insult where perfusion is almost zero, first-pass transit of the injected contrast agent will be basically eliminated. In peripheral regions surrounding the core, flow is not zero but transit profiles are altered because they are delayed (Fig. 1).
Normal transit profiles are drawn from a reference region within the contralateral cortex (Fig. 1). Delays between ischemic versus normal transit profiles are obtained by calculating the delay between peaks in bolus transit from each pixel and that of the contralateral reference profile. The normalized cross-correlation function (CCOR) with the time lag Δt between transit profile S(t) from each pixel versus the reference profile R(t) from the contralateral hemisphere is computed for various time lags ranging from 0 to 6 s. We chose a maximum time lag of 6 s because our pilot data showed that no transit profiles in ischemic brain had delays of >6 s. The delay between peak arrival time in each pixel and that of the reference profile is defined as the value of the time lag Δt for which the cross-correlation
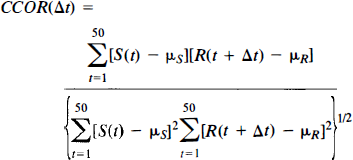
has a maximum. μ S and μ R are the mean values of S(t) and R(t), respectively.
CCOR will have values ranging from −1 to 1. To obtain statistical thresholds for the calculated correlation coefficients, we assumed that CT noise was normal and derived a t statistic for each cross-correlation coefficient. Each dynamic scan generated 50 images (over 50 s) resulting in 48 df. Seven cross-correlations were used for each delay map to range from 0 (no delay in peak arrival versus reference) to 6 s, each of which could be “significant.” To have an overall chance of ≤0.05 of at least one significant cross-correlation (assuming the null hypothesis of no correlation at all), we set the p value for each cross-correlation at 1 — (1 — 0.05)1/7 = 0.0073. From the t statistics, p < 0.0073 corresponds to a threshold of CCOR of >0.345. Therefore, only cross-correlations of ≥0.345 are used for the delay calculations.
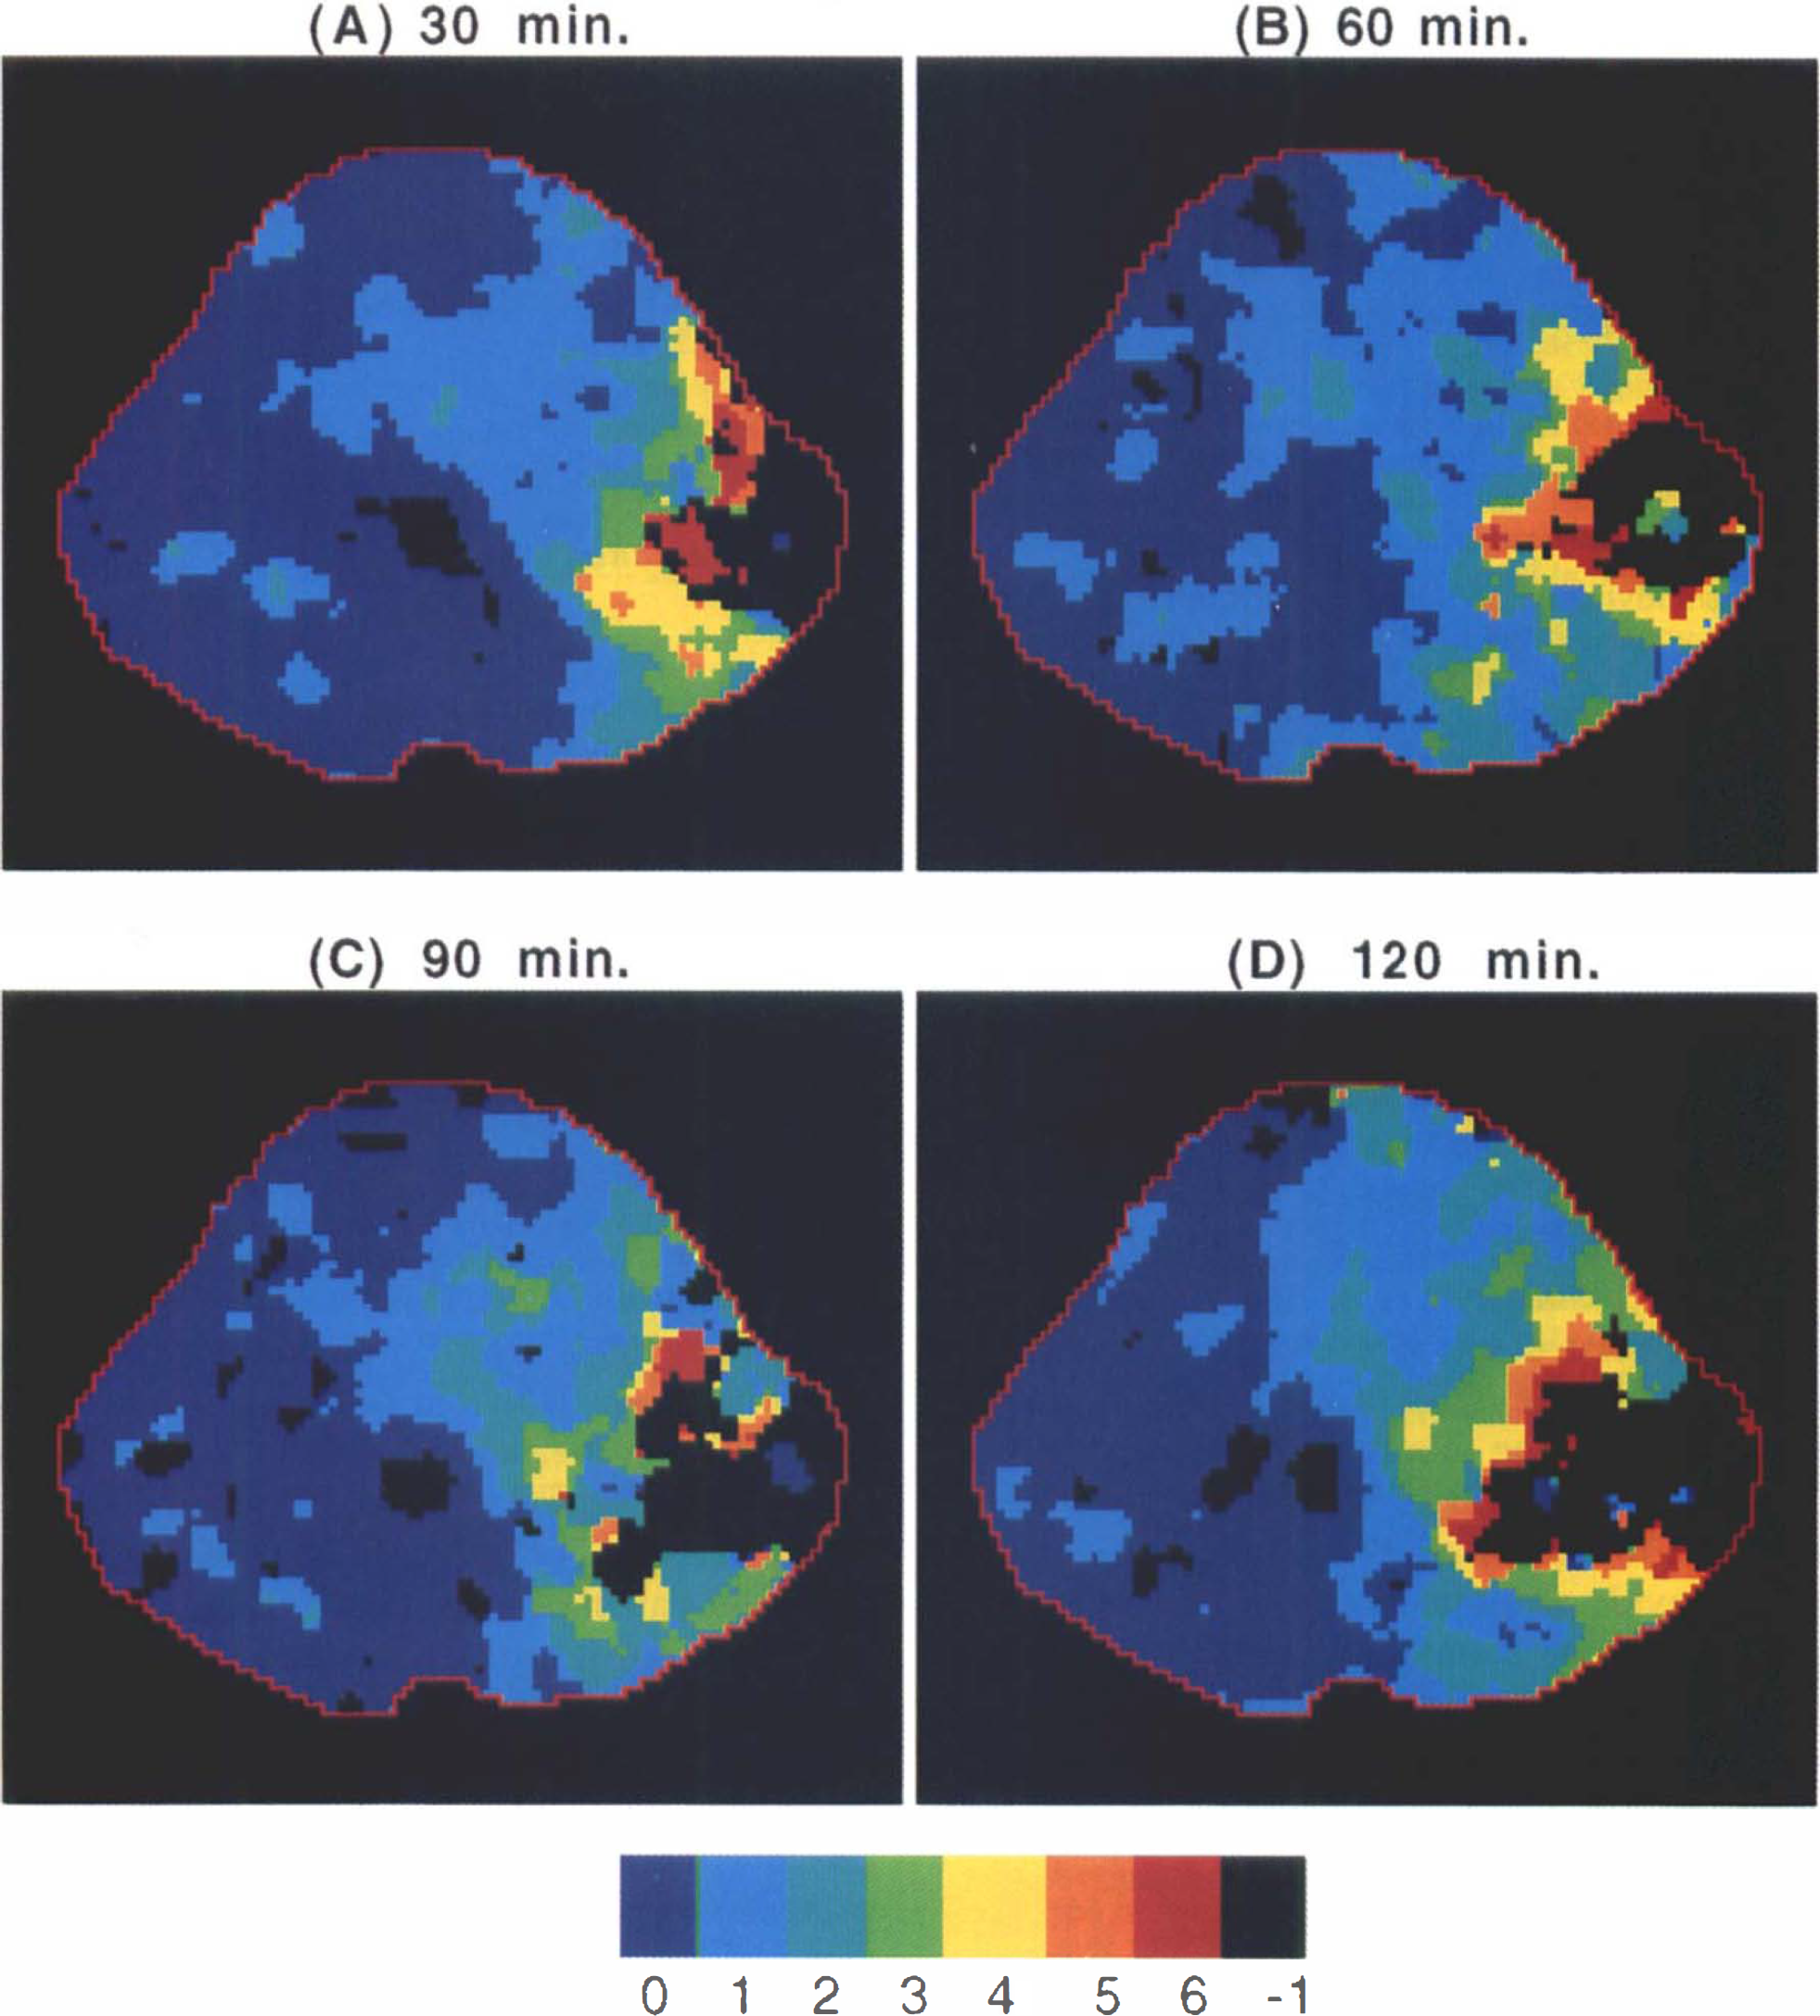
Based on these pixel-by-pixel calculations, a parametric delay map is constructed. In the ischemic core, where no significant cross-correlations are obtained, pixels are given the value — 1. All other pixels are given values equal to the time of bolus transit delay (in seconds). Since our dynamic CT scans are collected at a rate of 1 image/s, we cannot be certain that regions with bolus delays of 1 s are actually different from regions with no delay at all. To be conservative, we choose our cutoff as twice the sampling rate. Hence, ischemic core is defined as regions with no detectable bolus transit profile, and the hemodynamic penumbra is defined as regions surrounding the core with delays of ≥3 s.
Calculation of perfusion index
To obtain a “perfusion index,” bolus transit profiles from various brain regions (core, penumbra, normal) were fitted with γ-variate functions (Hamberg et al., 1993). The integral (area under curve) of these γ-variate fits was then calculated to assess relative blood volume (Hamberg et al., 1993). These measurements of relative blood volume were normalized with respect to values from the contralateral hemisphere and used as an index to assess “perfusion” deficits in the various brain regions analyzed (Hamberg et al., 1993; Roberts et al., 1993). As explained already, we can only reliably differentiate delays of at least twice the sampling rate (1 image/s). Therefore, the various regions of delay are grouped into 2-s intervals. Analysis is performed on core, 1- to 2-, 3- to 4-, and 5- to 6-s delay regions.
Histological outcomes
After the final CT scan at 120 min postocclusion, rabbits were removed from the scanner and maintained under halothane anesthesia for an additional 2 h. The rabbits were then killed after 4 h postocclusion to assess the histological outcomes of ischemia. The brains were removed, cut into 2-mm-thick coronal slices, and stained with 2% 2,3,5-triphenyltetrazolium chloride (TTC). After immersion in TTC for at least 30 min, brains were fixed in formalin. Areas of ischemic damage were defined as regions that lacked the typical brick red staining of normal tissue. Since dynamic CT offers only single slice data, a single corresponding histological slice was selected for comparison with the CT analysis. This slice was selected based on a stereotaxic rabbit brain atlas (Girgis and Wang, 1988) to correspond with the CT slices. Lesion areas were quantified with computer-based image analysis and expressed as the percentage area of the ipsilateral hemisphere.
RESULTS
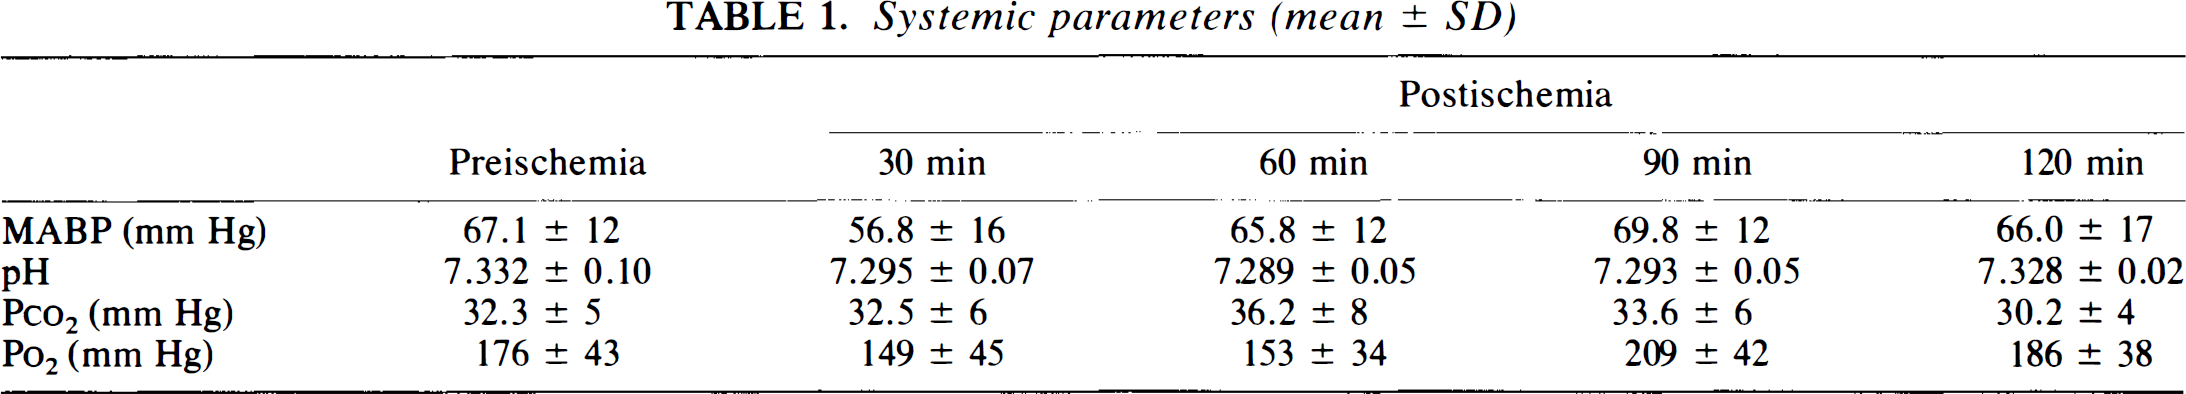
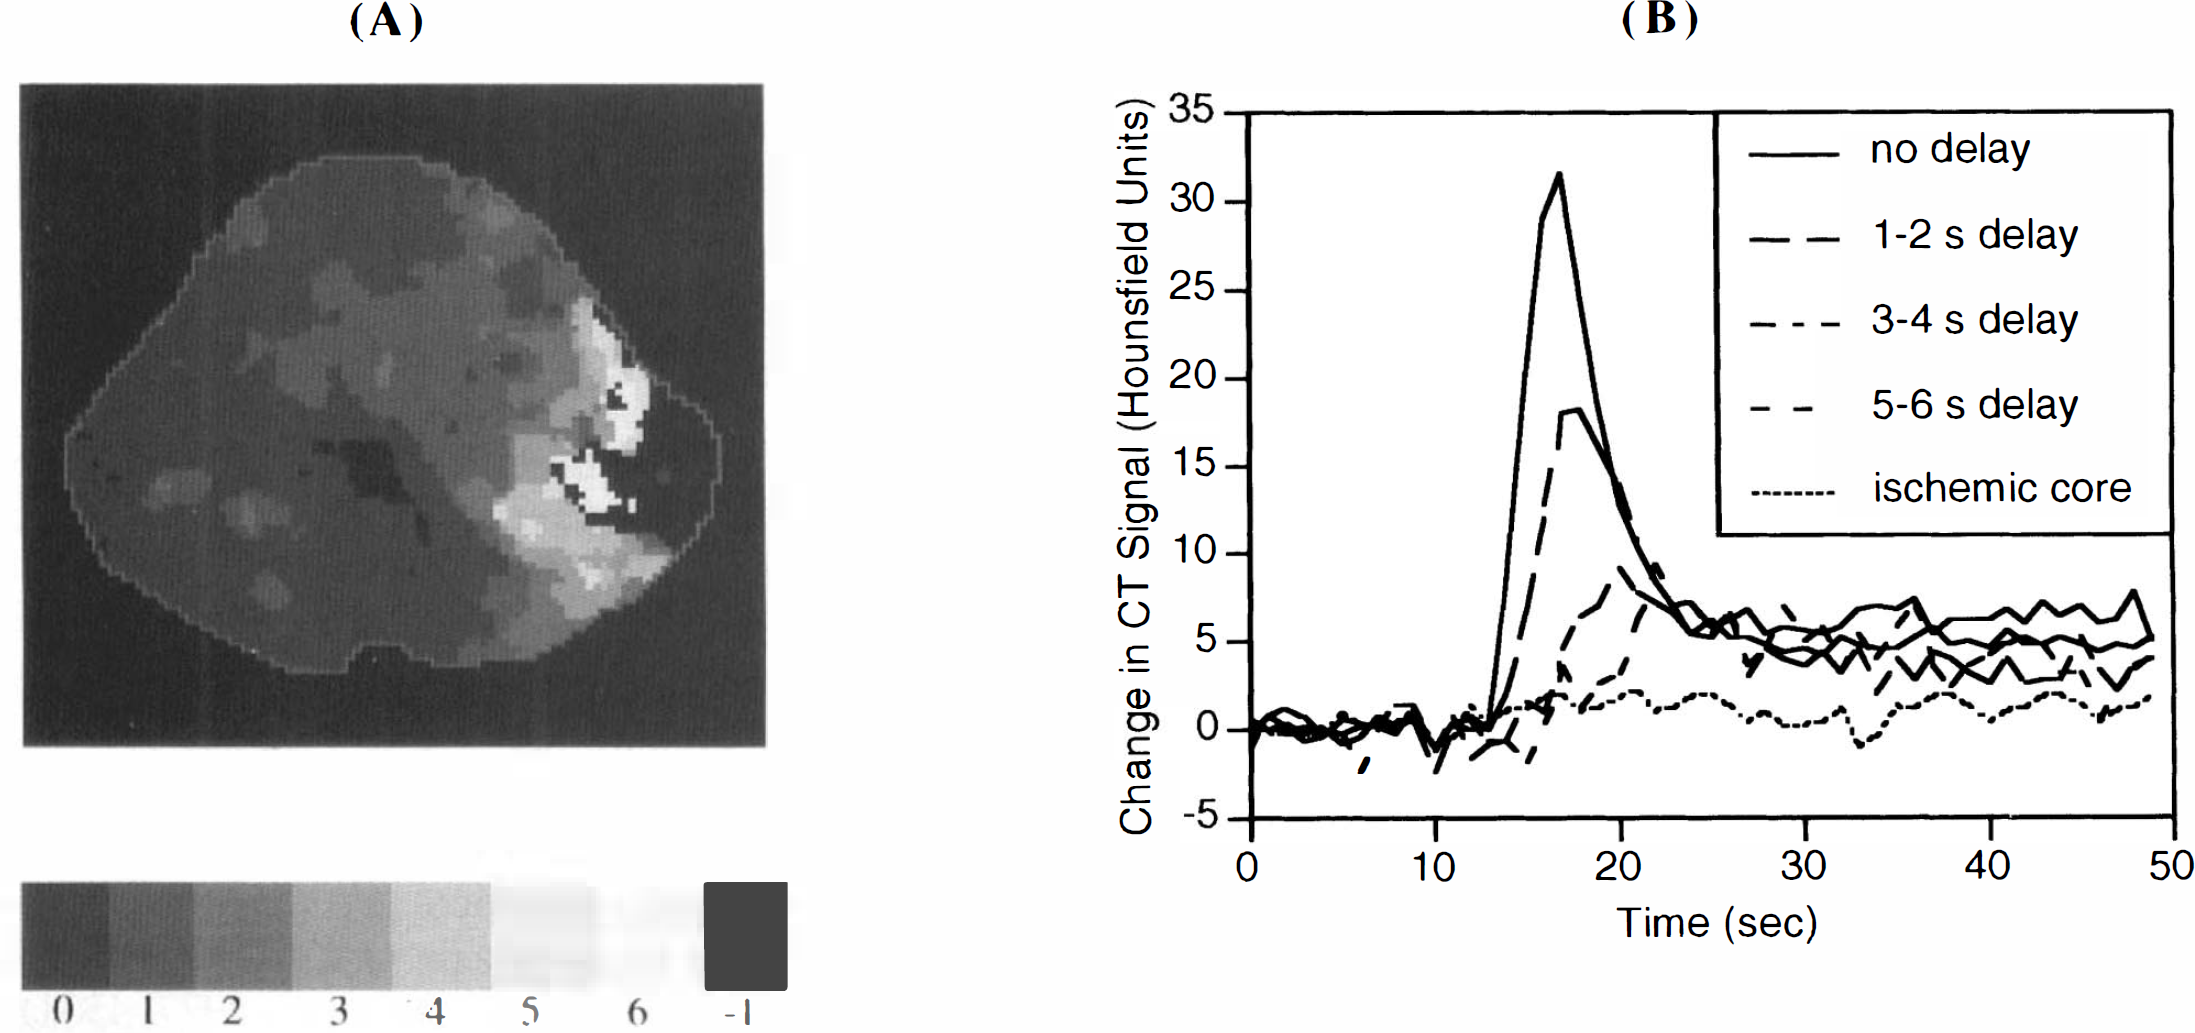
Systemic parameters were monitored and maintained during all experiments (Table 1). Delay maps showed that core regions of no-flow were surrounded by a hemodynamic penumbra where bolus transit profiles were delayed compared with normal transit profiles from the contralateral hemisphere (Fig. 2). In all six rabbits, these maps also showed an evolution of the ischemic lesion over time; the penumbra succumbed as the core expanded (Fig. 3).
Systemic parameters (mean ± SD)
The cerebral perfusion index in areas that showed no delays in bolus transit profiles remained stable over the course of the experiment. Regions with delays of 1–2 s showed some slight decline but were not significantly different from the regions with no delay at all (Fig. 4). Within the hemodynamic penumbra (defined as regions with bolus transit delays of ≥3 s), the perfusion index at 30 min was initially reduced to 40–70% of contralateral values. From 30 to 120 min postocclusion, perfusion in these penumbral regions continued to decrease, reflecting the deterioration of the penumbra and expansion of the ischemic core (Fig. 4). Overall, core areas with no-flow grew by 34% from 30 to 120 min postocclusion. Regions that were recruited in this evolution process were composed primarily of areas with high delay values compared with the distribution in normal brain that does not succumb over time (Fig. 5).
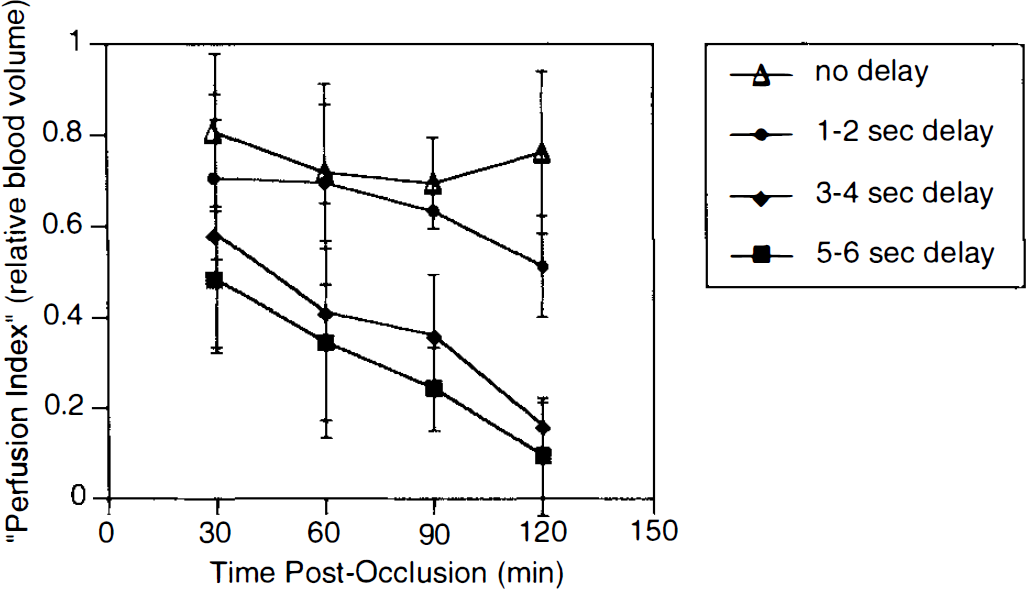
The hemodynamic penumbra deteriorates over time. Relative blood volume (area under curve) is calculated as a cerebral perfusion index. The data show that in the hemodynamic penumbra, perfusion is reduced to 40–70% of contralateral values at 30 min postocclusion. Perfusion in these penumbral regions progressively decreases from 30 to 120 min postocclusion as the penumbra deteriorates and ultimately becomes core. Perfusion in areas without bolus transit delay does not deteriorate. Mean ± SD, n = 6.
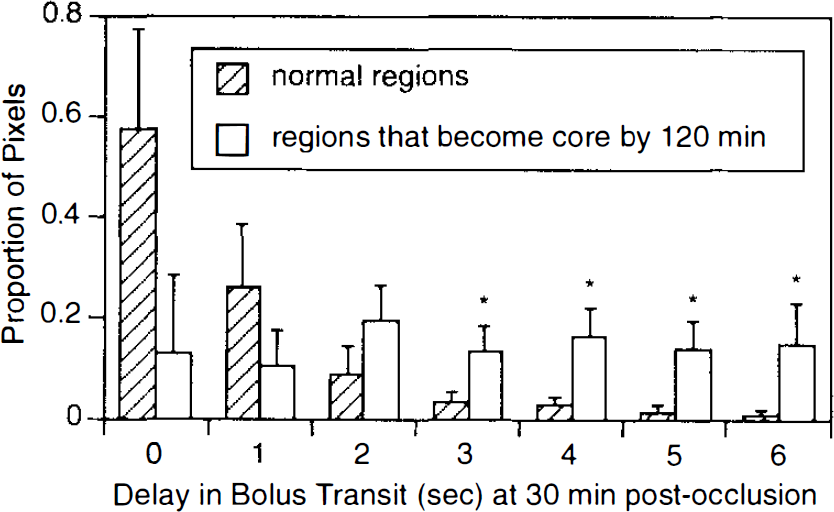
Quantitative analysis of the process of penumbral deterioration was performed by defining regions that were not core at 30 min but then proceeded to succumb and become core by 120 min postocclusion. Histogram distributions show that the regions that become converted into core between 30 and 120 min postocclusion are composed primarily of pixels with high delay values (3–6 s) at 30 min postocclusion. In comparison, brain regions that do not deteriorate from 30 to 120 min are composed primarily of regions without significant bolus transit delays. Mean ± SD, n = 6; *p < 0.05 for significant differences between the two histogram distributions via analysis of variance with Scheffé's test.
After 4 h of focal ischemia, TTC-stained histological slices showed the typical distribution of ischemic damage expected with this model, encompassing the basal ganglia and frontal and temporal cortex. The average TTC lesion area at the slice of CT analysis involved 51 ± 11% of the ipsilateral side. Delay maps at 2 h showed smaller areas of no-flow core (33 ± 12%). This demonstrated that the ischemic lesion continued to grow from 2 to 4 h postocclusion. However, comparison of the TTC lesion sizes with the delay maps showed a trend whereby ischemic damage was inversely related with measurements of the hemodynamic penumbra (Fig. 6). Rabbits with relatively small penumbral areas and well developed cores at 2 h had the largest TTC lesions by 4 h postocclusion. Rabbits with relatively larger penumbral areas remaining at 2 h postocclusion had the smallest TTC lesions.
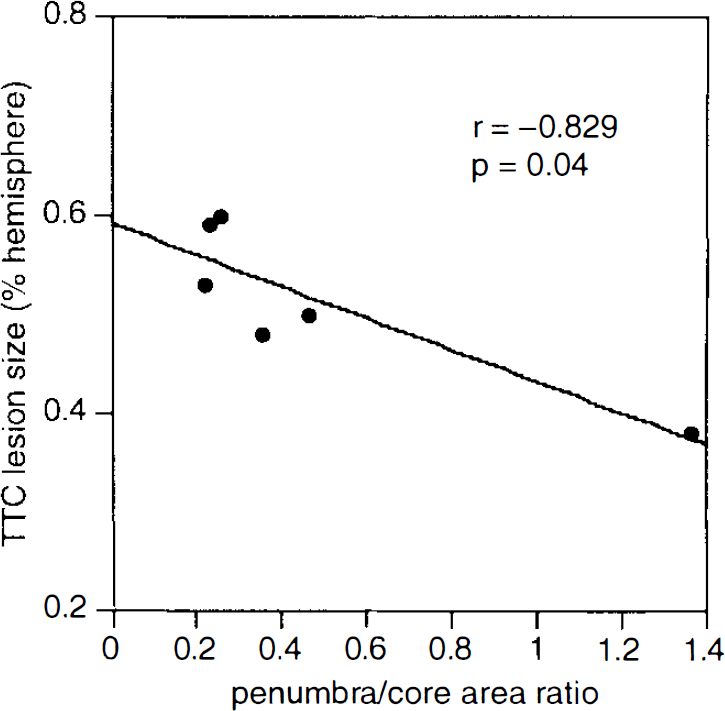
Linear regression analysis of the penumbra/core area ratios at 120 min versus 2,3,5-triphenyltetrazolium chloride (TTC) lesion sizes at 4 h postocclusion. Animals that still have relatively large penumbras at 2 h end up with the smaller lesions. In cases where the cores are well developed and relatively little penumbra is left at 2 h, the TTC lesions tended to be the largest. It is clear that the actual value of the regression slope is heavily influenced by a single animal with a small TTC lesion and large penumbra/core area ratio. Therefore, given the relatively limited number of animals used in this study, the relationship between lesion and penumbra size should be conservatively regarded as a trend at this point.
DISCUSSION
The penumbra can be defined as the peripheral region that surrounds the core of a focal ischemic insult. The precise distribution of the penumbra depends on the specific physiologic or pathophysiologic process being measured; i.e., there are different types of “penumbras.” The original electrophysiologic penumbra was first defined in the 1970s by Astrup, Symon, and colleagues as a region where spontaneous electrical activity was suppressed but ionic homeostasis and membrane potentials remained intact (Astrup et al., 1977, 1981). Since then, many other types of penumbra have been defined, including the blood flow penumbra (regions of moderately decreased flow) (Kaplan et al., 1991; Hakim et al., 1992; Tyson et al., 1984), the metabolic penumbra (regions of increased metabolism coupled with decreased flow and increased oxygen extraction fraction) (Baron et al., 1989; Mies et al., 1991; Heiss et al., 1994), the gene expression penumbra (regions where certain immediate early genes are selectively expressed) (An et al., 1993; Kinouchi et al., 1994), the histologic penumbra (regions with selective neuronal damage adjacent to fully infarcted areas) (Torvik and Svindland, 1986; Nedergaard, 1987), and the pharmacologic penumbra (regions where acute ischemic injury may be reversed via therapy) (Memezawa et al., 1992; Minematsu et al., 1993; Lo et al., 1994a).
In this report, we defined a new kind of penumbra in focal ischemia: the hemodynamic penumbra. The hemodynamic penumbra is based on changes in the temporal dynamics of blood flow (i.e., hemodynamics) rather than the absolute value of blood flow per se. It was defined using a novel technique developed in our laboratory. The technique is based on temporal correlation analysis of first-pass transit profiles of injected contrast agents. First-pass transit of contrast boluses through the brain is measured with fast CT scanning. In the ischemic core, no flow is present; therefore, no first-pass transit of the injected contrast bolus is detectable. Surrounding the core, the hemodynamic penumbra is defined as regions where first-pass bolus transit is not eliminated but delayed so that the shape of the bolus transit profile is different from that in normal brain. Our technique produces parametric maps that can be used to quantitatively image these regions. In this study, we demonstrated that (a) peripheral regions of focal ischemia were characterized by delays in bolus transit, (b) these regions of bolus delay deteriorated into no-flow regions over time (i.e., became core), and (c) ratios of no-flow versus delayed transit areas were well correlated with ischemic tissue outcomes measured with TTC staining.
The mechanisms that may underlie the delays in bolus transit within the ischemic periphery are presently unclear. In the ischemic core, the lack of flow is reflected by an absence of bolus transit altogether. However, it is possible that, in the face of decreased perfusion pressures, regions in the ischemic periphery are temporarily sustained via collateral supplies. Collateral routes of supply may take a longer time to reach the brain than normal and direct arterial routes, thus resulting in delays in bolus transit (Takahashi et al., 1983; Araki et al., 1987). Alternatively, these regions may also be subject to sluggish flow due to the regional loss of perfusion pressures (Symon, 1987). It has been shown that one of the first signs of cerebral ischemia is the development of “sluggish flow” as compensatory vasodilation reduces blood velocities (Powers, 1991). Sluggish flow may also be mediated by leukocyte adhesion and/or platelet accumulation processes (del Zoppo, 1994), although the relatively early time course of the events documented in the present study may make these factors rather unlikely. Regardless of the actual mechanisms involved, we have shown that peripheral regions of ischemia are defined by bolus transit delays. We believe that these regions comprise hemodynamically challenged brain that is distinct from no-flow regions in the ischemic core. As such, these areas represent a hemodynamic penumbra in focal cerebral ischemia.
Relative perfusion deficits in the hemodynamic penumbra are initially moderate (∼40–70% of baseline levels at 30 min). However, these regions deteriorate over time and are mostly converted into no-flow core areas by 2 h postocclusion. A large literature in different animal models of cerebral ischemia suggests that thresholds for loss of electrical activity, Na/K gradients, Ca homeostasis, and cellular ATP may be much lower (15–20%) (Heiss, 1992). It is, however, important to recognize that these thresholds may differ for different time periods of observation. Hence, more moderate ischemic deficits over long periods of time may account for similar ischemic injury as more severe ischemia over shorter periods of time (Jones et al., 1981). A more precise comparison of flow thresholds with our delay maps was not possible since we did not measure absolute blood flow.
There were several limitations to the present study. First, blood flow measurements with traditional techniques (e.g., microspheres, autoradiography, etc.) were not performed. However, our primary purpose was not to compare perfusion indexes with absolute blood flow numbers, but rather to apply a new method for defining the hemodynamic penumbra based on bolus transit dynamics. Furthermore, the relative perfusion deficits observed in this study matched previous measurements in this model using laser Doppler flowmetry and radioactive microspheres (Lo and Steinberg, 1991; Steinberg et al., 1991). Second, the final delay maps were obtained at 2 h postischemia, whereas histological tissue damage was assessed at 4 h. This was because 4–6 h postischemia is the earliest time-point before reliable results can be obtained with TTC staining (Kucharczyk et al., 1991; Nishikawa et al., 1993; Roberts et al., 1993). Our results, however, show that the severity of final tissue damage can be predicted by the relative areas of penumbra versus core that remain by 2 h postocclusion. It is also important to note that, even at 4 h, TTC measurements provide assessments of only acute ischemic injury and not completed infarction per se. This approach has been successfully used by other labs in various models of acute focal ischemia (Kucharczyk et al., 1991; Nishikawa et al., 1993; Roberts et al., 1993). Third, our method cannot distinguish between delays in bolus arrival times per se and delays in the time it takes for the bolus to pass through the region of analysis once it gets there (Axel, 1980). The temporal correlation technique can only calculate the overall delay in the peak of the bolus transit profile, thus including the effects of both delay components. However, this may not be a significant limitation since it is unlikely that one form of transit delay will occur without the other (Nagata and Asano, 1990). Finally, our dynamic CT protocol can only measure perfusion deficits at a single slice. This limitation prevents us from analyzing volumetric ischemic injury.
In summary, we have applied a novel temporal correlation method to define perturbations in bolus transit dynamics using functional CT imaging. The data support the hypothesis that regions with delays in bolus transit may constitute a hemodynamic penumbra in focal cerebral ischemia. The method produces quantitative images that demonstrate the process of ischemic evolution and may therefore be useful for monitoring and defining areas at risk after cerebral ischemia. Ongoing studies in our laboratory explore the correlation between these hemodynamic penumbras and areas that can be rescued with therapy, i.e., the pharmacologic penumbra. If a good correspondence exists, this method may provide the ability to quantitatively visualize the penumbra and monitor stroke therapy in vivo. Since CT remains the first step in the majority of stroke diagnostic algorithms, the method described in this report will be of immediate relevance.
Footnotes
Acknowledgment:
The authors thank Drs. K. Batch-elder, S. Gazelle, E. Halpern, B. Hoop, and M. Moskowitz for many helpful discussions. The technical staff at our center assisted with the CT scanning protocols. This study was funded by grants from the Sterling-Winthrop Pharmaceutical Research Division, the Whitaker Foundation, and the National Science Foundation (ECS-9214839).