
Abstract
Background:
The aim of this study was to build a clinical decision support system (CDSS) in diabetic retinopathy (DR), based on type 2 diabetes mellitus (DM) patients.
Method:
We built a CDSS from a sample of 2,323 patients, divided into a training set of 1,212 patients, and a testing set of 1,111 patients. The CDSS is based on a fuzzy random forest, which is a set of fuzzy decision trees. A fuzzy decision tree is a hierarchical data structure that classifies a patient into several classes to some level, depending on the values that the patient presents in the attributes related to the DR risk factors. Each node of the tree is an attribute, and each branch of the node is related to a possible value of the attribute. The leaves of the tree link the patient to a particular class (DR, no DR).
Results:
A CDSS was built with 200 trees in the forest and three variables at each node. Accuracy of the CDSS was 80.76%, sensitivity was 80.67%, and specificity was 85.96%. Applied variables were current age, gender, DM duration and treatment, arterial hypertension, body mass index, HbA1c, estimated glomerular filtration rate, and microalbuminuria.
Discussion:
Some studies concluded that screening every 3 years was cost effective, but did not personalize risk factors. In this study, the random forest test using fuzzy rules permit us to build a personalized CDSS.
Conclusions:
We have developed a CDSS that can help in screening diabetic retinopathy programs, despite our results more testing is essential.
Introduction
Diabetes mellitus (DM) is a chronic disease that affects 382 million patients worldwide (2013 data) and is predicted to increase to as many as 592 million adults by 2035. 1 In Spain, we predict an incidence of over 3 million DM patients by 2030. 2 DM is one of the major causes of blindness in young adults around the world. 3
The most serious ocular complication of DM is diabetic retinopathy (DR). Prompt diagnosis is important through efficient screening. Our program uses a nonmydriatic fundus camera, which is very cost effective. 4 Since 2000, we have been rolling out a screening program for type 2 DM patients (T2DM) in our healthcare area [HCA], 5 –9 but we are only able to screen each patient on average every 2.5 years. 10 There are similar difficulties in other HCAs, therefore, in Spain with an established program, only 30% of patients can be screened each year. 11
Currently, there are two lines of study, one focusing on automatic image analysis and a second on the detection of personalized DR risk factors
Automatic analysis of the retina is based on computer vision techniques that detect the number, size, and shape of different kinds of lesions (microaneurysms, hemorrhages, and exudates). These techniques can be divided into two categories: those that use the classical procedure of feature extraction and classification 12 and those based on Convolution Neural Networks. 13 –16
The second study line attempts to assess DR risk by analyzing the information contained in the electronic health record of a patient, as proposed in this study. The usual procedure is to select a set of relevant attributes and, using a subset of the patients as a training set, automatically build some kind of classifier. In a previous work, 17 we used some categorical Machine Learning methods (regression, k-Nearest Neighbors, Decision Trees and Random Forests) to solve this classification problem (the results of that work are expanded upon in the present work thanks to the introduction of the fuzzification of numerical attributes). A very recent study 18 has used a type-2 fuzzy regression model to classify a small sample of 200 diabetic patients. In an initial test they considered only the analysis of high hemoglobin A1c levels (HbA1c) and yielded poor results; in a second test they considered the attributes HbA1c, fasting blood sugar, age at diagnosis, and blood pressure, which improved on the previous results but failed to be able to make good predictions in the case of patients who had suffered diabetes for a long time. Another work tried to combine classification models and neural networks, although again it included a very small set of patients. 19 Another example of a classification model based on a small number of patients 20 combined decision trees and case-based reasoning. A recent work 21 used the data of more than 1.4 million diabetics in the United States to build a Clinical Decision Support System (CDSS) for predicting DR.
After analyzing all the data of the electronic health record (EHR), including co-morbidity aspects, they report that the most relevant attributes are diabetic neuropathy, creatinine serum, blood urea nitrogen, glucose serum plasma, and hematocrit. A combination of several classification models based on logistic regression, neural networks, decision treestres, and random forests are considered, using data from over 300,000 patients. The authors suggest that it is possible to predict DR with 92.76% confidence using only the results of a routine blood test.
The aim of this study was to develop a CDSS that will help clinicians (family physicians, endocrinologists, and ophthalmologists) to estimate the risk that a DM patient would develop DR, to personalize a patient's screening needs and to schedule follow-up visits anytime in the following 3 years. To do that, we have attempted to build a CDSS using information available in the electronic medical record (EMR).
Materials and Methods
Design and sample
A prospective, population-based study of 15,811 Caucasian, T2DM patients was conducted from data collected between January 1, 2007 and December 31, 2016. This included 85.33% of T2DM patients of our HCA. Patients have been screened in our nonmydriatic fundus camera units (NMCU).
Sample size
To develop the CDSS, we randomized a sample of 2,323 patients from 15,811 screened at our NMCU, as not all of the 15,811 patients had all of their medical records registered in 2016. Standard methods using the Kolmogorov–Smirnov test were used to verify whether the variables follow a normal distribution. No differences between the populations were observed, giving a normal distribution and/or risk factors.
Screening technique
Screening was carried out with one 45° field retinography, centred on the fovea. If DR was diagnosed, the patient was sent to the Ophthalmology service at our hospital and another 2 retinographs of 45° were taken according to EURODIAB guidelines. 22 When a patient is diagnosed with DR, he does not return for screening by the NMCU.
In this study, DR is classified thus: (i) no-DR = no diabetic retinopathy, (ii) any-DR = level 20 or higher according to ETDRS. 23
We then studied the following risk factors for each patient as independent variables and selected those which are more significant for the CDSS model: Current age Gender Body mass index Duration of T2DM Treatment of T2DM Control of arterial hypertension HbA1c% Estimated glomerular filtration rate, calculated from plasma creatinine using chronic kidney disease epidemiology collaboration equation (CKD-EPI equation) Microalbuminuria
Inclusion criteria
Patients with T2DM diagnosed in their HCA.
Exclusion criteria
Patients with any other specific types of diabetes or gestational DM.
Ethical adherence
The study was carried out with the approval of the local Ethics Committee (approval no. 13-01-31/proj6) and in accordance with revised guidelines of the Declaration of Helsinki.
Statistical methods
Data evaluation and analysis was carried out using SPSS 22.0 statistical software package at a statistical significance of p < 0.05. Descriptive statistical analysis of quantitative data was made by determining mean, standard deviation, minimum and maximum values, and the 95% confidence interval. For qualitative data, we used the analysis of frequency and percentage in each category. Differences were examined using the two-tailed Student t-tests to compare two variables or the one-way ANOVA analysis of variance if we were comparing more than two variables. Inferential analysis for qualitative data was made by chi-squared table and the determination of the Fisher's test for quantitative data. Multivariate analysis was carried out using Cox's survival regression analysis.
Building CDSS
The information of the patients for the training set (on the 9 nine selected attributes) was used to automatically build a CDSS that computes a patient's patient's risk of developing DR. The system classifies a patient into one of two classes (with/without risk) and also provides a numerical degree of certainty in the prediction.
The CDSS is based on a fuzzy random forest (FRF). An FRF is a collection of fuzzy decision trees, in which each node corresponds to an attribute, each child of a node corresponds to a possible value of the attribute (or interval of values, in the case of numerical attributes), and each leaf of the tree corresponds to one of the two possible classes. When a patient is classified by a fuzzy decision tree, the branch of the tree that corresponds to the values of the attributes of the patient must be followed, until the corresponding leaf is found, and a prediction is made. Thus, each decision tree in the forest makes an individual prediction with a certain degree of certainty. The final prediction depends on the majority of predictions of the single trees.
The method used to develop the FRF is adapted from Yuan and Shaw. 24 Briefly, each of the trees is built in the following way: 2/3 of the patients are selected randomly for the training set. tThe information about those patients is used to build a decision tree, iterating the following steps:
Select randomly a small set of the remaining attributes.
Check which attribute of that set discriminates better between the two classes.
Make a node with that attribute, with as many children values as possible. For each child, repeat the same process with all the remaining attributes and the training examples which that have that attribute value (unless most of the examples already belong to a class, in which case, put a leaf in the tree with a prediction of that class).
The final step of the process, as shown in Figure 1, is the assessment of the accuracy of the obtained FRF through the prediction of the class of the patients in the testing set. This evaluation is explained in the Results section.
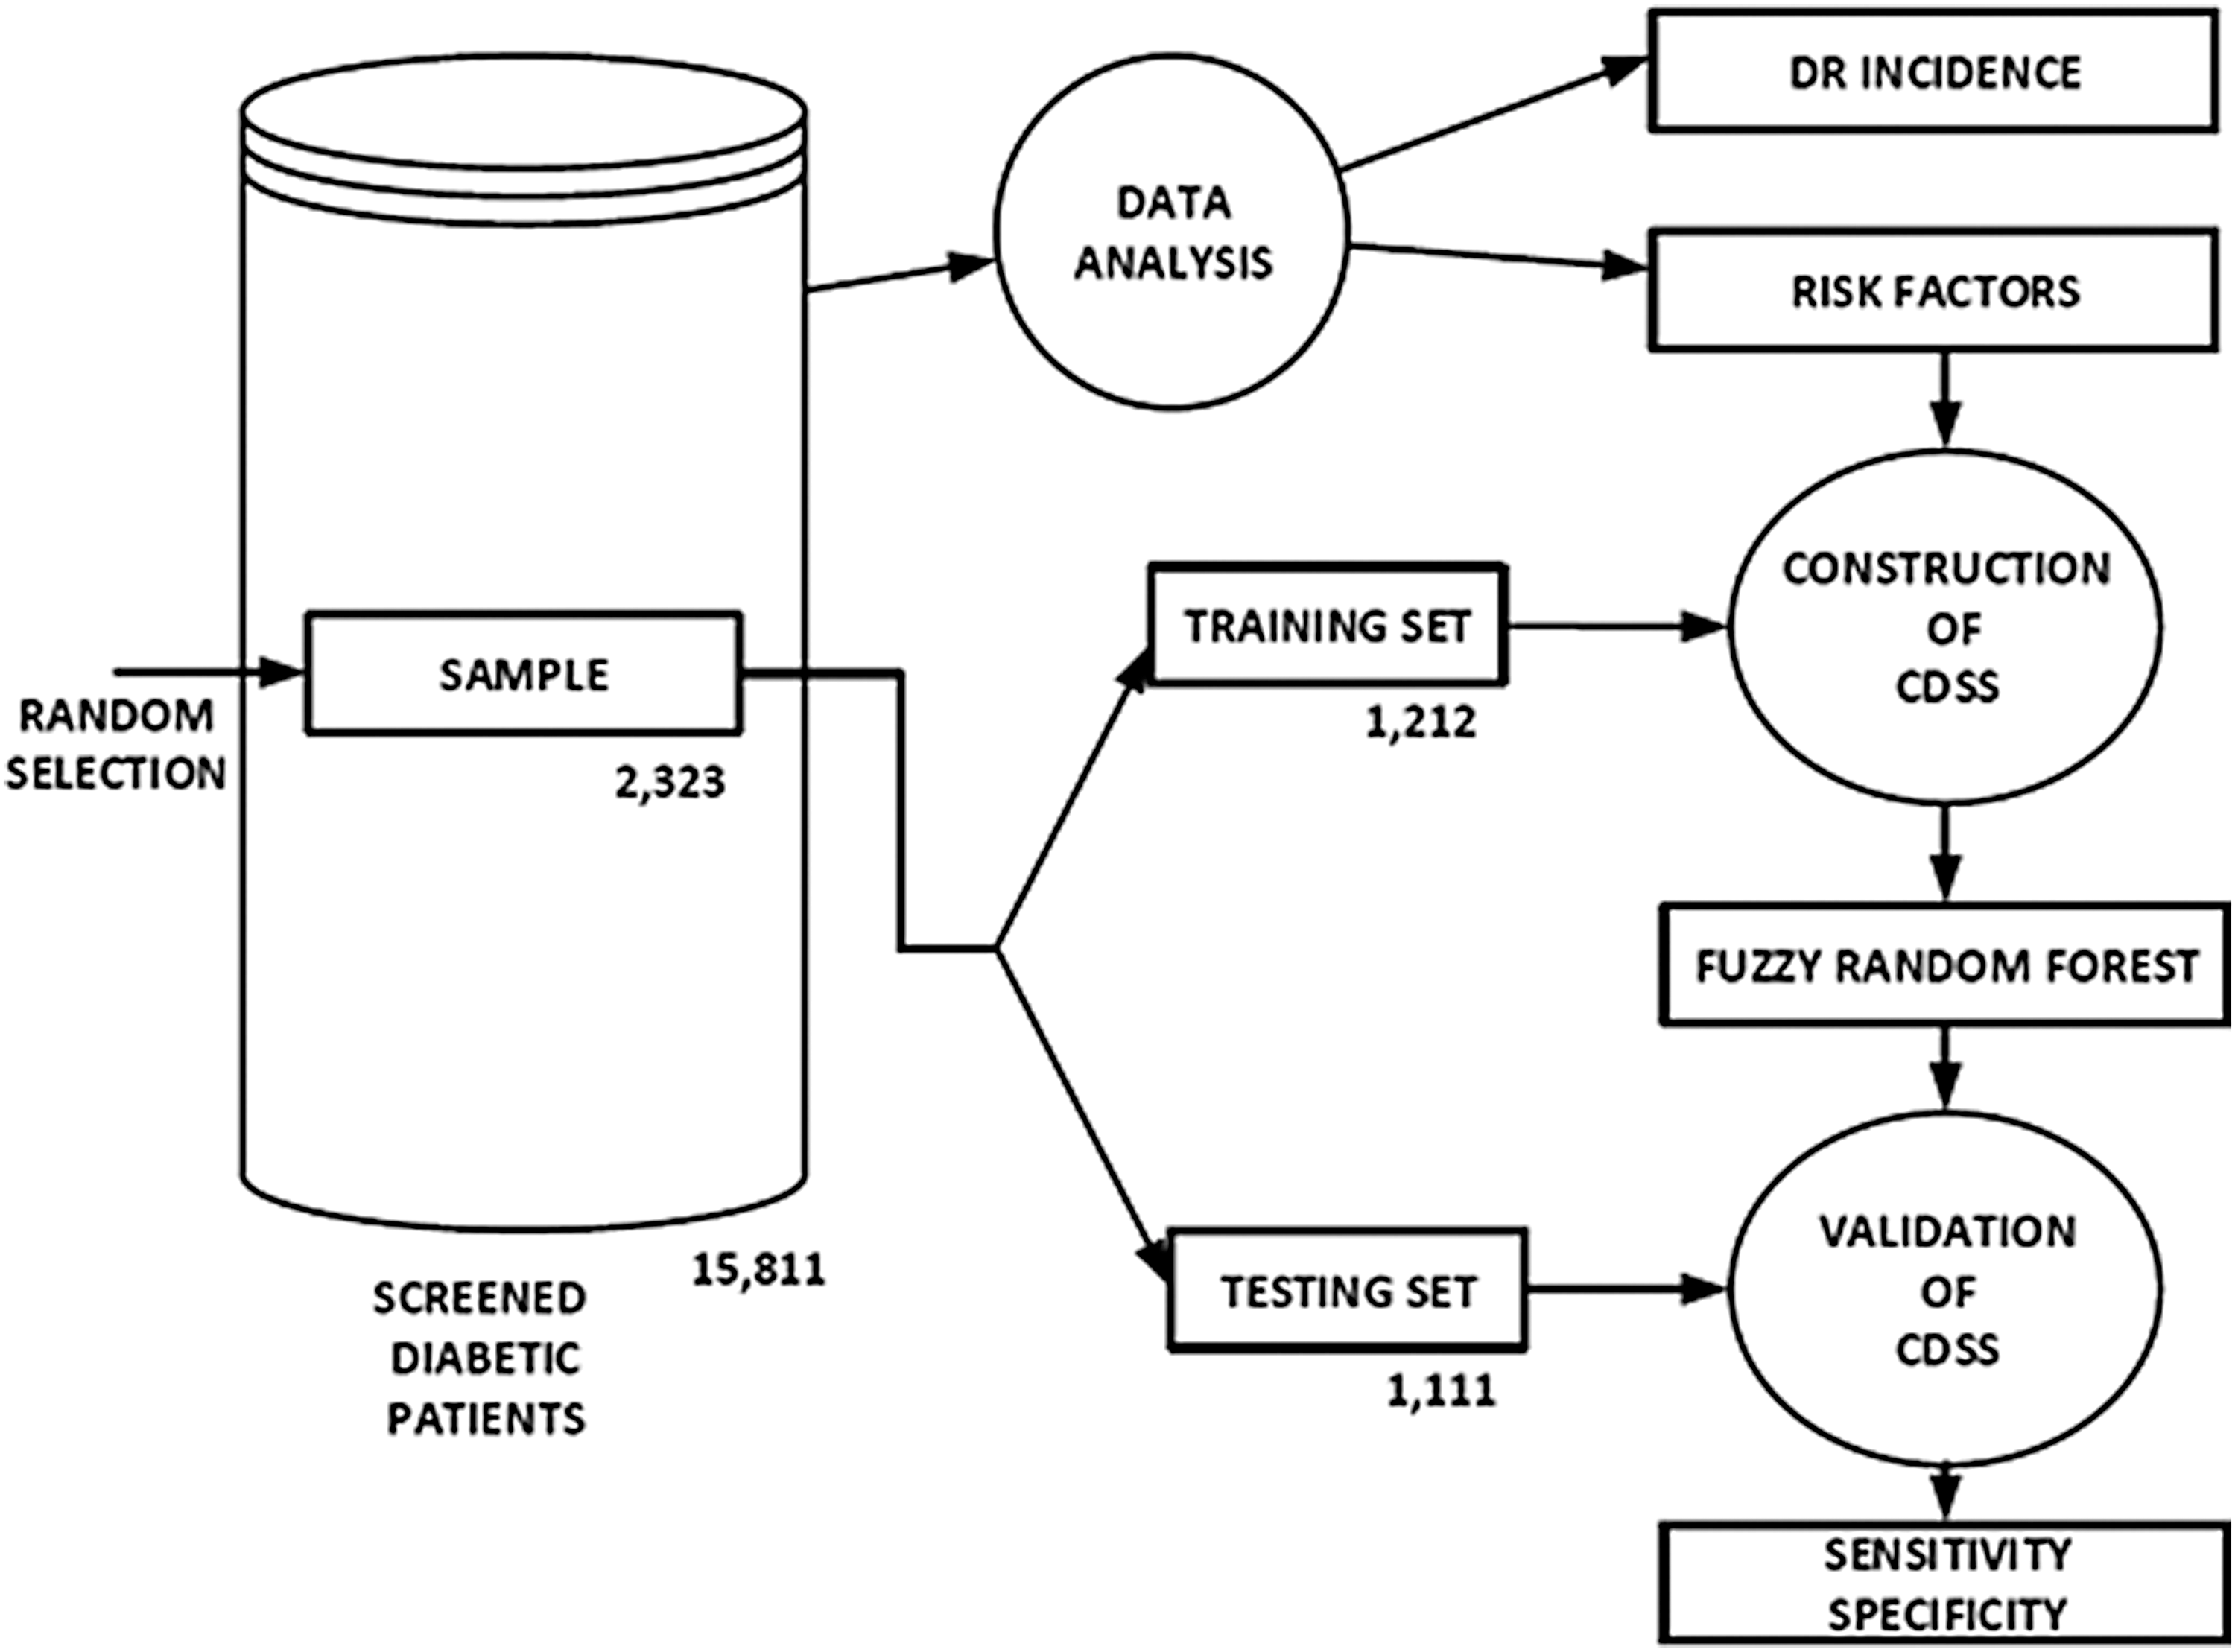
Flowchart of the data analysis and CDSS construction and validation process. CDSS, clinical decision support system.
Results
Step 1. Incidence of DR and its risk factors
During the 10-year period (01 January 2007 to 31 December 2016), 15,811 T2DM patients were screened (Table 1), which represents 85.33% of the total T2DM patients (18,528 registered patients) in our HCA, with a mean follow-up of 3.45 ± 1.12 times for each patient. The whole sample population comprised more men (56.13%), which does, in fact, reflect the prevalence of diabetes in the general population. The mean current age was 63.91 ± 11.85 years, and duration of DM was 8.36 ± 6.64 years. Mean HbA1c values were 7.41% ± 1.45% (3.9–15.8). A total of 4,466 patients with T2DM went on to develop any-DR (28.24%) with a mean annual incidence of 8.21% ± 0.60% (7.06%–8.92%) (Table 1). Tables 2 and 3 gives the statistically significant variables in the univariate analysis and with Cox's proportional regression analysis.
Descriptive and Frequency Values of All Screened Patients—Incidence of Any-Diabetic Retinopathy
Statistical Analysis at the End of the 10-Year Follow-Up Study
F, fisher-snedecor distribution; OR, odds ratio; DR, diabetic retinopathy.
Multivariate Analysis Using Cox's Proportional Regression Analysis of Any-Diabetic Retinopathy
HR, hazard ratio.
At the end of the study, the following variables were statistically significant: current age, gender, DM duration, arterial hypertension, DM treatment, body mass index, HbA1c, CKD-EPI, and microalbuminuria.
Step 2. Building a CDSS
Sample size = 2,323 patients from a total of 15,811 screened patients. Standard methods using the Kolmogorov–Smirnov and Shapiro–Wilks tests were used to verify whether the variables follow a normal distribution. No differences between the populations were observed, giving a normal distribution and/or risk factors.
The data preparation process aimed to transform numerical variables into linguistic ones by constructing a fuzzy set for each term and defining a fuzzy partition over the original numerical reference scale.
The model was built using a learning algorithm on a dataset collected from the sample of patients. The 2,323 patients in the sample were divided into a training data set of 1,212 patients (871 defined as healthy and 341 defined as pathological with DR), and a testing set of 1,111 patients (873 healthy and 238 pathological) (Fig. 1).
A FRF, which is an ensemble of fuzzy decision trees (fuzzy classifiers) was constructed with the data of the patients in the training set, using an adaptation of the FRF induction algorithm proposed by Yuan and Shaw. 24 An ensemble classifier was used because it has been proven to provide more accurate results than single classifiers. More explanations about the different measures that appear in this algorithm can be found in Saleh et al. 8
To compare the performance of different FRFs, and to compare FRFs with other computational models, the standard measures of sensitivity, specificity, and classification accuracy were employed. They can be calculated from the number of True Positives (TP), True Negatives (TN), False Positives (FP), and False Negatives (FN) as follows: Sensitivity = TP/(TP+FN), Specificity = TN/(TN+FP), Accuracy = (TP+TN)/(TP+TN+FP+FN).
There are three basic parameters to consider in the construction of an FRF: the number of trees in the forest, number of attributes that are randomly chosen at each node of the tree to continue the analysis, and threshold that controls the creation of the leaves of the tree (the minimum percentage of samples corresponding to that branch of the tree that must agree on a class to end the analysis with a leaf).
We made an empirical analysis using a 10-fold cross-validation on the training set, considering the following ranges of values: 100-200-300 trees, 1-2-3-4 randomly selected attributes in each node, and a leaf creation threshold between 0 and 1 (in 0.1 intervals). The best results on this validation were obtained with 100 trees, three selected attributes per node, and a high leaf creation threshold (0.8–1.0). With these values of the parameters, the classification of the testing set was made with an accuracy of 80.29%, a sensitivity of 80.67%, and a specificity of 80.18%.
Comparison with other computational methods
The FRF model has been compared with the following classifiers: Logistic regression.
K-Nearest neighbours. The best results were obtained with k = 5 neighbors. A single decision tree, constructed with the classical ID3 algorithm. A Random Forest, in which variables have not been submitted to fuzzy rules.
Table 4 shows the differences yielded by these four methods and the FRF. The results showed that Logistic Regression and decision tree ID3 have an excellent specificity, but a very low sensitivity (a high number of false negatives). The sensitivity of k-NN is even lower. The single decision tree presents balanced (but quite low) levels in both measures. The best results are obtained with the two models based on Random Forests, in which levels of specificity and sensitivity are over 80%. When we apply fuzzy rules, sensitivity improves. Thus, FRF offers the best sensitivity, keeping a high level of specificity.
Comparison of Sensitivity and Specificity, Using Different Methods
Figure 2 shows the current interface of the CDSS. At the top, the physician only has to indicate the values of the nine attributes that have been considered most relevant in the prediction of the risk of developing DR: age, gender (male, female), number of years since the detection of diabetes, current treatment (diet, oral, insulin), HbA1, CDK-EPI, microalbuminuria, Bbody Mmass Iindex, and control of hypertension (good, bad). It must be noted that the classifier does not admit the presence of missing data, so all attribute values must be provided.
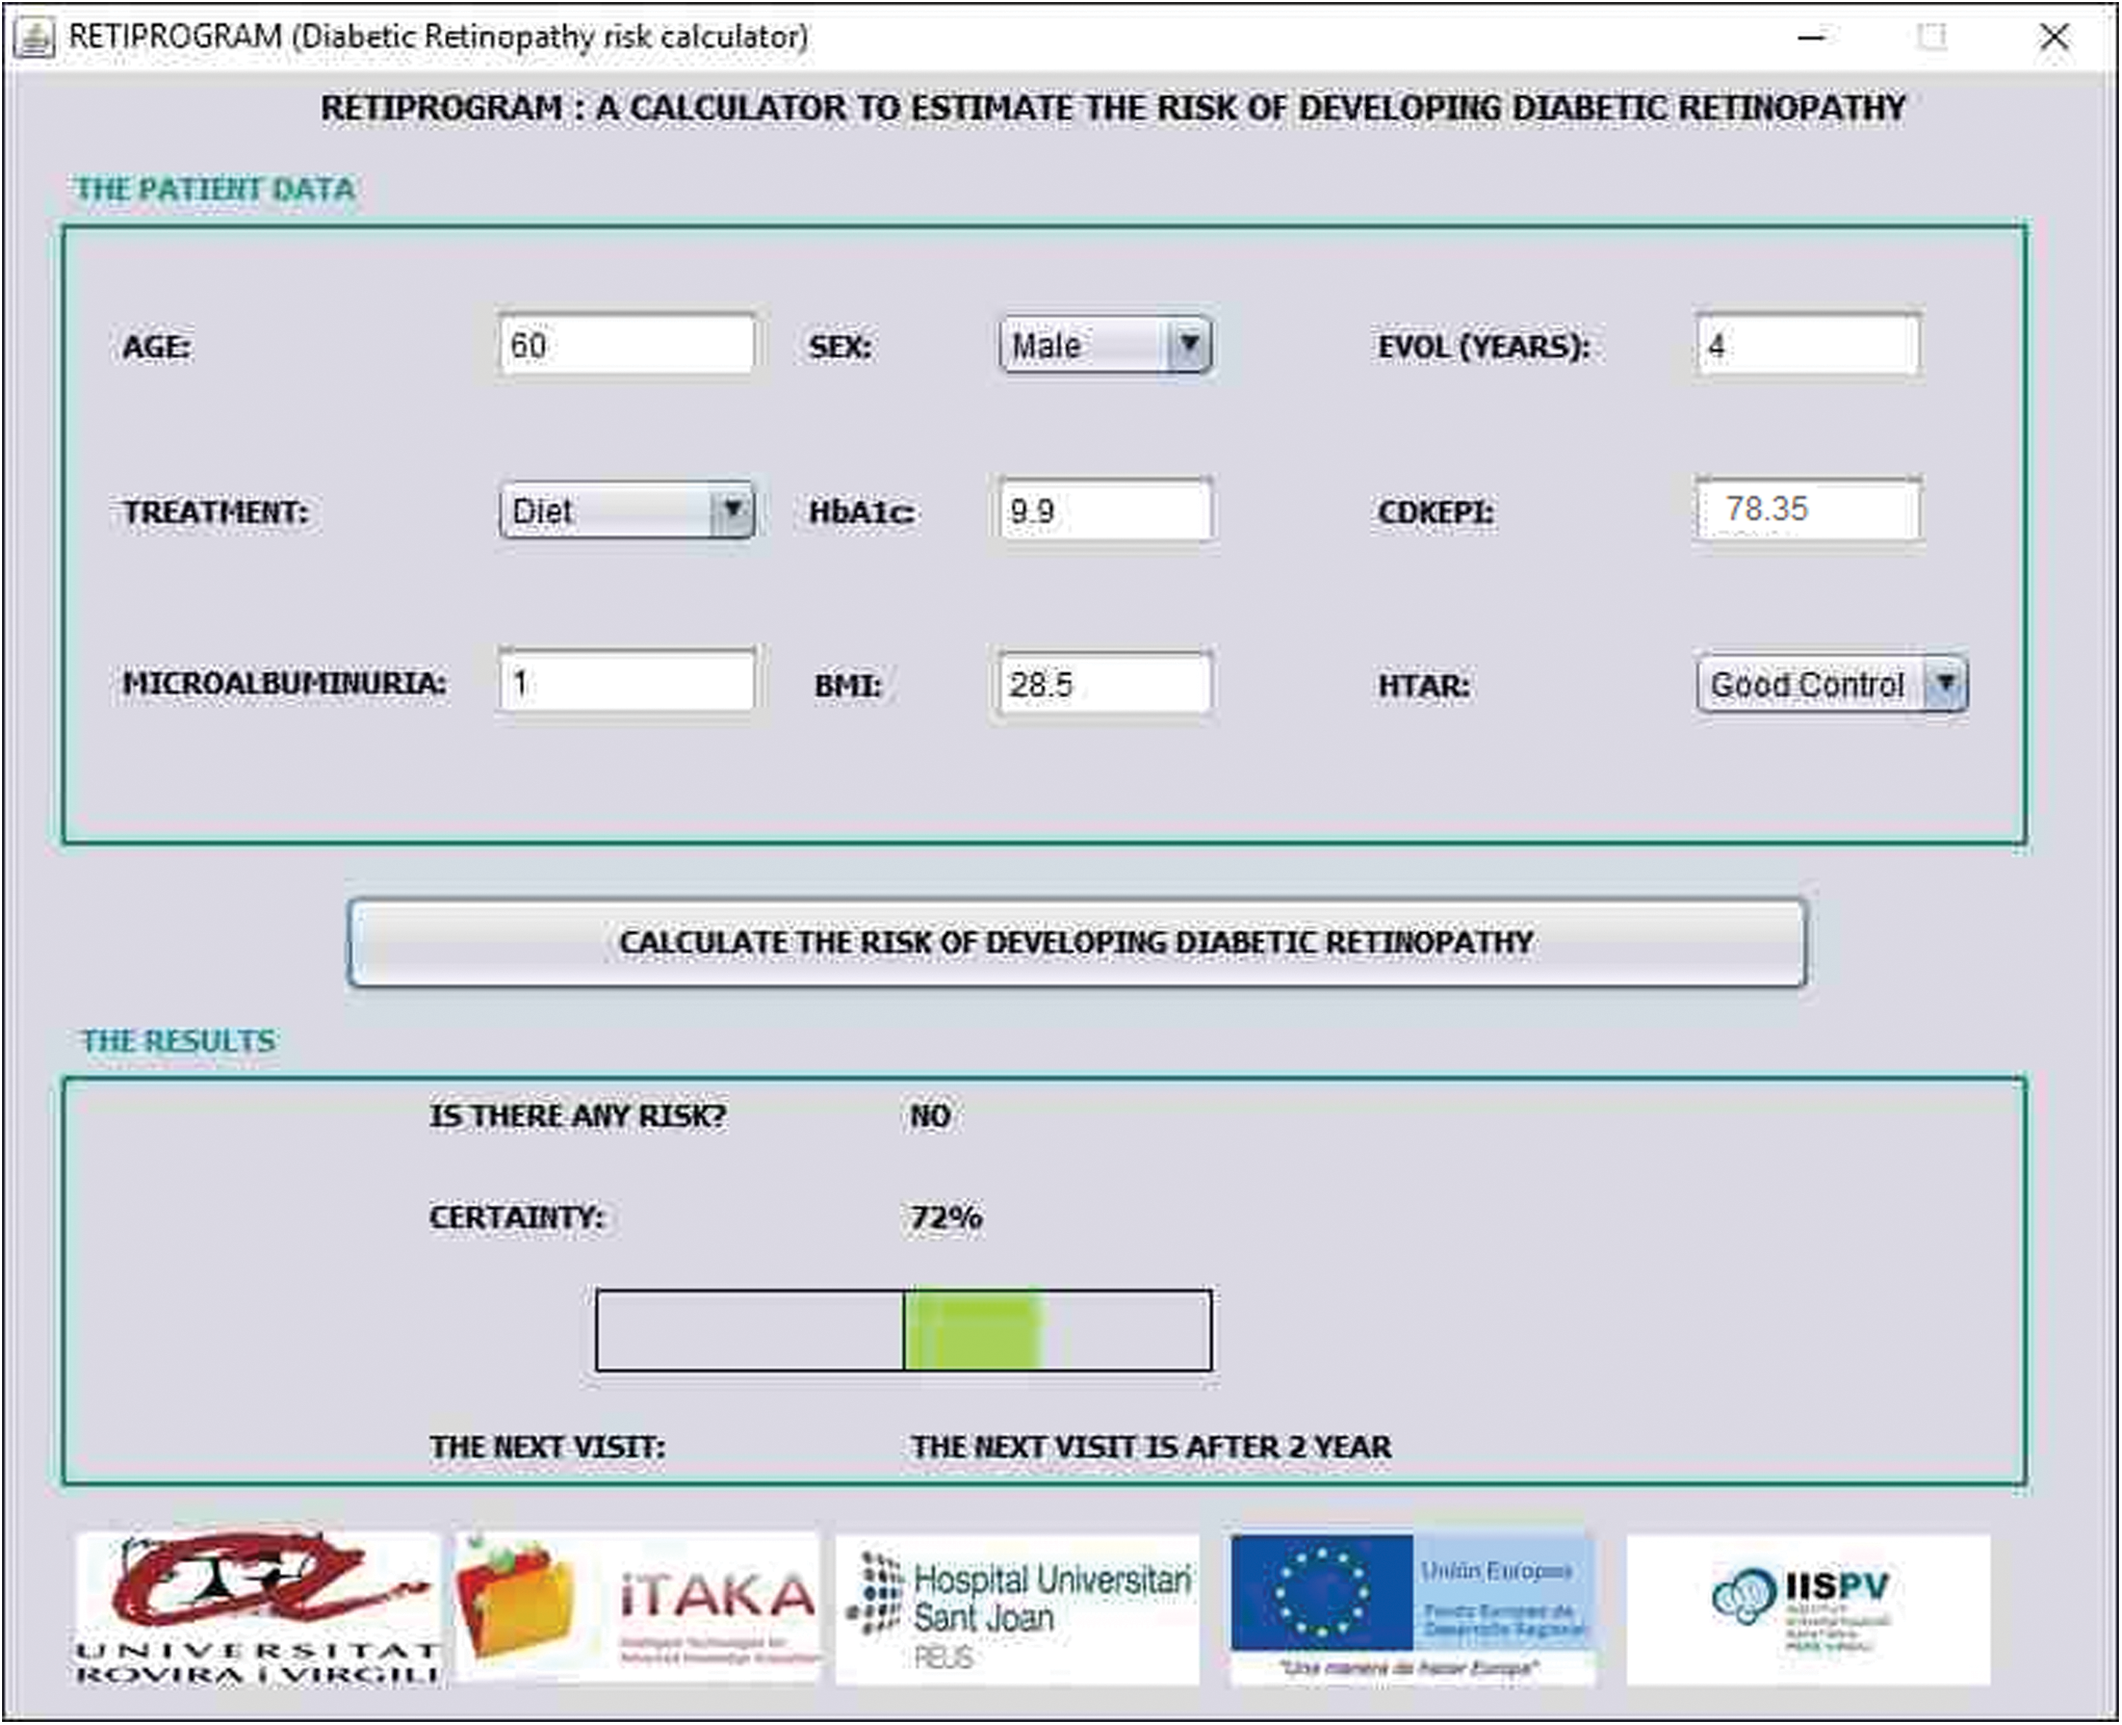
Screenshot of the developed CDSS, with risk factors at the top and the calculation of diabetic retinopathy risk at the bottom. Color images available online at
After that, the central button must be pressed to run the classifier. Each of the trees of the FRF makes a prediction (DR or no-DR) with a certain level of confidence, and all this information is merged into a single answer about the risk of the patient (yes/no) and a level of certainty (Saleh 2017). If most of the trees predict a lack of risk, the system will show a bar with a green rectangle on the right, whose length depends of the certainty level. If most of the trees consider that the patient is at risk, then the bar shows a red rectangle on the left, whose size also depends on the certainty level (the higher the risk, the bigger the rectangle).
Finally, if there is no risk, the system suggests the best time for the patient's patient's next screening visit. In that new visit the nine values will be provided again to assess the risk. The ophthalmologists of the hospital provided the intervals shown in the Table 5.
Relationship Between Level of Certainty of the Lack of Risk and the Time of Next Visit
As an example of CDSS, in Figure 3 left we show: a man 70 years old, with a duration of diabetes of 4 years, treated by diet, and with good metabolic control (HbA1c = 6.5%, no arterial hypertension, no microalbuminuria, and CKD-EPI = 80.32 mL/min/ 1.73m2), this patient has a low risk of developing DR after 2 years with a 72% certainty. At right we presented a man also 70-year-old, 4-year T2DM duration and good arterial hypertension control but with a bad metabolic control that required insulin DM treatment with a HbA1c 10% and microalbuminuria of 30 mg/g, this patient has a risk for the development of DR with a certainty of 72%, the recommendation is to get checked by ophthalmologist.
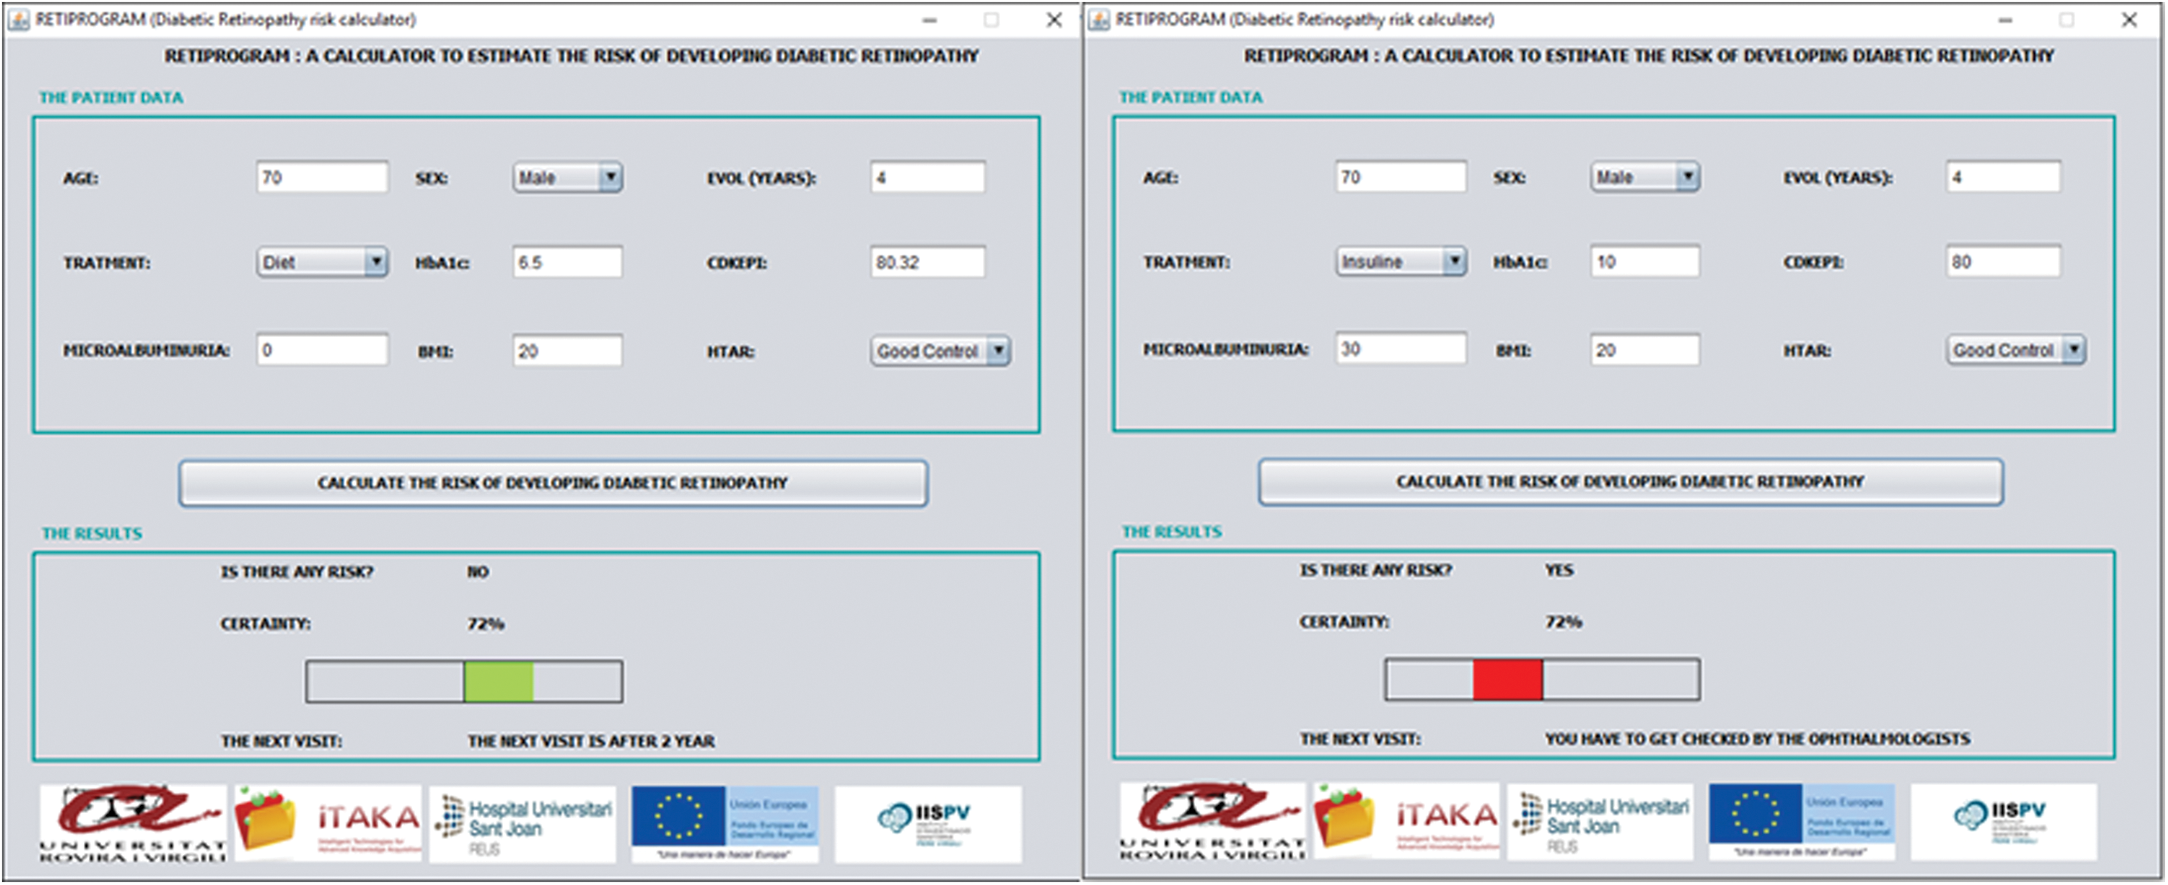
Example of CDSS in two men, at left with good metabolic control and at right with bad metabolic control. Color images available online at
Discussion
DR is the leading cause of blindness in young adults in occidental countries. Prompt diagnosis of DR enables clinicians to better control metabolic conditions, with a strict follow-up of glycemia, blood pressure, and renal diseases, which are known to be risk factors for DR and macular edema affectation. 25 –27
Currently, diabetes screening is carried out using nonmydriatic fundus cameras, and family doctors, endocrinologists, and ophthalmologists are all involved at some point of the process. Even though we have a robust system available for screening patients, only 30% of them are screened within the current limitations. It is difficult to achieve the levels recommended by different organisations involved in DM treatment, some of whom recommend biannual screening if patients are well controlled.
Our initial results from DR incidence studies, which were presented in previous publications 6,7 showed a sum incidence at 10 years of 28.24% with a mean annual incidence of 8.21% ± 0.60% (7.06%–8.92%). We also defined the risk factors for DR as follows: age, gender, DM duration, arterial hypertension, DM treatment, body mass index, HbA1c, CKD-EPI, and microalbuminuria. All the data we have collected over many years has now enabled us to build a CDSS according to risk factor in our DM population. We have tested 4 different methods: logistic regression, K-nearest neighbours, decision tree using classical ID3 algorithm, and random forest using fuzzy rules. 8,9 The most accurate test was the latter, with high levels of sensitivity keeping high levels of specificity. The other three tests achieved high levels of specificity but very low levels of sensitivity.
During the development of our CDSS, its specificity has always achieved high levels, 80.18% with random forest using fuzzy rules and 94.49% with logistic regression (Table 4). We also observe that with higher specificity values we obtain lower sensitivity values. Only with random forest and fuzzy rules were we able to achieve a balance between specificity (85.96%) and sensitivity (80.67%), so we believe that is the most suitable choice, with both good sensitivity and good specificity values.
Specificity has been linked to good prediction for those patients who are not at risk of developing DR in the near future, which is indeed what we are looking for. When building a CDSS for our DR screening, we were interested in lengthening the time of frequency of screening with as much confidence as possible that no DR will develop between screenings.
A key parameter in our CDSS is the EMR, which is entered manually by the clinicians involved in the process, and of course this might not include all data for all patients. It will always be essential, then, that the family doctors and other clinicians record this data correctly in the EMR.
Comparing this study with others is not possible because to our knowledge there is no other CDSS that enables personalized DR screening. There are published studies that have evaluated the development of sight threatening diabetic retinopathy (STDR) from baseline, such as Scanlon et al.,
28
who concluded that annual screening of all patients for STDR was not cost effective, and screening entire cohort every 3 years was most likely to be. Other studies lengthen screening frequencies to up to 4 years.
29
As we described in introduction, some studies
18
–21
considered only HbA1c levels or fasting blood glucose as the most important risk factor that can predict DR development. The most recent study made by Bajestani et al.
18
in a second test also considered age at diagnosis and blood pressure as predictive risk factors in patients with long time
Other current studies have focused on the automatic reading of fundus retinographies, 30 –32 which does increase the number of patients screened but the systems need to be validated and their cost effectiveness be demonstrated. Also in these systems, the clinicians' involvement is limited and reduces their opportunity to control the metabolism of diabetics.
The strengths of our study are the screening program itself, which includes 85.33% of T2DM patients of our HCA, and the 10-year follow-up of our T2DM population, which has yielded a large amount of data, meaning that results of specificity are sufficiently robust to ensure that when a patient is shown to be at low risk of developing DR, this is probably true. However, we are aware that our system still needs further development from its experimental implementation in nonrandomized populations.
The CDSS also has some limitations, such as not including other risk factors like glomerular filtration rate or dyslipidemia, which would affect prognosis. Most importantly, however, is their low level of sensitivity when applied to DM populations, so we must emphasize the importance of all patients' data being recorded accurately in the EMR for the CDSS to be most effective. Figure 4 shows a possible scheme for its implementation, despite its good sensitivity and specificity values more testing is essential.
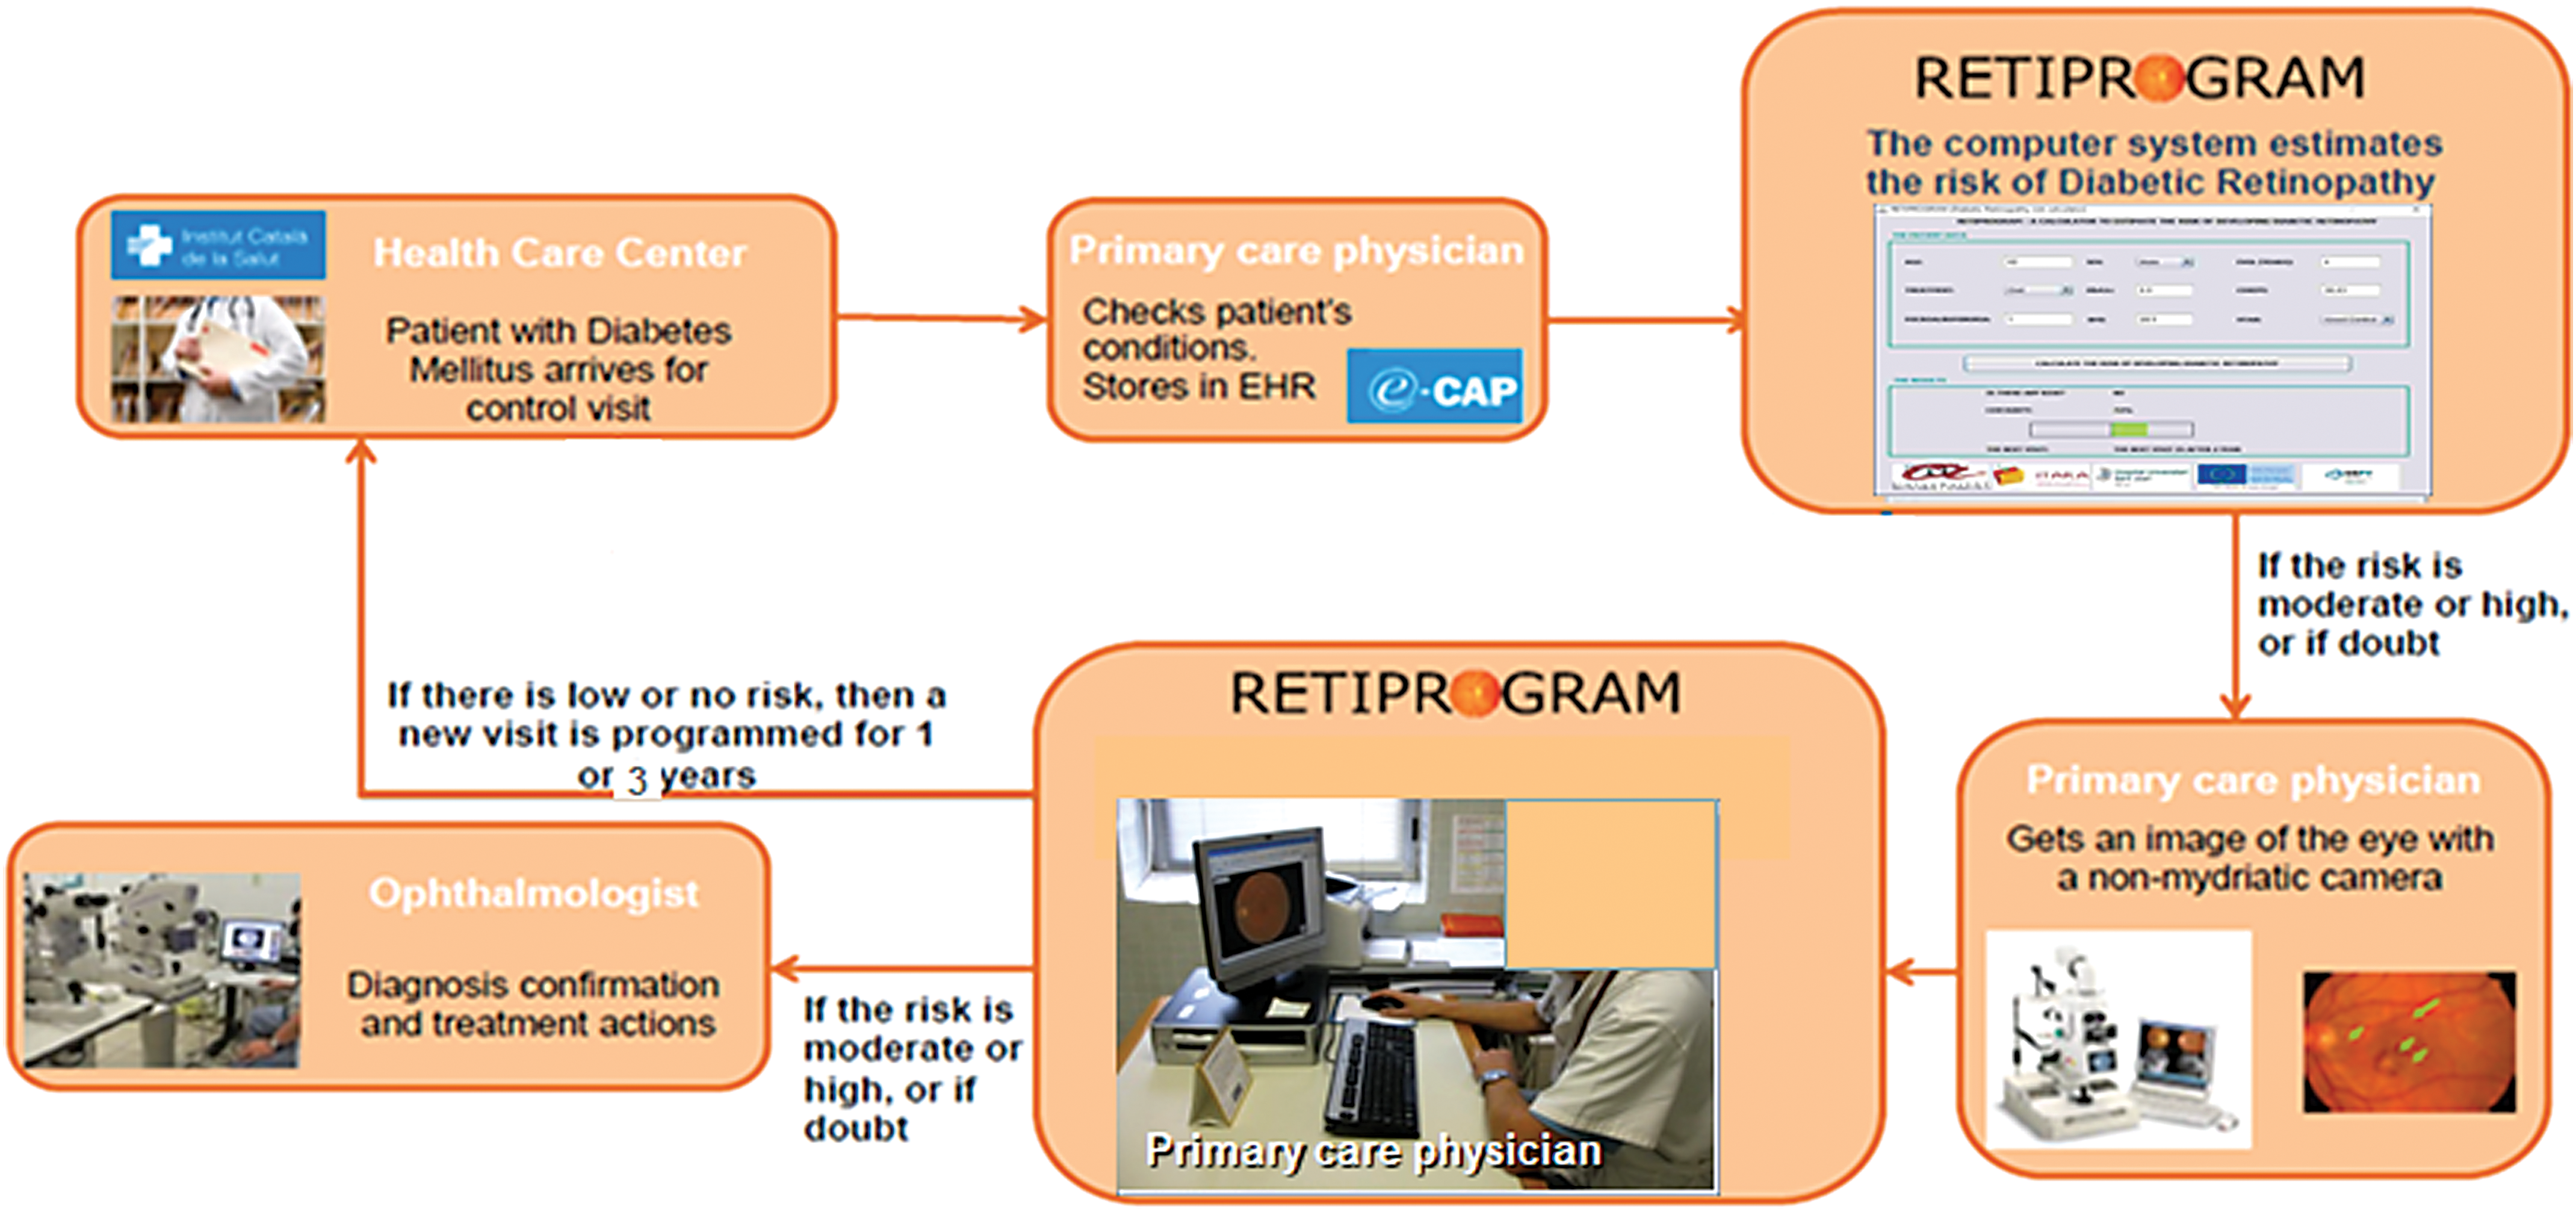
CDSS scheme for a screening program for diabetic retinopathy. Color images available online at
Conclusion
In summary, we have developed a CDSS named RETIPROGRAM, which can help family doctors, endocrinologists, and ophthalmologists to more effectively screen for DRdiabetic retinopathy. We have to implement the CDSS in other diabetic populations in order toto validate our results. In future investigations, we would include automatic reading of retinal images in our CDSS to complete the 2 current lines of study, a personalization of diabetic retinopathy risk factors and automatic images analysis.
Footnotes
Acknowledgments
We thank all family doctors and endocrinologists in our area who have helped us to implement the new screening program using the nonmydriatic fundus cameras, and our camera technicians for their work and support. We thank the GDPS network and especially Dr. Xavier MUNDET-TUDURI, Dr Joan BARROT-LAPUENTE, Dr Didac MAURCIO, Dr Manel MATA-CASE, and Dr. Josep FRANCH-NADAL, without whom we would not have been able to develop the present CDSS.
We also thank Mr. Phil Hoddy for his language assistance and for editing and correcting the English text.
The study was approved and supported by Instituto de Investigaciones Carlos III (IISCIII), Spain, nos. FI12/01535, June 2012, and FI15/01150 July 15. FEDER funds and URV grants numbers: 2015PFR-URV- B2-60 and 2016PFR-URV-B2-60. Mr. Saleh has a Predoctoral FI grant by Generalitat de Catalunya.
Contributors
Disclosure Statement
The authors report no conflicts of interest. The authors alone are responsible for the content and writing of the article.