
Abstract
Gait analysis is widely used in detecting human walking disorders. Current gait analysis methods like video- or optical-based systems are expensive and cause invasion of human privacy. This article presents a self-developed low-cost body inertial-sensing network, which contains a base station, three wearable inertial measurement nodes, and the affiliated wireless communication protocol, for practical gait discrimination between hemiplegia patients and asymptomatic subjects. Every sensing node contains one three-axis accelerometer, one three-axis magnetometer, and one three-axis gyroscope. Seven hemiplegia patients (all were abnormal on the right side) and 7 asymptomatic subjects were examined. The three measurement nodes were attached on the thigh, the shank, and the dorsum of the foot, respectively (all on the right side of the body). A new method, which does not need to obtain accurate positions of the sensors, was used to calculate angles of knee flexion/extension and foot in the gait cycle. The angle amplitudes of initial contact, toe off, and knee flexion/extension were extracted. The results showed that there were significant differences between the two groups in the three angle amplitudes examined (−0.52±0.98° versus 6.94±2.63°, 28.33±11.66° versus 47.34±7.90°, and 26.85±8.6° versus 50.91±6.60°, respectively). It was concluded that the body inertial-sensing network platform provided a practical approach for wearable biomotion acquisition and was effective for discriminating gait symptoms between hemiplegia and asymptomatic subjects.
Introduction
Gait analysis is widely used in detecting human walking disorders. There are two main gait analysis approaches that have been developed for analyzing human walking. One approach uses marker systems including video-based systems, active magnetic trackers, and optical marker systems to obtain human gait movement; however, they are dependent on an artificially generated source and could not be used outside the laboratory environment. Video-based systems usually cause invasion of human privacy and are expensive. The other approach mainly uses wearable sensors like inertial/magnetic sensor systems that could be worn on the body with low-power and portable recording systems for long-term ambulatory monitoring, which are independent of an artificially generated source. It also could obtain real-time capture and analysis of gait information over a larger distance and outside of the laboratory environment.
Accelerometers and/or gyroscopes have been used to obtain gait parameters, 1 –5 which can be derived by the integration of angular acceleration or angular velocity. However, data can be distorted by offsets or any drifts. 6,7 To eliminate any drift during integration, Morris 8 identified the beginning and the end of gait cycles and made the signal at the beginning and the end of the cycle equal. Some researchers used 7,9 accelerometers and gyroscopes fixed on metal plates to measure human joint flexion/extension angles, but also found that use of metal plates was cumbersome. Dejnabadi et al. 10 developed a method of measuring joint angle using a combination of accelerometers and gyroscopes by placing a pair of virtual sensors on adjacent segments at the center of rotation. Kobashi et al. 11 used inertial sensors combined with a magnetic sensor to estimate the three-dimensional knee joint angle. Limitations of the two methods were that they all need to obtain accurate positions of the physical and virtual sensors to minimize the error.
Stroke is a common disease in elderly people and could cause severe disabilities. Approximately 60% of post-stroke patients cannot continue normal functional movement. The most common symptom in stroke is hemiplegia. 12,13 Most hemiplegia patients have difficulties in their balance and posture control while walking because of asymmetrical posture and abnormal body balance, with reduced knee joint angle and abnormal gait. Rehabilitation is usually conducted to preserve and recover motor functions, and the major focus is on the assessment and treatment of the gait.
The assessment is usually made by doctors using a clinical scale such as the Brunnstrom scale, but it is difficult and could not be used frequently during rehabilitation. Quantitative analysis of the characteristics of hemiplegia gait is therefore needed, and the relation between the characteristics and functional rehabilitation must be found. Assessment of hemiplegia gait should be simple, and real-time evaluation of rehabilitation could be carried out.
In this article, a low-cost and self-developed platform with data transmitted wirelessly is presented. Then a new method using the gesture of body segments to estimate the knee joint angle and identify gait cycles, which not need to obtain accurate positions of the sensors, was proposed for quantitatively analyzing the parameters of hemiplegia gait and finding the differences of gait parameters between hemiplegia patients and normal subjects.
Platform Design
Body Inertial-Sensing Network
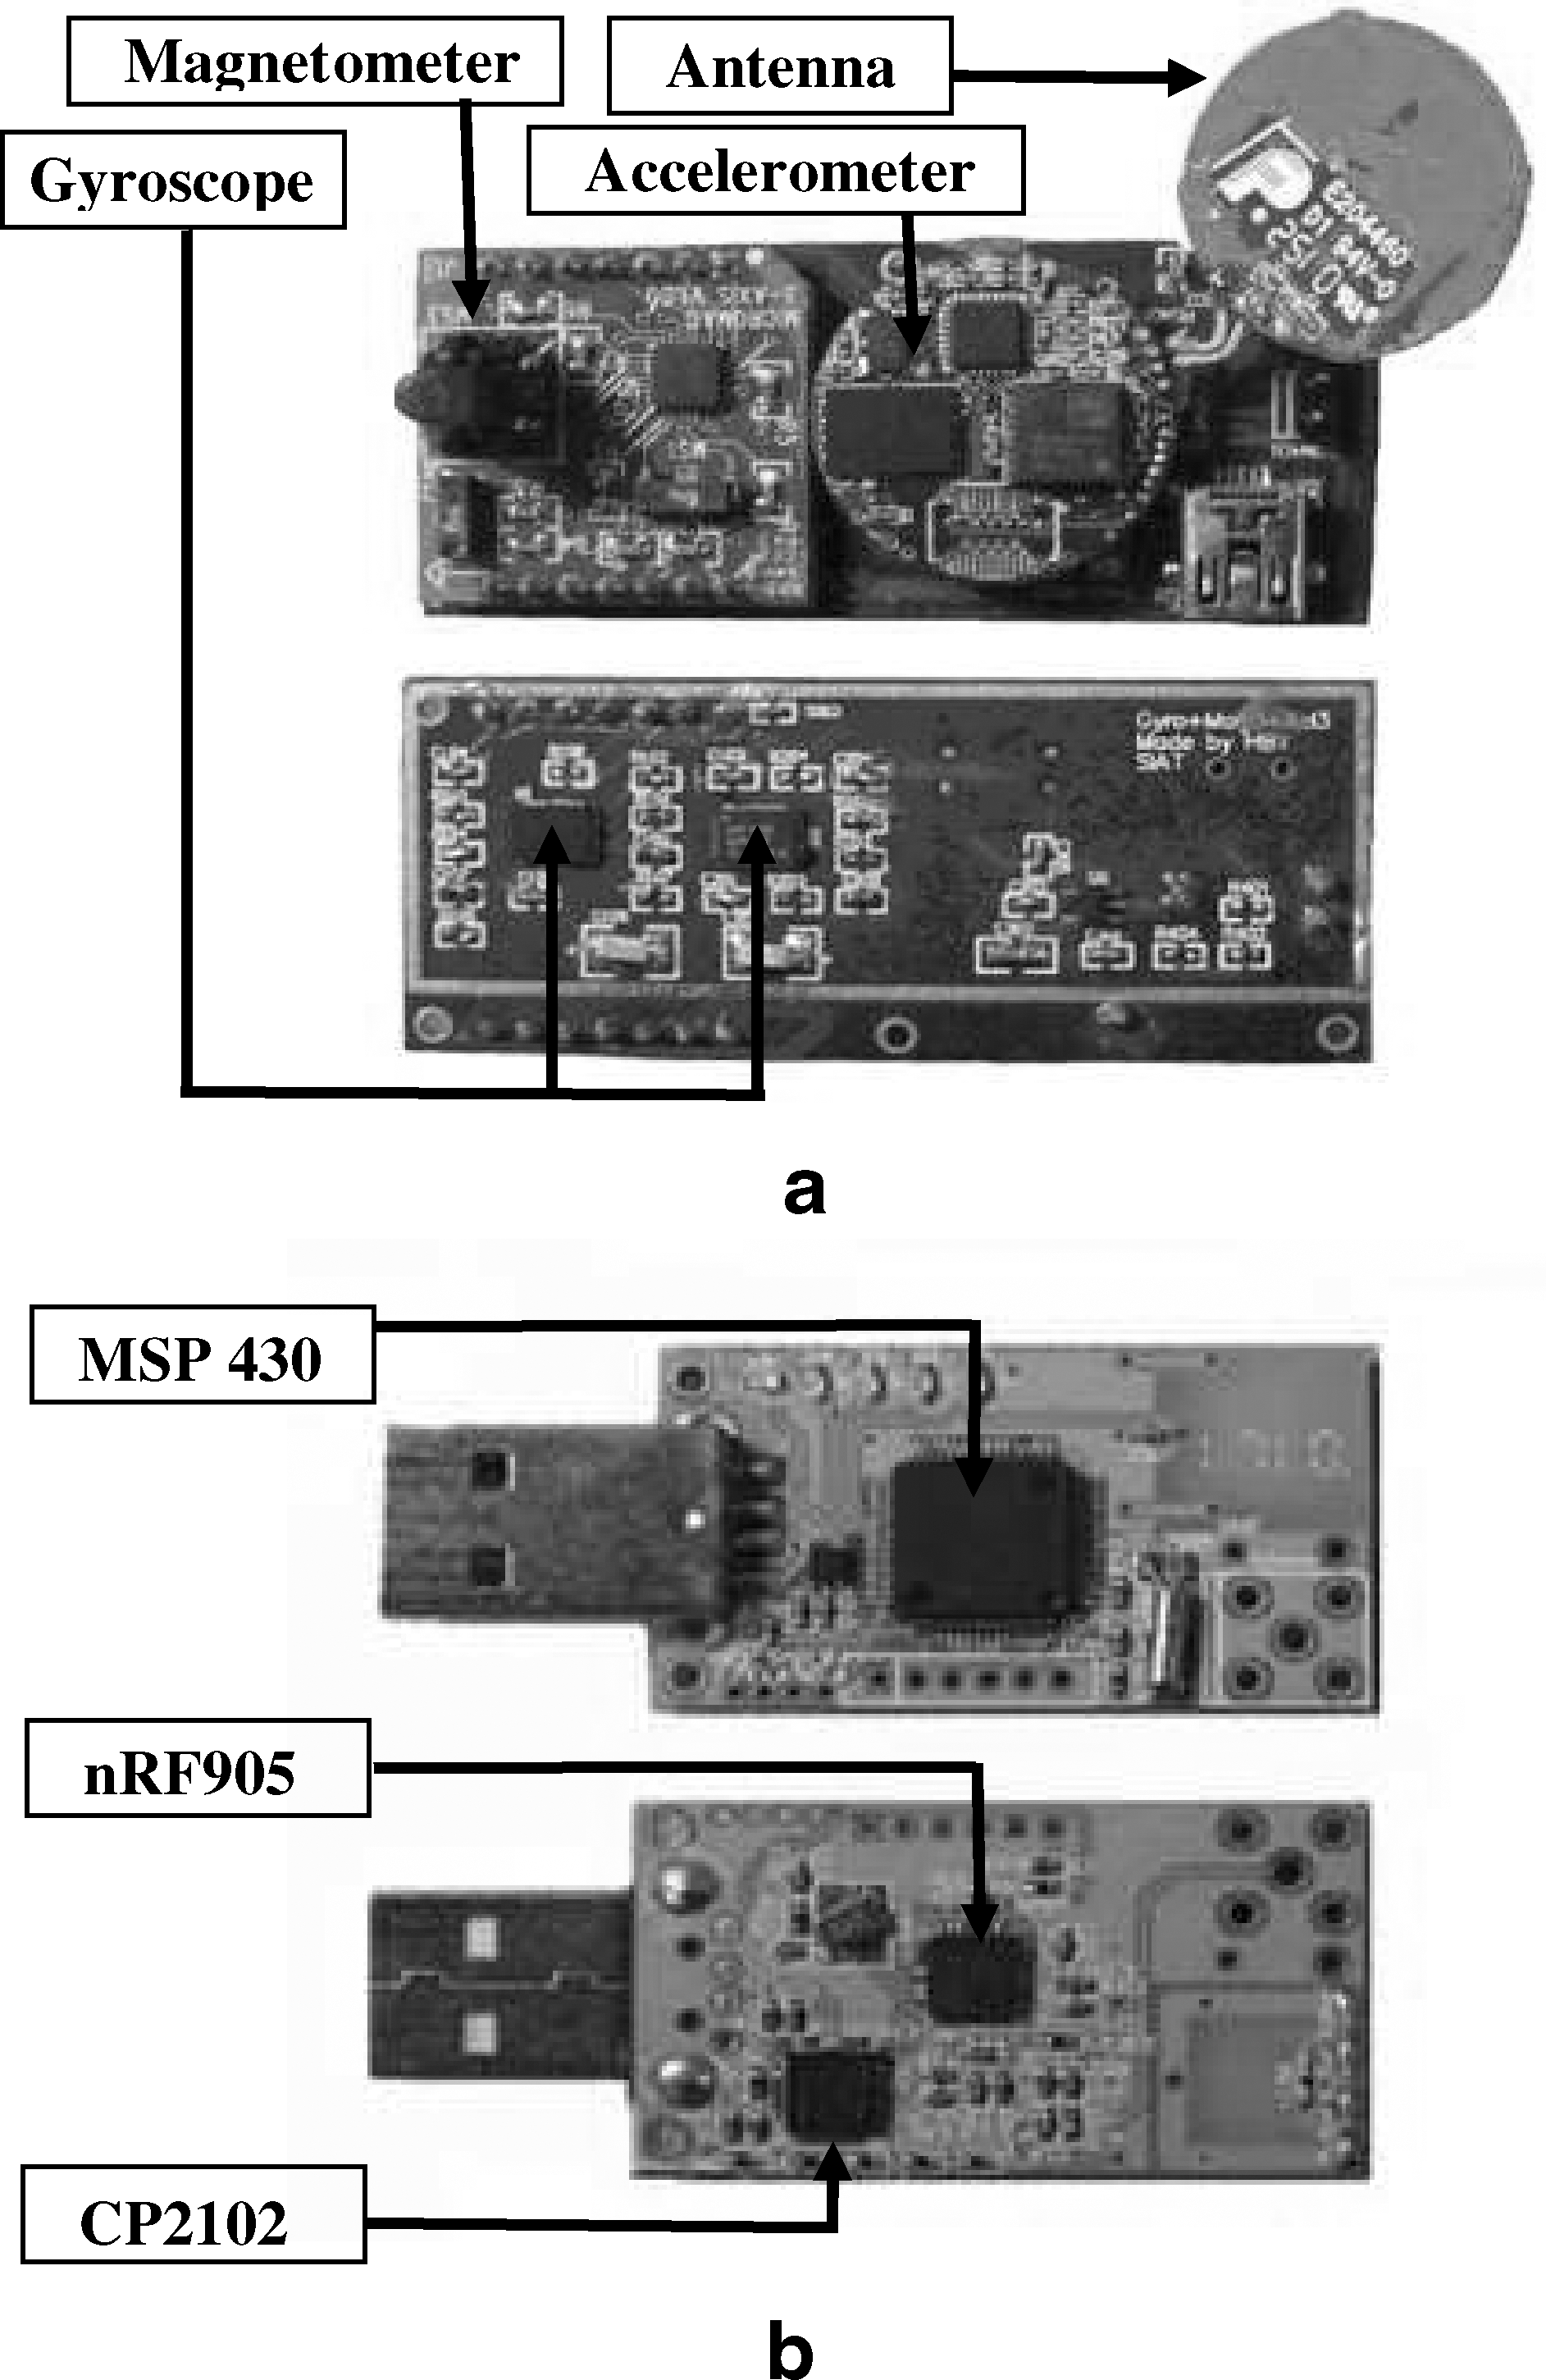
The body sensor network (BSN) inertial measurement node board is the major part of the body inertial-sensing network (BiSN) platform that was designed to provide data for measuring three degrees of freedom orientation in real-time. It contains four sensing components: a three-axis accelerometer, a three-axis magnetometer, a three-axis gyroscope, and the temperature sensor. The three-axis Accelerometer (model SCA3000) 14,15 measures accelerations relative to the coordinate frame of the node board. The gyroscope is composed of two parts: a dual-axis gyro (mmodel IDG650) and a one-axis gyro (model ISZ650). The magnetometer (PNI part number 12800) is used for measuring the geomagnetism of three directions of the local magnetic field vector.
The node board also contains a Texas Instruments model MSP430F2418 microcontroller that performs analog-to-digital conversion for the gyro module and transmits data to the central base station (CBS), which is connected to a computer via the radio transceiver (model nRF905). As wireless transmission is not always reliable, flash memory (model AT25DF641) on the board provides data buffering and storage. Figure 1 illustrates the BSN inertial measurement node board. The dimensions of the node board are 60×27×2 mm. Power consumption for real-time data transmitting is 92.4 mW (28 mA).
The front view and back view of
The communication coordinator CBS could receive data from all nine-axis nodes in the network and transmit them to a computer for processing. The CBS board contains a microcontroller (model MSP430F2418) and a radio transceiver (model nRF905), the same as on the nine-axis node board. The CBS board is connected to a computer via a USB-to-serial port (model CP2102 performs the USB-to-serial conversion), which is 55×20×2 mm in size.
Software Flow of Standby/Wakeup for the Nine-Axis Node Board
Low energy consumption is important in a BSN. To reduce power consumption, systems such as ZigBee and Bluetooth® are widely used. In a BSN, the energy expenditure in a node is typically dominated by the communication subsystem and especially the transmission unit. 16 With the premise that maximizing transceiver standby time will yield minimal energy consumption, a carefully managed protocol is implemented in our BSN platform.
Every node in the network sends a synchronization request packet to the CBS. After the node receives a synchronization answer (SA) from the CBS, the connection between the CBS and the node is established. Then the node acquires the information of the BSN (e.g., the number of nodes, IDs of other nodes, total time slices, time slices that belong to itself, and so on). 17 Every node knows when to transmit data and fast startup from standby to RX (receive mode). Suppose that time T is divided into many time slices for all the nodes in the BSN, at the beginning of T, the RX circuitry of the transceivers is opened to listen to SA. If the transceiver receives SA, the node would get new information about the new time slices that could be used to transmit data by itself and enter standby mode at other time slices; if SA is not received, the node works in previous time slices and enters standby mode at other time slices.
Experiments
Sensor Location
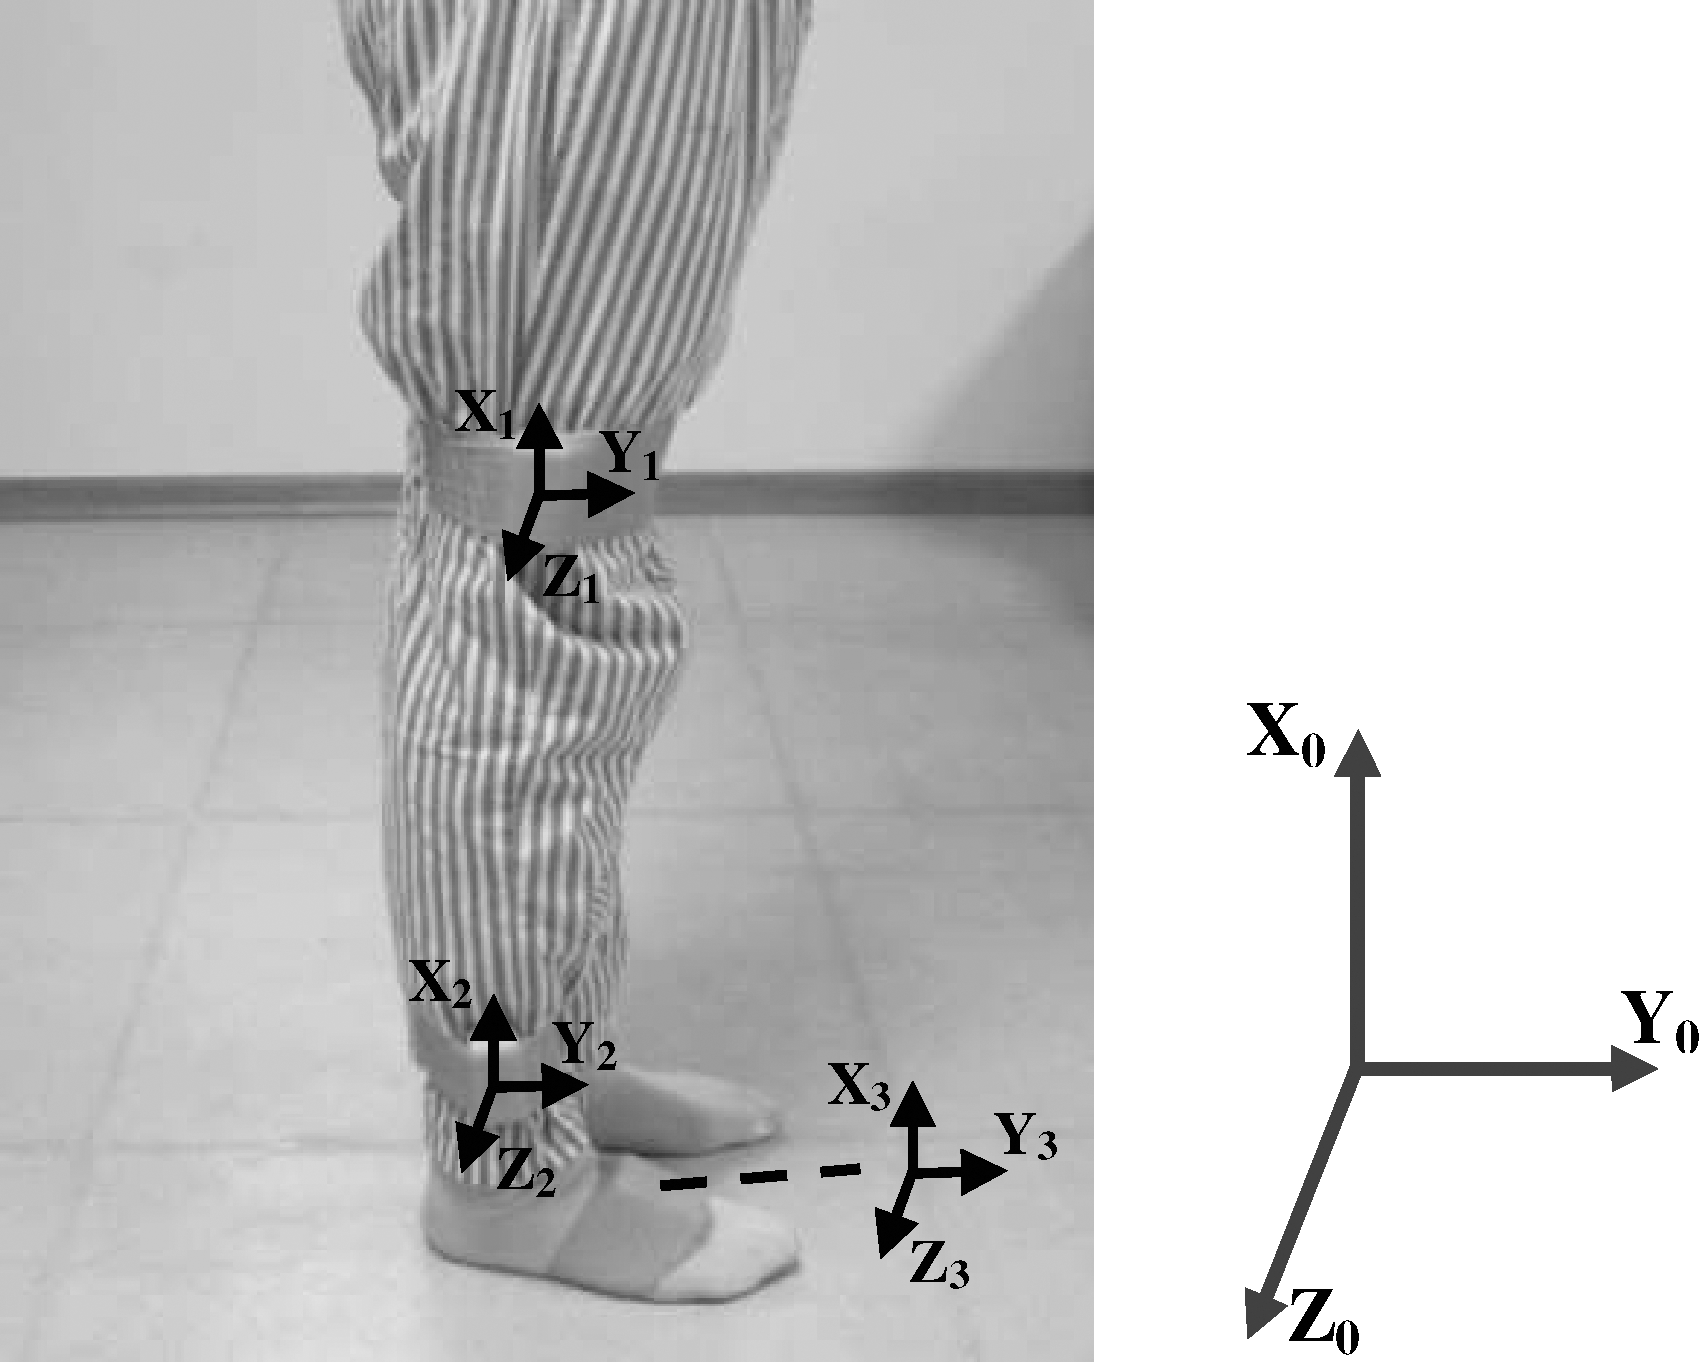
Three sensor nodes were used for the experiment. For hemiplegia patients, sensors were attached on the abnormal side; for the control group, sensors were on the same side. In the case of the knee joint, the sensors are attached to the thigh and to the shank, on the lateral skin surface near the knee joint and ankle joint, respectively. The foot sensor was attached on the dorsum of foot as shown in Figure 2.
Three sensors were attached on the subject using medical bands. Fourteen subjects were recruited.
The sensor axes were adjusted in the anterior–posterior plane to accurately measure the motion in the sagittal plane.
The sensors are attached using medical bands. These sensor attachment locations are optimized to reduce the skin movement artifact based on the clinician's knowledge and experience. 18 Accelerations, angular rate, and magnetic vectors are obtained with a frequency of 100 Hz.
Coordinate System
The femoral coordinate system X 1 Y 1 Z 1 is defined using three anatomical feature points. A line connecting the lateral epicondyle and medical epicondyle is the z-axis, with directionality pointed to the lateral epicondyle. A line perpendicular to the z-axis and passing through the great trochanter is the x-axis, with directionality pointed to the great trochanter. The y-axis is a cross product of the x-axis and the z-axis.
The tibial coordinate system X 2 Y 2 Z 2 is defined by four anatomical feature points. The z-axis is the same as the z-axis of the femur coordinate system. T o is a middle point of the lateral epicondyle and the medial epicondyle. The x-axis is defined as a line connecting T o and a middle point of the lateral malleolus and the medial malleolus, with directionality pointed to T o. Then, the y-axis is a cross product of the x-axis and the z-axis.
The foot coordinate system X 3 Y 3 Z 3 is defined as follows: the z-axis is perpendicular to the foot plate, with directionality upward; the x-axis is in parallel with the foot plate, with directionality forward; and the y-axis is a cross product of the z-axis and the x-axis.
Using the measured anatomical feature points, the body coordinate systems are defined as described above. The rotation transform parameters from the sensor coordinate systems to the body coordinate systems were used. The data obtained from the sensors are rotated by the rotation transform parameters to acquire the acceleration and magnetic vectors of the bones.
Experiment Design
Fourteen subjects (7 hemiplegia patients and 7 normal subjects) were recruited. The experimental procedure was approved by the ethics committee of the Shenzhen Institutes of Advanced Technology. Each subject signed an informed consent prior to testing. The group included 8 males and 6 females with an average age of 62.25 years. Before the experiment, all sensors were calibrated to be in the same coordinate system at the same place. The subjects were asked to stand still for 5 s for sensor calibration and then to walk straight for 5 m at a self-selected comfortable speed towards a target line on the floor, with the sequence performed three times. The walking distance, time, and steps were recorded by a camera in real-time.
Algorithm Design
Eulerian Angle
The Eulerian angle, which was composed of the roll angle, the yaw angle, and the pitch angle, is a classic method to describe the gesture of objects. The gesture of objects could be determined only by integration of angular rate data. However, this solution would be prone to drift over time because of the buildup of bias and drift errors. In order to avoid drift, additional complementary sensors must be used. These sensors usually include accelerometers and magnetometers. Measuring the gravity vector using accelerometers allows estimation of orientation relative to the horizontal plane, which can be described by the roll angle and the pitch angle. However, when the object is rotated about the vertical axis, the gravity vector on each axes of the accelerometer will not change. Because an accelerometer cannot be used to describe the rotation about the vertical axis, a magnetometer is used to measure the local magnetic field vector to determine orientation relative to the vertical by calculating the angle between the object and the geomagnetic North Pole. The data from the incorporated sensors are normally fused using the Kalman or other complementary filtering algorithm. In this study, we used a Kalman filter with just two quaternion as input, one acquired from the gyroscope and the other from the accelerometer and magnetometer.
Flexion/Extension Angle
The z-axis of sensors on the thigh and shank was adjusted to be the same direction. Therefore the rotation angle of the thigh and shank in the sagittal plane could be regarded as the angle between two sensors in the XY plane. Thus a virtual point was used as the knee joint center, with two virtual lines in parallel with the X-axis of each sensor, respectively. The virtual point could also be regarded as the center of the sensor on the thigh or shank that was translated in parallel with virtual lines. Then the knee joint flexion/extension angle could be described by the angle between two virtual lines.
We defined the posture of the sensor on the shank as the orientation (i.e., the relative coordinate system). Then the posture of the sensor on the thigh relative to the orientation could be obtained by rotating the sensor on the shank. Let q
thigh and q
shank represent the quaternion that describes the posture of sensors on the thigh and shank relative to the initial coordinate system X
0
Y
0
Z
0, and q
s−t represents the quaternion that describe the posture of sensors of the thigh relative to the relative coordinate system. The rotation could be described by the function below:
because the rotation angle of the thigh and shank could be regarded as the angle between two sensors in the XY plane (i.e., the rotation angle of the Z-axis at the virtual point), which means the yaw angle in Eulerian angles, and could be derived from q s−t representing the flexion/extension angle of the knee joint.
Gait Cycle
The gait cycle is defined as the time interval between two successive occurrences of one of the repetitive events of walking. Although any event could be chosen to define the gait cycle, it is generally convenient to use the instant at which one foot contacts the ground (“initial contact” or “heel strike”). If it is decided to start with the initial contact of the right foot, then the cycle will continue until the right foot contacts the ground again. The left foot goes through exactly the same series of events as the right, but displaced in time by half a cycle.
The gait parameters were acquired from the sensor tied on the foot, using the method mentioned above. Let q
foot represent the initial posture of the foot when standing, and q
gait represent the posture of the foot when walking, which were all relative to the initial coordinate system. Let q
f−g represent the quaternion of q
gait rotated from q
foot. Then q
f-g could be acquired by the following equation:
Results
Platform Accuracy
The BiSN node could revolve around the x-axis, y-axis, and z-axis, respectively, and the Eulerian angle was acquired from the BSN node by using a Kalman filter, as shown in Figure 3.
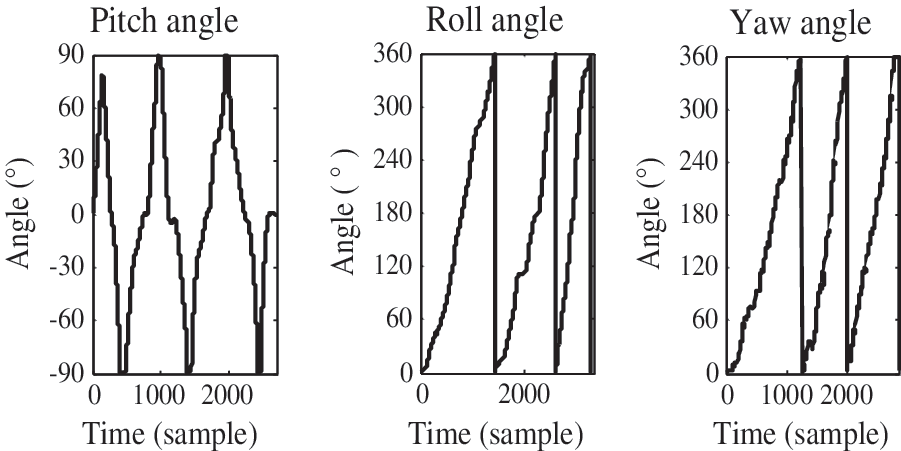
The Eulerian angle acquired from the body inertial-sensing network node, which revolves around the x-axis, y-axis, and z-axis, respectively. The range of the pitch angle is from −90° to 90°, whereas those of the roll angle and the yaw angle are from 0° to 360°.
The accuracy of estimating angles from BSN nodes was validated by comparing with the Xsens Development Kit. Figure 4 shows the roll angle, the yaw angle, and the pitch angle from the BSN inertial measurement node and the Xsens Development Kit; the respective correlation coefficients were 0.9991, 0.9987, and 0.9992.
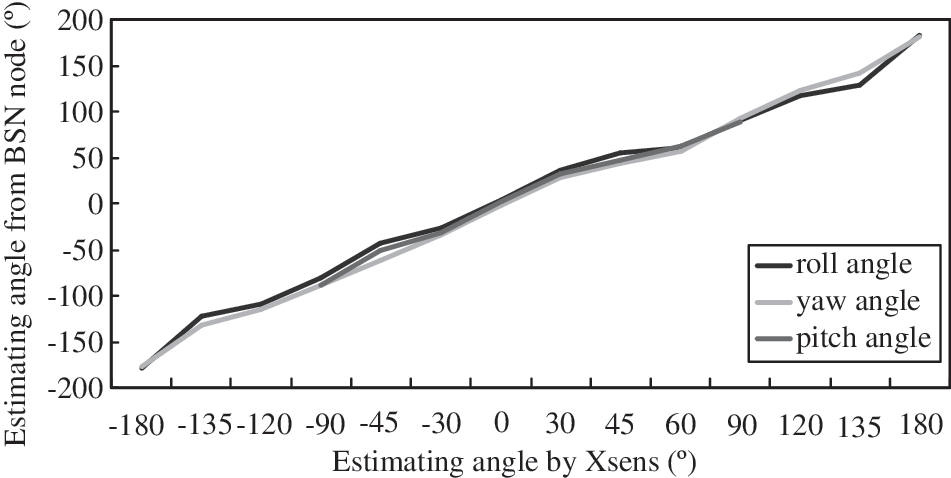
Correlation coefficients of the roll angle, the yaw angle, and the pitch angle from the body sensor network (BSN) inertial measurement node and the Xsens Development Kit.
Method Validation
Human body segments were considered as rigid bodies. The main strategy in analyzing the motion of a rigid body was to split the motion into the linear motion of the non-inertial reference point.
A database of gait cycles has been used for validation. This database included gait cycles of a group of 10 normal subjects. Each subject had five walking trials for 5 m, and gait cycles were recorded by a camera-based system. All measurement sessions were recorded using a portable videocamera for counting the number of gait cycles in each trial to calculate the sensitivity of the system. Then the data recorded using our method and the reference system based on the database were used to find the accuracy of the system in detection of gait and knee parameters.
To validate the practicality of the system in that the accurate positions of the sensors need not be obtained, four sensors (two sensors on the thigh and two sensors on the shank) were tied on the thigh and shank using the method mentioned above, with random distances to the knee joint. The sensors on the thigh were termed T1 and T2, whereas those on the shank were S1 and S2. After sensor calibration, the subject was required to do knee flexion/extension movements freely. Then we obtained four knee flexion/extension angles: S1–T1, S1–T2, S2–T1, and S2–T2, as shown in Figure 5.
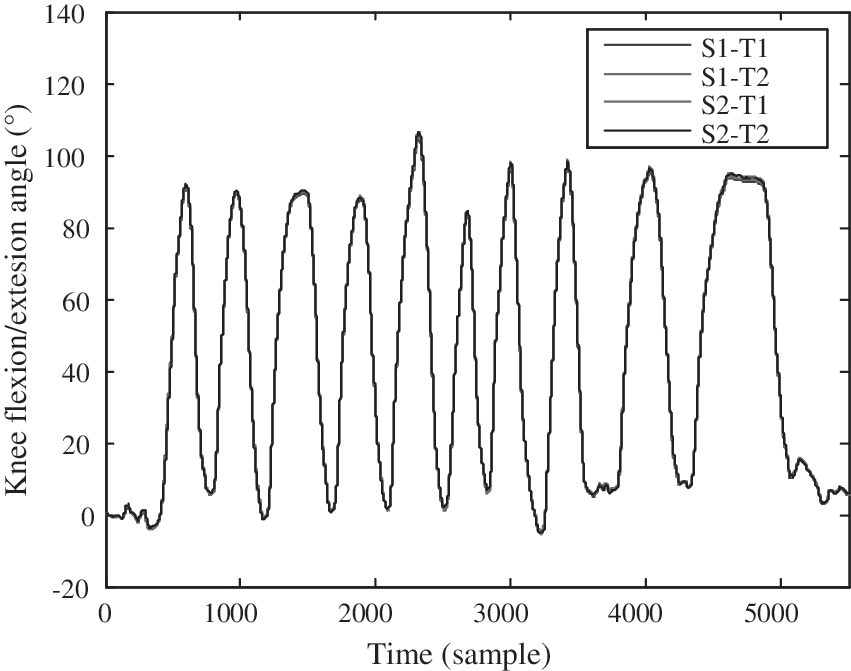
Four knee flexion/extension angles were acquired by free-motion knee flexion/extension movement. S1 and S2 were sensors on the shank; T1 and T2 were sensors on the thigh. The correlation coefficients of each of the two curves were more than 0.9999.
Gait Cycle and Knee Angle
The duration of a complete gait cycle is known as the gait cycle time, which is divided into stance time and swing time. The following terms are used to identify major events during the gait cycle: (1) initial contact and (2) toe off and then back to (1) initial contact (sometimes known as terminal contact). These three events subdivide the gait cycle into two periods: stance phase, when the foot is on the ground, and swing phase, when the foot is moving forward through the air. The stance phase, which is also called the contact phase, lasts from initial contact to toe off. The swing phase lasts from toe off to the next initial contact.
The angles of knee flexion/extension and the foot were calibrated and initialized to start from the same point 0° when the subject was standing. As shown in Figure 6, the gait cycle could be distinguished by the angle that was acquired by the BSN node on the foot. Figure 7 shows the different gait patterns of a hemiplegia patient and a normal subject.
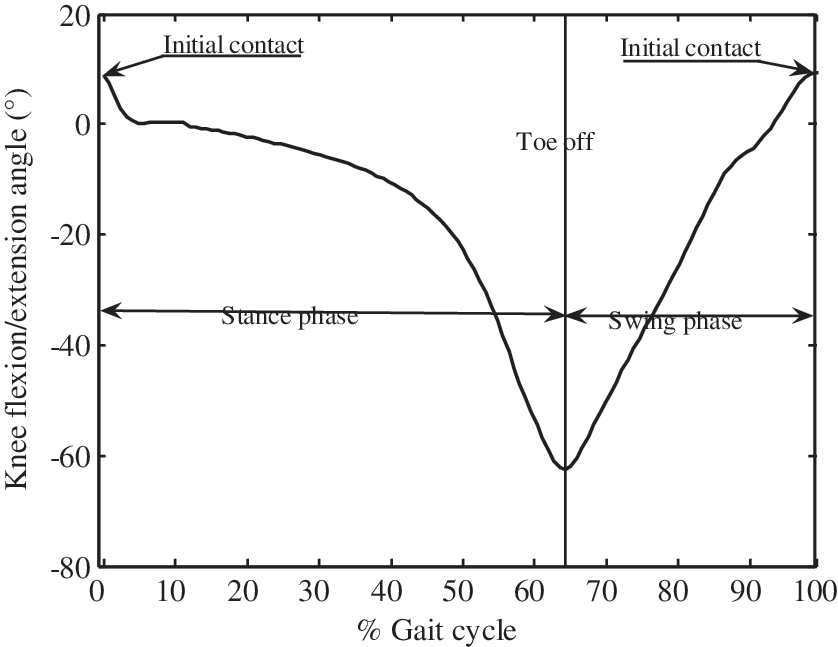
Gait cycle from a normal subject. The z-axis direction of the sensor on the foot was taken as a positive angle. The initial contact and toe off could be easily distinguished.
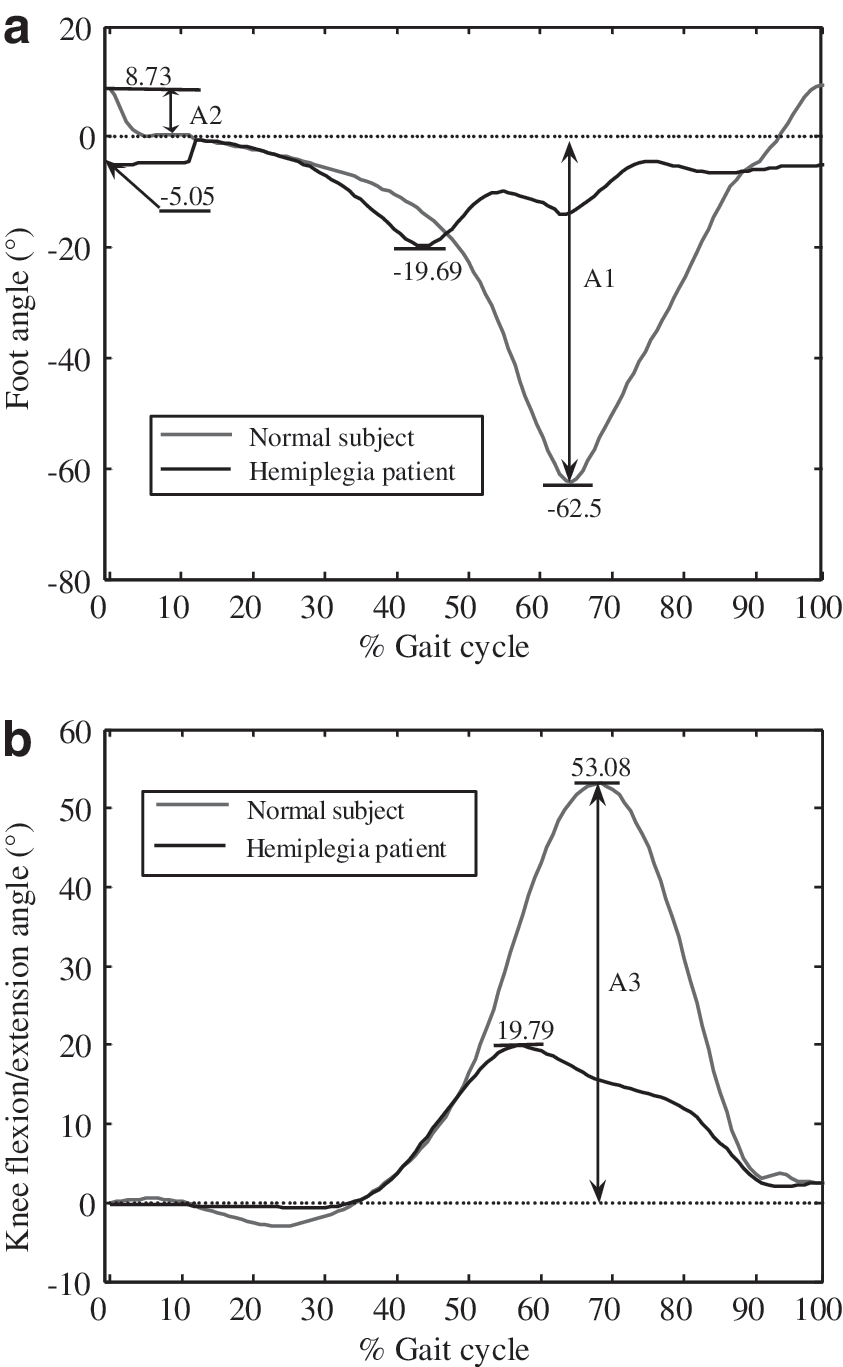
The angle amplitudes of initial contact, toe off, and knee flexion/extension were defined as the angles of initial contact, toe off in each gait cycle, and the maximum knee flexion/extension, respectively.
As shown in Table 1, the mean values of each parameter were calculated using 10 gait cycles of each subject. There were significant differences between the two groups in the three angle amplitudes, which were much lower in the hemiplegia group than in normal subjects: −0.52±0.98° versus 6.94±2.63°, 28.33±11.66° versus 47.34±7.90°, and 26.85±8.6° versus 50.91±6.60°, respectively.
Angle Amplitudes of Initial Contact, Knee Flexion/Extension, and Toe Off from 7 Hemiplegia Patients and 7 Normal Subjects
AIC, angle of initial contact; AK, angle of knee flexion/extension; ATO, angle of toe off; SD, standard deviation.
Discussion
The evaluation of joint and segment kinematics is a valuable resource for clinical practice because it can precisely measure the variations and clarify and quantify what the human eye is unable to do. 19
In daily life, various environments and long-distance monitoring are involved. In comparison with the conventional monitoring systems based on an optical camera system or magnetic position sensors, the proposed system could be used for long-term daily monitoring and is a nonconstrained system because of its portable devices and wireless data transmission, and the system was low cost compared with commercial systems (Xsens Development Kit).
The method of using an accelerometer, a magnetometer, and gyroscopes to analyze gait cycle or the knee flexion/extension angle has been used previously in different studies, but they were limited by the location of sensors or drift error of the gyroscope in long-term monitoring. The idea of using gyroscopes to assess gait has also been used in different studies; however, there have been few ambulatory methods suitable for long-term monitoring with successful validations compared with reference systems. Our new method was more practical in that it was not limited by the location of the sensors and used a new signal processing approach and algorithm to acquire gait parameters.
The hemiplegia gait is complicated to quantify, especially in daily life, because of the free movement. In this article, we tried to use wearable sensors and only chose a knee angle and gait cycle that are easily acquired from daily life to describe the differences between hemiplegia patients and normal subjects, with the aim to reduce the difficulty of daily monitoring of patients. The new method also helped patients with training and rehabilitation at home, by giving feedback about the training effect in real-time.
Bohannon et al. 20,21 suggested that the ultimate goal of rehabilitation for patients with stroke was to achieve a normal gait pattern and speed. The hemiplegia gait is widely used by clinicians to describe the pattern of limb movement and body posture of the patients with stroke. 21 Figure 8 shows typical symptoms of hemiplegia gait: (1) a reduced angle amplitude at initial contact meant the foot was nearly flat, even at forefoot contact, and the foot angle amplitude was reduced because of the decreased eccentric control of the dorsiflexors, (2) the flexion/extension amplitude of the knee angle was reduced, caused by increased knee flexion at toe off and during swing, due to quadriceps spasticity, and (3) plantar flexion was decreased at toe off.
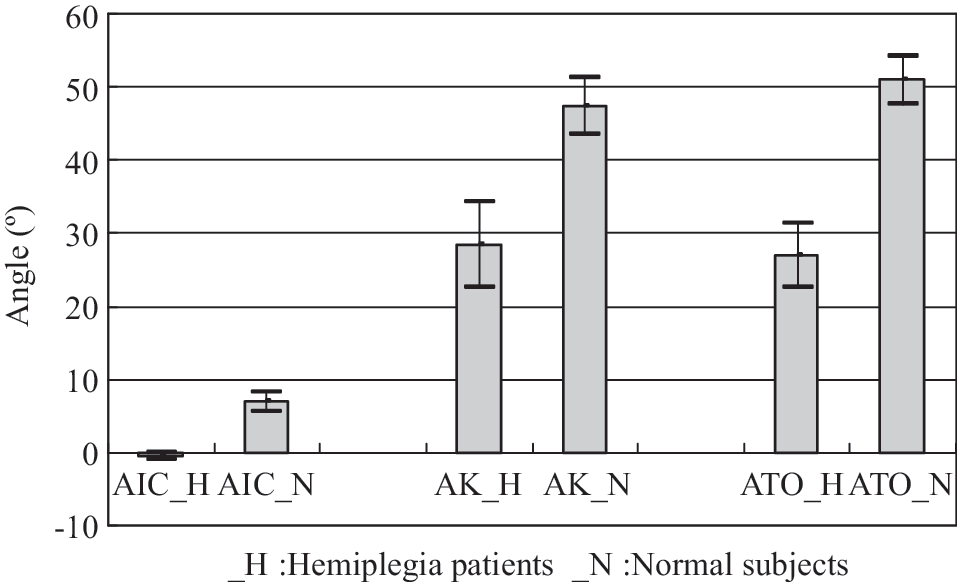
The angle of initial contact (AIC), angle of knee flexion/extension (AK), and angle of toe off (ATO) of hemiplegia (H) patients compared with normal (N) subjects, showing the typical symptoms of hemiplegia gait.
Our method has several advantages over other ambulatory systems. Unlike some of the footswitch or other pressure-sensitive devices, no special footwear is needed for long-term monitoring, and this way is more comfortable for long-term monitoring. Also, available foot switch-based devices limit the gait analysis to the temporal parameters, 23,24 whereas ours can provide both temporal and spatial parameters.
In the present study, we only examined the sagittal movements (two-dimensional flexion/extension) of the foot and knee joint. Although the results were satisfactory and could justify use of the method, future extension of this study should consist of incorporating full three-dimensional motion of the lower limbs, using more sensors, and more parameters like step length and hip angle because many patients with gait pathology compensate for difficulty in sagittal plane motions by using motions in other planes. Automatically identifying the motion of the patients would be another study to allow patients more freedom of living.
Footnotes
Acknowledgments
This study was financed partially by the Projects of National Natural Science Foundation of China (grants number 60932001 and number 61072031), the National Basic Research (973) Program of China (subgrant 6 of grant number 2010CB732606), the One-Hundred Talent and the Low-Cost Healthcare Programs of Chinese Academy of Sciences, and the Guangdong Innovation Research Team Fund for Low-Cost Healthcare Technologies.
Disclosure Statement
No competing financial interests exist.