
Abstract
Introduction
Conventional X-ray radiography is still one of the most widely used medical diagnostic techniques in rural healthcare centers in the developing world. These centers do not usually have radiologists on hand, making teleradiology a useful tool. 1 Several processes are required to put teleradiology into practice: film digitization, file transmission, data storage, and image display. The display and digitization devices processes are the most important elements to ensure diagnostic quality. Film digitizers are a specialized technology for scanning X-ray radiographs; however, their cost makes them unaffordable in developing countries where less expensive alternatives such as flatbed scanners and digital cameras are used as the only solution to use teleradiology, but usually without assessing their diagnostic accuracy before incorporating them in current practice. In Colombia, although a study with a film digitizer yielded satisfactory results, 2 teleradiology still tends to be rejected. We hope this study will contribute to the broader use of teleradiology in developing countries.
Several studies have been undertaken to compare the diagnostic accuracy of conventional plain X-ray interpretation with each of the following devices: film digitizers, 3 –6 flatbed scanners, digital cameras, 7 –9 combinations of these devices 10,11 and alternative modalities such as computed radiography (CR). 12 –14 Chest X-rays are among the most difficult radiographs to read and usually represent a large proportions of examinations 6 ; therefore, they have been used in many of these studies for assessing sensitivity or specificity. Many of them 5 –8,10,12,14 use a plot of sensitivity and specificity known as receiver operating characteristic (ROC) curve and calculate the diagnostic accuracy as the area under the ROC curve (AUC), also denoted as Az. 15 The AUC value represents the probability of correctly classifying a pair of randomly selected images (pathological and normal). 16 –18 This method is a widely used and well established method for assessing imaging techniques, that is, to compare the average accuracy of diagnostics obtained by different human observers interpreting images from different imaging techniques (e.g., magnetic resonance [MR], computed tomography [CT], CR), between them or to a reference technique (e.g., X-ray), to determine which image technique is superior or whether they are equivalent (e.g., to compare imaging techniques of different modalities with different spatial resolutions, image sizes, or physical source). 19 –22 In ROC analysis, the observers select a degree of confidence (score) for the presence of a condition, instead of selecting whether the case is positive or negative. Then, the ROC curve is plotted as the fraction of true positives (sensitivity) against the fraction of false positives (1-specificity) as the decision threshold is changed. To use AUC in the comparison of imaging systems in multireader-multicase studies, statistical analysis of variance (ANOVA) is required, 22 –24 for which several methods exist, as evaluated by Hillis. 25
The purpose of this study was to compare the diagnostic accuracy of three differently priced devices for digital capture of X-ray films (i.e., a specialized digitizer, a conventional scanner, and a digital camera) in the detection of three pathologies that are difficult to identify on chest radiographs. The gold standard in the above-mentioned studies was established from X-ray radiographs. However, in this study, the gold standard was established from CT, as the accuracy for the selected pathologies is greater with CT than with plain X-ray.
In the preliminary stages of this study, the image quality resulting from each device was evaluated in terms of spatial resolution, gray level, contrast, and geometric deformation (using standard test patterns); since no significant differences were observed, the hypothesis to evaluate was the three tested devices have the same diagnostic accuracy (each device with their own and different characteristics: CCD arrays, scanning resolution, etc.).
Materials and Methods
This study used a treatment-by-reader-by-case factorial design 17,26 in which each case (i.e., chest X-ray) underwent each of the treatments (i.e., digitization by three devices) and the resulting images were observed once by each reader (i.e., six radiologists).
Study population
Outpatients and emergency patients (men and women) who visited the Fundación Santa Fe de Bogotá (FSFB), Bogotá, Colombia, between November 2007 and June 2009 for pathological evaluation by chest X-ray were included in the study (chest X-ray represent >50% of examinations in FSFB). Chest X-rays cases were randomly selected, without repetitions and were included in the sample when a CT was available to establish the condition status of the case (i.e., positive or negative) as CT was set as the gold standard.
Observed variables
For effectiveness evaluation purposes, Grigsby proposed to select a limited number of conditions according to the following criteria: high incidence, difficulty to diagnose, have subtle findings or symptoms, have significant adverse outcomes if delayed diagnosis or misdiagnosis, and result in a large burden of suffering. With these well-selected marker conditions, the result can be then generalized. 27,28 According to these criteria, the selected conditions for this study, and as used in other studies, 2,6,7,14 were interstitial opacities, pneumothorax, and nodules.
Most studies only assess the accuracy (in terms of sensibility, specificity, or AUC) for the detection of selected conditions. With this purpose, in this study, three main variables were defined to calculate AUC: the confidence level for the presence of interstitial opacities, pneumothorax, and nodules. These variables could take the following scores: 0-definitely absent, 1-probably absent, 2-cannot decide, 3-probably present, and 4-definitely present.
In this study, we also used four secondary variables to calculate the precision in classifying other pathological aspects: interstitial opacities distribution, interstitial patterns, nodule size, and percentage pneumothorax size (quantified by the Collins' method) 29 and, finally, one variable to select whether or not “it was easy to select the score” based on the image quality.
Sample size
To determine the sample size, the accuracy table proposed by Obuchowsky 30 with regard to AUC was used, according to the following criteria: (a) the expected accuracy was greater than 0.8; thus, the high accuracy category of the table (AUC >0.9) was selected; (b) in accordance with our hypothesis, the expected difference between the AUC values was moderate (0.1); (c) the ratio of pathological and normal cases in the test was 1:1; and (d) moderate interobserver variability (0.05) was expected. The table indicated that, for six readers, the sample size should be 39 cases; however, as stated by Kundel, 12 the images used in these tests are usually highly selected and, in the absent of a representative sample, it is impossible to extrapolate the results to the clinical population. To have a large representative sample and guarantee that at least one case for each secondary variable was included, the sample size was increased from 39 to 136 cases (see distribution in Tables 1 and 2).
Normal and Pathologic Cases Used in This Study Listed by Disease Category
Interstitial Opacities Cases by Distribution/Interstitial Patterns
Readers
The readers were six FSFB radiologists classified according to their total work experience as a radiology specialist: senior faculty (10 years), junior faculty (5 years), and fellows (1 year). Two radiologists from each category were selected as readers.
Capture devices
Each X-ray film was digitized using the following devices: (a) an iCR-612SL (iCRcompany, Torrance, CA) film digitizer, hereafter referred to as ICR, with a maximum spatial resolution of 875 dpi (29 μm pixel spot size), 16-bit grayscale, an optical density (OD) of 3.6, Twain protocol, a light box, and a cost of US $15,000; (b) a PowerLook 2100XL (UMAX Technologies Inc., Dallas, TX) flatbed scanner, hereafter referred to as UMAX, with a maximum spatial resolution of 800 dpi (32 μm pixel spot size), 8-bit grayscale, an OD of 3.4, Twain protocol, and a cost of US $1,600; and (c) a Lumix DMC-FZ28 (Panasonic Corporation of North America, Secaucus, NJ) digital camera, hereafter referred to as LUMIX, which is a 10-megapixel camera with an aspherical lens, a focal length of 4.8 to 86.4 mm, a minimum focal distance of 30 cm, a 1/2.33″ CCD, 100–6400 ISO, manual settings (for aperture, exposure and ISO), black/white (BW) mode, and a cost of US $450.
Capture and display software
The AndesPACS software, which had been developed at the Universidad de Los Andes by one of the authors of this study, was used to digitize, store, and display the cases according to the DICOM standard. This software has the following image manipulation functions that can be used according to the reader's criteria: brightness/contrast, window/level, gamma, negative/positive, filters, zoom, rotation, flip, and measurements. The software was modified as follows to suit the needs of the present study: the radiologist was blinded to the patient's identity and pathology and to the digitizer used, and a data entry form was incorporated (Fig. 1) to force the radiologist to select a value for each study variable and to allow him to mark the case as “read” and move on to the next case, with denied access to all “read” interpretations. The software was run using a server that allowed the radiologists to work at their normal pace.
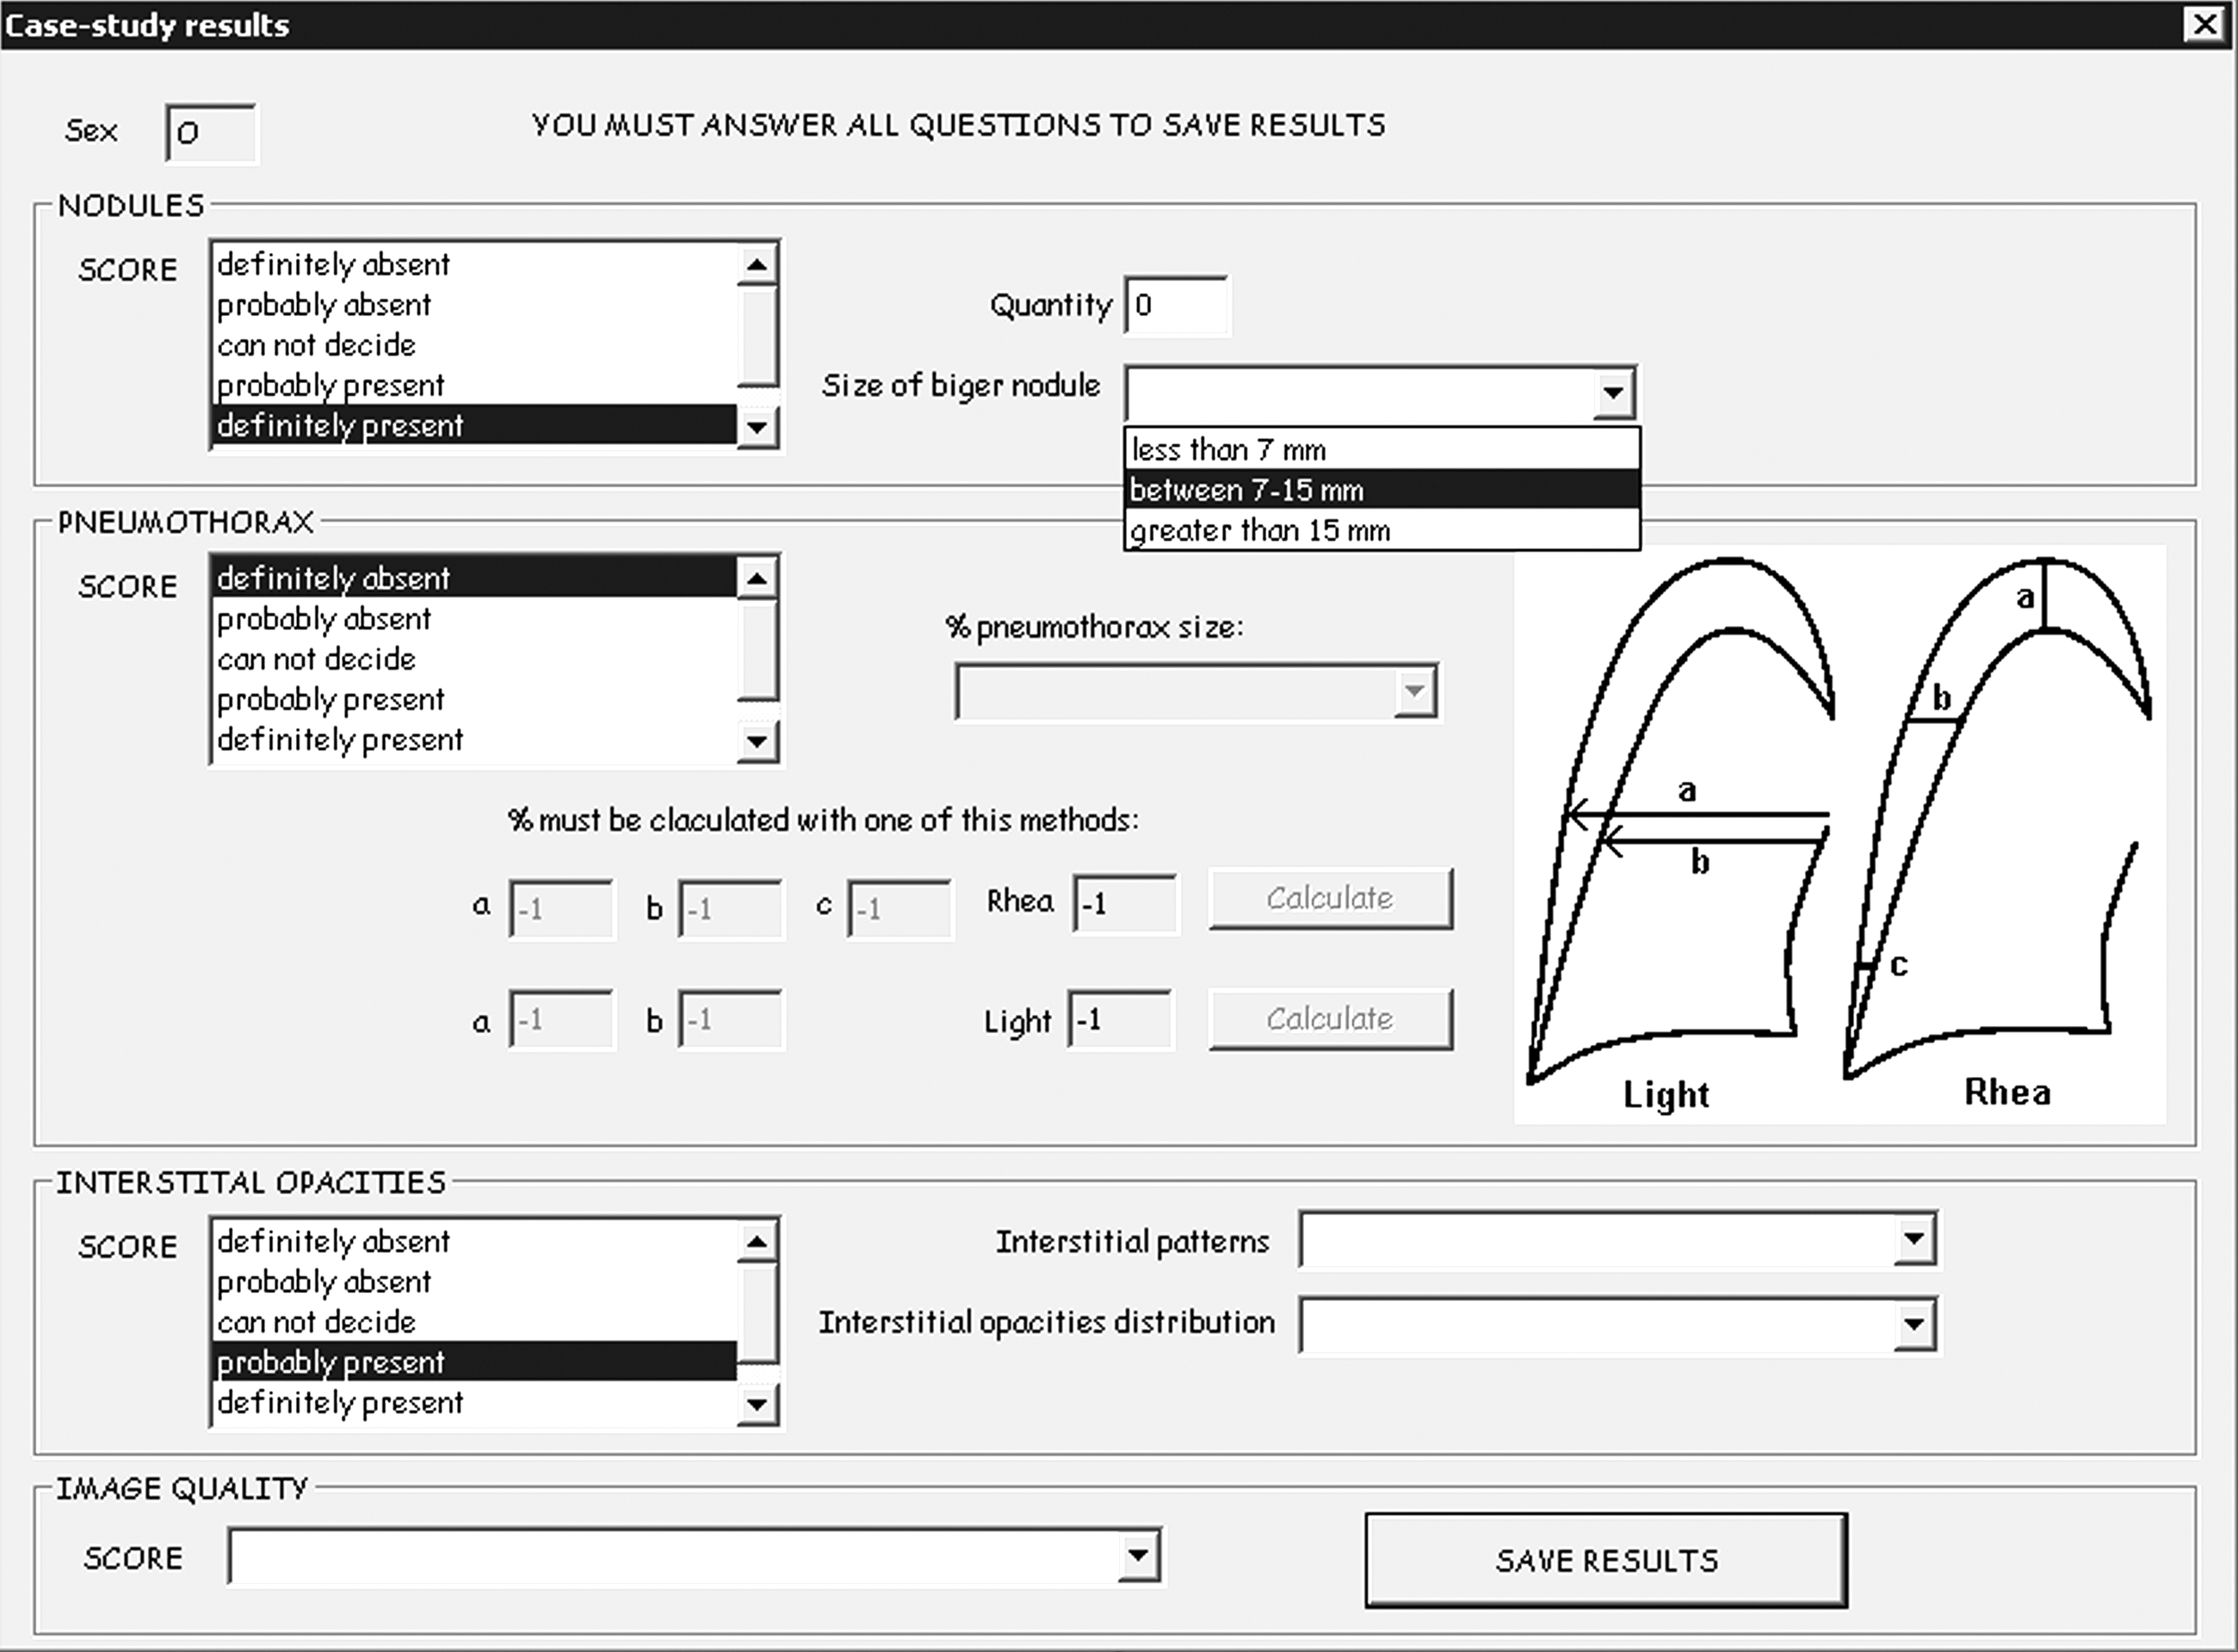
Data input form.
Display station
According to the American College of Radiology standard for teleradiology, 31 digitized films should be visualized on a monitor with a large matrix, minimum 10-bit grayscale, 50 ft-L luminance (171 cd/m2), and 2.5 lp/mm (lines pairs per millimeter). On the other hand, the DICOM standard recommends the use of monitors with a 500-cd/m2 luminance. Thus, an NEC MD213MG monitor (dot pitch 0.21 mm, 3 megapixels and 1,024 grayscale) was selected for this study.
Procedure
The cases were printed on 14×17″ films, excluding any data that could be used for patient identification. They were then digitized at 375 dpi using the two scanners: for ICR (6,488×5,248 matrix), the exposure option for “Normal” films (between light and dark) was selected, and for UMAX (6,375×4,500 matrix), the “Automatic” exposure option was selected, as manual adjustments are difficult with this device. Finally, the films were photographed with LUMIX at 10 megapixels (3,648×2,736 matrix), using the intelligent aperture mode (automatic aperture adjustment, exposure time and ISO, with priority given to the aperture adjustment), BW, auto white balance and auto focus, without flash, in a dark environment, at a distance of 50 cm. The camera was supported on a specially designed structure to guarantee alignment between the camera and light box. The films were covered with a photomask to block out the light from the light box outside of the film. The exposure value (EV) compensation is the most sensitive parameter to change manually and was adjusted to the point where the image histogram distribution had the most pixels in the grayscale center. The majority of the photographs were taken with a manual adjustment of 0 to +1/3 EV, and other settings were adjusted by the camera automatically: focal length of 7.6 to 8.2 mm, aperture of F/3.0 to F/3.2, exposure time of 1/40 to 1/30 s, and ISO of 100 to 160. For all of the devices, the entire film was digitized and stored in DICOM format and 8-bit grayscale, without compression.
The digital camera was used at the maximum resolution (equivalent to 197 dpi for the picture conditions) that was superior to the requirements of the American College of Radiology for teleradiology (i.e., 2.5 lp/mm). The other devices could also have been used at the same resolution; but in that case, their accuracy would have been decreased, unnecessarily affecting the results of these devices. Thus, appropriate resolutions for transmission in developing countries low networks were used. As just explained, the ROC approach is well applied to compare imaging techniques of different characteristics. This was the strategy used in the treatment-by-reader-by-case factorial design of this research: each plain X-ray underwent very different treatments (i.e., digitization by three devices with very different specifications). 22,25 Other studies also compare devices of different characteristics (e.g., spatial resolutions, compression method). 5,7,10,11,14 Whatever the devices used, adjustments to generated images were made by the radiologists, according to their criteria, using the software tools (filters, gamma, B/C, W/L).
The interpretation of the data was carried out over a 6-month period in 2-h sessions for each radiologist. A 2-month interval between two cases for the same patient was established to avoid recall.
Data analysis
For the purpose of statistical analysis of main variables, the DBM-MRMC 2.2 software, 32 which had been developed by Dorfman-Berbaum-Metz based on multireader-multicase ROC ANOVA, 33 –36 was used. Parametric binormal adjustment 37 with contaminated binormal model 38,39 was selected. The DBM-MRMC software uses F statistic distribution and p-values with a two-sided 5% statistical significance for AUC comparisons.
For analysis of the main variables, ROC curves were plotted, and AUC values were estimated for each device by the DBM-MRMC software. The hypothesis of the equality of average AUC for all three devices was evaluated. To evaluate the quality variable, the proportion of treatment cases labeled as “It was easy to select the score” was determined. For the secondary variables, the proportion of correctly classified cases was analyzed. For all estimations, standard error (SE) and a two-sided 95% confidence interval were calculated.
Results
All of the results that are presented were obtained from 2,448 observations (i.e., 3 devices×6 radiologists×136 cases).
Main variables
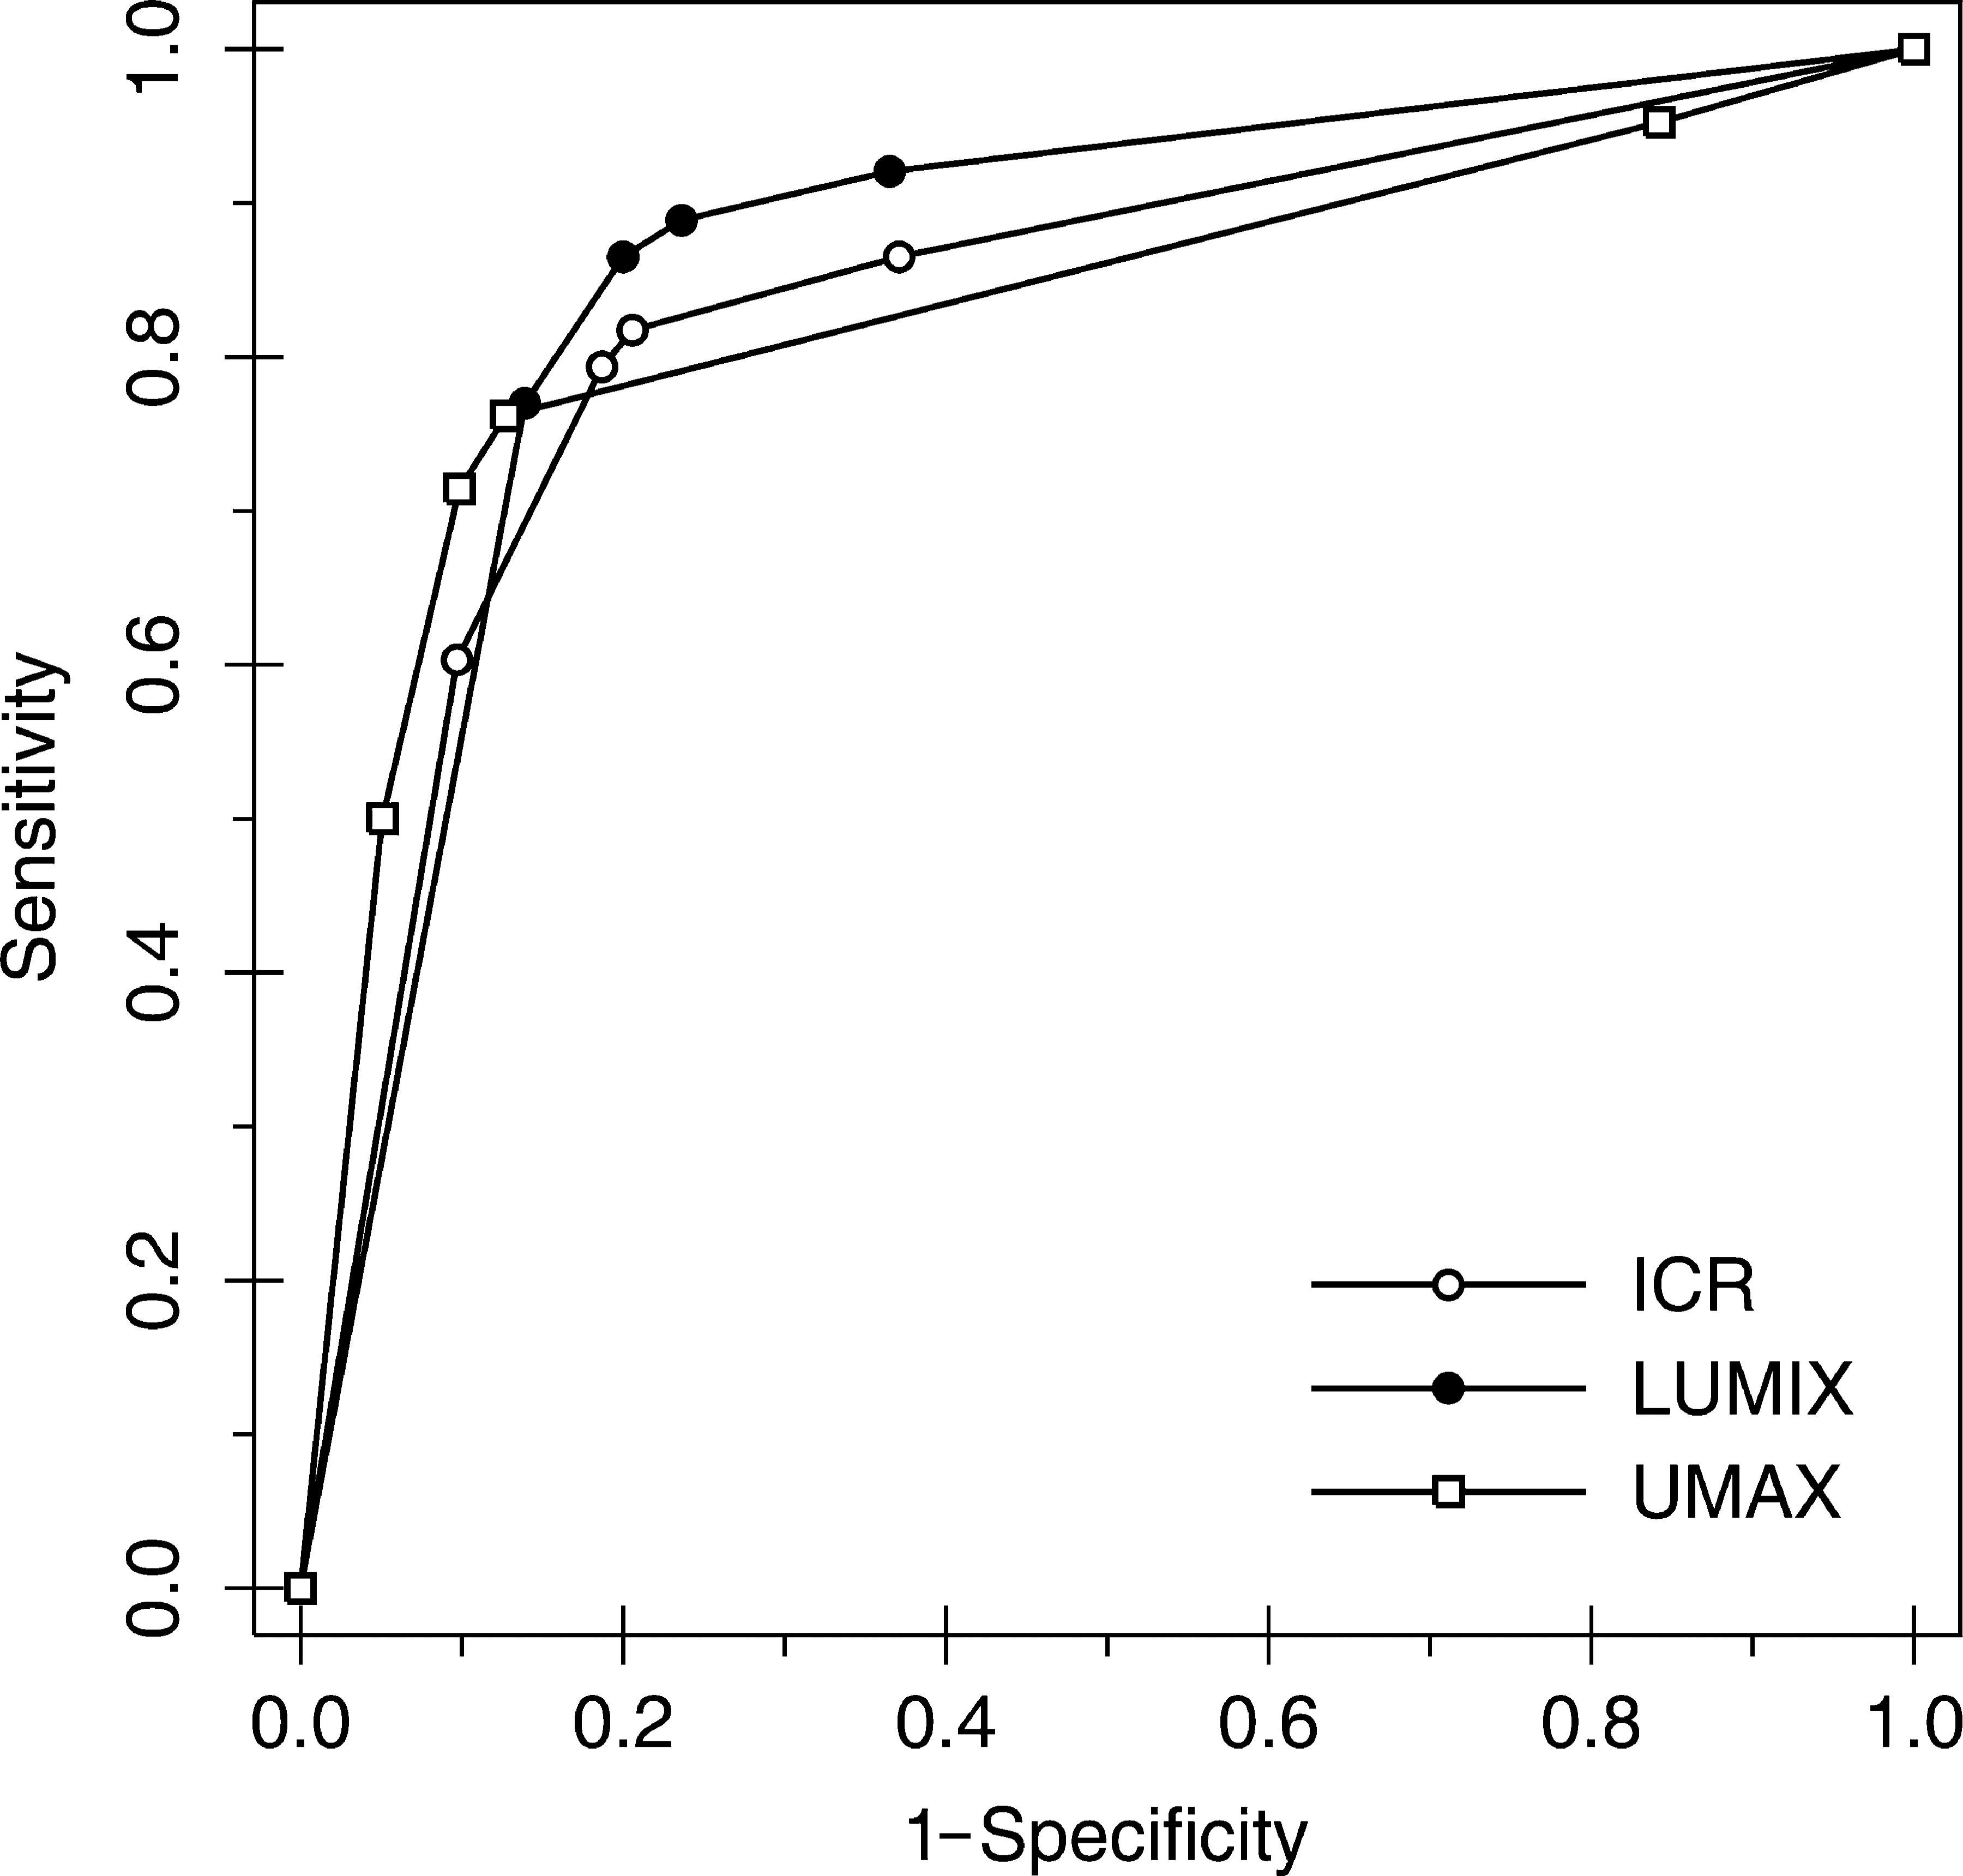
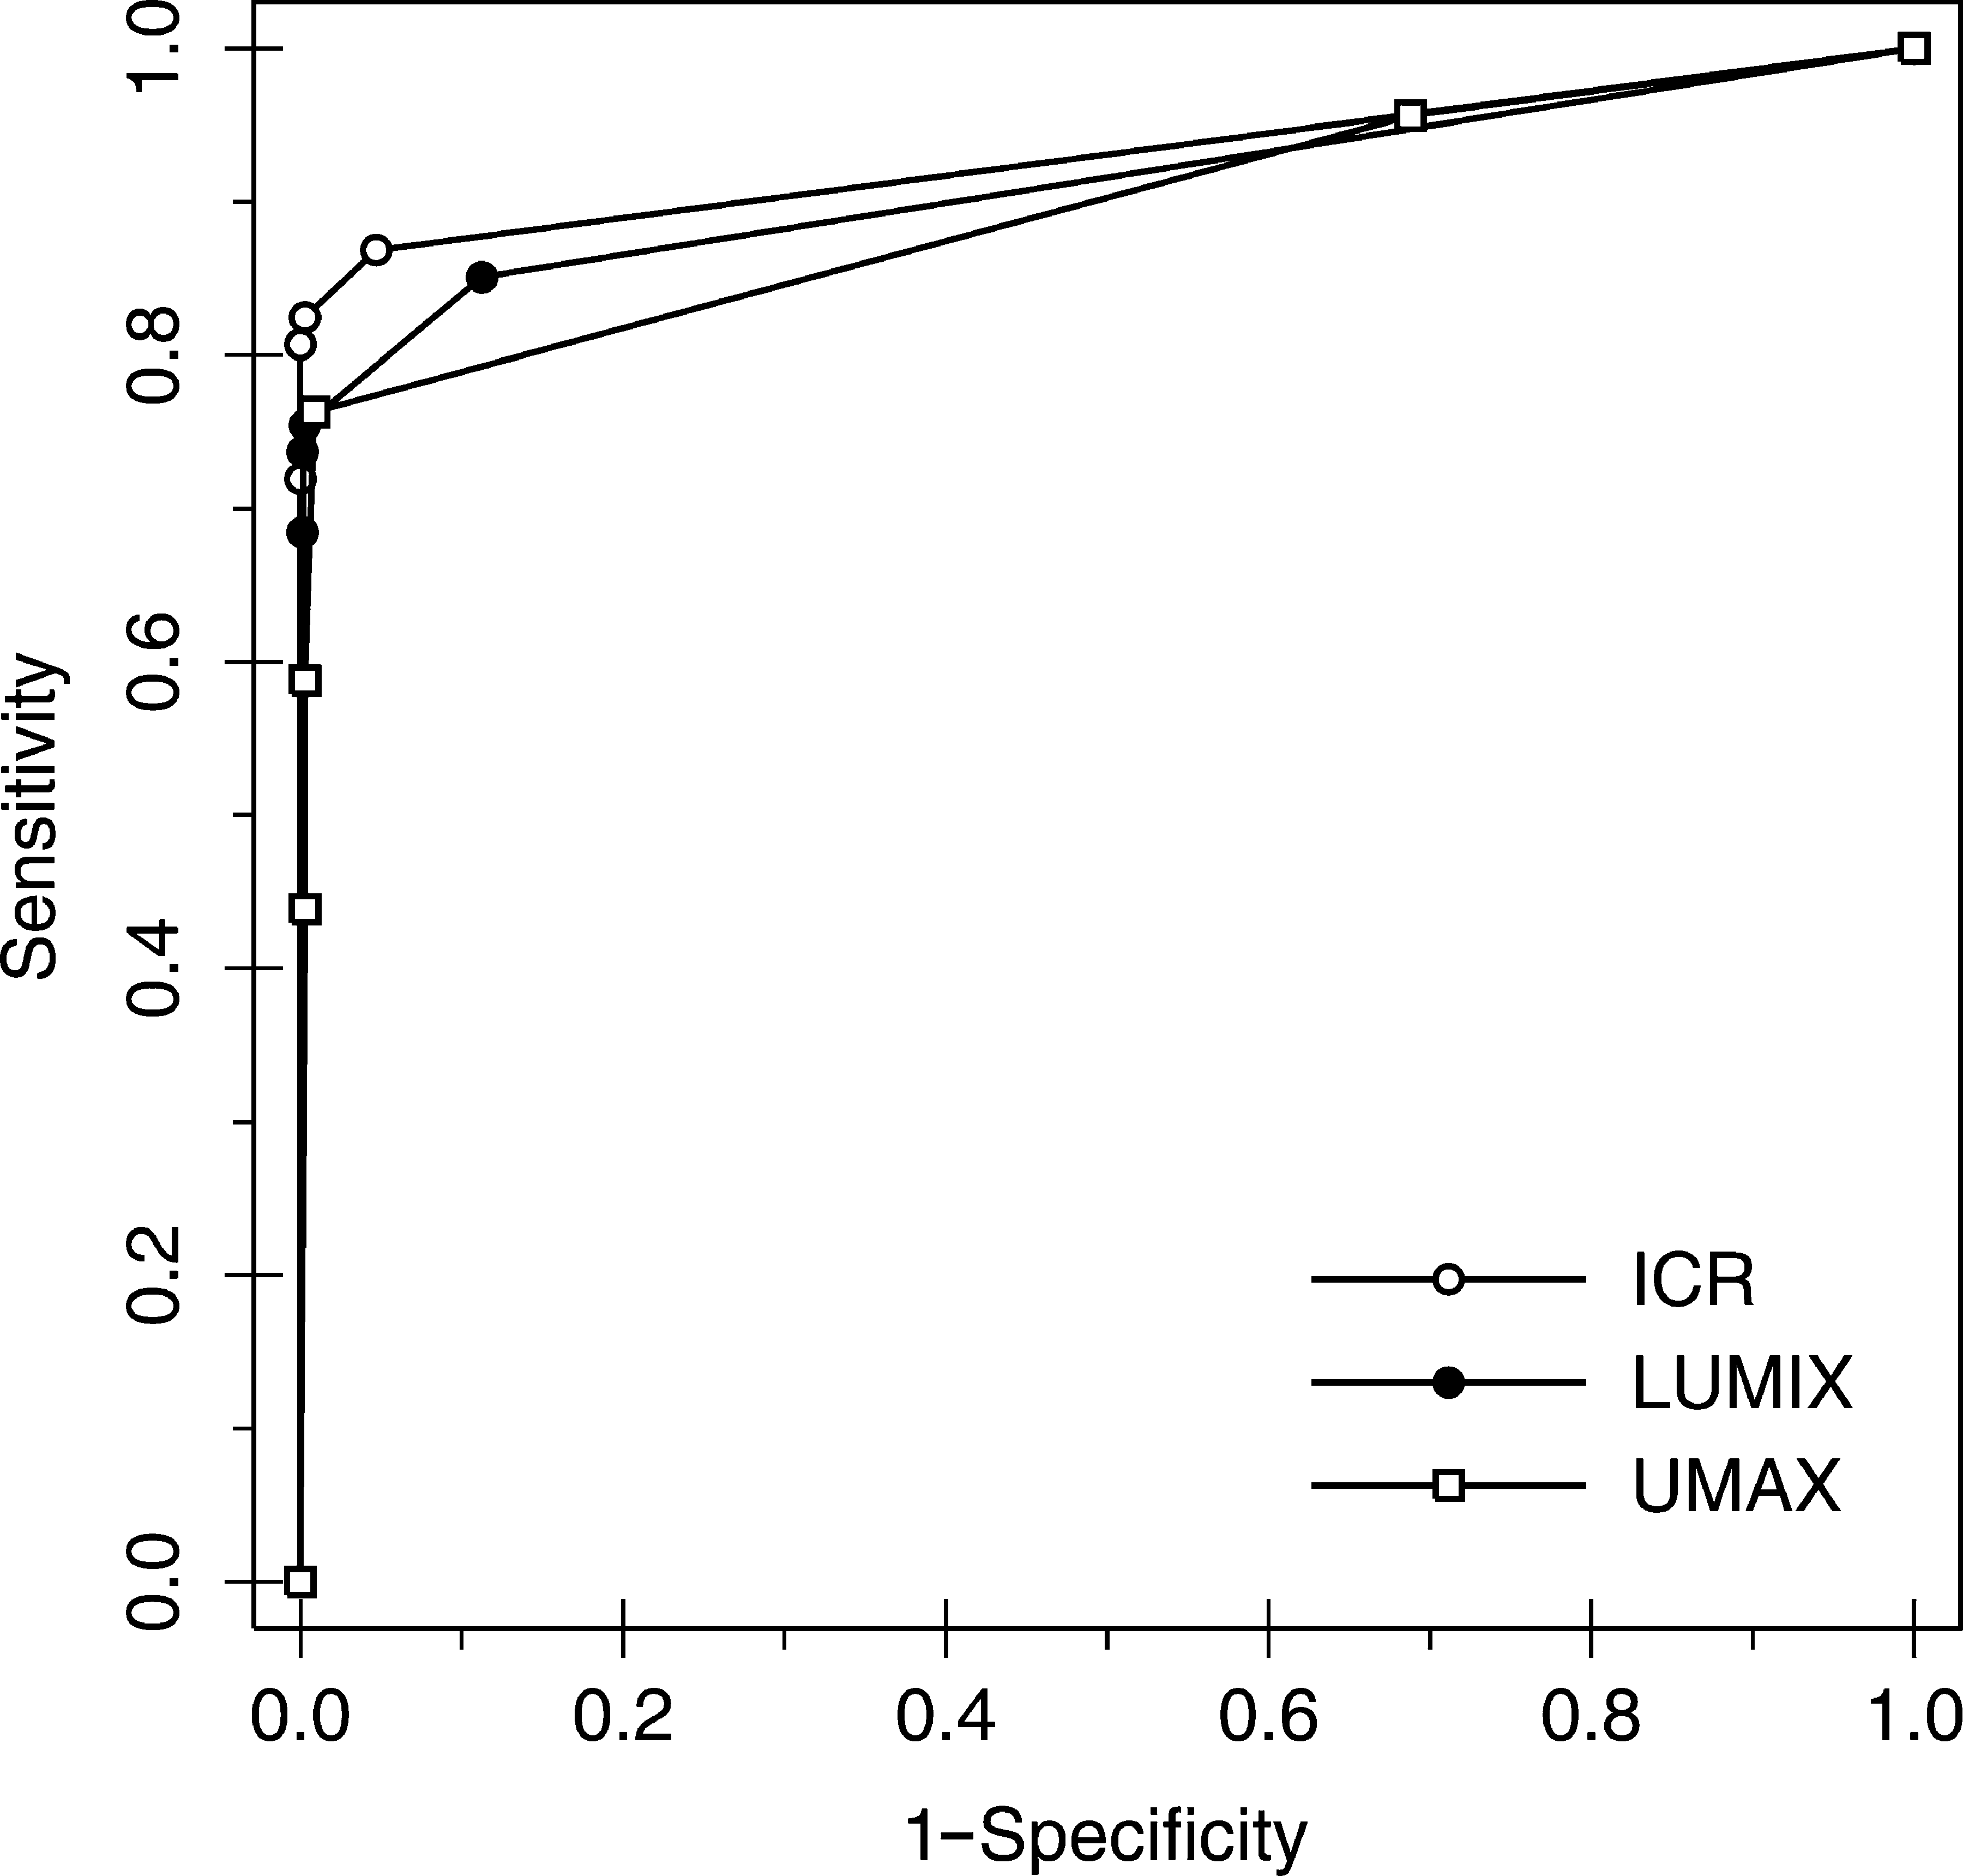
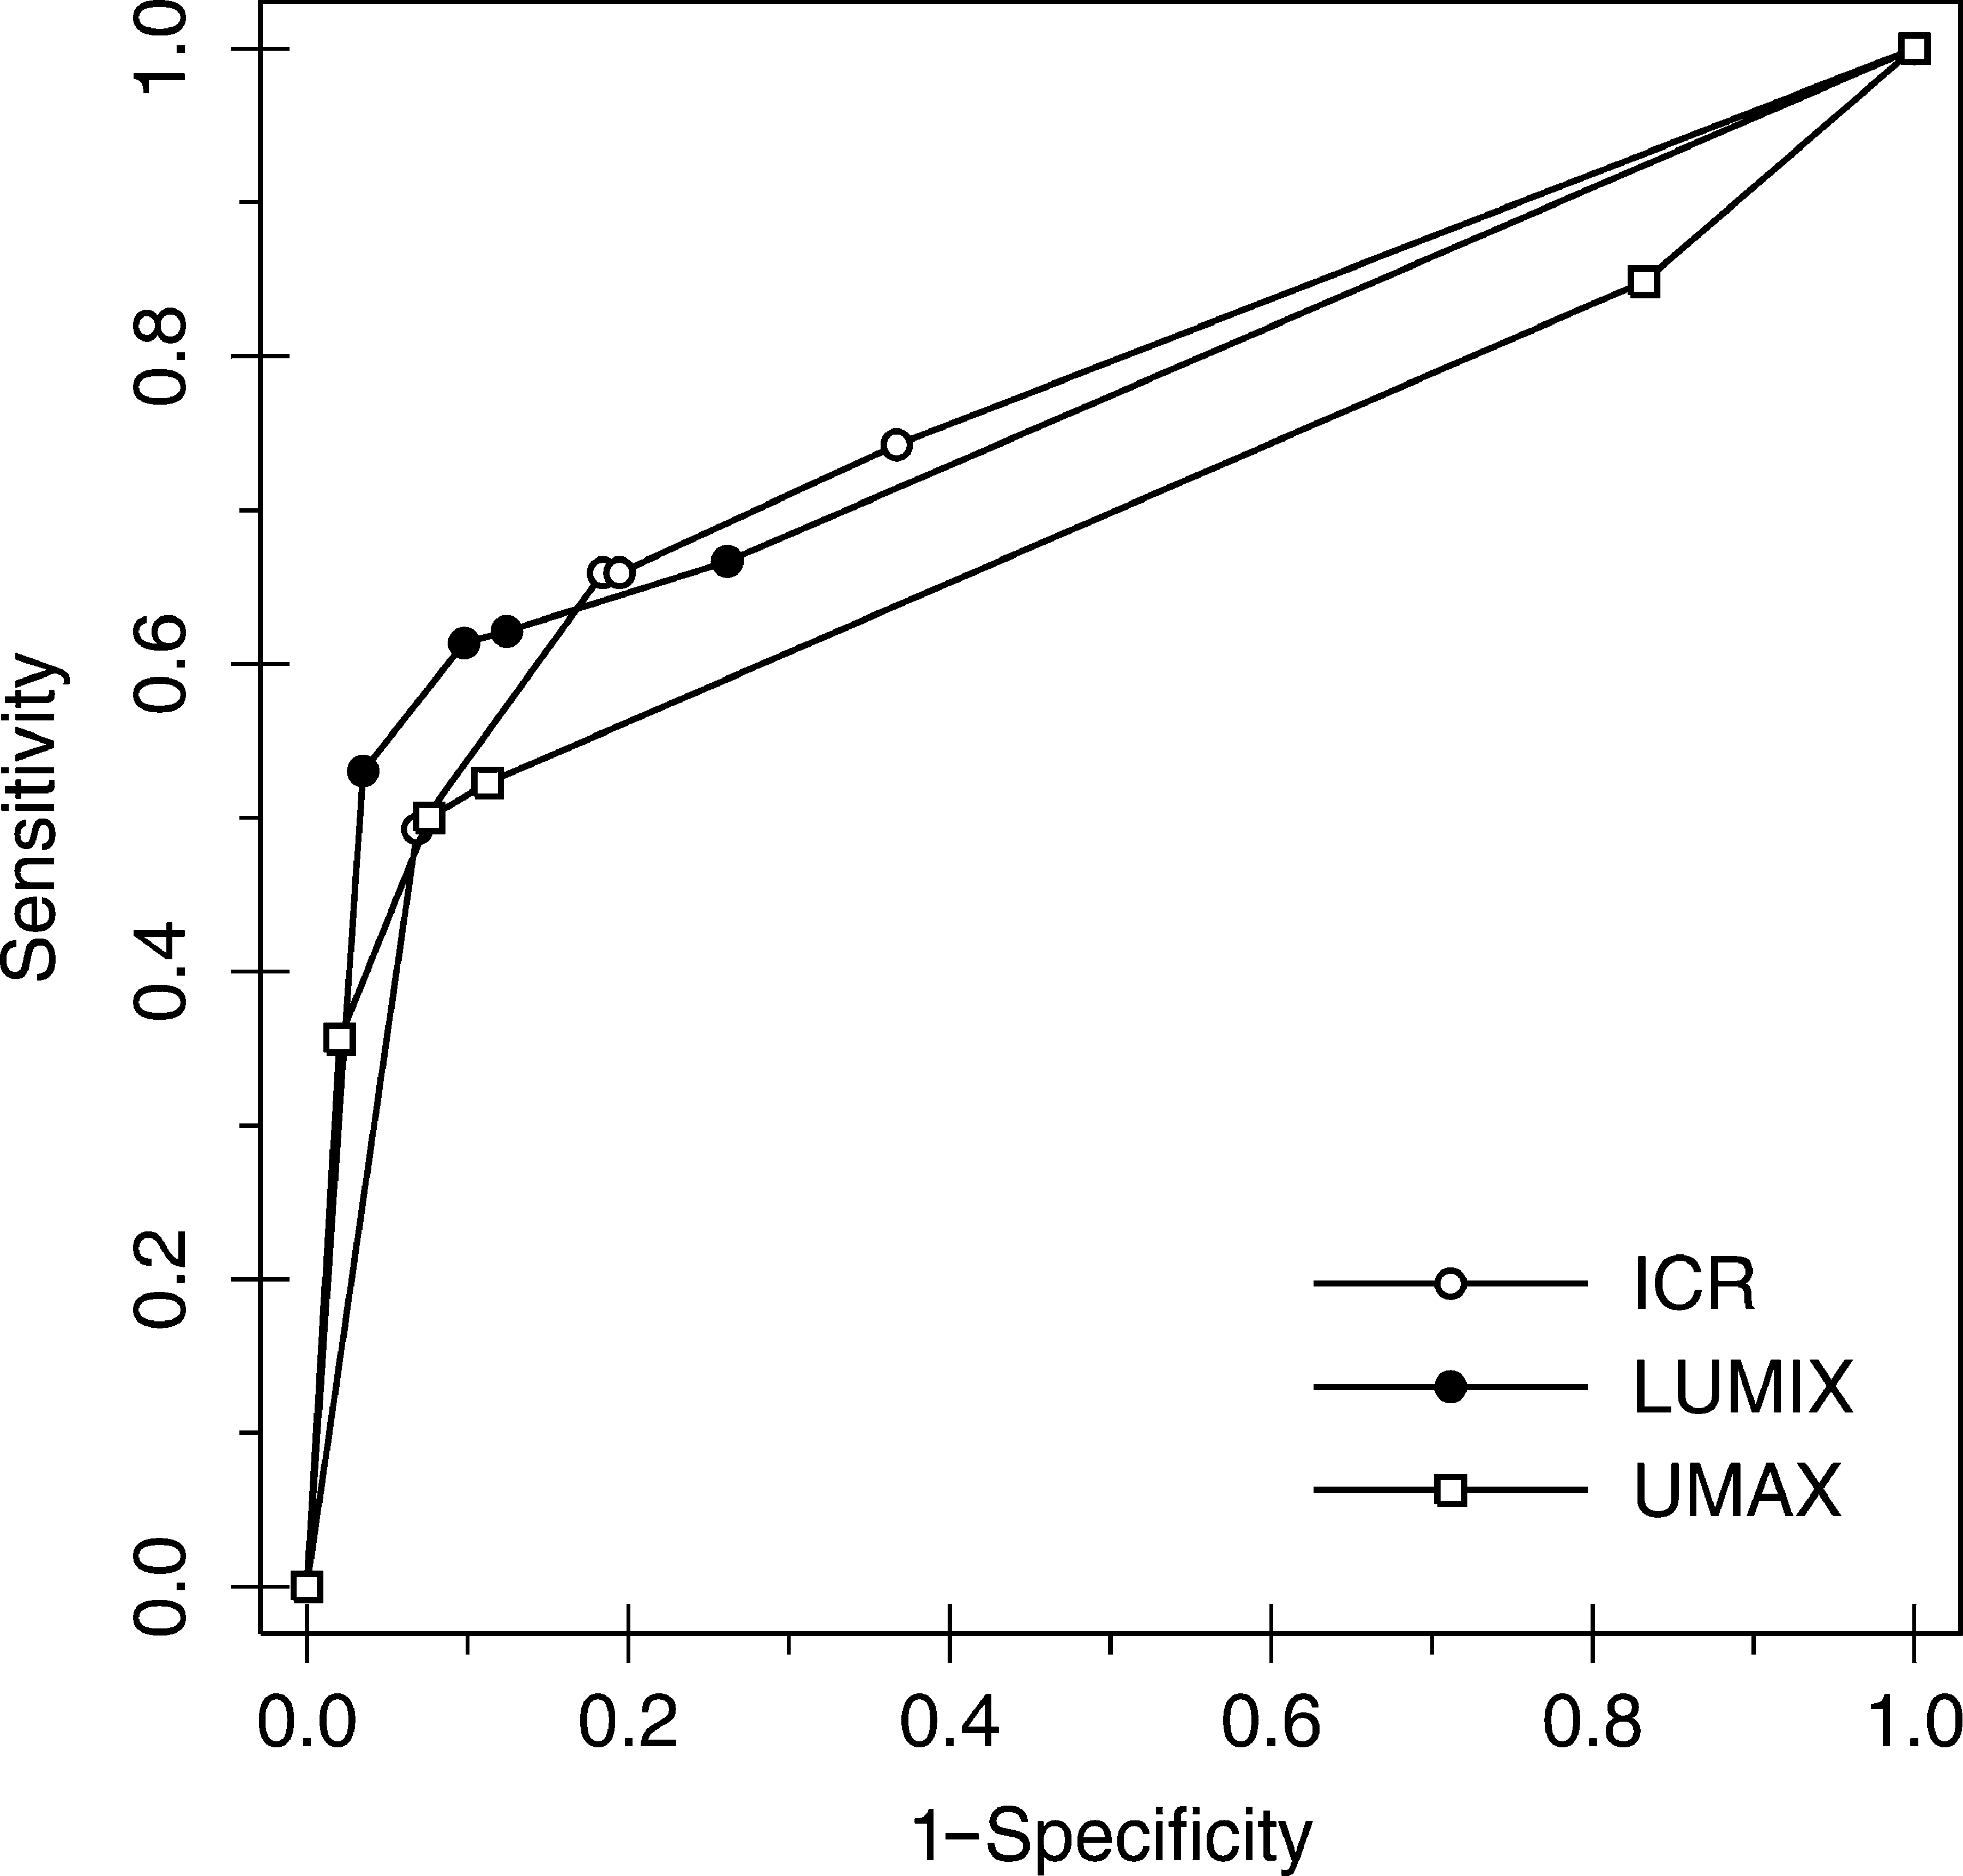
The ROC curve forms for each device and pathology (and for mixed pathologies) were very similar (Figs. 2 –5). Table 3 shows the statistics provided by the DBM-MRMC software that allowed us to analyze the equal accuracy hypothesis for each device classified by pathology: there was no significant difference in accuracy between the devices for any comparison (i.e., p>0.05 in all comparisons).
Graph of ROC curves for interstitial opacities by device. Nonparametric (empiric) ROC curves are shown. ROC, receiver operating characteristic.
Graph of ROC curves for pneumothorax by device. Nonparametric (empiric) ROC curves are shown.
Graph of ROC curves for nodules by device. Nonparametric (empiric) ROC curves are shown.
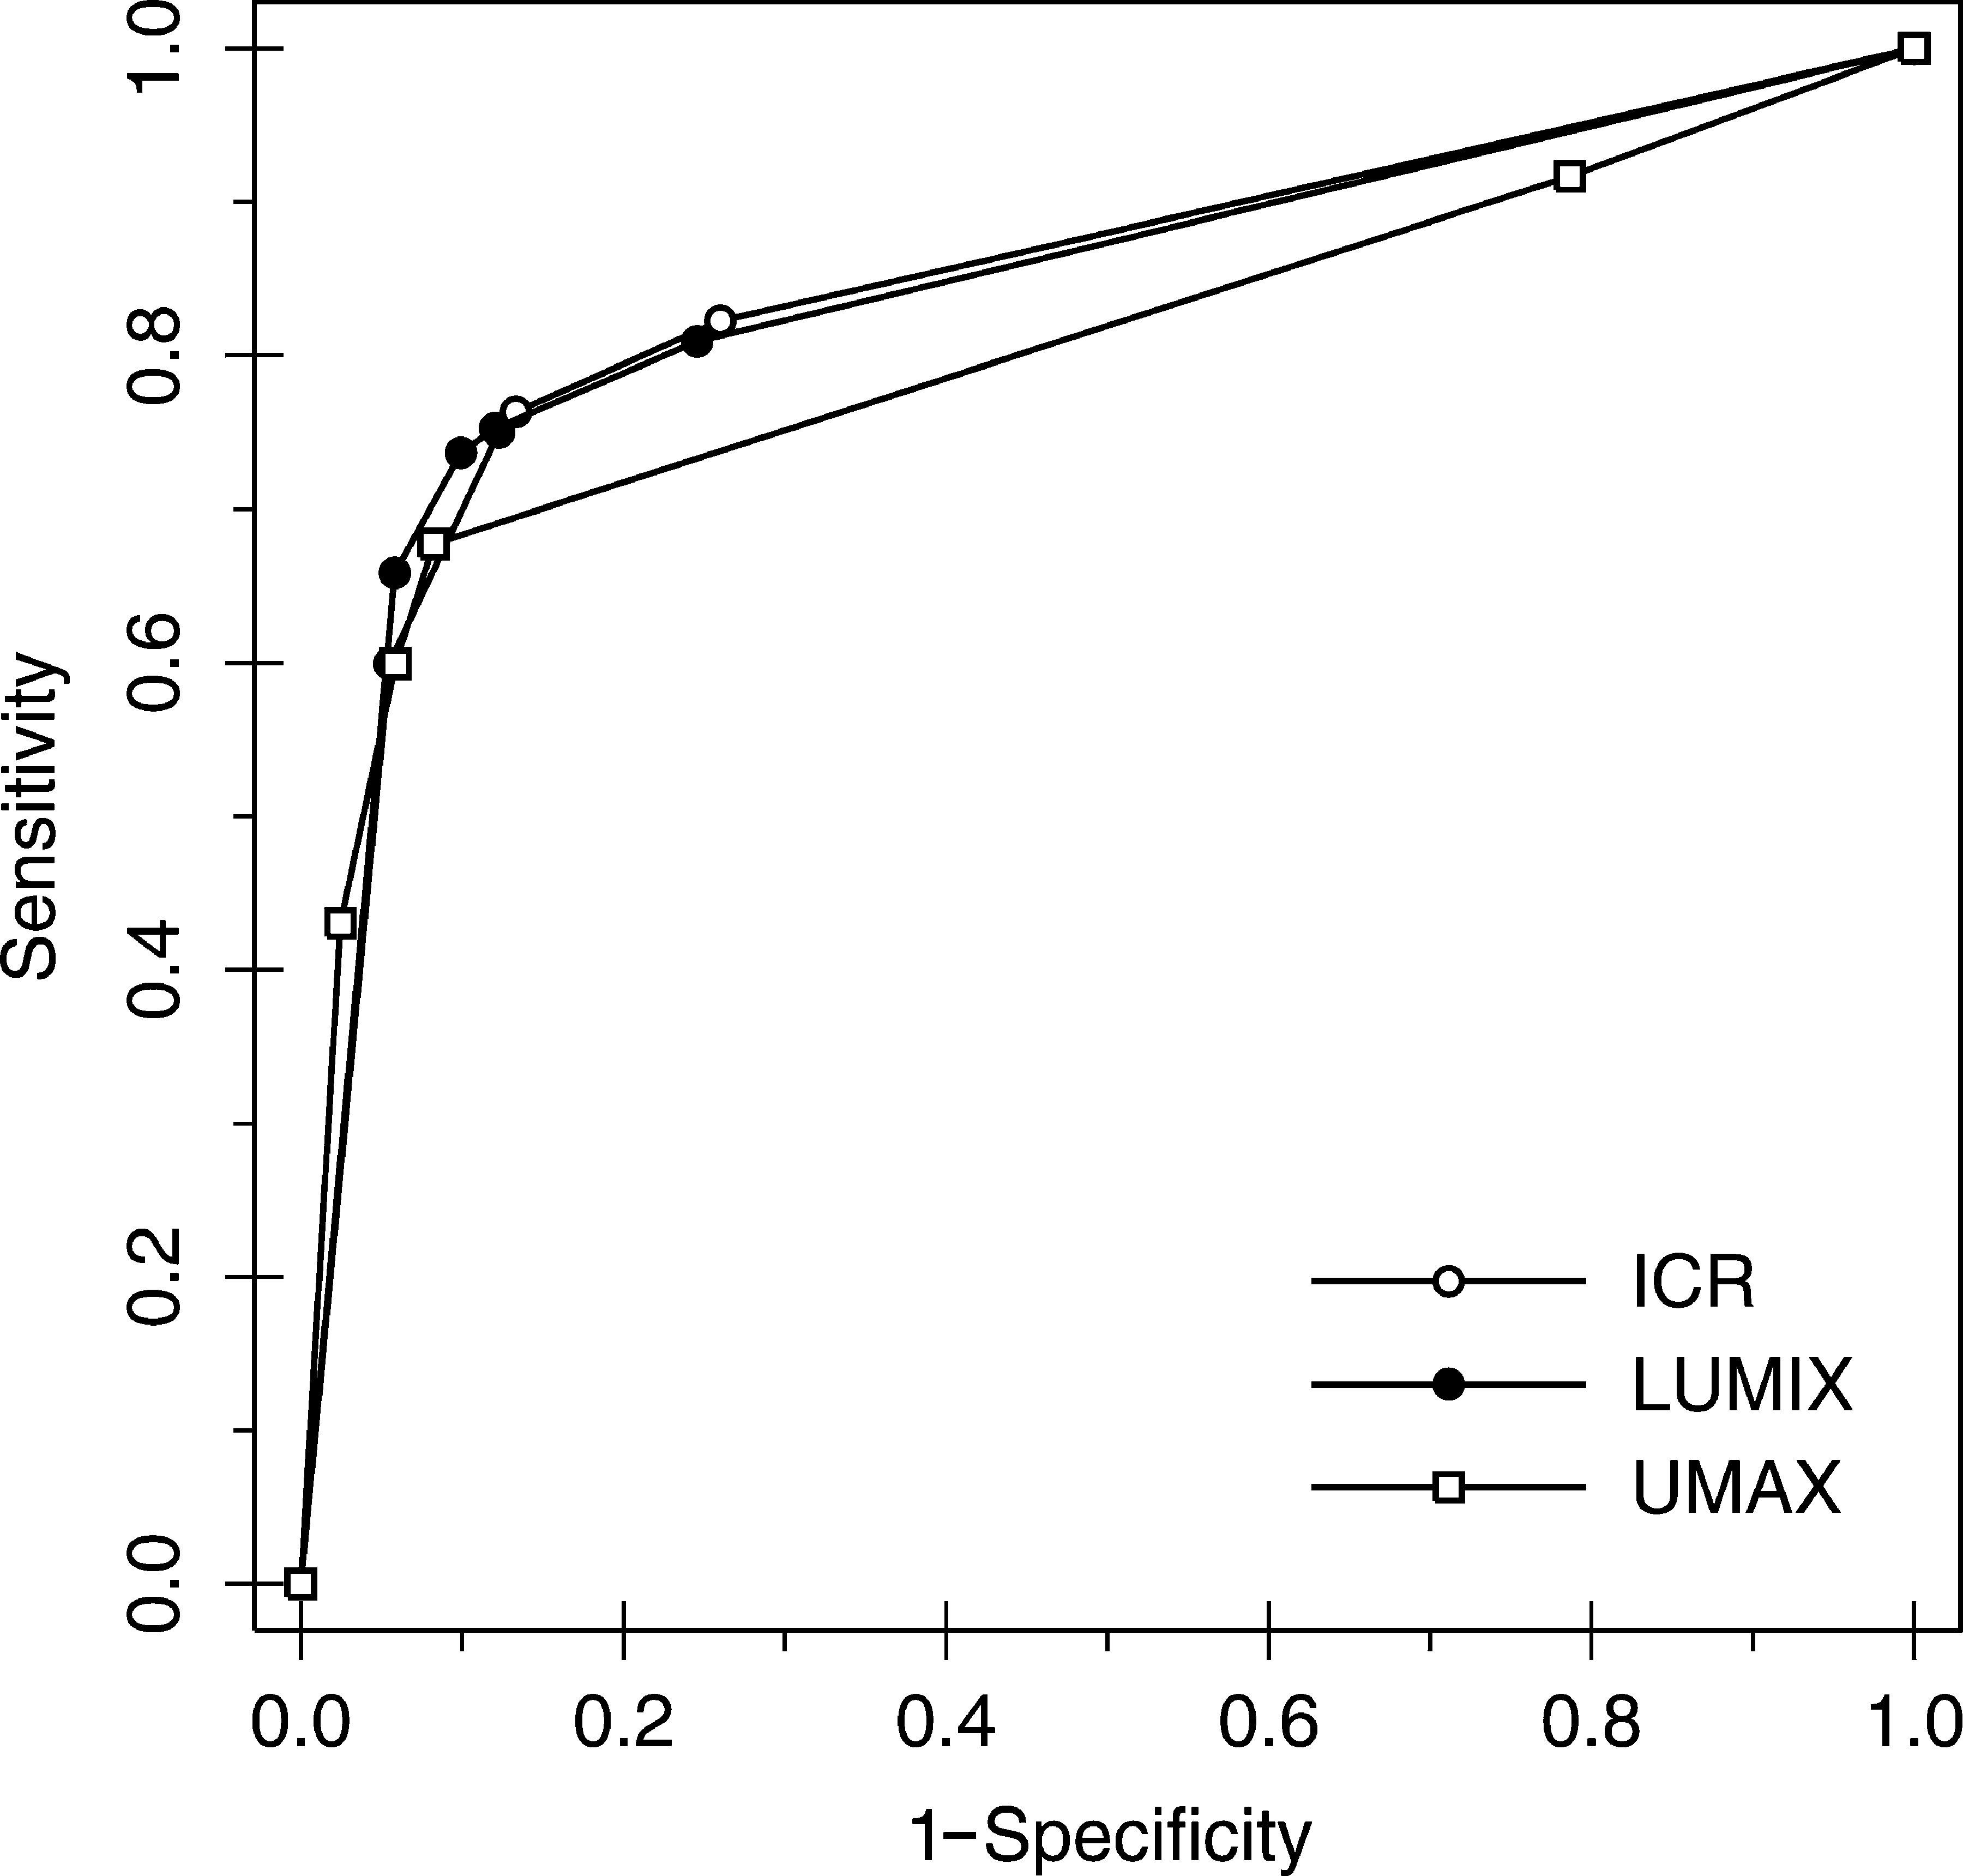
Graph of ROC curves for any pathology by device. Nonparametric (empiric) ROC curves are shown.
Figure 6 shows the overall ROC curves for each pathology of mixed devices. The three curves greatly differed in form and AUC. The greatest accuracy was achieved for the pneumothorax (AUC=0.9139, SE=0.0108), followed by interstitial opacities (AUC=0.8443, SE=0.0115), and finally nodules (AUC=0.7468, SE=0.0154), with significant differences between them. The lowest reader variability for AUC 26 was 0.06 for infiltrates with LUMIX, and the highest was 0.27 for nodules with ICR.
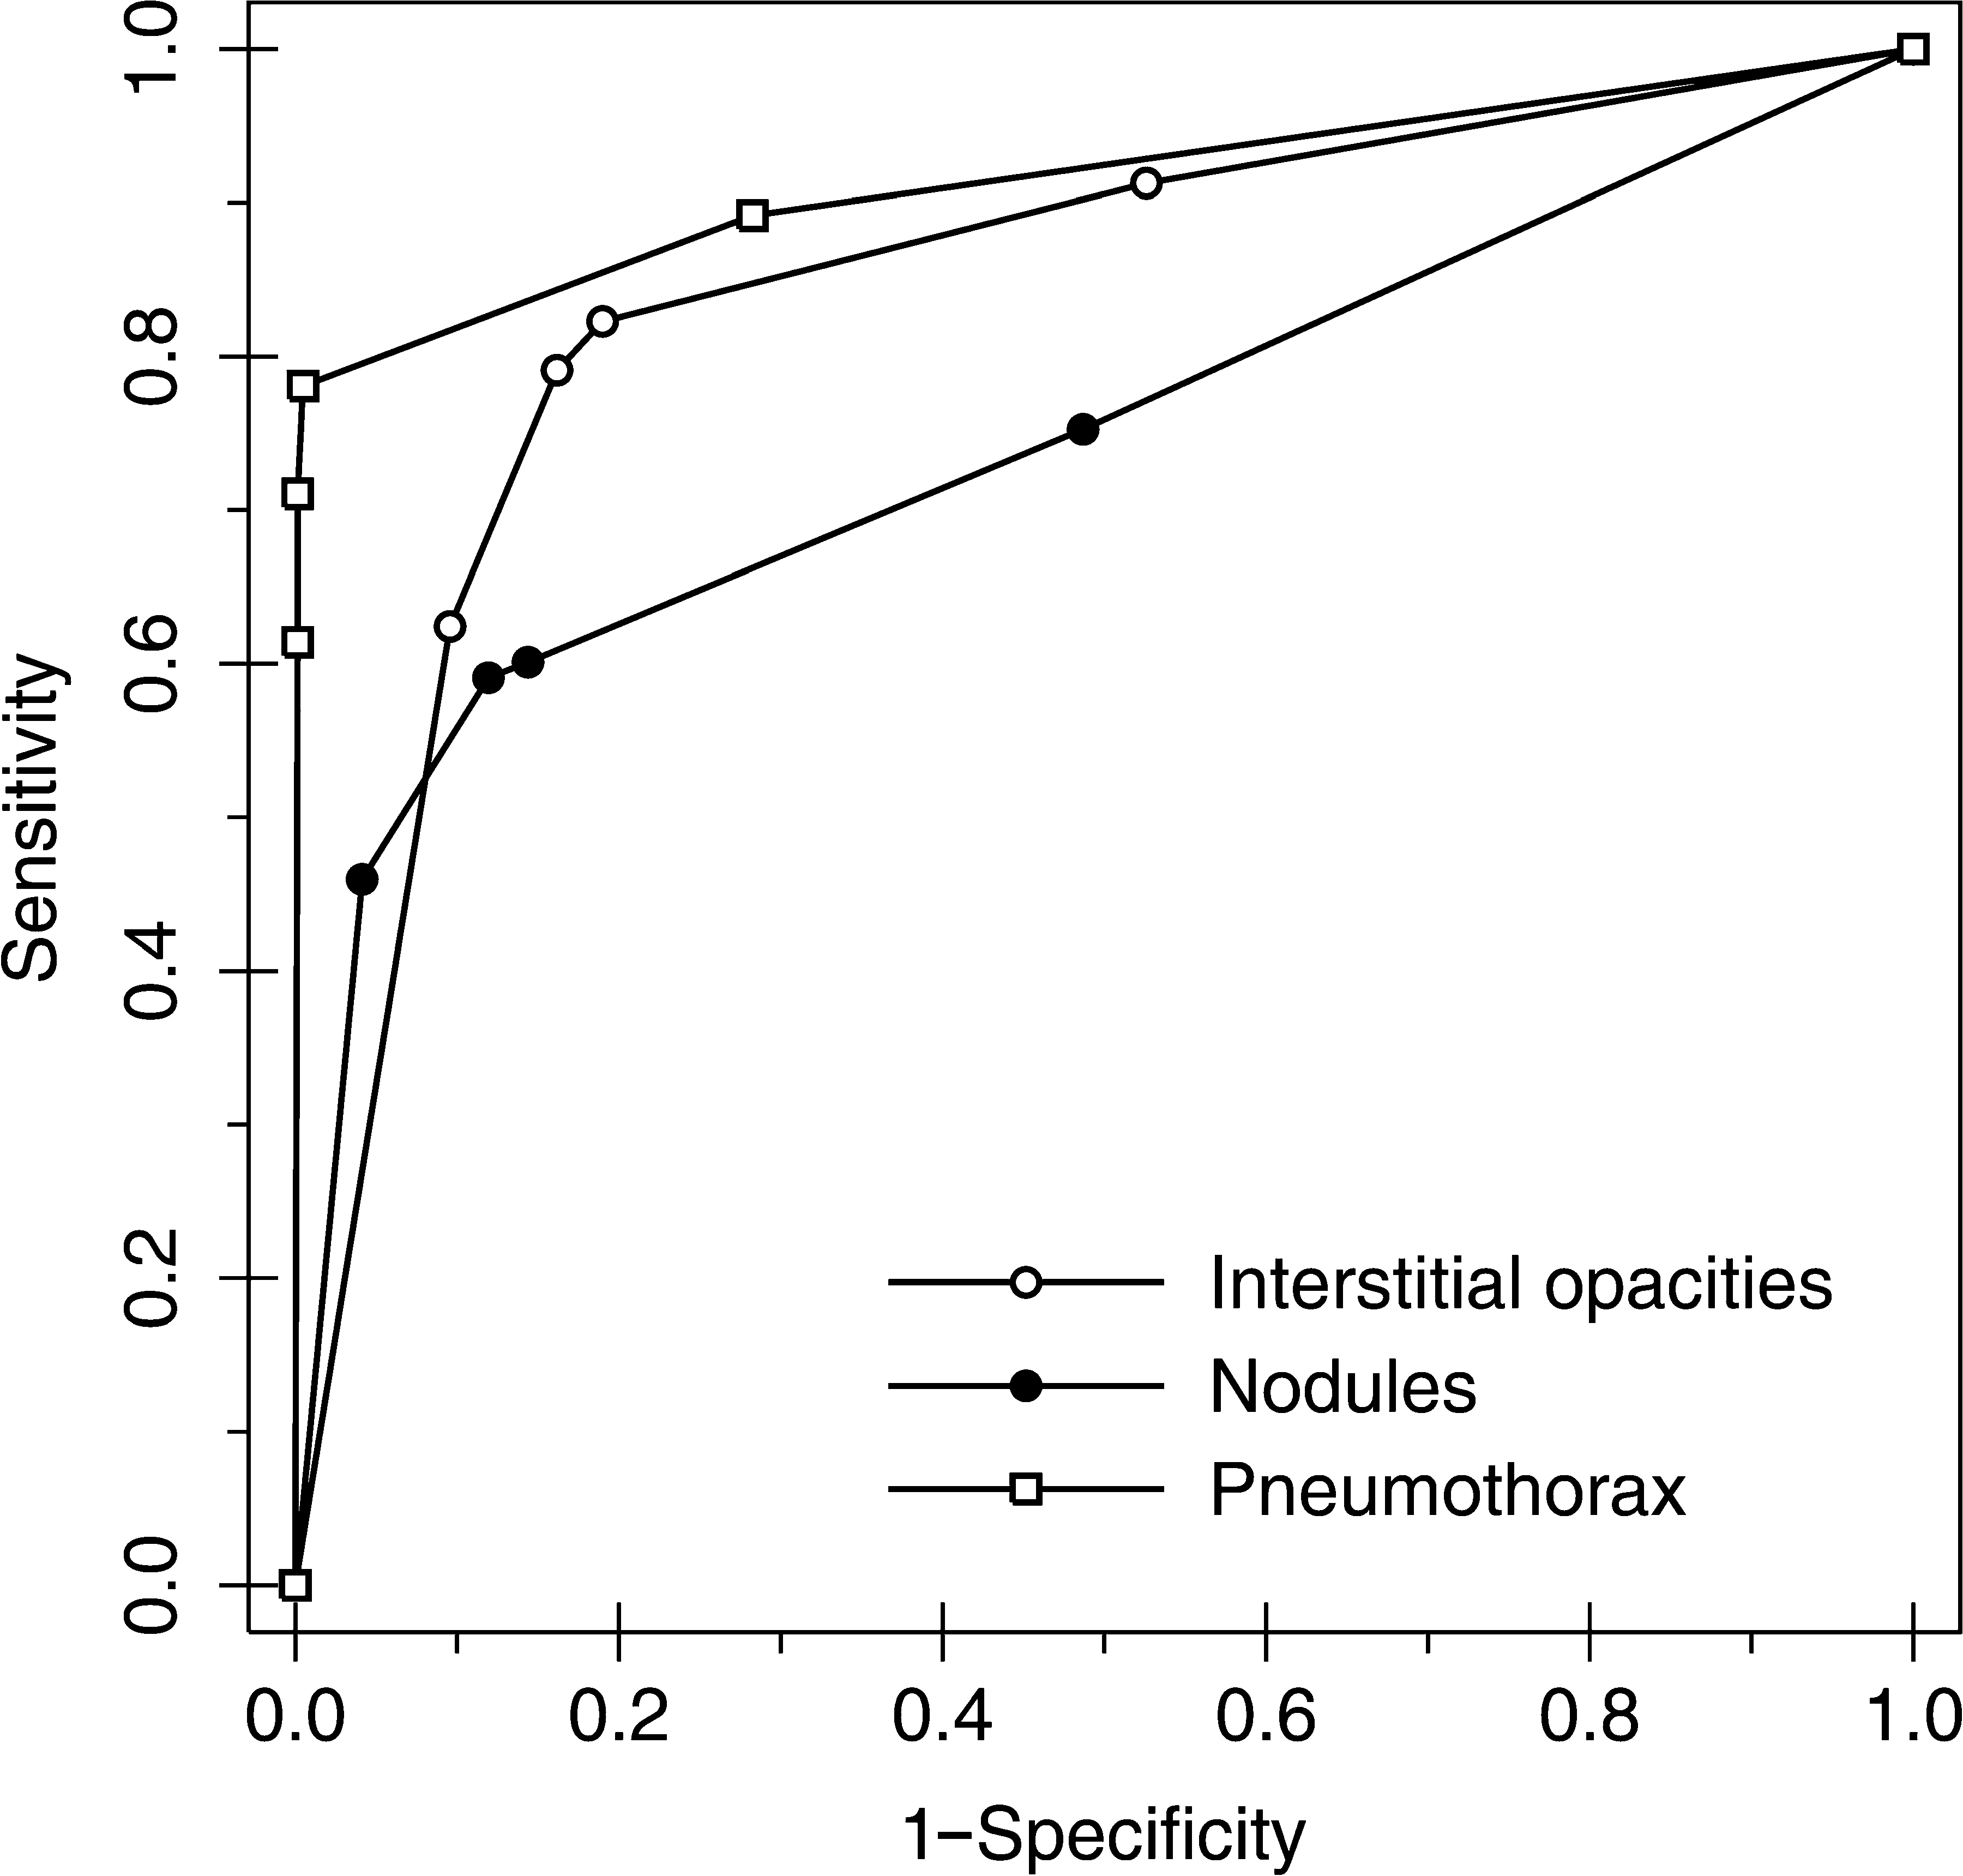
Graph of ROC curves for all cases by pathology. Nonparametric (empiric) ROC curves are shown.
Comparison of Area Under Receiver Operating Characteristic Curves for Each Device Classified by Pathology
AUC from binormal model and fixed readers.
The hypothesis Ho is: mean AUC for the 3 devices are equal.
DNSS: Difference is not statistically significant (p>0.05). The device AUCs are not significantly different.
AUC, area under the ROC curve; ROC, receiver operating characteristic.
Secondary variables
Figure 7 shows the proportion of correctly classified cases per device for each secondary variable (interstitial opacity distribution, interstitial patterns, nodule size, and percentage pneumothorax size). For all of these variables, >84% of cases were correctly classified. Nodules that were <7 mm in length had the lowest percentage of correct detection with ICR (84.07%, 686/816), whereas nodules longer than 15 mm had the highest percentage of correct detection with UMAX (97.92%, 799/816).
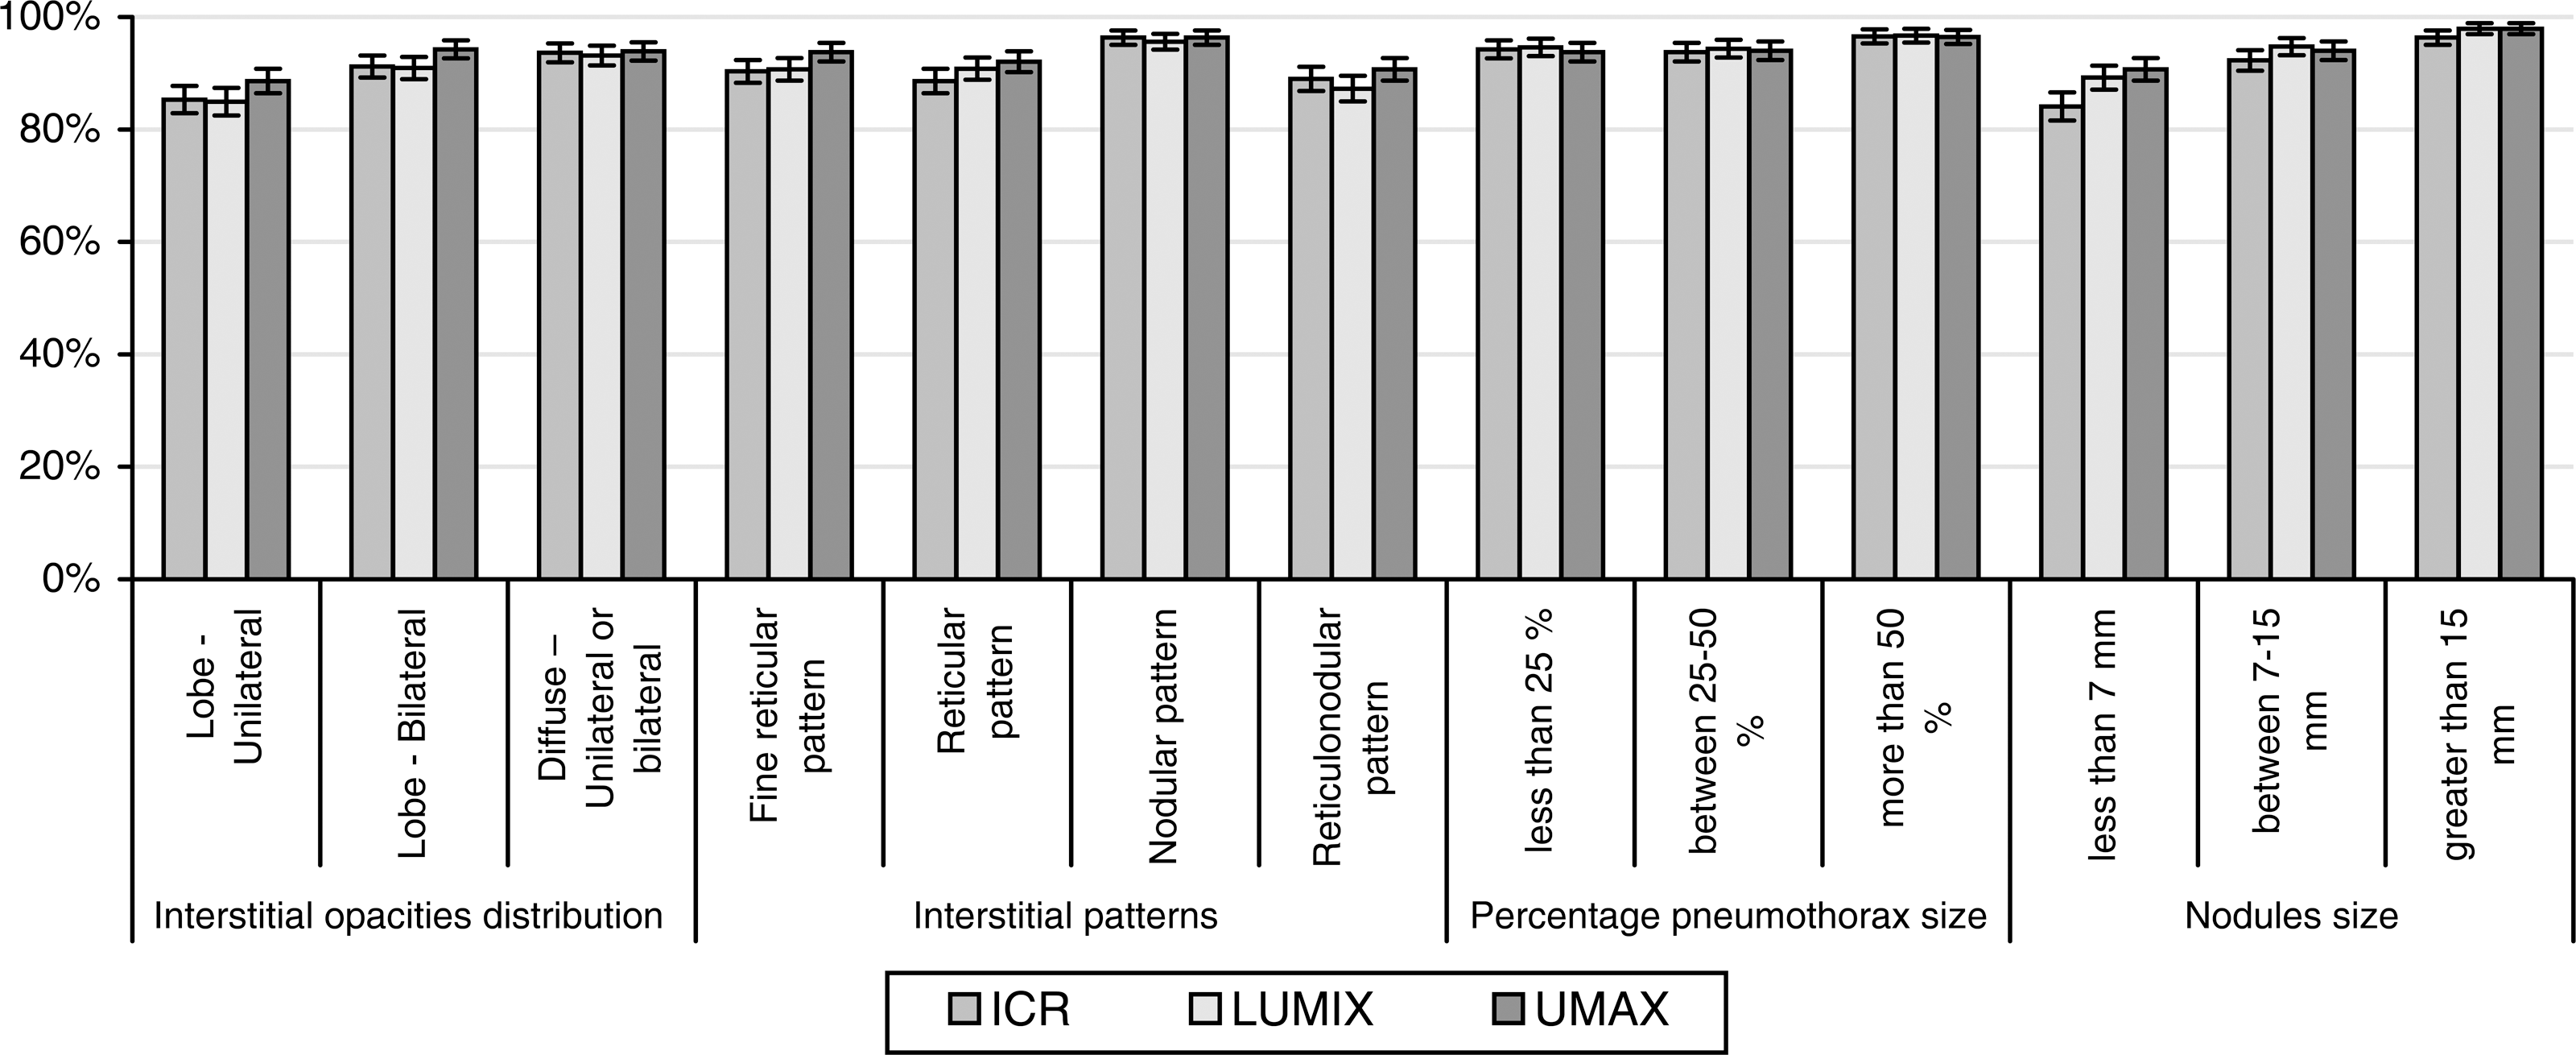
Cases of correctly classified (by pathology) disease categories and devices. A comparison is shown of the ability to correctly identify the disease category. Results represent the percentage of correctly identified categories for 816 observations with each device. Standard deviations for a 95% confidence interval were calculated for each category.
Quality variable
The percentage of cases labeled as “It was easy to select the score” is shown in Figure 8. The percentages for ICR (91.4%, SE=1.92%) and LUMIX (91.2%, SE=1.95%) were high, whereas the percentage for UMAX was very low (23.4%, SE=2.91%). Figure 9 shows similar results, classified by pathology and device.
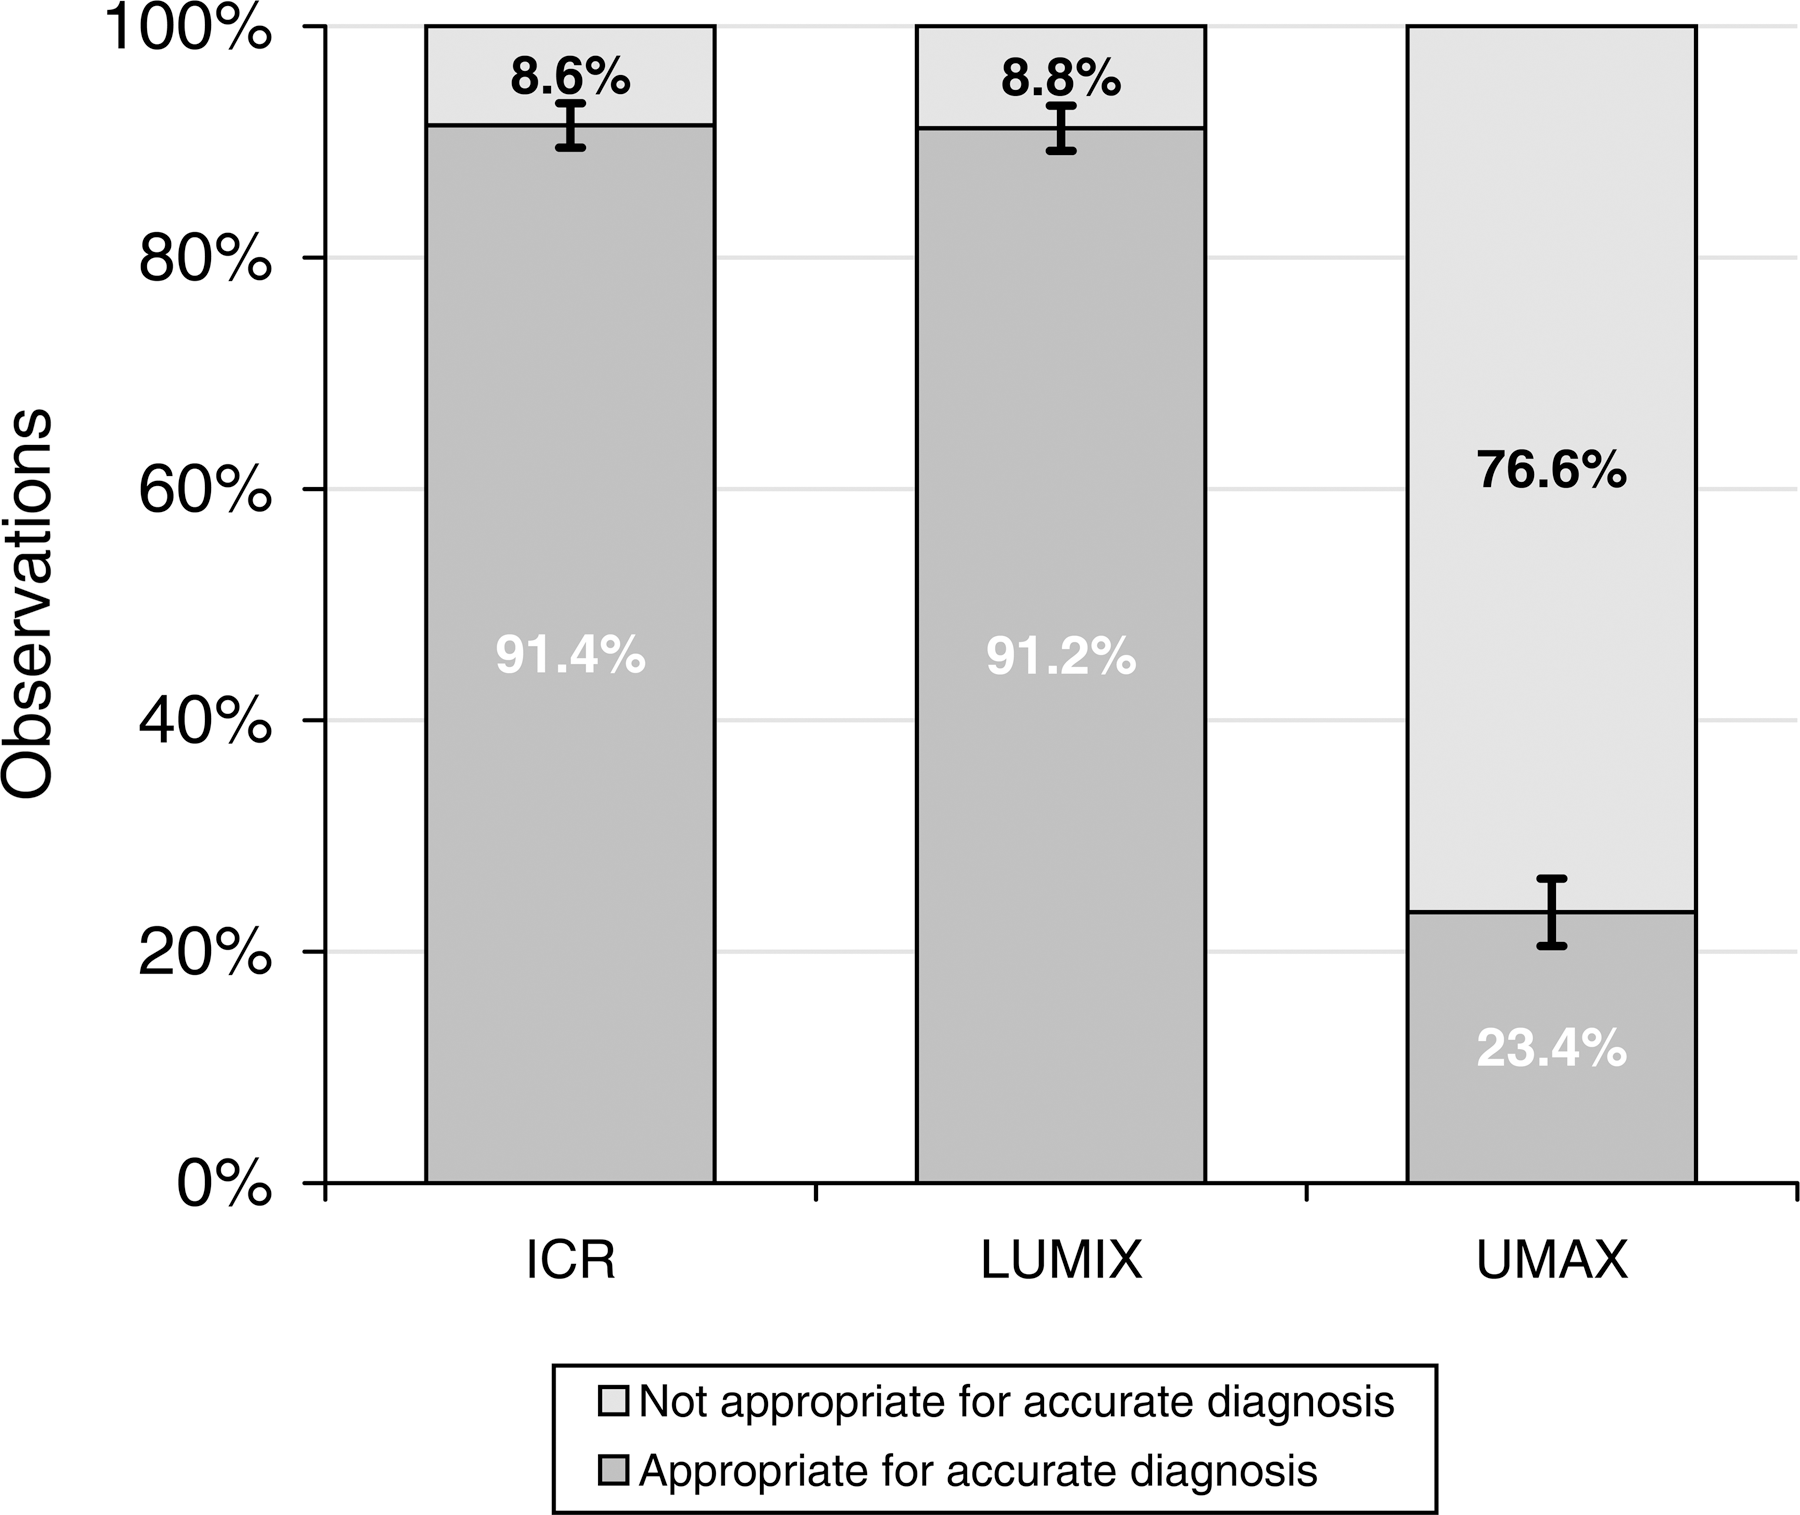
Image quality assessment by device. Results represent the percentage of cases marked as appropriate for accurate diagnosis for 816 observations with each device. Standard deviations for a 95% confidence interval were calculated for each device.
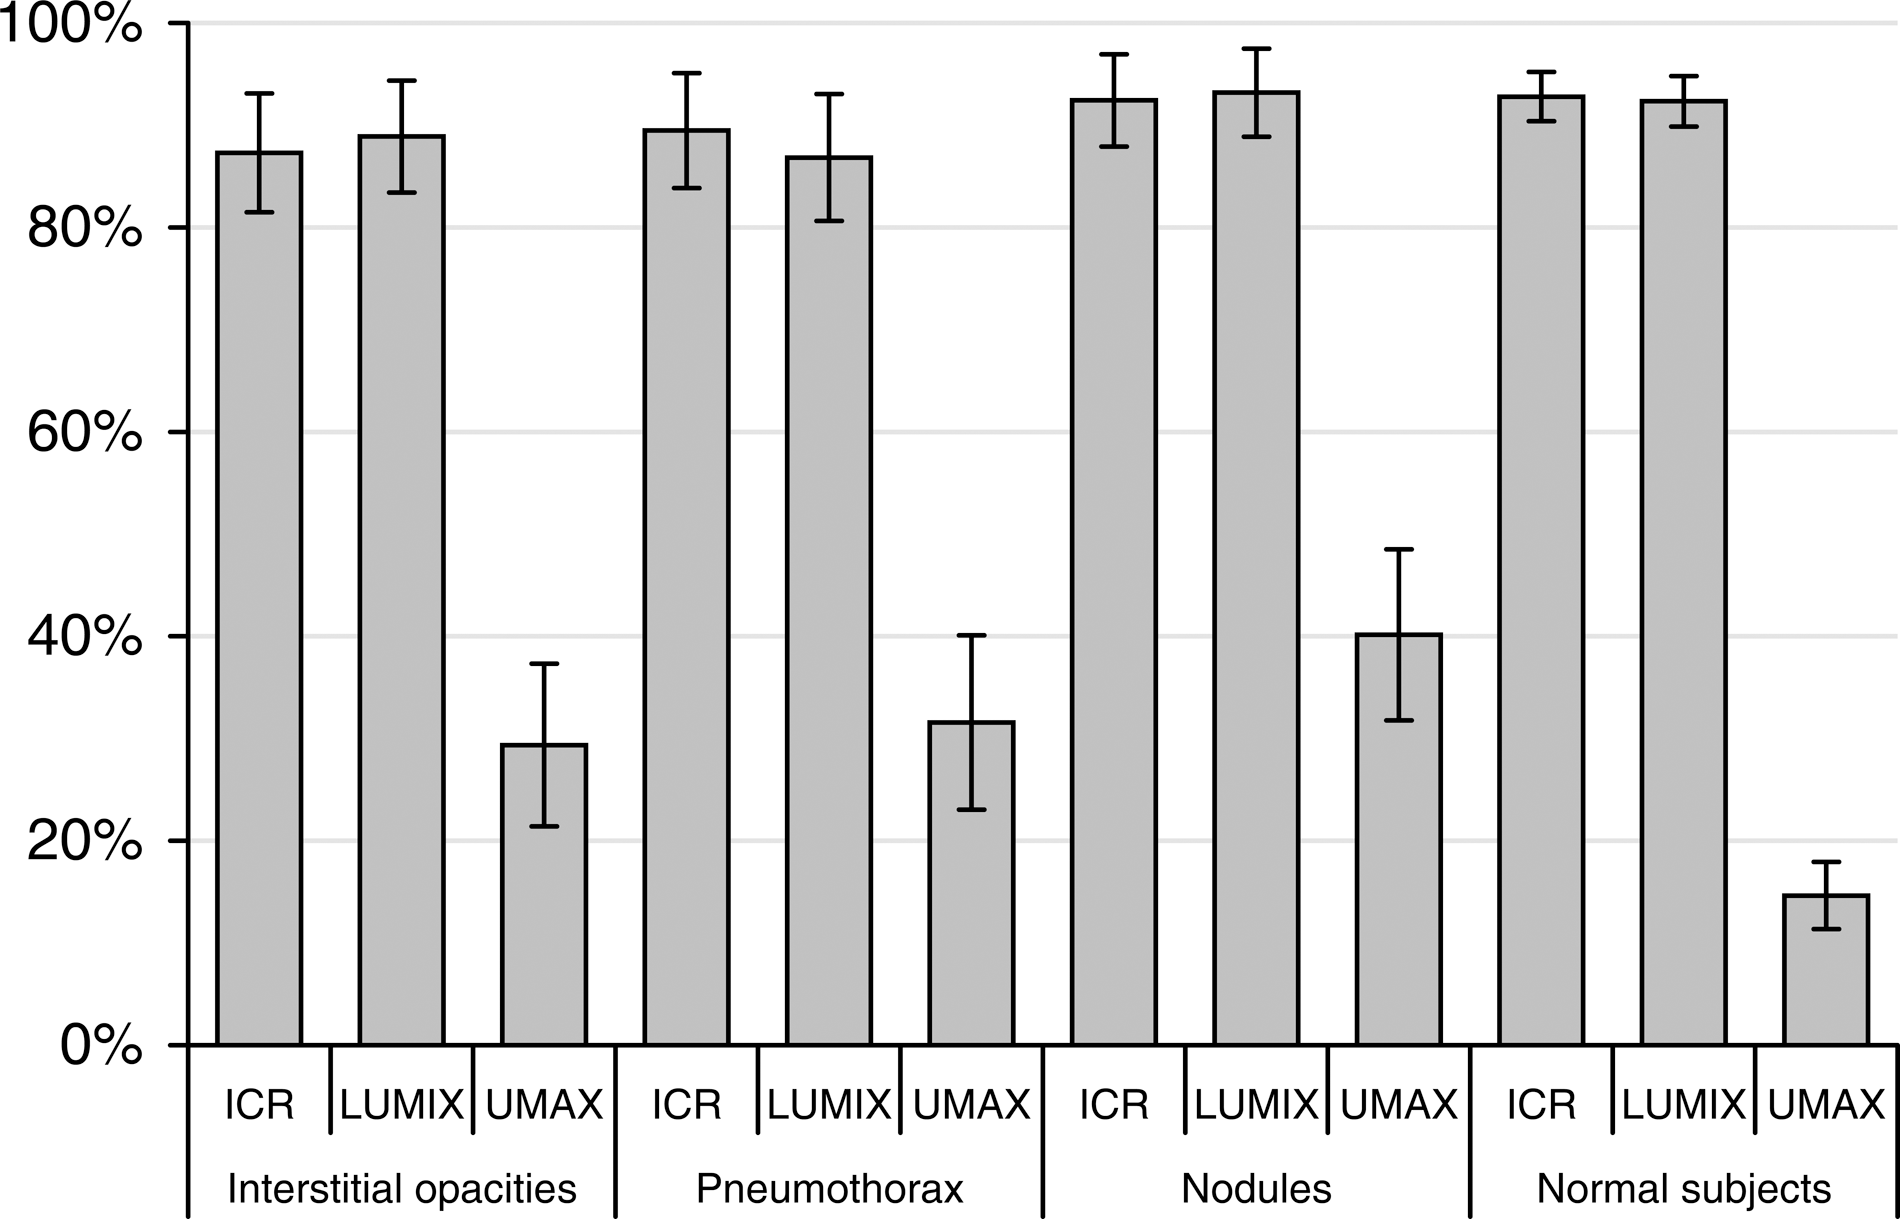
Image quality assessment by pathology and device. Results represent the percentage of cases marked as appropriate for accurate diagnosis for observations with each device by pathology (21 interstitial opacities, 19 pneumothorax, 21 nodules, and 74 normal subjects). Standard deviations for a 95% confidence interval were calculated for each device.
Discussion
The conclusions were all drawn from the results provided by the DBM-MRMC software after running an ANOVA analysis, which showed that there were no significant statistical differences in the diagnostic accuracy. High accuracy values were determined for the three main variables, indicating good performance for all devices. The diagnostic accuracy of the three devices in the detection of individual and mixed pathologies was the same (i.e., there were no significant statistical differences in AUC as shown in Table 3). AUC values ranged from 0.75 to 0.96 (high accuracy), and only small differences were found between them, consistent with the criteria used for sample size selection. Although UMAX cases were classified as of poor image quality, similar accuracy compared with the other devices was achieved. According to the CT gold standard, all three devices may conduct false positives or negatives (i.e., AUC not 1.0 for any device).
In terms of digitizing errors, from 161 captured cases for each device, the numbers of errors were as follows: 11 with film digitizer, 8 with digital camera, and 12 with flatbed scanner. For this reason, only 136 common cases without digitizing errors were used.
ICR and UMAX were used at a resolution of 375 dpi, whereas LUMIX was used at a resolution of 10 megapixels, resulting in a 0.120-mm pixel size (equivalent to 212 dpi), which is the largest size predicted by Ikezoe 40 for the detection of interstitial opacities with storage phosphor radiography (0.1 mm). Despite this, LUMIX showed a statistically similar AUC for this pathology than did the other devices.
A similar study 10 comparing a film digitizer (150 dpi) with a 3.3-megapixel digital camera showed more accurate results for the film digitizer. However, previous studies using cameras of equal or lesser resolution and film digitizers found no differences. 7 –11 It is, therefore, not possible to generalize conclusions about all film digitizers, flatbed scanners, and digital cameras: a study should be carried out to evaluate each device before using it in teleradiology.
Film digitizers and flatbed scanners require more frequent maintenance and mobile part adjustments than digital cameras. To avoid image alterations. digital cameras, on the other hand, are easy to purchase in local stores, avoiding the lengthy and complicated importation process that is required for specialized digitizers in developing countries. In addition, there often are no local facilities that provide maintenance for specialized digitizers; thus, a costly and long re-exportation process may be needed. With regard to cameras, there is often no maintenance service available, and buying a new camera may be the cheapest and fastest solution. The conclusion of both this article and previous studies is that the technological improvements in digital cameras, combined with decreasing prices, should not be overlooked, although it should be noted that these cameras require an additional support system (US $400 in this study) and a light box.
With a high number of daily studies, the capture time of a device could be critical. For 14×17″ films, the capture time was 300 s for UMAX, 30 s for ICR, and 20 s for LUMIX. Choosing a device for a teleradiology service should involve additional factors, such as maintenance concerns and training requirements.
Footnotes
Acknowledgments
We thank the FSFB Centro de Telemedicina for allowing us to use their facilities to conduct this study and the epidemiologist Dr. Gustavo Triana for his help in the sample design.
Disclosure Statement
No competing financial interests exist.