Triclosan is an active agent that is commonly found in biocide formulations which are used by the food industry to control microbial contamination. The aim of this study was to use microarray analysis to compare gene expression between a triclosan-susceptible Escherichia coli O157:H19 isolate (minimum inhibitory concentration [MIC] 6.25 μg/ml) and its in vitro generated triclosan-tolerant mutant (MIC >8,000 μg/ml). Gene expression profiling was performed on the wild-type and mutant isogenic pairs after 30 min exposure to the parent MIC for triclosan and an untreated control. Microarray analysis was carried out using the Affymetrix GeneChip®E. coli Genome 2.0 Array, and differential expression of genes was analyzed using the pumaDE method in Bioconductor R software. Wild-type gene expression was found to be significantly different from the triclosan-tolerant mutant for a large number of genes, even in the absence of triclosan exposure. Significant differences were observed in the expression of a number of pathway genes involved in metabolism, transport, and chemotaxis. In particular, gene expression in the triclosan-tolerant mutant was highly up-regulated for 33 of 38 genes belonging to the flagellar assembly pathway. The presence of extended flagella in the mutant isolate was confirmed visually by transmission electron microscopy, although no significant difference was observed in the motility of the parent and mutant at low levels of triclosan. Data from this study show that at a transcriptomic level, a triclosan-tolerant E. coli O157:H19 mutant is significantly different from the wild-type strain in a number of different pathways, providing an increased understanding of triclosan tolerance.
Introduction
Triclosan (irgasan; 2,4,4′ trichloro-2-hydroxydiphenyl ether) is an active agent that is commonly found in biocide formulations such as household cleaning products, hand sanitizers, cosmetics, personal care products, and domestic appliances to control microbial contamination. It is a member of the bisphenol biocide family that exhibits a broad spectrum of activity against many Gram-negative and -positive bacteria. Triclosan targets the biosynthesis of fatty acids that are necessary for building cell membranes through non-competitive inhibition of the NADH-dependent enoyl-acyl carrier protein reductase (FabI).19 Previous studies in Escherichia coli have established that triclosan tolerance is associated with a mutation in FabI, resulting in a Gly93→Val (G-93-V) amino-acid substitution.13,33 Over-production of G-93-V FabI has been shown to confer ∼400-fold greater tolerance to triclosan in mutant E. coli than in the wildtype.36
Other bacterial resistance mechanisms such as active efflux support triclosan tolerance by preventing accumulation of biocidal agents in the cell.1,18 Over-expression of the AcrAB-TolC efflux pump and global regulators of multiple antibiotic resistance MarA and SoxS has been shown to enhance triclosan resistance in E. coli.20 Since increased expression of acrAB, marA, and soxS is also associated with bacterial resistance to clinically relevant antibiotics, concerns have been raised that development of bacterial tolerance to triclosan may confer cross-resistance to antibiotics.3 Given the widespread use of triclosan in cleaning agents, personal care products, plastics, and fabrics, the risks associated with the emergence of triclosan tolerance in important zoonotic pathogens and their potential cross-resistance to antibiotics have been the subject of much debate in the literature.12,29 Some studies have proposed that an over-dependence on products containing triclosan in household, hospital, and food processing settings could lead to the emergence of clinically important pathogens which are highly tolerant to both biocides and antibiotics,3,17,28 while others maintaining the risk to human health is minimal.2,6,21
A study by our group examining the baseline tolerance of a panel of verocytotoxigenic E. coli (VTEC) isolated from Irish beef abattoirs (n=99) to eight commercial biocide formulations currently used in the cleaning regimes of food plants in Ireland found that none of the isolates tested grew above the working concentration recommended by the manufacturers of these products.32 The potential for isogenic mutants with enhanced biocide tolerance to be selected after daily sub-culture into increasing concentrations of commercial biocides and three biocidal active agents was investigated in the same study and through these experiments, a mutant E. coli O157:H19 isolate was identified (and denoted as T3 5H5M) which displayed stable increased tolerance to triclosan that was >1,280-fold higher than the wild-type (denoted as T3 5H5). Although numerous studies have examined the phenotypic tolerance of bacterial isolates to triclosan and their cross-resistance to clinically relevant antibiotics, a few have investigated differences in gene expression between a stable mutant displaying high-level tolerance to triclosan and its isogenic triclosan-susceptible wild-type in response to triclosan stress. The aim of the current study was to use microarray analysis to compare the transcriptomic response between the triclosan-susceptible wild-type T3 5H5 (minimum inhibitory concentration [MIC] 6.25 μg/ml) and its corresponding triclosan-tolerant mutant T3 5H5M (MIC >8,000 μg/ml) in the presence and absence of triclosan. Subsequent to this, the strains were examined using motility assays and transmission electron microscopy (TEM). The results of the present study will contribute toward an improved understanding of the triclosan-tolerant phenotype in E. coli O157 at a genomic level.
Materials and Methods
Bacterial strains
An E. coli O157:H19 strain, denoted T3 5H5, obtained from a tracking study undertaken in Irish beef abattoirs was used as the reference strain.34 T3 5H5 (triclosan MIC 6.25 μg/ml) was subjected to selection using stepwise increments in triclosan concentration to generate a mutant strain, denoted as T3 5H5M, with enhanced tolerance to triclosan (MIC >8,000 μg/ml), which remained stable on subculturing for a period of at least 7 days in the absence of triclosan.32 The wild-type strain and triclosan-tolerant mutant were subcultured in parallel with the presence of triclosan being the only difference. Bacterial cultures were routinely stored on Protect™ beads (Technical Service Consultants) and maintained frozen at −80°C.
Experimental design
One Protect bead containing each isolate was initially streaked onto Luria-Bertani Miller (LB) agar (Sigma-Aldrich) and incubated for 18 hr at 37°C to recover the test organism. A single colony was picked and placed into a tube containing 10 ml LB broth (Sigma-Aldrich) and incubated for 18 h at 37°C without shaking. Aliquots of the overnight culture (200 μl) were inoculated into 20 ml LB broth and incubated at 37°C until growth reached an optical density (OD600nm) of 0.6. The subculture was split into two 10 ml portions, one of which was treated with 6 μg/ml triclosan (0.96 wild-type triclosan MIC) and the other was retained as an untreated control. Triclosan was diluted in ethanol to make a stock solution of 40 mg/ml; from this, stock solution 15 μl was added to 10 ml of LB to make a final concentration of 6 μg/ml. Treated and untreated wild-type and mutant samples were incubated at 37°C for 30 min. Total RNA was stabilized and subsequently, purified from a 500 μl portion of each bacterial culture using an RNAprotect Bacterial Reagent Mini Kit (Qiagen) according to the manufacturer's instructions. Extracted RNA (50 μl) was treated with Ambion® DNA-free™ DNase treatment and removal agent (Life Technologies) to eliminate DNA contamination of samples and stored in 10 μl aliquots at −80°C. RNA was extracted from three independent experiments (n=12 samples) for microarray and quantitative reverse-transcriptase quantitative polymerase chain reaction (qRT-PCR) analysis.
Microarray and data analysis
The integrity and concentration of the RNA samples were assessed using the 2100 bioanalyzer with RNA 6000 Nano Lab-chip Kit (Agilent Technologies, Inc.). The RNA integrity number values of between 8.0 and 10.0 indicated that samples were suitable for microarray analysis, and the concentration of total RNA in the samples was in the range of 346–427 ng/μl. Gene expression profiling was carried out on the DNase-treated RNA samples (10 μl aliquots) by a commercial provider (Source BioScience imaGenes) using the Affymetrix GeneChip®E. coli genome 2.0 microarray, which contains ∼10,000 probe sets for all 20,366 genes present in the K12 strain of E. coli and three pathogenic strains of E. coli. All microarray analyses, including preprocessing, normalization, and statistical analysis, were carried out using R (R, 2007) version 2.6 and Bioconductor10 version 2.1 as described by Morris et al.22 Data were quality assessed before and after normalization using a number of in-built quality control methods implemented in the Bioconductor affycoretools and associated packages to identify problems if they existed with array hybridization, RNA degradation, and data normalization. Microarray data were preprocessed using the mmgMOS normalization method25 using the default settings, and differential expression (DE) was calculated using the puma DE method, both of which are implemented in the Bioconductor package “puma.”25 The puma method uses a Bayesian hierarchical model to calculate the probability of positive likelihood ratio (PPLR). The PPLR associates probability values of genes being differentially expressed, which is a measure of the false-positive detection of DE, to each ratio and generates lists of genes ranked by the probability of DE. This PPLR statistic was converted into “p-like values” using the recommended formula in the puma method before subsequent analysis.
The Affymetrix probe set IDs of differentially expressed genes (DEG) were submitted to the online gene classification system Database for Annotation, Visualization and Integrated Discovery (DAVID; http://david.abcc.ncifcrf.gov/)14,15 to determine gene function and functional annotation clustering, to classify large lists of genes into functional-related gene groups, and to assign them to their biological pathways through Kyoto Encyclopaedia of Genes and Genomes (KEGG; http://genome.jp/kegg/).16 Lists of genes determined to be differentially expressed by comparing the microarray data for the wild-type-untreated (WTU), wild-type-treated (WTT), mutant-untreated (MU), and mutant-treated (MT) samples were investigated using VENNY, an interactive tool that is used for comparing lists with Venn Diagrams, to identify which DEG they had in common.24
Selection of target genes for microarray validation and primer design
The results of the microarray analysis were used to identify suitable target genes for qRT-PCR, which were then applied to validate the array data. DEG were selected from the microarray data in which expression was either up-regulated (n=6 genes) or down-regulated (n=5 genes) in the triclosan-tolerant E. coli O157:H19 mutant compared with its corresponding wild-type isolate, along with two housekeeping genes (gidB—glucose-inhibited division protein and rsuA—pseudouridine synthase). The housekeeping genes chosen were expressed at the same level in the treated and untreated E. coli O157:H19 wild-type strain and its isogenic triclosan-tolerant mutant. Primers were designed for each gene of interest by inputting their full DNA sequence into the NCBI/Primer-BLAST Primer designing tool.27 Oligonucleotides were commercially synthesized by Eurofins MWG Operon. All conventional PCR reactions were performed using the Applied Biosystems® Veriti® 96-Well Fast Thermal Cycler (Life Technologies) and cycling conditions are detailed in Table 1.
PCR Primer Sequences and Reaction Conditions Used in This Study
Annealing conditions and number of PCR cycles varied depending on target gene, other PCR cycling conditions on the Veriti® 96-Well Fast Thermal Cycler (Applied Biosystems®; Life Technologies) were as follows: one cycle at 95°C for 7 min, denaturation at 95°C for 1 min, extension at 72°C for 1 min 30 sec, final one cycle at 72°C×10 min.
Reverse transcription
Total RNA (1 μg) from the same sample series (n=12) used for the microarray experiment was reverse transcribed to cDNA using the SuperScript® VILO™ cDNA Synthesis Kit (Life Technologies) according to the manufacturer's instructions.
Enzymatic pre-treatment of SYBR Green I Master Mix
Before all qRT-PCR reactions, an enzymatic pre-treatment of the SYBR Green I Master Mix (Roche Applied Science) was carried out to remove any contaminating endogenous nucleic acid, as previously described.8 In brief, a combination of AluI (Roche Applied Science) and Amplification Grade DNase I (Life Technologies) were used at optimized concentrations of 0.5 and 0.05 U/μl of the SYBR Green I Master Mix, respectively. The conditions for the treatment were 37°C for 20 min (mixed after 10 min), 80°C for 2 min, and cooled. Primers, water, and cDNA were added after incubation.
Standard curve
Conventional PCR (total reaction volume 25 μl) was carried out for each target gene (Table 1) using cDNA (2.5 μl; 1.5 μg/μl), forward and reverse primers (1 μM) and HotStar HiFidelity DNA Polymerase (Qiagen) according to the manufacturer's instructions. All products were subjected to electrophoresis on a 2% (w/v) agarose gel in 1× Tris acetate–ethylenediaminetetraaceticacid (EDTA; Fluka Biochemicals). One distinct band was observed of the expected size, and this was subsequently extracted using a QIAQuick Gel Extraction kit (Qiagen) according to the manufacturer's instructions. The concentration of the purified PCR products was determined using the 2100 bioanalyzer with DNA 1000 Lab-chip Kit (Agilent Technologies, Inc.). To determine the qRT-PCR efficiencies for each reaction, a dilution series (101–1010) was made from the purified PCR products for each target gene, and standard curves were constructed using the LightCycler 480 system (Roche Applied Science) and SYBR Green PCR master mix kit. The qRT-PCR efficiencies from the standard curve for each reaction (ranging from 1.84 to 1.98) were inputted into the LightCycler 480 software to calculate fold changes (FCs) between target and wild-type samples.
qRT-PCR was performed on 96-well plates, and reactions were carried out in triplicate for each cDNA sample. One microliter of cDNA was amplified in a 10 μl volume using 4 μl of SYBR® Green master mix, 0.5 μl of 10 μM forward and reverse primer mix, and 4 μl nuclease-free water (Qiagen). Cycling conditions for wild-type and selected genes on the LightCycler 480 system were as follows: 1 cycle at 95°C for 5 min, 45 PCR cycles of 95°C for 10 sec, annealing 58°C for 10 sec, 72°C for 16 sec, and 78°C for 2 sec at data acquisition. Melt curve analysis was carried out after the amplification program to ensure a single peak was present and to identify any non-targeted PCR products. The melting curve was obtained by heating at temperatures from 65°C to 97°C at a ramp rate of 0.2°C/sec with continuous fluorescence monitoring. Subsequent agarose gel electrophoresis was used to visualize the amplification product to ensure a single amplicon was produced. The LightCycler® 480 software program was used to calculate FCs in target gene expression normalized to the housekeeping genes gidB and rsuA. qRT-PCR was performed on cDNA reverse-transcribed from the same RNA sample series investigated in the microarray study (n=12). FCs in qRT-PCR gene expression for each replicate sample (n=3) of WTU, WTT, MU, and MT were averaged to account for any potential variance between experimental repeats, and these results were used to validate the average FC obtained for the same target genes in the microarray study.
Amplification and DNA sequencing of fabI gene
To investigate the presence of the G-93-V amino-acid substitution in the mutant strain T3 5H5M, primers to amplify the complete fabI gene product were designed and commercially synthesized as detailed earlier. The PCR product size was 789 bp, and the oligonucleotide primer sequences were as follows: Forward strand 5′-ACT AAA ACG ACG AAT CGC-3′; Reverse strand 5′-CGC CCA TCT TTA CCA ACA-3′. The PCR reaction (total volume 25 μl) was performed on the Veriti 96-Well Fast Thermal Cycler using DNA (2.5 μl), forward and reverse primers (1 μM), and HotStar HiFidelity DNA Polymerase according to the manufacturer's instructions. The following PCR cycling conditions were used: 1 cycle at 95°C for 7 min, 35 cycles of denaturation at 95°C for 1 min, annealing at 61°C for 60 sec, and extension at 72°C for 1 min 30 sec, followed by 1 final cycle at 72°C ×10 min.
Amplicons produced were subjected to electrophoresis on a 2% (w/v) agarose gel in 1× Tris acetate–EDTA. One distinct band was observed at the expected size for the fabI gene and extracted using the QIAQuick Gel Extraction kit according to the manufacturers' instructions. Source BioScience performed commercial DNA sequencing on purified PCR products from E. coli O157 wild-type T3 5H5, mutant T3 5H5M, and control EDL933 strains. DNA sequences were analyzed and converted to amino-acid sequences using SeqBuilder, and alignments were constructed using MegAlign, both from the Lasergene software package (DNASTAR, Inc.). The sequence of the fabI gene carried by T3 5H5, T3 5H5M, and EDL933 were verified by visual inspection of chromatograms and aligned with VTEC fabI gene sequences published on KEGG and the National Center for Biotechnology Information Basic Local Alignment Search Tool (NCBI BLAST) (http://blast.ncbi.nlm.nih.gov/Blast.cgi).
Transmission electron microscopy
A single colony of the wild-type and mutant E. coli O157:H19 were resuscitated in 10 ml volumes of LB broth and incubated for 18 h at 37°C without shaking. The overnight culture was washed twice in sterile phosphate buffer saline (PBS; Sigma Aldrich) and re-suspended in 1 ml PBS. The E. coli O157:H19 cells were fixed by addition of glutaraldehyde (Sigma Aldrich) to a final concentration of 2.5%. The samples were commercially processed for TEM imaging by the Biological Imaging Facility, Conway Institute of Biomolecular and Biomedical Research, University College, Dublin.
Motility assay
A swim swarm assay was performed using a semi-solid agar (0.4%) as described by Karatzas et al.,17 to investigate differences in motility between the wildtype and mutant strains. In brief, cultures incubated overnight in LB broth were stabbed into semi-solid agar and incubated at 20°C and 30°C for 4 days. The growth of the wild-type and mutant cultures after incubation were measured (mm) and compared. The swim swarm assay was replicated on four independent occasions for each isolate. The data were analyzed using GenStat Release 14.1. A two-tailed Student's t-test was used to assess whether the motility of the wild type was significantly different (p<0.05) from the mutant. A randomized block design with days as blocks was used to assess whether there was a significant difference (p<0.05) in the motility of the mutant at different triclosan concentrations. Means were compared using the F protected least-significant difference test.
Microarray data
Data for the transcriptomic response of E. coli O157:H19 wild-type T3 5H5 and mutant T3 5H5M (triclosan MIC 6.25 and >8,000 μg/ml respectively) to 30 min treatment with 6 μg/ml triclosan and untreated control have been submitted to GEO (accession GSE39343).
Results
Microarray analysis
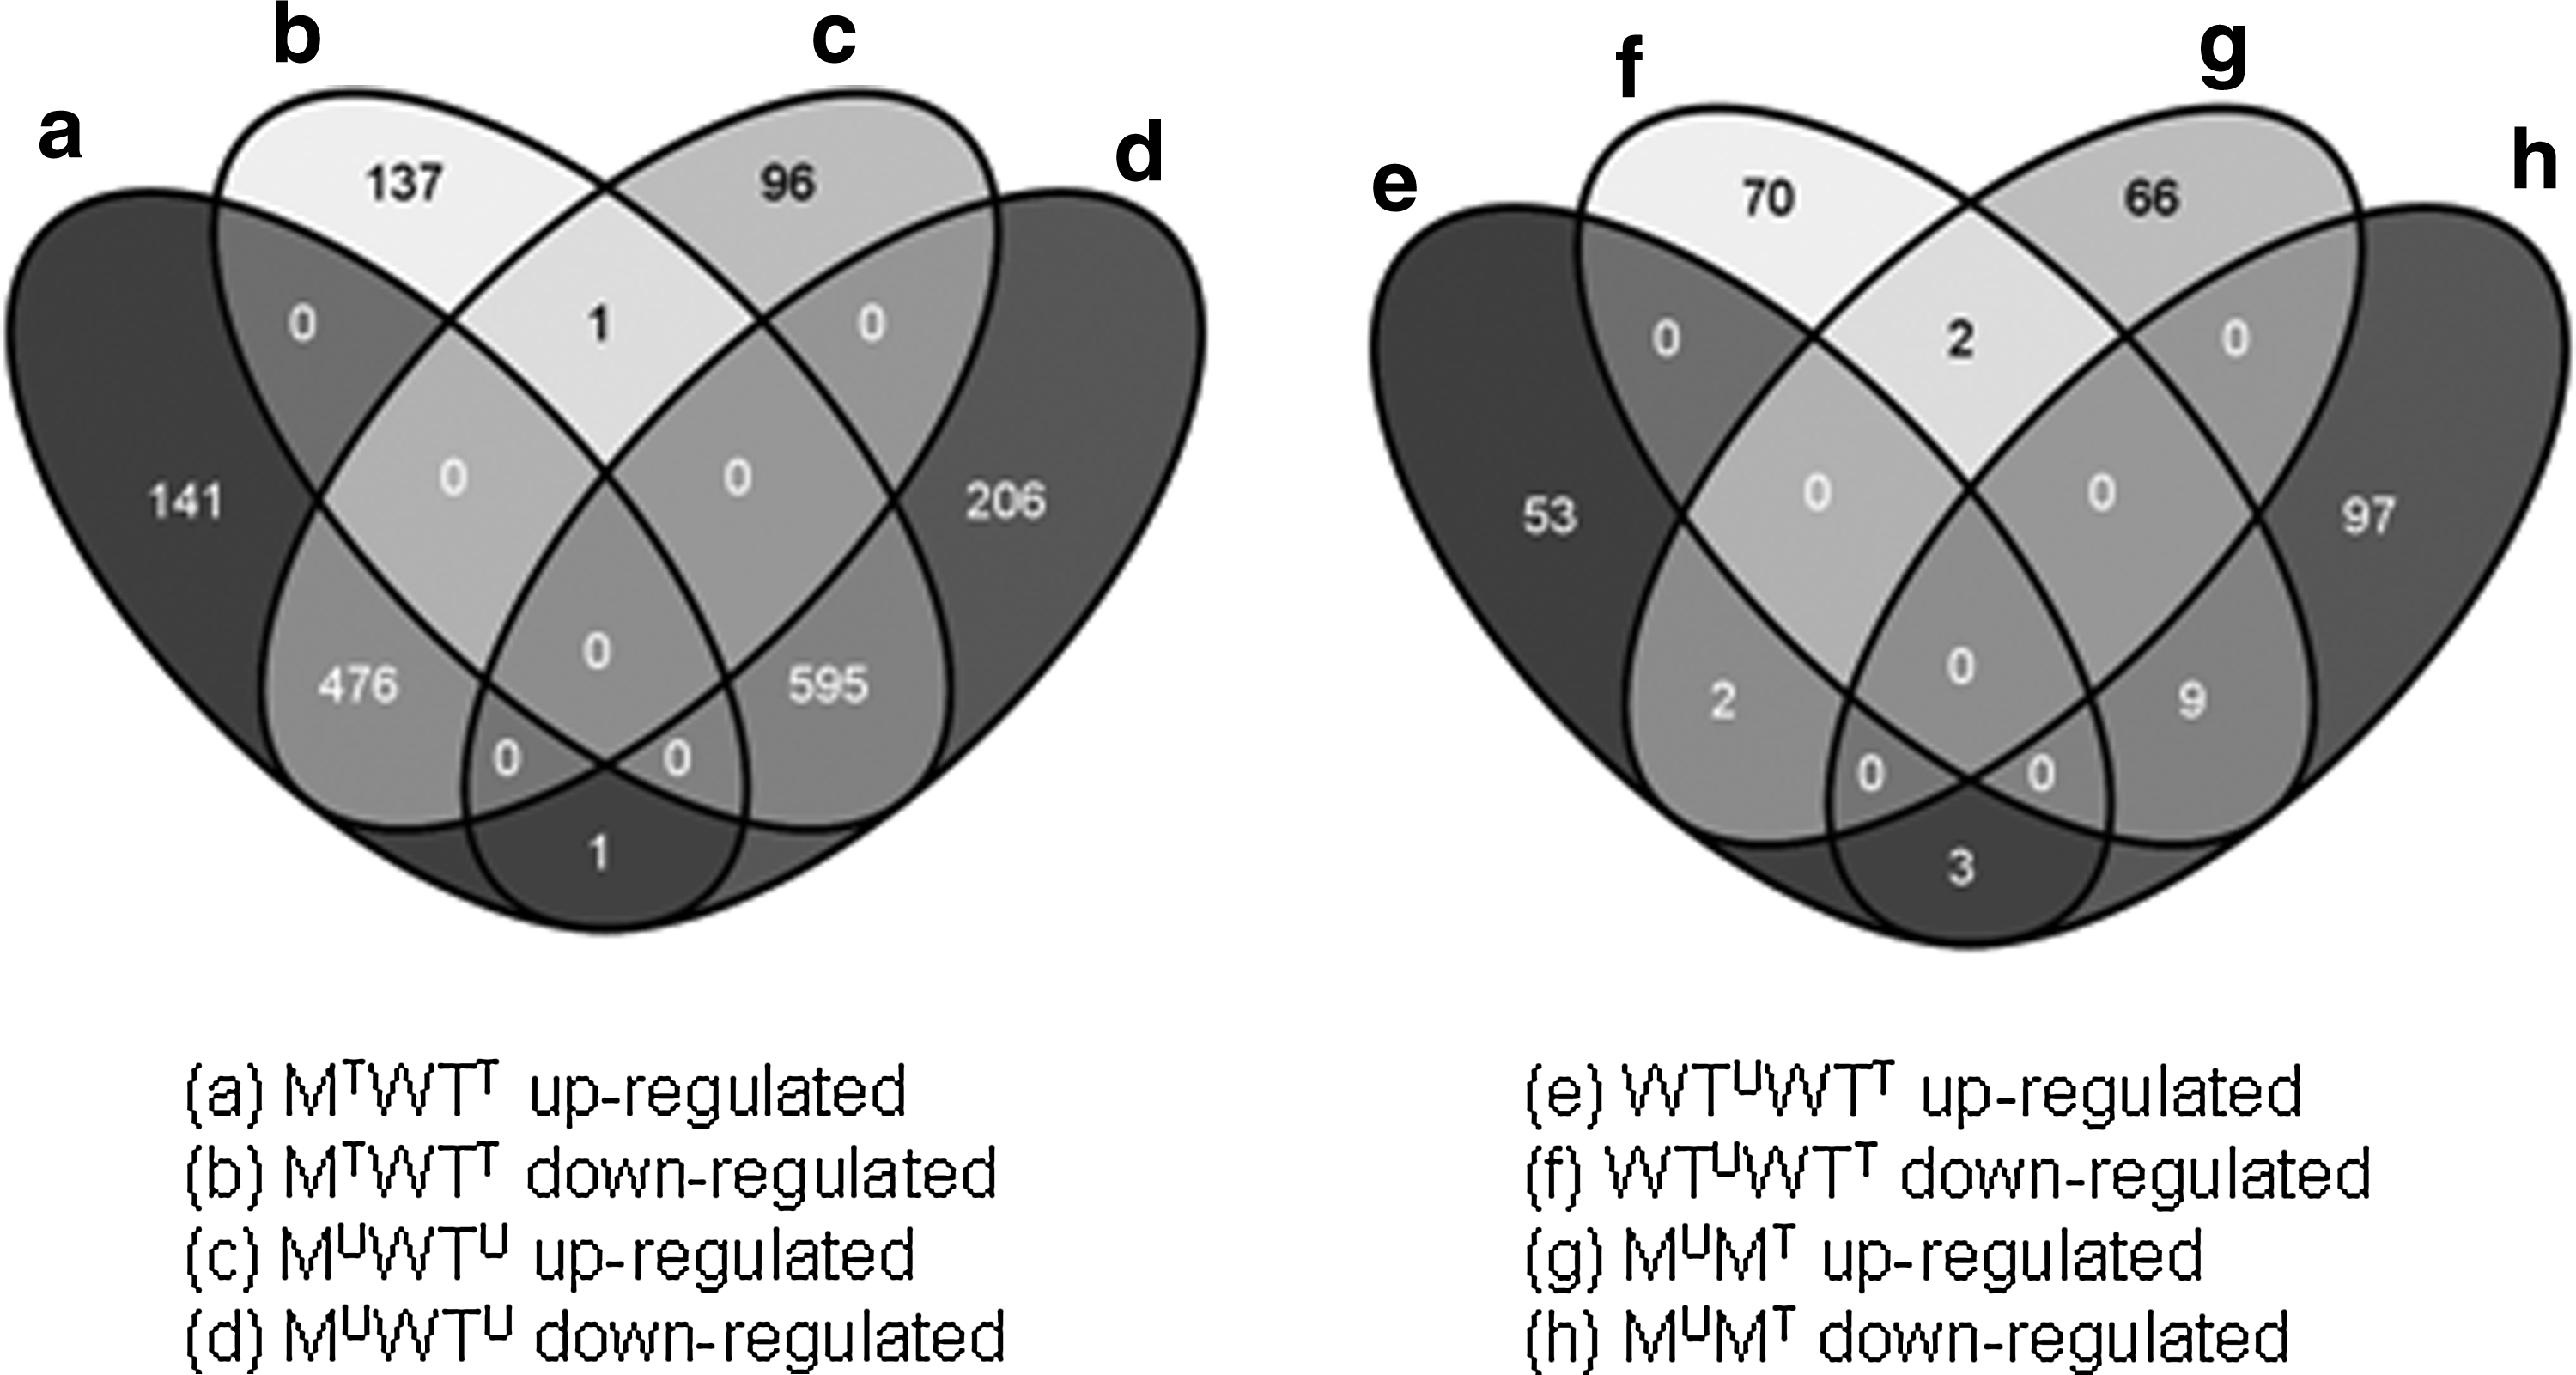
Initial results of the puma analysis to estimate FCs and p-like values of differential gene expression between the four different microarray data sets examined (WTU, WTT, MU, and MT) indicated that the triclosan-tolerant E. coli O157:H19 mutant T3 5H5M had a significantly different (p≤0.05) core transcriptomic response when compared with the triclosan-susceptible wild-type T3 5H5, both in the presence and absence of triclosan exposure. The study showed that a total of 1,351 annotated genes were differentially expressed by the mutant compared with the wild type after treatment with 6 μg/ml triclosan for 30 min (MTWTT), while 1,375 DEG were identified by comparing the untreated mutant to the untreated wild type (MUWTU). A smaller number of DEG were detected by comparing the transcripts of the untreated wild type with the wild type treated with triclosan (WTUWTT; n=172) and the untreated mutant with the treated mutant (MUMT; n=179). A closer investigation of the lists of DEG by VENNY found that a number of the same genes were up-regulated (n=476) or down-regulated (n=595) in the mutant compared with the wild type in both the presence and absence of triclosan (Fig. 1). A much smaller number of up-regulated (n=2) or down-regulated (n=9) DEG were commonly expressed in the WTUWTT and MUMT microarray datasets. These results suggest that the majority of the transcriptomic differences observed between the wild type compared with the mutant were not in response to triclosan stress but due to a core difference between the strains at a genomic level.
Venn diagram showing number of genes identified with similar up- or down-regulated gene expression (p<0.05) in the Escherichia coli O157:H19 mutant treated (MT) or untreated with triclosan (MU) compared with its corresponding wild type treated (WTT) or untreated with triclosan (WTU).
The lists of DEG generated for each comparative analysis of the microarray data using the puma method (MTWTT, MUWTU, WTUWTT, and MUMT) were submitted to the set of functional annotation tools available on the DAVID database in order to interpret gene function and to group functionally related genes to their biological pathways. Results of the functional annotation clustering analysis for up- or down-regulated DEG common to both MTWTT and MUWTU are presented in Tables 2 and 3, respectively. The up- and down-regulated genes in the mutant were assigned to their corresponding biological pathways in order of importance, and only significant results of the DAVID database search are presented in both tables. Pathway genes involved in the processes of cell transport, fatty acid metabolism, and the citrate cycle were up-regulated in the mutant (Table 2), while the majority of down-regulated pathways were involved in metabolism (Table 3).
Top Nine Results of Functional Annotation Clustering Using DAVID to Group Genes with Significant (p<0.05) Up-Regulated Expression in the Escherichia coli O157:H19 Triclosan-Tolerant Mutant Compared with Its Wildtype to Their Corresponding Biological Pathways
Enrichment p-values of ≤0.05 suggest that differentially expressed genes are significantly more enriched than random choice in the target biological pathway.
p-Value is based on individual term members and Fold enrichment values are for each group.
Fold enrichments of ≥1.5 suggest that the significantly expressed genes identified play a more important role in the target biological pathway than genes for which expression remained similar in comparisons between the triclosan-tolerant mutant and its corresponding triclosan-susceptible wildtype.
DAVID, Database for Annotation, Visualization and Integrated Discovery.
Top 10 Results of Functional Annotation Clustering Using DAVID to Group Genes with Significant (p<0.05) Down-Regulated Expression in the Escherichia coli O157:H19 Triclosan-Tolerant Mutant Compared with Its Wildtype to Their Corresponding Biological Pathways
Enrichment p-values of ≤0.05 suggest that differentially expressed genes are significantly more enriched than random choice in the target biological pathway.
p-Value is based on individual term members and Fold enrichment values are for each group.
Fold enrichments of ≥1.5 suggest that the significantly expressed genes identified play a more important role in the target biological pathway than genes for which expression remained similar in comparisons between the triclosan-tolerant mutant and its corresponding wildtype.
In particular, a high proportion of DEG belonging to the flagellar assembly pathway (33 of 38) and bacterial chemotaxis (16 of 19) were observed to be up-regulated in the triclosan-tolerant mutant. This difference in gene expression was consistent between the triclosan-tolerant mutant and wild-type strain in both the presence and absence of triclosan stress and, thus, was targeted for further investigation. An examination of the FC data for genes up-regulated in the mutant confirmed large increases in RNA expression for a number of genes belonging to the flagellar assembly and bacterial chemotaxis pathways (Table 4). The microarray data were also investigated to determine whether any genes previously reported to have a direct role in the triclosan-tolerant genotype (fabI) or an indirect role, including active efflux of biocides from E. coli (such as acrB, tolC, marA, and soxS) were differentially expressed. While some of the predicted genes were up-regulated in the mutant compared with the wild type, the FCs in expression were modest (FC=1.5–3.2) in comparison to those up-regulated in the flagellar assembly and chemotaxis pathways. Unexpectedly, some of the efflux pump-associated genes, such as tolC and acrB, suggested by previous research to play an important role in microbial tolerance to biocidal components20,35 were unchanged or down-regulated (FC=1.2–2.6) in the triclosan-tolerant mutant compared with the triclosan-susceptible wild type (Table 4). It was also observed that the flu gene associated with the formation of biofilms7 was 8.49 and 11.49-fold down-regulated in the mutant T3 5H5M compared with the wild type in the presence and absence of triclosan, respectively.
Fold Changes of Selected Escherichia coli O157:H19 Genes Significantly Up- or Down-Regulated (p<0.05) in the Triclosan-Tolerant Mutant T3 5H5M Compared with Its Wild-Type Counterpart T3 5H5 in the Presence (MTWTT) and Absence (MUWTU) of Triclosan Stress
Fold change
Gene
Product
Function
MTWTT
MUWTU
Up-regulated mutant gene expression
Flagellar assembly
fliA
Flagellar biosynthesis sigma factor
Regulation of transcription
522.51
377.01
fliT
Flagellar biosynthesis protein FliT
Negative regulation of flagellum assembly
389.67
326.15
flgB
Flagellar basal body rod protein FlgB
Flagellar motility
32.28
45.67
fliD
Flagellar hook-associated protein 2
Elongation of the flagellar filament
25.88
17.69
flgH
Flagellar L-ring protein
L-ring predicted to protect the motor/basal body from shearing forces during rotation
23.77
21.00
flhC
Flagellar transcriptional activator FlhC
Flagellar master control regulator
6.8
6.36
flhD
Flagellar transcriptional activator FlhD
Activation of class 2 flagellar genes in combination with FlhC
6.29
5.80
fliN
Flagellar motor switch protein FliN
Flagellar motility/chemotaxis
4.83
2.19
fliG
Flagellar motor switch protein G
Flagellar motility/chemotaxis
2.92
2.39
fliM
Flagellar motor switch protein FliM
Flagellar motility/chemotaxis
2.64
2.52
Bacterial chemotaxis
aer
Aerotaxis receptor
Signal transduction regulation of transcription
92.88
84.87
motA
Flagellar motor protein motA
Flagellar motility transport/chemotaxis
54.95
32.62
cheR
Chemotaxis methyltransferase CheR
Response regulator for chemotaxis
50.14
41.49
cheA
Chemotaxis protein CheA
Sensory transducer kinase between chemo-signal receptors
40.72
32.64
tar
Methyl-accepting chemotaxis protein II
Transmembrane receptor activity
29.00
29.93
motB
Flagellar motor protein motB
Flagellar motility transport/chemotaxis
24.84
19.27
cheZ
Chemotaxis protein CheZ
Cytosolic phosphatase which functions in the chemotaxis signal transduction complex by controlling the level of phosphorylated CheY through dephosphorylation
23.65
22.92
cheY
Chemotaxis regulatory protein CheY
Chemotaxis regulator that, when phosphorylated, interacts with the flagellar motor causing the flagella to spin clockwise which causes the cell to tumble
23.37
21.52
cheB
CheB chemotaxis-specific methylesterase
Demethylation of methyl-accepting chemotaxis proteins
22.18
22.21
cheW
CheW purine-binding chemotaxis protein
Positive regulator of CheA protein activity
21.81
22.92
Fatty acid biosynthesis
fabI
Enoyl-acyl carrier protein reductase
Fatty acid biosynthetic process/response to antibiotics
3.21
3.18
Global regulators of antibiotic resistance and active efflux
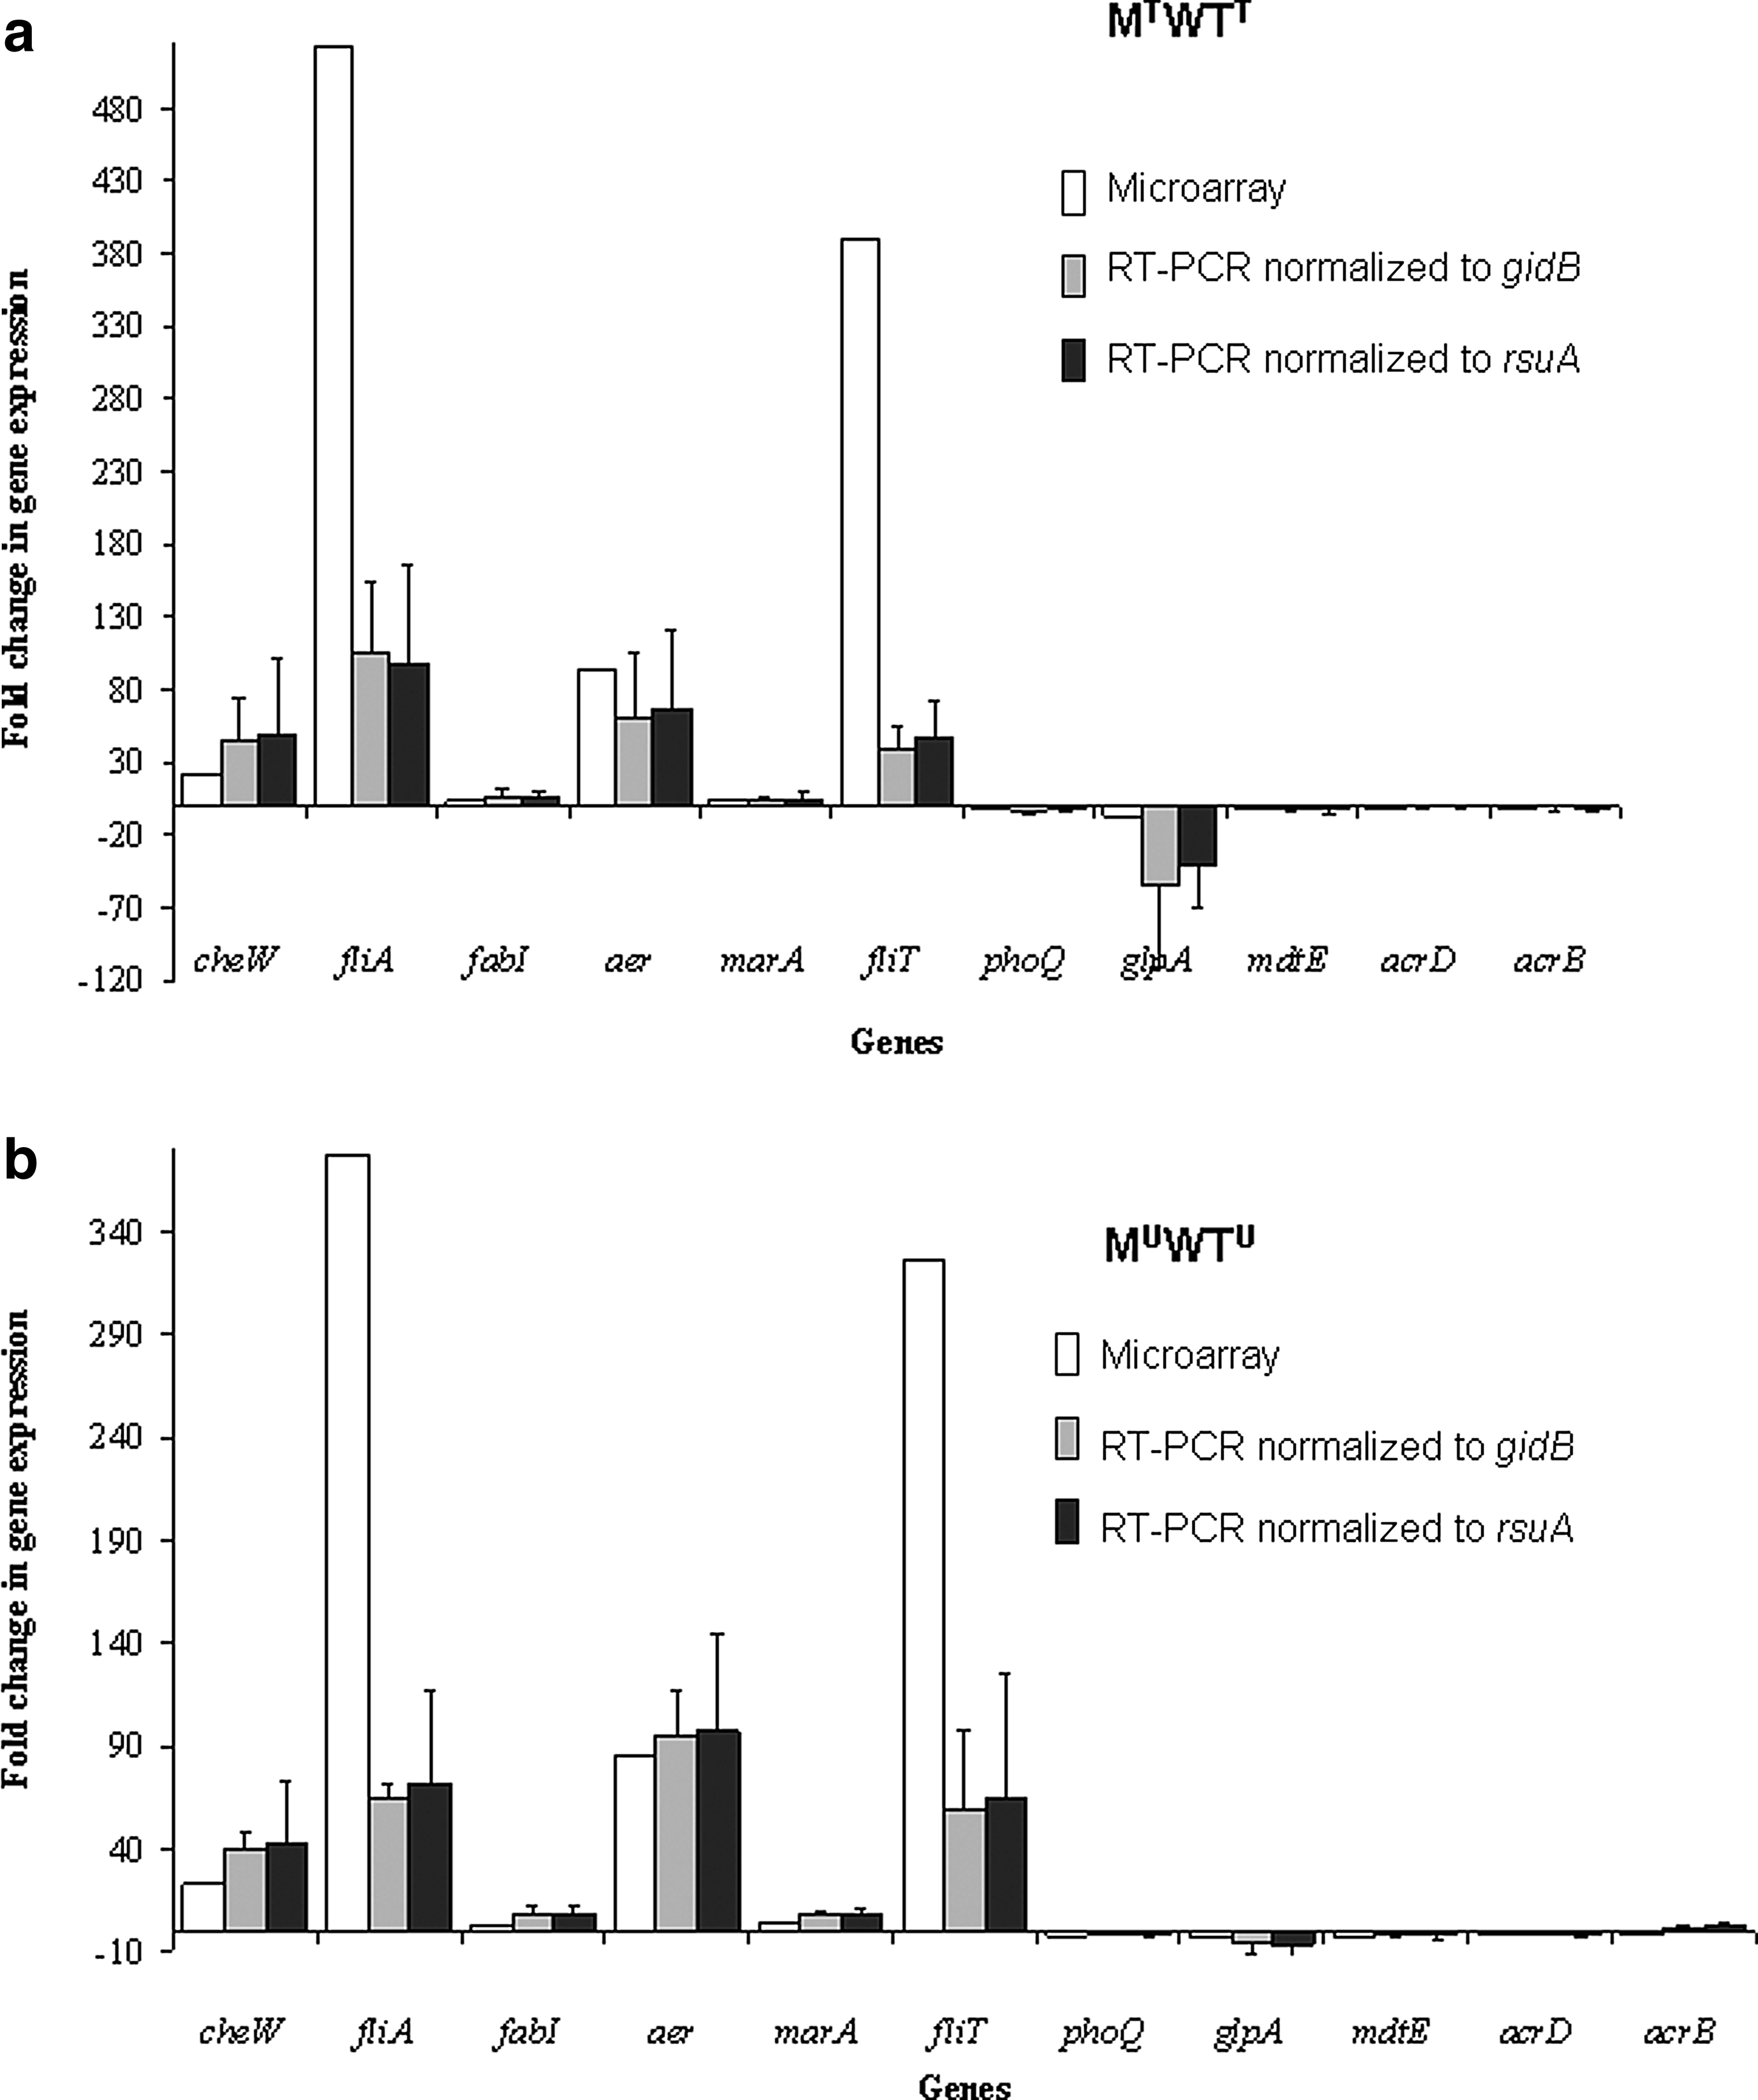
Statistically different FCs in microarray gene expression (p<0.05) for the majority of up- and down-regulated genes investigated by qRT-PCR were confirmed by normalization to both gidB and rsuA (Fig. 2). There was a high standard error between biological replicates for some of the target genes examined using qRT-PCR, while the standard error between technical replicates (n=3) for each individual sample was low (ranging from 0.01 to 0.7).
Fold change in expression of selected up-regulated (n=6) and down-regulated (n=5) E. coli O157:H19 triclosan-tolerant mutant genes compared with the wildtype (p<0.05) in the (a) presence of triclosan (MTWTT) and (b) absence of triclosan (MUWTU) to confirm the accuracy of the transcriptomic data. Negative values correspond to a gene expression decrease. The fold change data presented are the average of three biological repeats for the microarray and reverse-transcriptase-polymerase chain reaction (RT-PCR) experiments. Error bars indicate standard deviation from mean RT-PCR expression.
Amplification and DNA sequencing of fabI gene
DNA sequencing of the fabI gene showed that the triclosan-tolerant mutant T3 5H5M had one single nucleotide polymorphism (SNP) in comparison to the study wild-type T3 5H5 and the E. coli O157:H7 sequenced reference strain EDL933. This SNP resulted in an amino-acid substitution (G-93-V) in the protein enoyl-(acyl carrier protein) reductase that has been previously reported to contribute to the triclosan-tolerant phenotype in E. coli.33
Comparison of TEM images of wild-type T3 5H5 and mutant T3 5H5M isogenic strains
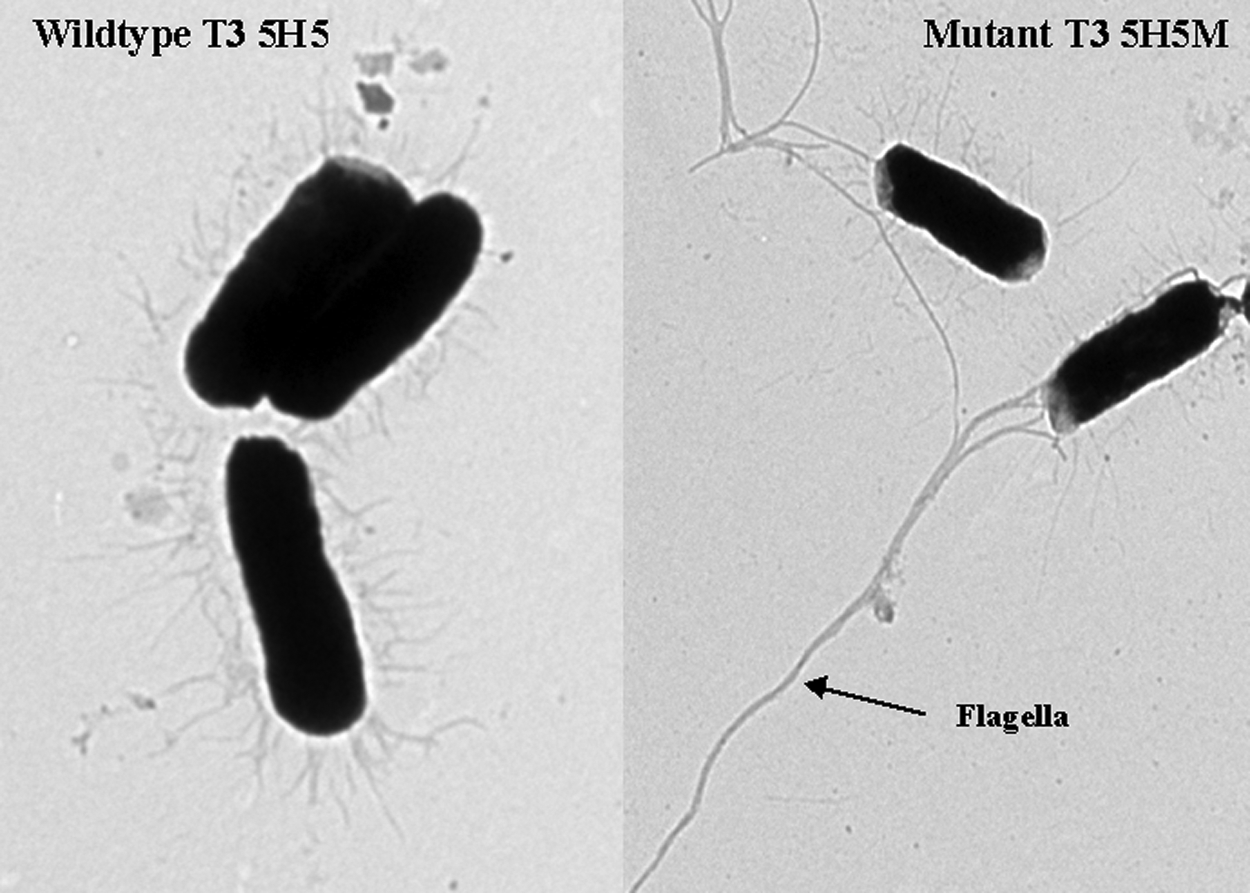
An analysis of the microarray and qRT-PCR data indicated that expression of a high proportion of genes belonging to the flagellar assembly pathway were highly up-regulated in the triclosan-tolerant mutant compared with the wild type. TEM was used to investigate whether any differences in the appearance of the flagella could be identified visually between T3 5H5 and T3 5H5M. The TEM images confirmed the presence of extended flagella in the mutant isolate compared with its corresponding triclosan-susceptible wild type (Fig. 3).
Transmission electron microscopy photos of triclosan-susceptible wild-type E. coli O157:H19 strain T3 5H5 (minimum inhibitory concentration [MIC] 6.25 μg/ml) and its corresponding triclosan-tolerant mutant T3 5H5M (MIC >8,000 μg/ml).
Motility assay
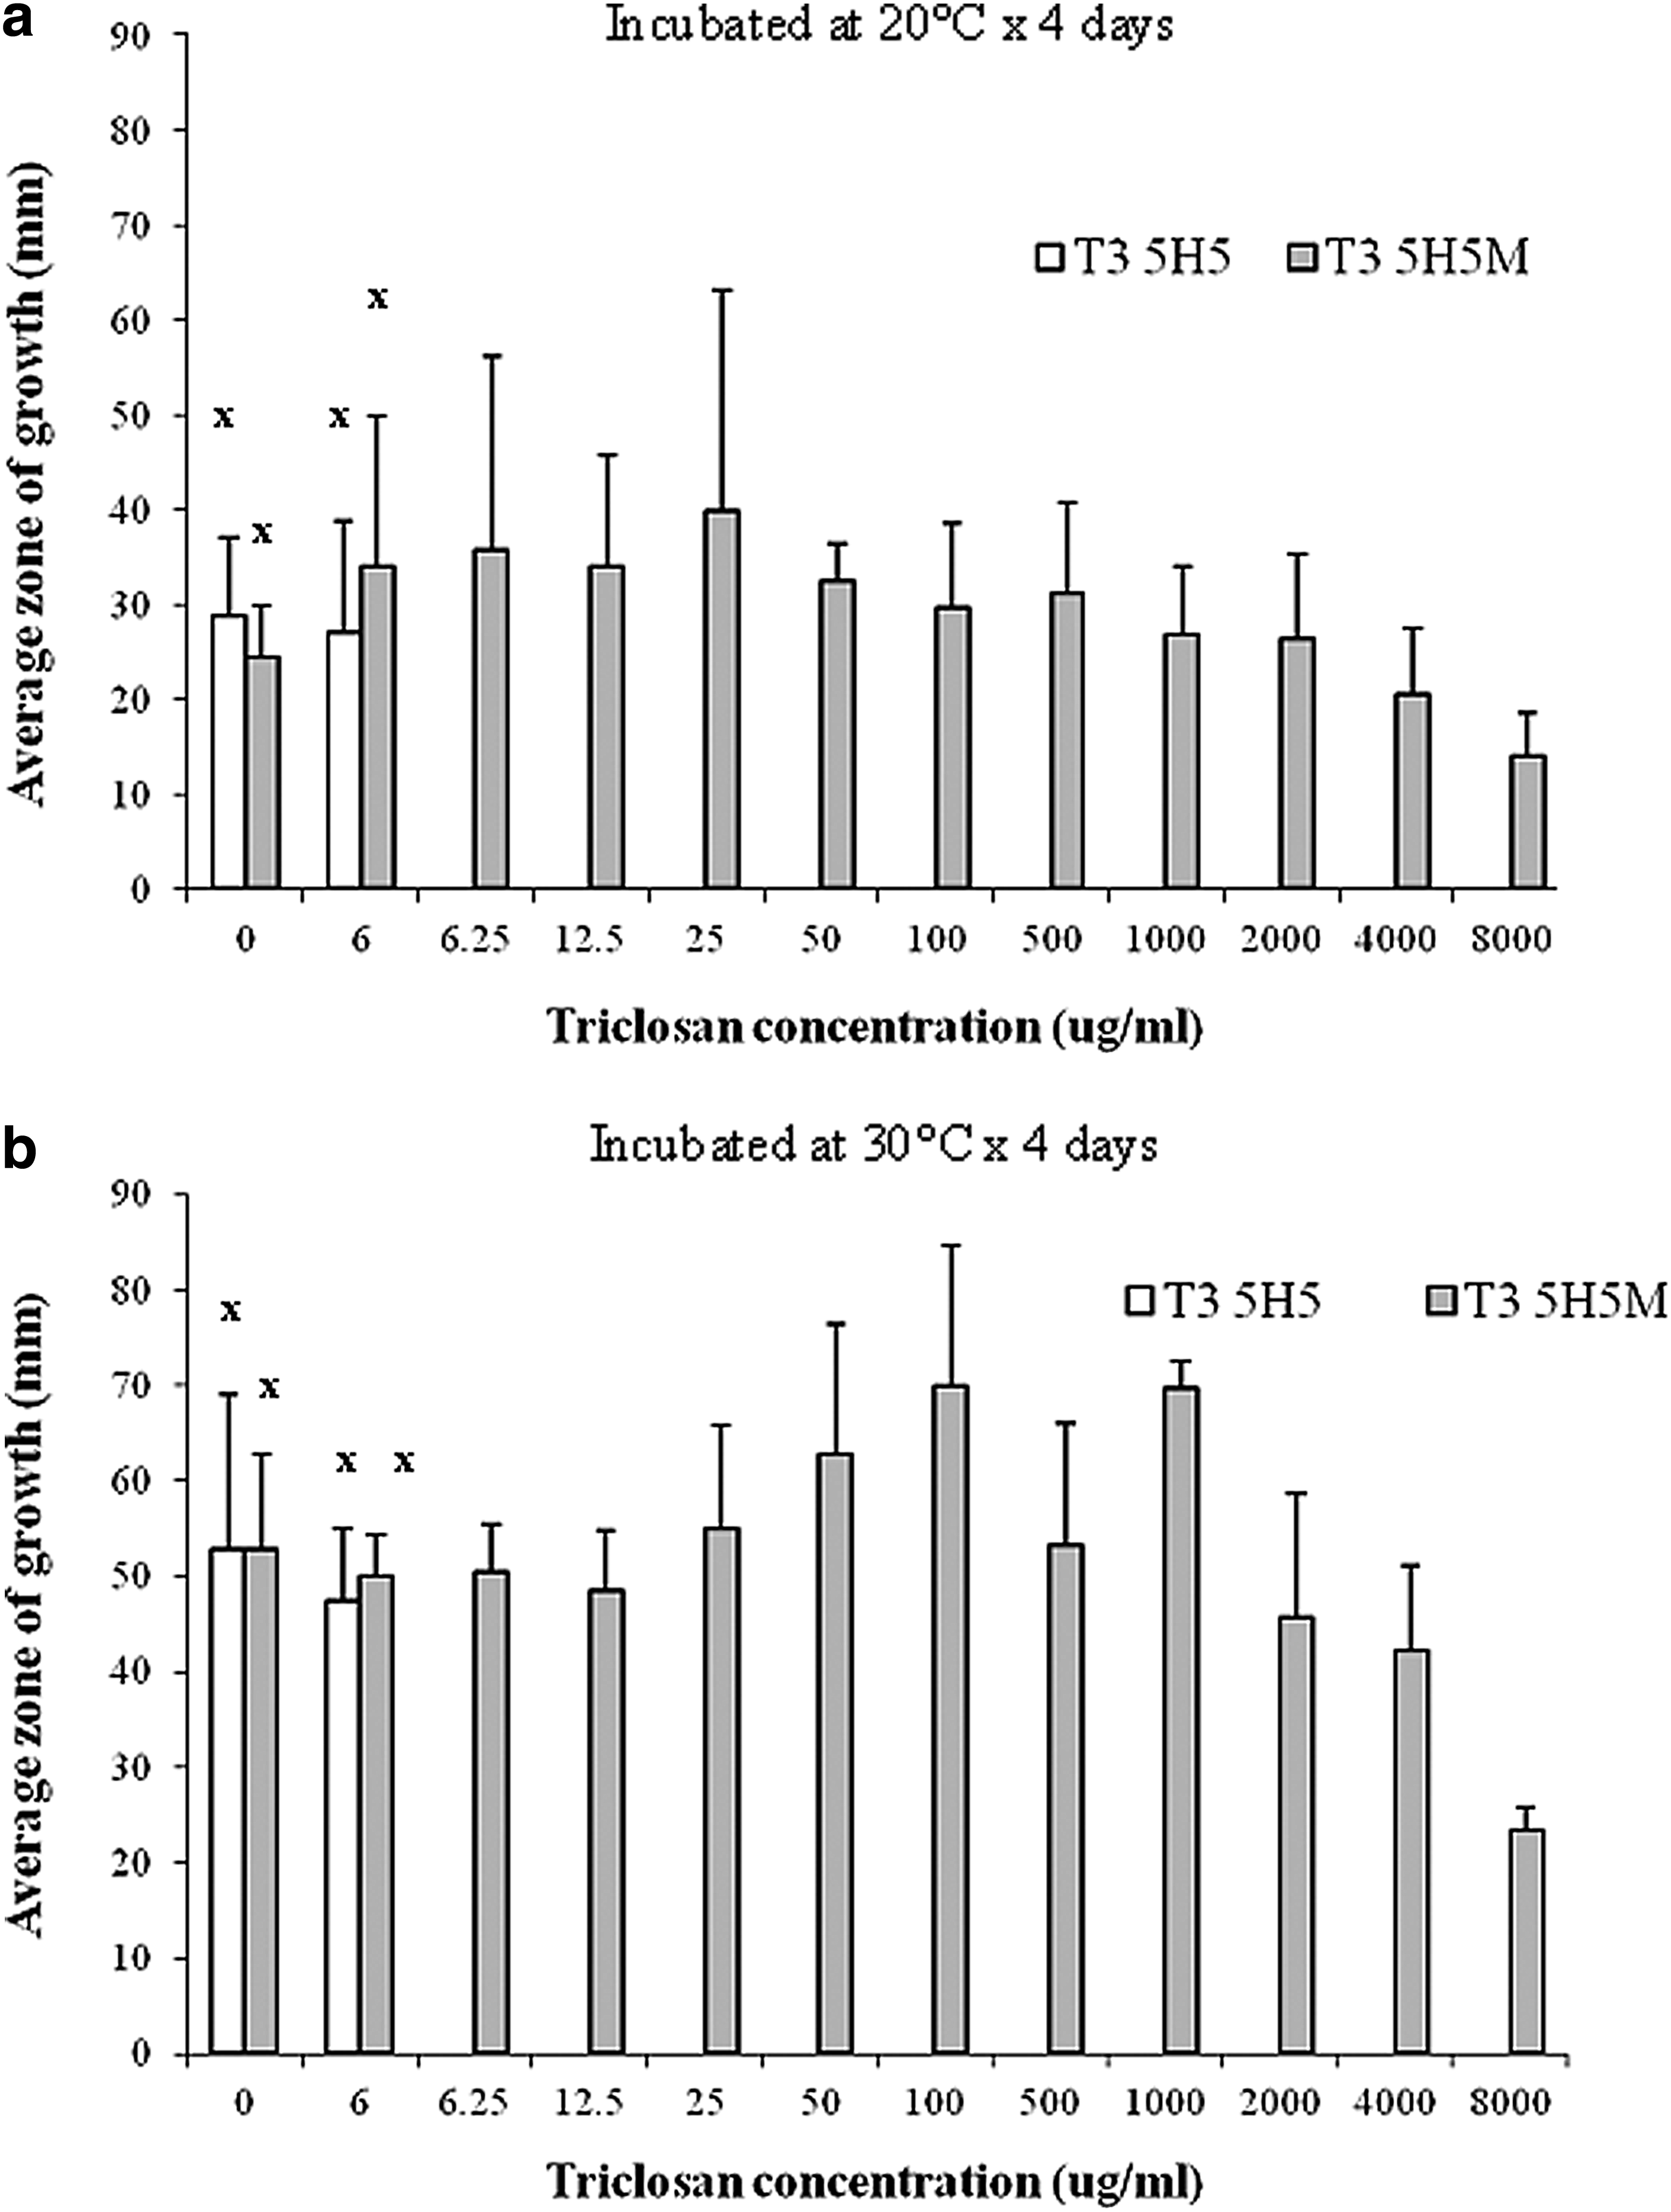
The motility of the wild-type and mutant E. coli O157:H19 isolates in semi-solid agar were investigated in the absence and presence of increasing concentrations of triclosan. In the absence of triclosan, the motility of the wild type and mutant were similar at both incubation temperatures of 20°C and 30°C (Fig. 4). Only the triclosan-tolerant mutant grew in triclosan concentrations above the parent MIC of 6.25 μg/ml. The motility of the mutant varied depending on the level of triclosan exposure. A significant effect of triclosan concentrations was detected at 30°C but not at 20°C.
Motility of E. coli O157:H19 wild-type T3 5H5 (MIC 6.25 μg/ml) and its corresponding triclosan-tolerant mutant T3 5H5M (MIC >8,000 μg/ml) after 4 days of incubation at (a) 20°C and (b) 30°C. Columns marked with “x” are not significantly different (p>0.05). Error bars indicate standard deviation from mean zone of growth.
Discussion
The widespread use of biocides as disinfectants, preservatives, and antiseptics to control microbial contamination in the environment is a global multi-billion dollar industry.30 Central to this industry is the addition of biocidal active agents such as triclosan to many consumer products.
Triclosan is a popular biocidal additive to personal care products due to its broad-spectrum activity against many Gram-negative and -positive bacteria.29 The over-use of triclosan and other biocide-containing products may contribute to emergence of biocide tolerant zoonotic pathogens elaborating cross-resistance to clinically important antibiotics,3,17,28 although others maintain the potential for biocide tolerance to occur in pathogenic bacteria in situations outside the laboratory is minimal.2,6,12,21 Previous studies in Ireland have found that while the majority of VTEC and Salmonella strains tested against a panel of food grade commercial biocides were susceptible to the working concentrations recommended by the manufacturers, stable high-level resistance to triclosan was readily achieved by daily sub-culture in increasing concentrations of this chemical.5,32
Before 1998, triclosan was thought to have no specific target site for its mode of action and instead killed bacteria by general chemical interference with the microbial cell structure or internal biochemistry, and, thus, was not capable of inducing a resistance response by the same mechanisms as antibiotics.29 However, a study by McMurry et al.19 was the first to identify enoyl-acyl carrier protein reductase (FabI) as one of the main cellular processes targeted by triclosan. Inhibition of this enzyme by triclosan affects the biosynthesis of fatty acids, which are important for cell growth and function. E. coli tolerance to triclosan has been attributed to a missense mutation in the fabI gene that leads to an amino-acid substitution at G-93-V.13 DNA sequencing of the fabI gene contained in the E. coli O157:H19 wild-type strain and the isogenic triclosan-tolerant mutant confirmed that T3 5H5M contained the same missense mutation as previously described. This was also reflected in the microarray results, as gene expression for the fabI gene was 3.2-fold greater in the mutant compared with the wild type.
In addition to the expected differences between the wild-type and mutant fabI genes, the microarray study revealed that the transcriptome of the wild type was significantly different from the mutant for >1,350 genes. The level of expression was similar for a number of the same genes in both the presence and absence of triclosan, indicating that the FC data observed were due to core transcriptomic differences between the wild-type and mutant strain rather than in response to triclosan stress. The expression of a number of pathway genes involved in motility, transport, and metabolism were up-regulated in the triclosan-tolerant mutant compared with the wildtype. Studies have indicated that the efflux pump AcrAB-TolC and the global regulators of antibiotic resistance and active efflux MarA and SoxS play an essential role in the tolerance of E. coli and Salmonella to triclosan.1,18,20 The present study found that while gene expression was up-regulated in marA, marR, marB, and soxS for the triclosan tolerant mutant, it was down-regulated in other genes involved in multidrug efflux. This was an unexpected result, as efflux pumps have been suggested to be one of the central mechanisms involved in the development of bacterial tolerance to triclosan.20,35 This may explain the lack of cross-resistance to antibiotics associated with the triclosan-tolerant mutant T3 5H5M used in this study,32 while other researchers have shown that triclosan-tolerant mutants have reduced susceptibility to antibiotics compared with their corresponding wild types.3,17
The acrB, tolB, and mdtE genes were between 1.26 and 2.65-fold up-regulated in the untreated and treated wild type compared with untreated and treated triclosan-tolerant mutant strains, while tolC, which is necessary for the outer membrane channel in the efflux pump AcrAB-TolC, was only minimally up-regulated in the wild type untreated with triclosan. The wild-type and mutant samples were treated with triclosan at a concentration of 6 μg/ml, which was just below the MIC of the wild type (6.25 μg/ml). Gilbert et al.11 suggested that exposure of a singular bacterial strain to sub-inhibitory levels of biocidal active agents such as triclosan will select for spontaneously generated efflux mutants, which may also be sufficient to confer clinical resistance to antibiotics. This proposed bacterial response to sub-inhibitory levels of triclosan may explain the transcriptomic data for multidrug efflux observed in the present study for the wild-type E. coli O157:H19 isolate but does not clarify why the expression of efflux pumps as suggested in the literature were down-regulated or unchanged in the corresponding mutant with high-level tolerance to triclosan (MIC >8,000 μg/ml). Webber et al.35 demonstrated that bacterial tolerance to triclosan is multifactoral, and a number of resistance mechanisms act in synergy to achieve high-level resistance. In a similar way, gene expression data from the present microarray experiment suggest that the mechanisms of high-level triclosan tolerance observed in the mutant T3 5H5M may be also due to some other pathway in addition to active efflux and FabI G93V.
Thirty-three of the thirty-eight pathway genes involved in flagellar assembly and 16 out of 19 bacterial chemotaxis genes were up-regulated in the triclosan-tolerant mutant T3 5H5M compared with the triclosan-susceptible wild-type strain, suggesting that increased expression of these genes could potentially contribute toward development of the triclosan-tolerant phenotype. This included the flhDC operon, which is the master regulator for flagellar expression and motility, and the flagellar sigma subunit of RNA polymerase fliA, which is released to activate class 3 operons that encode the outer subunits of the flagellum and additional proteins for flagellar function and chemotaxis.26 These results are in agreement with a proteomic study performed by our group, where the FliC protein was identified in four isoforms with increased expression in the triclosan-tolerant mutant in the presence and absence of triclosan in comparison to the wild type.31 TEM visually confirmed the differences in flagellar gene expression indicated by the microarray study, and the mutant was found to possess much longer flagella in comparison to its triclosan-susceptible counterpart. Since the motility of the wild-type and mutant strains did not significantly differ according to the results of the motility assay, the differences in flagellar length in the triclosan-tolerant mutant did not seem to correspond to increased motility. Up-regulated expression of a number of the pathway genes belonging to flagellar assembly has been previously reported in an E. coli O157 wild-type isolate exposed to triclosan compared with an untreated control, but similar to our study, no difference in E. coli motility was observed between the treated and untreated isolates.1 The potential contribution, if any, of extended flagella by the mutant to the development of bacterial tolerance to triclosan is unclear and would require further investigation by gene deletion studies.
In addition to their role in motility, flagella are also involved in biofilm formation, binding to host proteins, adherence, invasion, and colonization of host cells. Erdem et al.9 showed that the flagella of enteropathogenic E. coli and enterohaemorrhagic E. coli possess adhesive properties, which contribute toward their ability to colonize host mucosal surfaces such as bovine and human intestinal tissue. Data from the present study indicated that the flu and csgD genes involved in biofilm formation and regulation, respectively7,23 were down-regulated in the triclosan-tolerant mutant compared with the wild type. Biofilm formation is suggested to be important for the survival of pathogens such as E. coli under various environmental conditions and contributes toward their tolerance to treatment with biocides, enabling them to persist in food processing plants.30 Studies done by our group examining adherence and invasion properties, and the ability to form biofilms in both the wild-type and triclosan-tolerant mutant found that enhanced triclosan tolerance was shown to be associated with increased biofilm formation and invasion31 and, therefore, may lead to increase persistence potential in food processing environments. Down-regulation of csgD corresponds with the observed increase in expression of flagellar genes, as it is a repressor of the fliEFGH operon.23 It also corresponds with the curli negative phenotype of the mutant,31 as csgD is reported as the master regulator of curli production.23 Decreased expression of flu corresponds with a decrease in Antigen 43 as shown in another study,31 despite the mutant's enhanced biofilm-forming ability.
In addition to up-regulated flagellar gene expression, a number of genes that are essential for the chemotaxis-signaling cascade were up-regulated in the triclosan-tolerant mutant. Chemotaxis is a mechanism by which bacteria efficiently and rapidly respond to the changes in the chemical composition of their environment so that they can avoid unfavorable ones and modulate the direction of flagellar rotation in order to move to more chemically favorable surroundings.4 Gene expression was up-regulated in the mutant for the chemotaxis-specific receptor genes aer, tar, and tsr, known to mediate responses to specific attractant and repellent stimuli, and the cheY gene, the protein product of which shuttles back and forth between the receptor complexes and transduces the signal from the receptors to the flagella. In order to fully address the role of chemotaxis in the cellular response of the mutant to triclosan, a set of gene deletion mutants would need to be studied in capillary assays or soft agar assays.
In conclusion, the present study identified core transcriptomic differences between a triclosan-susceptible E. coli O157:H19 wild-type strain and its corresponding laboratory generated mutant displaying stable enhanced tolerance to triclosan (MIC >8,000 μg/ml). In particular, the expression of a number of genes belonging to the flagellar assembly and bacterial chemotaxis pathways were up-regulated in the triclosan-tolerant mutant. TEM confirmed the presence of extended flagella in the triclosan-tolerant mutant. Motility assays indicated that there was no significant difference in motility between the wild type and mutant, and thus the potential contribution of extended flagella to the triclosan-tolerant phenotype would require further investigation.
Footnotes
Acknowledgments
This work was supported by funding from the Food Institute Research Measure (FIRM) administrated by the Department of Agriculture, Food, and the Marine, Ireland, Project no: 08/RD/TAFRC/616.
Disclosure Statement
M.L., A.S., D.M., G.D., S.F., and C.M.B. have nothing to disclose.
References
1.
BaileyA.M., ConstantinidouC., IvensA., GarveyM.I., WebberM.A., ColdhamN., HobmanJ.L., WainJ., WoodwardM.J., and PiddockL.J.V.2009. Exposure of Escherichia coli and Salmonella enterica serovar Typhimurium to triclosan induces a species-specific response, including drug detoxification. J. Antimicrob. Chemother., 64:973–985.
2.
BeumerR., BloomfieldS.F., ExnerM., FaraG.M., NathK.J., and ScottE.2000. Microbial Resistance and Biocides: A Review by the International Scientific Forum on Home Hygiene (IFH). Available at http://ifh-homehygiene.org (Online.) Accessed July17, 2013.
3.
BraoudakiM., and HiltonA.C.2004. Adaptive resistance to biocides Salmonella enterica and Escherichia coli O157 and cross-resistance to antimicrobial agents. J. Clin. Microbiol., 42:73–78.
4.
BrenA., and EisenbachM.2000. How signals are heard during bacterial chemotaxis: protein-protein interactions in sensory signal propagation. J. Bacteriol., 182:6865–6873.
5.
CondellO., IversenC., CooneyS., PowerK.A., WalshC., BurgessC., and FanningS.2012. Efficacy of biocides used in the modern food industry to control Salmonella enterica, and links between biocide tolerance and resistance to clinically relevant antimicrobial compounds. Appl. Environ. Microbiol., 78:3087–3097.
6.
CottellA., DenyerS.P., HanlonG.W., OchsD., and MaillardJ.2009. Triclosan-tolerant bacteria: changes in susceptibility to antibiotics. J. Hosp. Infect., 72:71–76.
7.
Da ReS., Le QuereB., GhigoJ.M., and BeloinC.2007. Tight modulation of Escherichia coli bacterial biofilm formation through controlled expression of adhesion factors. Appl. Environ. Microbiol., 10:3391–3403.
8.
DolanA., BurgessC.M., BarryT.B., FanningS., and DuffyG.2009. A novel quantitative reverse-transcription PCR (qRT-PCR) for the enumeration of total bacteria, using meat micro-flora as a model. J. Microbiol. Methods, 77:1–7.
9.
ErdemA.L., AvelinoF., Xicohtencatl-CortesJ., and GirónJ.A.2007. Host protein binding and adhesive properties of H6 and H7 flagella of attaching and effacing Escherichia coli. J. Bacteriol., 189:7426–7435.
10.
GentlemaR.C., CareyV.J., BatesD.M., BolstadB., DettlingM., DudoitS., EllisB., GautierL., GeY., GentryJ., HornikK., HothornT., HuberW., IacusS., IrizarryR., LeischF., LiC., MaechlerM., RossiniA.J., SawitzkiG., SmithC., SmythG., TierneyL., YangJ.Y., and ZhangJ.2004. Bioconductor: open software development for computational biology and bioinformatics. Genome Biol., 5:R80.
11.
GilbertP., and McBainA.J.2003. Potential impact of increased use of biocides in consumer products on prevalence of antibiotic resistance. Clin. Microbiol. Rev., 16:189–208.
12.
GilbertP., McBainA.J., and BloomfieldS.F.2002. Biocide abuse and antimicrobial resistance: being clear about the issues. J. Antimicrob. Chemother., 50:137–139.
13.
HeathR.J., RubinJ.R., HollandD.R., ZhangE., SnowM.E., and RockC.O.1999. Mechanism of triclosan inhibition of bacterial fatty acid synthesis. J. Biol. Chem., 274:11110–11114.
14.
HuangD.W., ShermanB.T., and LempickiR.A.2009. Systematic and integrative analysis of large gene lists using DAVID bioinformatics resources. Nat. Protoc., 4:44–57.
15.
HuangD.W., ShermanB.T., and LempickiR.A.2009. Bioinformatics enrichment tools: paths toward the comprehensive functional analysis of large gene lists. Nucleic Acids Res., 37:1–13.
16.
KanehisaM., GotoS., SatoY., FurumichiM., and TanabeM.2012. KEGG for integration and interpretation of large-scale molecular datasets. Nucleic Acids Res., 40:D109–D114.
17.
KaratzasK.A.G., RandallL.P., WebberM., PiddockL.J.V., HumphreyT.J., WoodwardM.J., and ColdhamN.G.2008. Phenotypic and proteomic characterization of multiply antibiotic-resistant variants of Salmonella enterica serovar Typhimurium selected following exposure to disinfectants. Appl. Environ. Microbiol., 74:1508–1516.
18.
KaratzasK.A.G., WebberM.A., JorgensenF., WoodwardM.J., PiddockL.J.V., and HumphreyT.J.2007. Prolonged treatment of Salmonella enterica serovar Typhimurium with commercial disinfectants selects for multiple antibiotic resistance, increased efflux and reduced invasiveness. J. Antimicrob. Chemother., 60:947–955.
19.
McMurryL.M., OethingerM., and LevyS.B.1998. Triclosan targets lipid synthesis. Nature, 394:531–532.
20.
McMurryL.M., OethingerM., and LevyS.B.1998. Overexpression of marA, soxS, or acrAB produces resistance to triclosan in laboratory and clinical strains of Escherichia coli. FEMS Microbiol. Lett., 166:305–309.
21.
MeyerB., and CooksonB.2010. Does microbial resistance or adaption to biocides create a hazard in infection and control?. J. Hosp. Infect., 76:200–205.
22.
MorrisD.G., WatersS.M., McCarthyS.D., PattonJ., EarleyB., FitzpatrickR., MurphyJ.J., DiskinM.G., KennyD.A., BrassA., and WathesD.C.2009. Pleiotropic effects of negative energy balance in the postpartum dairy cow on splenic gene expression: repercussions for innate and adaptive immunity. Physiol. Genomics, 39:28–37.
23.
OgasawaraH., YamamotoK., and IshihamaA.2011. Role of the biofilm formation master regulator CsgD in cross-regulation between biofilm formation and flagellar synthesis. J. Bacteriol., 193:2587–2597.
PearsonR.D., LiuX., SanguinettiG., MiloM.M., LawrenceN.D., and RattrayM.2009. puma: a bioconductor package for propagating uncertainty in microarray analysis. BMC Bioinformatics, 10:211.
26.
PesaventoC., BeckerG., SommerfeldtN., PosslingA., TschowriN., MehlisA., and HenggeR.2008. Inverse regulatory coordination of motility and curli-mediated adhesion in Escherichia coli. Genes Dev., 22:2434–2446.
27.
RozenS., and SkaletskyH.J.. 2000. Primer3 on the WWW for general users and for biologist programmers. In KrawetzS. and MisenerS. (ed.), Bioinformatics. Methods and Protocols: Methods in Molecular Biology. Humana Press, Totowa, NJ, pp 365–386.
28.
RussellA.D.2003. Biocide use and antibiotic resistance: the relevance of laboratory findings to clinical and environmental situations. Lancet Infect. Dis., 3:794–803.
29.
SalehS., HaddadinR.N.S., BailleS., and CollierP.J.2011. Triclosan–an update. Lett. Appl. Microbiol., 52:87–95.
SheridanÁ., LenahanM., CondellO., Bonilla-SantiagoR., SergeantK., RenautJ., DuffyG., FanningS., NallyJ.E., and BurgessC.M.2013. Proteomic and phenotypic analysis of triclosan tolerant verocytotoxigenic Escherichia coli O157:H19. J. Proteomics, 80:28–90.
32.
SheridanÁ., LenahanM., DuffyG., FanningS., and BurgessC.2012. The potential for biocide tolerance in Escherichia coli and its impact on the response to food processing stresses. Food Cont., 26:98–106.
33.
SivaramanS., ZwahlenJ., and BellA.F.2003. Structure activity studies on the inhibition of FabI, the enoyl reductase from Escherichia coli, by triclosan, kinetic analysis of mutant FabIs. Biochemistry, 46:4406–4413.
34.
ThomasK.M., McCannM.S., ColleryM.M., LoganA., WhyteP., McDowellD.A., and DuffyG.2012. Tracking verocytotoxigenic Escherichia coli O157, O26, O111, O103 and O145 in Irish cattle. Int. J. Food Microbiol., 153:288–296.
35.
WebberM.A, RandallL.P., CoolesS., WoodwardM.J., and PiddockL.J.V.2008. Triclosan resistance in Salmonella enterica serovar Typimurium. J. Antimicrob. Chemother., 62:83–91.
36.
YuB.J., KimJ.A., and PanJ.2010. Signature gene expression profile of triclosan-resistant Escherichia coli. J. Antimicrob. Chemother., 65:1171–1177.