
Abstract
Abstract
Purpose:
NR2E3 is an orphan nuclear receptor expressed exclusively in photoreceptor cells of the retina. NR2E3-specific modulators may prolong photoreceptor survival in patients with dry age-related macular degeneration and other forms of retinal degeneration. To definitively establish NR2E3 as a photoreceptor protection target, identification of small-molecule NR2E3 modulators and their testing in animal models of retinal degeneration are required. Development of the high-throughput screen (HTS)-compatible screen for small-molecule NR2E3 modulators is the first step toward this goal.
Methods:
Purification protocol for isolation of the functionally competent soluble NR2E3 protein after its expression in the insect Sf9 cells was developed. The time-resolved fluorescence energy-transfer (TR-FRET) assay assessing agonist-sensitive interaction between apo-NR2E3 and transcriptional corepressor RetCOR was used for characterization of the previously reported putative NR2E3 agonist, Compound 11a, and to conduct the HTS for novel small-molecule NR2E3 modulators (direct and inverse agonists). A counterscreen TR-FRET assay that measures the affect of test compounds on PPARγ interaction with corepressor NCOR was used for assessing the specificity of compounds identified in the HTS.
Results:
We developed the cell-free TR-FRET assay for small-molecule NR2E3 modulators, which is based on agonist-induced disruption of the interaction between GST-tagged apo-NR2E3 and MBP-tagged fragment of transcriptional corepressor RetCOR. Compound 11a, a putative NR2E3 agonist, did not affect the NR2E3–RetCOR interaction, as was established by its titration in the developed assay. The assay was miniaturized for an ultralow-volume 1,536-well format and automated into 3 simple pipetting steps. Consistent with excellent assay performance, the test runs established a Z′-score within the 0.6–0.8 range. Analysis of the mid-size National Institutes of Health collection of 315,001 structurally diverse drug-like compounds confirmed excellent assay performance, but did not reveal NR2E3-specific agonists or inverse agonists.
Conclusions:
A robust and reliable TR-FRET assay for small-molecule NR2E3-specific modulators suitable for the analysis of million compound-strong HTS libraries was developed. A previously described putative NR2E3 agonist, Compound 11a, is unlikely to represent a direct NR2E3 agonist. Application of the developed assay for screening of a more abundant and diverse compound collection be required for identification of synthetic NR2E3 ligands.
Introduction
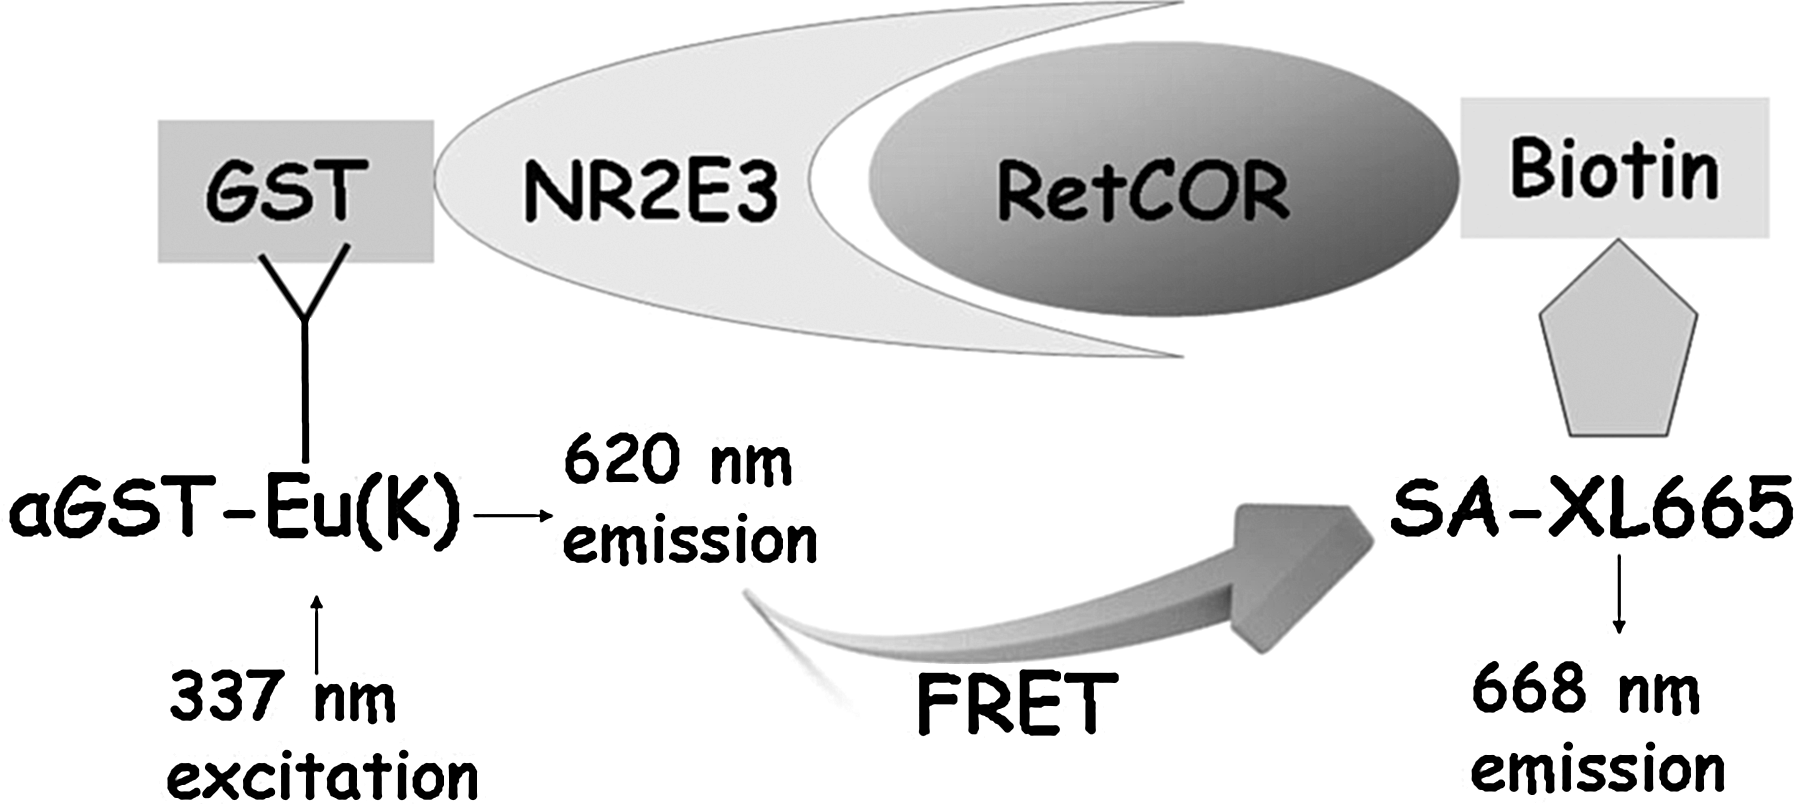
Schematic representation of the NR2E3 time-resolved fluorescence energy transfer (TR-FRET) assay. Unliganded apo-NR2E3 constitutively interacts with corepressor RetCOR, leading to association of 2 fluorescent probes, Eu cryptate and XL665, which are indirectly linked to GST-tagged NR2E3 and biotinylated RetCOR through Eu(K)-labeled anti-GST antibody and XL665-labeled streptavidin as shown in the picture. Light at 337 nm is used to excite Eu(K), which will emit at 620 nm. The proximity of the donor europium to the acceptor XL665 results in a transfer of energy between Eu(K) and XL665, which induces the specific FRET signal at 668 nm. Addition of an agonistic compound would prevent NR2E3–RetCOR interaction resulting in a signal decrease for TR-FRET at 668 nm.
Methods
Protein purification and peptide synthesis
For baculoviral expression in insect Sf9 cells, GST-fusion of the full-length NR2E3 cDNA fragment (amino acids 2–410; GenBank accession number NP_055064) was prepared by amplification with Vent polymerase, followed by subcloning into the Invitrogen pENTR/D-TOPO vector. After sequence verification, the pENTR/D-GST/NR2E3 plasmid was transformed into competent DH10BAC Escherichia coli cells (Invitrogen), which contain the baculovirus shuttle vector, the bMON14272 bacmid, along with the helper pMON7124 plasmid. After in vivo recombination, white colonies containing recombinant bacmid were selected on Luria-Bertani agar plates containing 50 μg/mL kanamycin, 7 μg/mL gentamicin, 10 μg/mL tetracycline, 100 μg/mL Bluo-gal, and 40 μg/mL isopropyl β-D-1-thiogalactopyranoside (IPTG). Cellfectin reagent (Invitrogen) was used to transfect insect Sf9 cells cultured in a 6-well plate with sequence-verified recombinant bacmid using the manufacturer's protocol. The amplified baculoviral stock was prepared in Sf9 cells as recommended in the Bac-to-Bac Baculovirus Expression System protocol (Invitrogen). For characterization of recombinant protein expression during preparation of the viral stock, Western blot analysis with the anti-GST antibody at 1:1,000 dilution (AnaSpec, Inc.; Catalog number 29531) and the anti-NR2E3 antibodies at 1:1,000 dilution (Abnova, Inc.; Catalog number H00010002-B01) was performed after solubilization of cell aliquots in the RIPA buffer. For protein purification, 300 mL culture of Sf9 cells was infected with high-titer recombinant baculovirus and grown at 27°C for 3 days. After precipitation, cells were resuspended in 150 mL of lysis buffer containing 10 mM Tris–HCl, pH 7.5, 150 mM NaCl, 10 mM MgCl2, 1 mM dithiothreitol (DTT), 10 μg/mL DNase, and 1 × complete protease inhibitor cocktail (Roche). Cells were lysed by 3 cycles of freezing and thawing. Cell lysate was cleared by centrifugation, and 20,000 g was applied onto a glutathione Sepharose column equilibrated in a loading buffer (10 mM Tris–HCl, pH 7.5, 150 mM NaCl, 1 mM DTT, and 0.05% NP-40). The column was washed with 10 column volumes of loading buffer. To avoid aggregation typical for heterologously expressed recombinant GST-NR2E3 protein, elution was conducted in high volume (100 mL) of 1% glutathione in the loading buffer. After elution, the protein was dialyzed against several changes of ice-cold loading buffer containing 10% glycerol. Physical purity was assessed by inspecting the Coomassie-stained sodium dodecyl sulfate–polyacrylamide gel electrophoresis (SDS-PAGE) gel, and by performing Western blotting with anti-GST and anti-NR2E3 antibodies. Concentration of purified GST-NR2E3 for different protein preparations was within the 117–281 nM range. Protein function for recombinant GST-NR2E3 was confirmed by conducting electrophoretic mobility-shift assay (EMSA) with purified protein using DR1- and Knix2-response element as described in the following section.
For bacterial expression, the ligand-binding domain of PPARγ (amino acids 176–477; GenBank accession number NP_005028) and NR-interacting domain of corepressor RetCor (amino acids 18–367; GenBank accession number BAA74913) were subcloned into the EcoRI-HindIII sites of pMAL-c4x and SalI-NotI sites of pGEX-6p-3 vectors, respectively. After introduction of expression plasmids to the BL21-Gold(DE3)pLysS E. coli strain (Stratagene), recombinant proteins (maltose-binding protein-tagged RetCOR and GST-tagged PPARγ-LBD) were purified from 1 L cultures using the AKTA FPLC system (GE Healthcare) equipped with 5-mL GST Trap HP (for GST-PPARγLBD) or MBP Trap HP (for MBP-RetCOR) columns, following the manufacturer's protocols. The MBP-RetCOR protein was biotinylated using the EZ-link Sulfo-NHS-LC-Biotin kit (Pierce) according to the manufacturer's protocol. Biotinylated protein was characterized by Western blotting with anti-MBP antibodies (New England Biolabs; catalog number E8032L) and with streptavidin-conjugated horseradish peroxidase.
Peptide NCOR2, Biotin-(aminohexanoic acid)-ADPASNLGLEDIIRKALMGSF-NH2, representing the second NR-interacting fragment of corepressor NCOR was synthesized by Genemed Synthesis, Inc.
Electrophoretic mobility-shift assay
The mobility-shift assay was conducted according to an established protocol.
27
The probe was prepared by annealing oligonucleotides containing DR1-response element (5′-CTAGTATCGAGGGTAG
Protein aggregation assay
Samples of purified protein were diluted into a series of buffer conditions with variable amounts of glycerol, NP-40, Triton X-100, KCl, NaCl along with 10 mM Tris–HCl, pH 7.5, and 1 mM DTT in the final volume of 100 μL. The samples were incubated at room temperature for 30 min and loaded onto the Nanosep 300K Omega centrifugal device (Pall Life Sciences). Soluble protein was separated from the aggregates using centrifugation at 15,000 g for 15 min. Protein aggregates retained on the membrane were solubilized using the RIPA buffer preheated at 70°C. After addition of a loading buffer, protein samples were analyzed by Western blot.
NR2E3-RetCOR TR-FRET assay conditions in the 384-well plate format
The assay was performed in white Costar 384-well polystyrene plates (Corning) in a 16-μL final volume. The final composition of 1 × HTRF buffer (Assay Buffer) was 10 mM Tris–HCl, pH 7.5, 100 mM potassium fluoride, 0.05% w/v bovine serum albumin, 0.05% NP-40, 1 mM DTT, and 6% glycerol. Ten microliters of a mix containing GST-NR2E3 (2.88 nM) and MBP-RetCOR (11.2 nM) in 1 × HTRF buffer was added to 4 μL of a compound dilution in 1 × buffer. After 16 h of incubation at 4°C, 2 μL of detection mix was added to a well to make 0.75 nM final concentration of Europium cryptate-anti-GST-antibody (Eu(K)-anti-GST Ab; CisBio) and 42 nM final concentration of Streptavidin-XL665 (SA-XL665; CisBio). Plates were incubated at 4°C for additional 16–24 h, followed by HTRF measurement on SpectraMax M5e Multimode Plate reader (Molecular Devices). Two readings were taken: Reading 1 for time-gated energy from Eu(K) to XL665 (337-nm excitation, 668-nm emission, counting delay 50 μs, counting window 400 μs) and Reading 2 for Eu(K) time-gated fluorescence (337-nm excitation, 620-nm emission, counting delay 50 μs, counting window 400 μs). The signal was expressed as the ratio of fluorescence intensity according to Equation (1):
where Fl668 nm represents the measured fluorescence emission at 668 nm, and Fl620 nm represents the measured fluorescence emission at 620 nm.
Positive control
As NR2E3 is an orphan NR, there are no known ligands that could be used as positive control during assay development and implementation. To mimic the effect of an agonist (i.e., to measure FRET signal in the absence of the NR2E3–RetCOR interaction), we measured the NR2E3–RetCOR interaction in the presence of 10 μM biotin (more than 1,000-fold molar excess over the biotinylated RetCOR protein).
Mammalian 2-hybrid assay
All expression constructs used in the mammalian 2-hybrid assay were made in the pcDNA5FRT vector (Invitrogen). The GAL-NCOR construct contains the N-terminal 147 amino acids of GAL4 DNA-binding domain fused to the NCOR NR-interacting domain (protein fragments bracketed by amino acids 1,946–2,458). VP16-NR2E3_LBD plasmid carries the fusion gene encoding VP16-activating domain and amino acids 114–410 of NR2E3; VP16-TRβ_LBD vector encodes the VP16 fusion with thyroid hormone receptor β1-amino acids 169–455; VP16-RARα_LBD vector encodes the VP16-activating domain and amino acids 154–462 of RARα. For assessing the effect of Compound 11a on NR2E3–NCOR, TRβ–NCOR, and RARα–NCOR interactions, CHO cells were plated into 96-well plates at 50,000 cells/well density and transiently transfected with a combination of pGL4.35 reporter (Promega), GAL-NCOR, and VP16-RNR_LBD (or VP16-TRβ_LBD and VP16-RARα_LBD) plasmids using the FuGene 6 transfection reagent (Roche Diagnostics) according to the manufacturer's protocol. Control agonists were 3,3′,5-triiodo-L-thyronine (Sigma-Aldrich) for TRβ and 5,6,7,8-tetrahydro-5,5,8,8-tetramethyl-2-naphthalenyl-1-propenyl benzoic acid (Biomol) for RARα. Compound 11a as well as control agonists were added to cells 24 h post-transfection, and incubation was continued in a serum-free medium for additional 24 h before measuring luciferase activity with the use of the Bright-Glo Luciferase Assay System (Promega).
NR2E3 HTS assay in the 1,536-well plate format
Before the assay, 5 μL of Assay Buffer was dispensed into columns 1 and 2 of 1,536-well assay plates (Greiner). Subsequently, 5 μL of 1.05× Assay Mixture containing 1.42 nM NR2E3 and 7.35 RetCOR in the assay buffer was dispensed into the remaining 46 columns. Next, 24 nL per well of the molecular libraries small-molecule repository (MLSMR) library test compound in dimethyl sulfoxide (DMSO, final concentration 3.9 μM), DMSO alone (low control, 0.4% final concentration), or biotin (high control, 10 μM final concentration) in DMSO was dispensed to the appropriate wells using a Pin Tool transfer unit (GNF/Kalypsys). After pinning of the compounds, 1 μL of 6× Detection Mix containing 4.5 nM Eu(K)-anti-GST and 252 nM Streptavidin-D2 (SA-D2) in Assay Buffer was dispensed in all wells. After dispensing, final concentrations of the reagents were 0.75 nM Eu(K)-anti GST, 42 nM Streptavidin-D2, 1.35 nM GST-tagged NR2E3, and 7 nM biotinylated RetCOR. The plates were then incubated for 5 h at 4°C, and well TR-FRET was measured. After excitation at 340 nm, well fluorescence was monitored at 617 nm [Eu(K)] and 671 nm (D2) with the ViewLux microplate reader (Perkin Elmer). For each well, a fluorescence ratio was calculated according to Equation (1).
PPARγ counterscreen
The assay was conducted as the primary screen above, with the exception of NR2E3 and RetCOR addition. Instead, 1.05× Assay Mixture containing 7.35 nM PPARγ and 315 nM biotinylated NCOR2 peptide in assay buffer were dispensed, resulting in reagent final concentrations of 7.0 nM GST-PPARγ and 300 nM Biotin-NCOR2. Rosiglitazone at final concentration of 10 μM was used as positive control.
Compound library
The MLSMR library was provided by BioFocus DPI via the NIH's Roadmap Molecular Libraries Initiative. The MLSMR library is a highly diversified collection of small molecules in which more than 50% of compounds exhibit molecular weights between 350 and 410 g/mol. The library comprises both synthetic and natural products, from either commercial or academic sources, which can be grouped into the 3 following categories: (1) specialty sets of known bioactive compounds such as drugs and toxins, (2) focused libraries aimed at specific target classes, and (3) diversity sets covering a large area of the chemical space. Details regarding compound selection for this library are provided online at http://mli.nih.gov/mli/compound-repository/mlsmr-compounds/ (last accessed on June 24, 2012).
NR2E3 HTS screen
Before the HTS screen, validation experiments were performed using the library of pharmacologically active compounds (LOPAC; Sigma). Optimized assay parameters determined in validation experiments were identical to conditions during the primary HTS campaign. For the primary assay, 315,001 compounds were tested in singlicate on the miniaturized NR2E3 HTRF assay described above at a final nominal test concentration of 3.9 μM (final DMSO concentration of 0.4%) using the automated Scripps Research Institute Molecular Screening Center robotic platform. The agonism was measured as normalized percent inhibition of each compound and was calculated on a per-plate basis as described in the Data processing and analysis section [Eq. (2) below]. The hit cutoff was calculated as the sum of the average percentage inhibition of all compounds tested plus 3 times their standard deviation. Compounds that exhibited greater percent inhibition than this cutoff parameter were declared active. Selected compounds were evaluated in triplicate in the NR2E3 assay for confirmation and in the PPARγ assay as a counterscreen. Results of each compound were reported as average percentage inhibition, plus or minus the associated standard deviation. The dose–response experiments were performed in triplicates on selected compounds using 10-0 point titrations with 1:3 serial dilutions starting at 39.8 μM in both the NR2E3 and PPARγ assays.
Data processing and analysis
For NR2E3 and PPARγ assays, raw fluorescence values were uploaded into the Scripps HTS database (MDL Information Systems), and the fluorescence ratio was calculated according to Equation (1). For the data analysis in the agonist mode of the assay, compound activity was normalized on a per-plate basis using Equation (2):
where high control corresponds to the wells from the same plate containing 10 μM biotin (100% inhibition control) for the NR2E3 assay and 10 μM Rosiglitazone for the PPARγ assay. Low control corresponds to wells from the same plate treated with DMSO only (0% inhibition). For the data analysis in the inverse agonist mode, compound activity was normalized on a per-plate basis using the same Equation (2) with inverse agonists (which increase the NR2E3–RetCOR interaction) showing negative% inhibition. As recommended, 28 a Z′-value >0.5 was required for plate in both assay modes.
Results
Purification of the functionally active NR2E3 protein
Purification of functionally active NR2E3 is a critical step in developing an in vitro assay for identification of its small-molecule modulators. Given that synthetic or endogenous NR2E3 ligands are yet to be identified, some of the frequently used formats for assessing functionality of purified NRs, such as competition binding or agonist-induced interaction with coactivators, could not be used for monitoring NR2E3 functionality during purification and assay development. We relied on the ability of a purified functionally active NR to recognize its response elements in EMSA to confirm functionality of NR2E3. First, we conducted EMSA experiments with CHO-cell-expressed wild-type NR2E3. Wild-type NR2E3 expressed in CHO cells is capable of binding to the DR1-response element and forming protein–DNA complexes (Fig. 2A, lane 2). The shifted band represents specific protein–DNA complexes, as it can be supershifted with the anti-NR2E3 antibody (Fig. 2A, lane 3), and was absent in control experiments when cell lysates from mock-transfected CHO cells were used in gel-shift experiments (Fig. 2A, lane 8). Importantly, expression of NR2E3 mRNA in a cell-free system, rabbit reticulocyte lysate, yielded a protein with a complex gel migration pattern that included the band of the expected molecular weight (Fig. 3A). In vitro synthesized NR2E3 formed a DNA–protein complex on DR1-response element (Fig. 2A, lane 4) that was unproportionally weak than CHO-cell-expressed NR2E3, even though equal protein amounts were taken into the EMSA assay. In addition, in vitro expressed NR2E3 seems to form high-molecular-weight aggregates visible even on the SDS-containing protein gel (Fig. 3A). As reduced activity of in vitro expressed NR2E3 in EMSA may indicate the importance of post-translational modifications in formation of fully functional NR2E3, we decided to focus on an eukaryotic expression system to produce functionally active NR2E3. Protein expression in insect Sf9 cells using baculoviral expression system allows high-yield protein production in an eukaryotic system. Using Bac-to-Bac system (Invitrogen), we generated recombinant baculoviruses for GST fusions of full-length NR2E3 as well as for the NR2E3-LBD fragment. After confirming production of faithful RNA transcripts for recombinant proteins using sequencing of reverse transcription polymerase chain reaction (RT–PCR) fragments covering the whole length of mRNA (data not shown), we accumulated high-titer stocks of recombinant baculoviruses and assessed the expression levels of GST-NR2E3 and GST-NR2E3LBD proteins using Western blotting. Figure 3B shows the data from a time-course experiment where we compared levels of expression in Sf9 cells for GST-NR2E3 and GST-NR2E3LBD over the period of 5 days postinfection. Based on the fact that the expression level for GST-NR2E3 was significantly higher than that of the GST-NR2E3LBD protein with the highest levels of GST-NR2E3 expression achieved at the second and third day postinfection, we decided to use full-length GST-tagged NR2E3 protein expressed in Sf9 cells for assay development. After purification of GST-NR2E3 from Sf9 cells using the GST-Trap column and AKTA FPLC system, we compared functionality of the FPLC-purified GST-NR2E3 preparation with that of the CHO-cell-expressed untagged NR2E3 protein using EMSA assay. As shown in Fig. 2B, FPLC-purified GST-NR2E3 generates EMSA signal of significantly lower intensity when compared with the CHO-expressed protein. Size fractionation analysis of FPLC-purified GST-NR2E3 on Superose 6 column revealed that the 2,000-kDa fraction represents the most predominant species in the purified GST-NR2E3 preparation (data not shown), indicating protein aggregation. To overcome aggregation that leads to purification of the inactive protein, we tested a variety of agents that are known to either destabilize aggregates or increase native protein stability. 29 Protein aggregation was assayed based on separation of aggregated and soluble NR2E3 using the Nanosep 300K Omega centrifugal device, as described in the Methods section. As shown in Fig. 4, high-volume gravity flow elution of GST-NR2E3 in a buffer containing 6% glycerol and 0.05% NP-40 produced soluble, though diluted, protein that was functionally active in the EMSA assay.
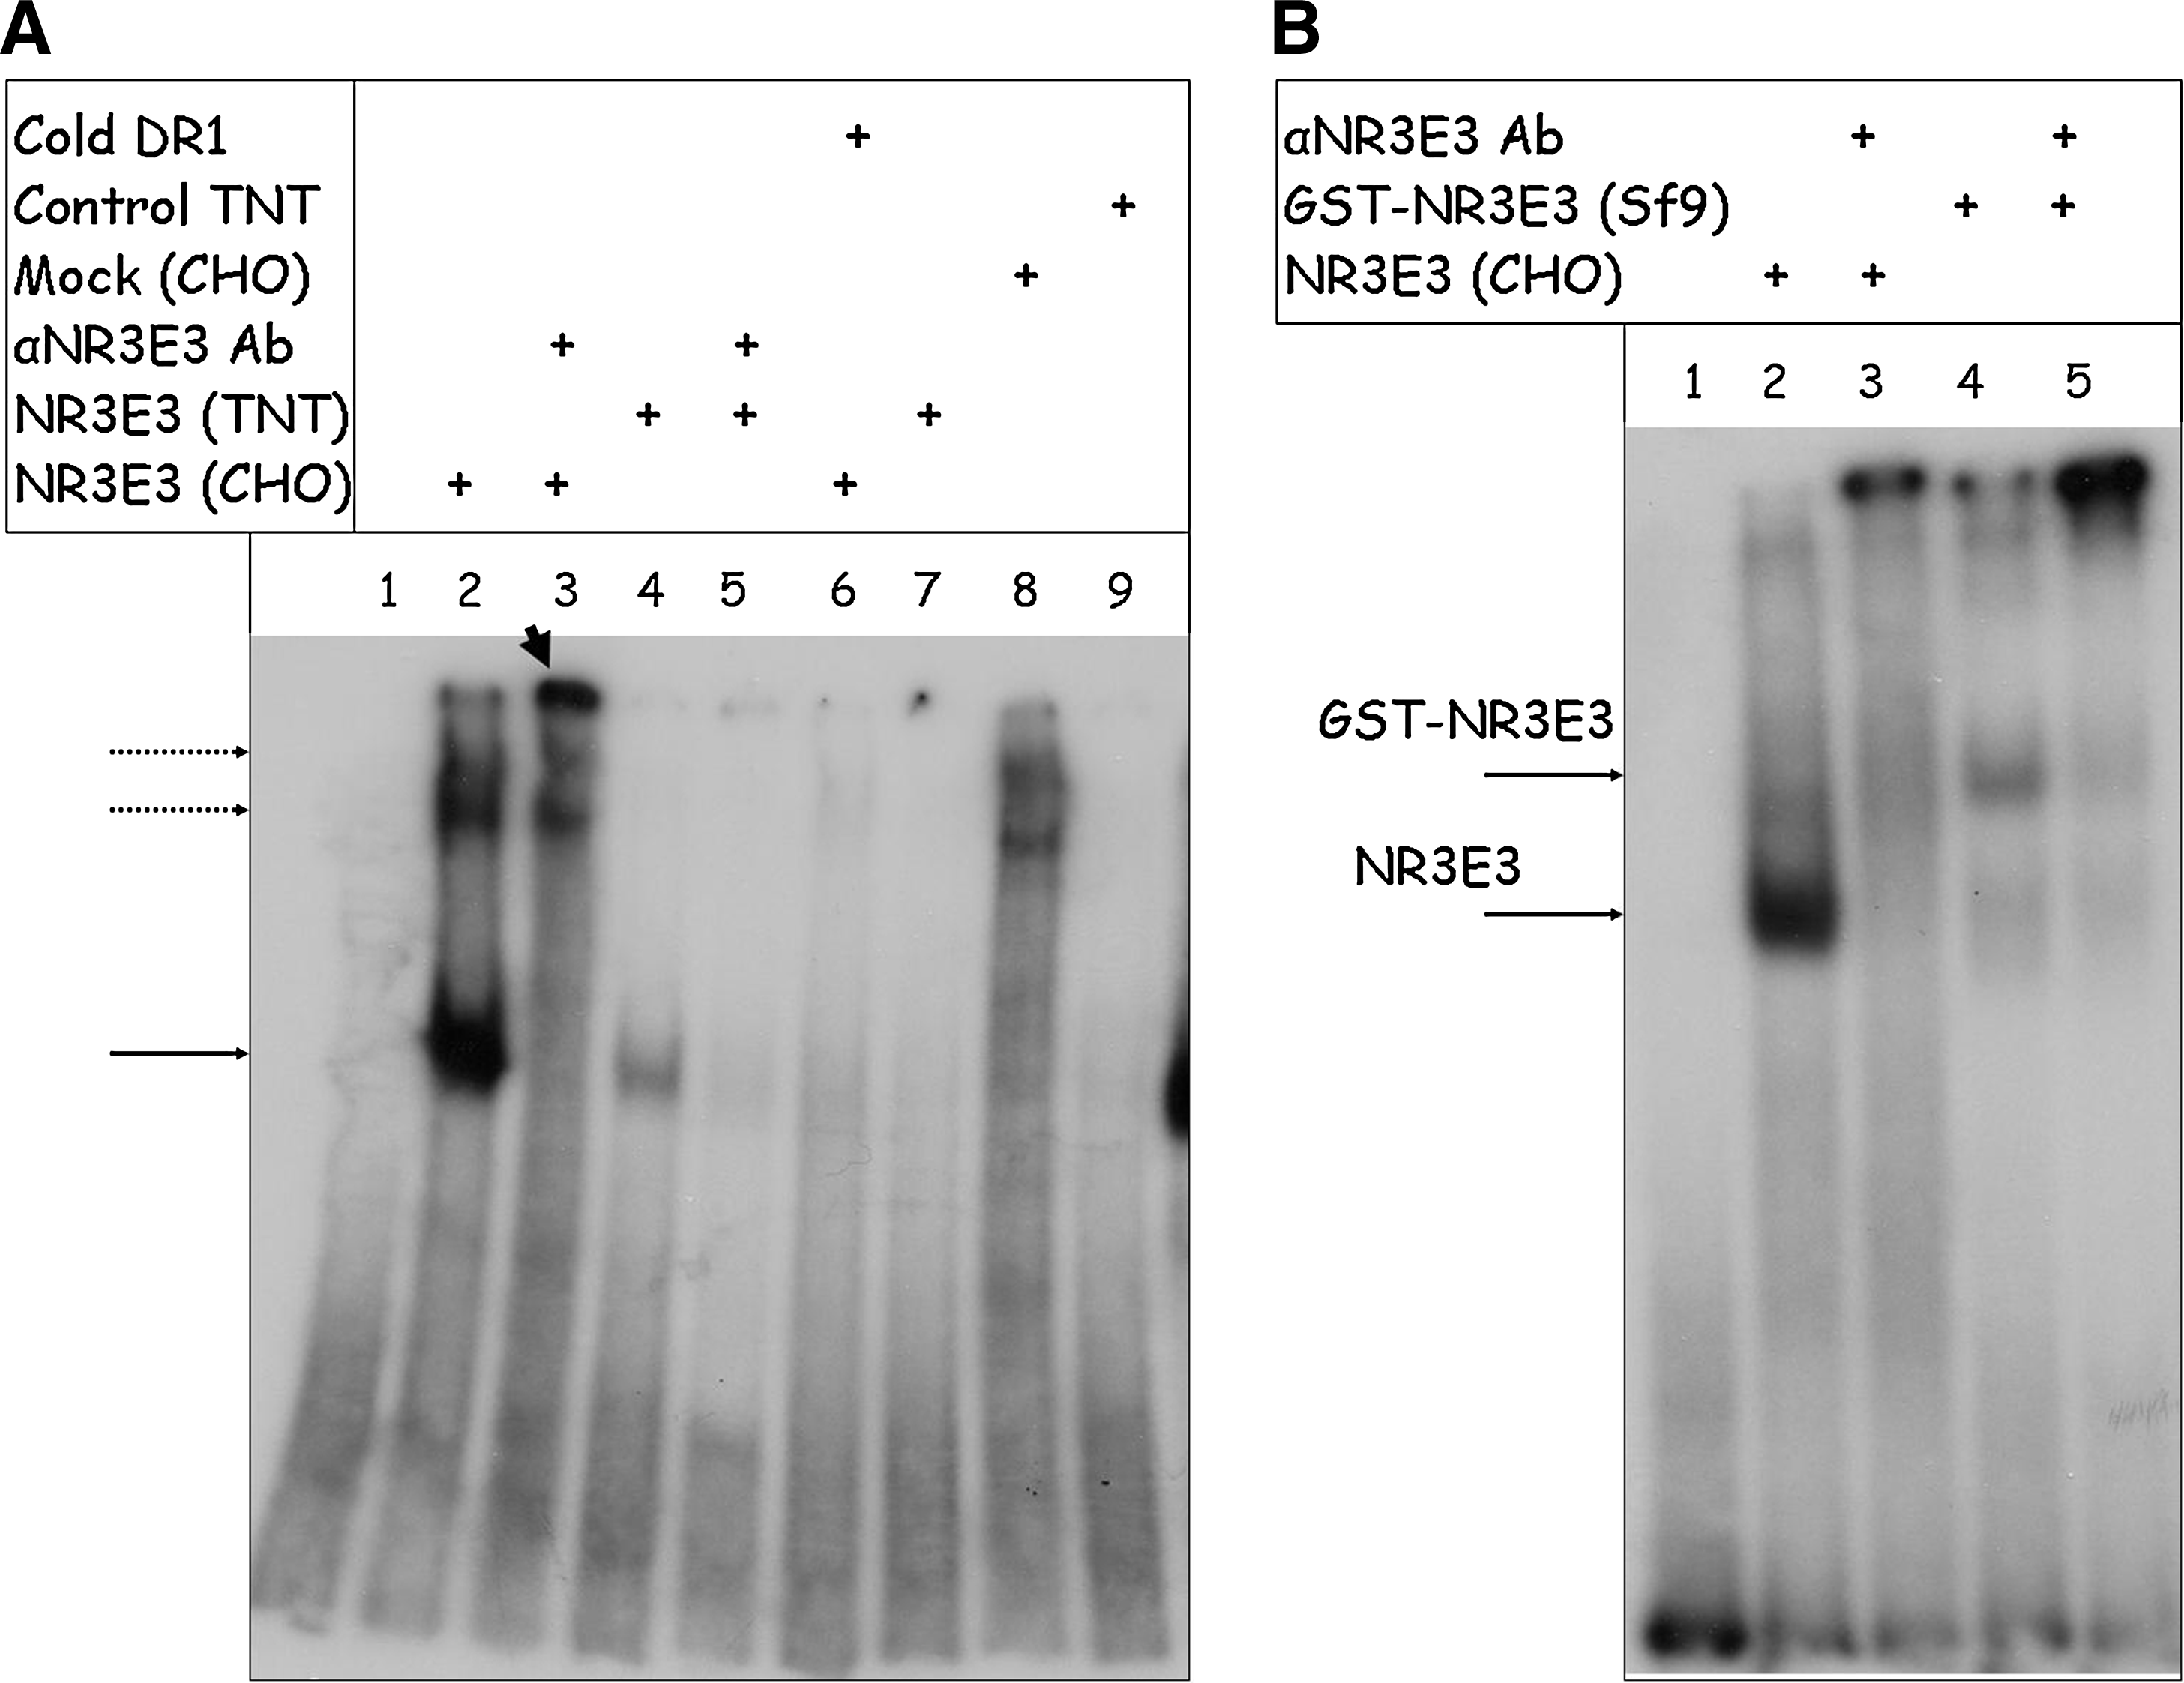
Characterization of protein NRE2E3 preparations in electrophoretic mobility-shift assay (EMSA).
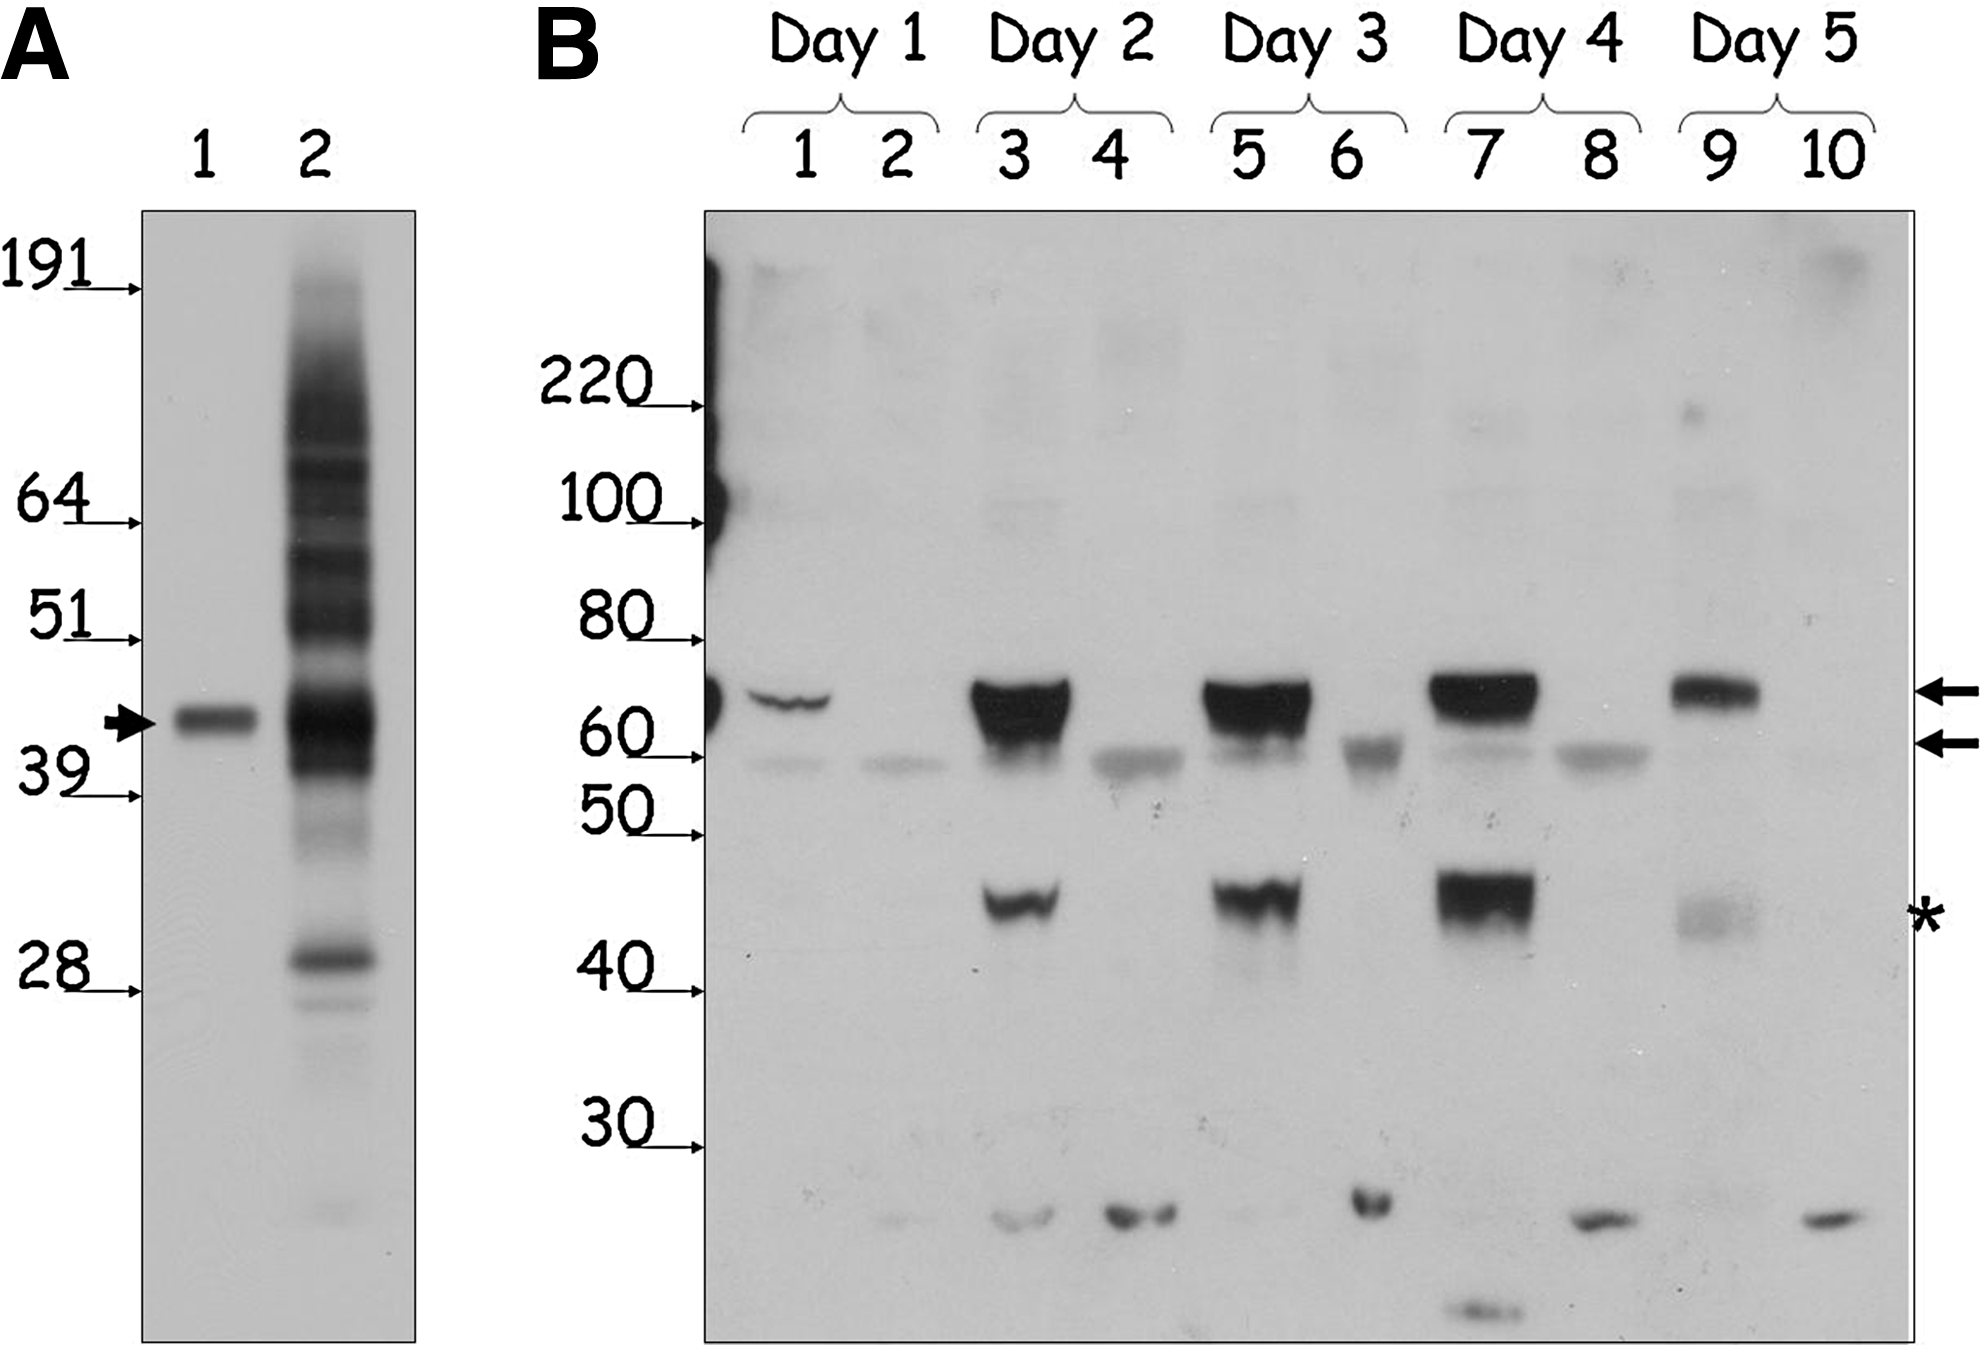
Western blot analysis of protein NRE2E3 preparations.
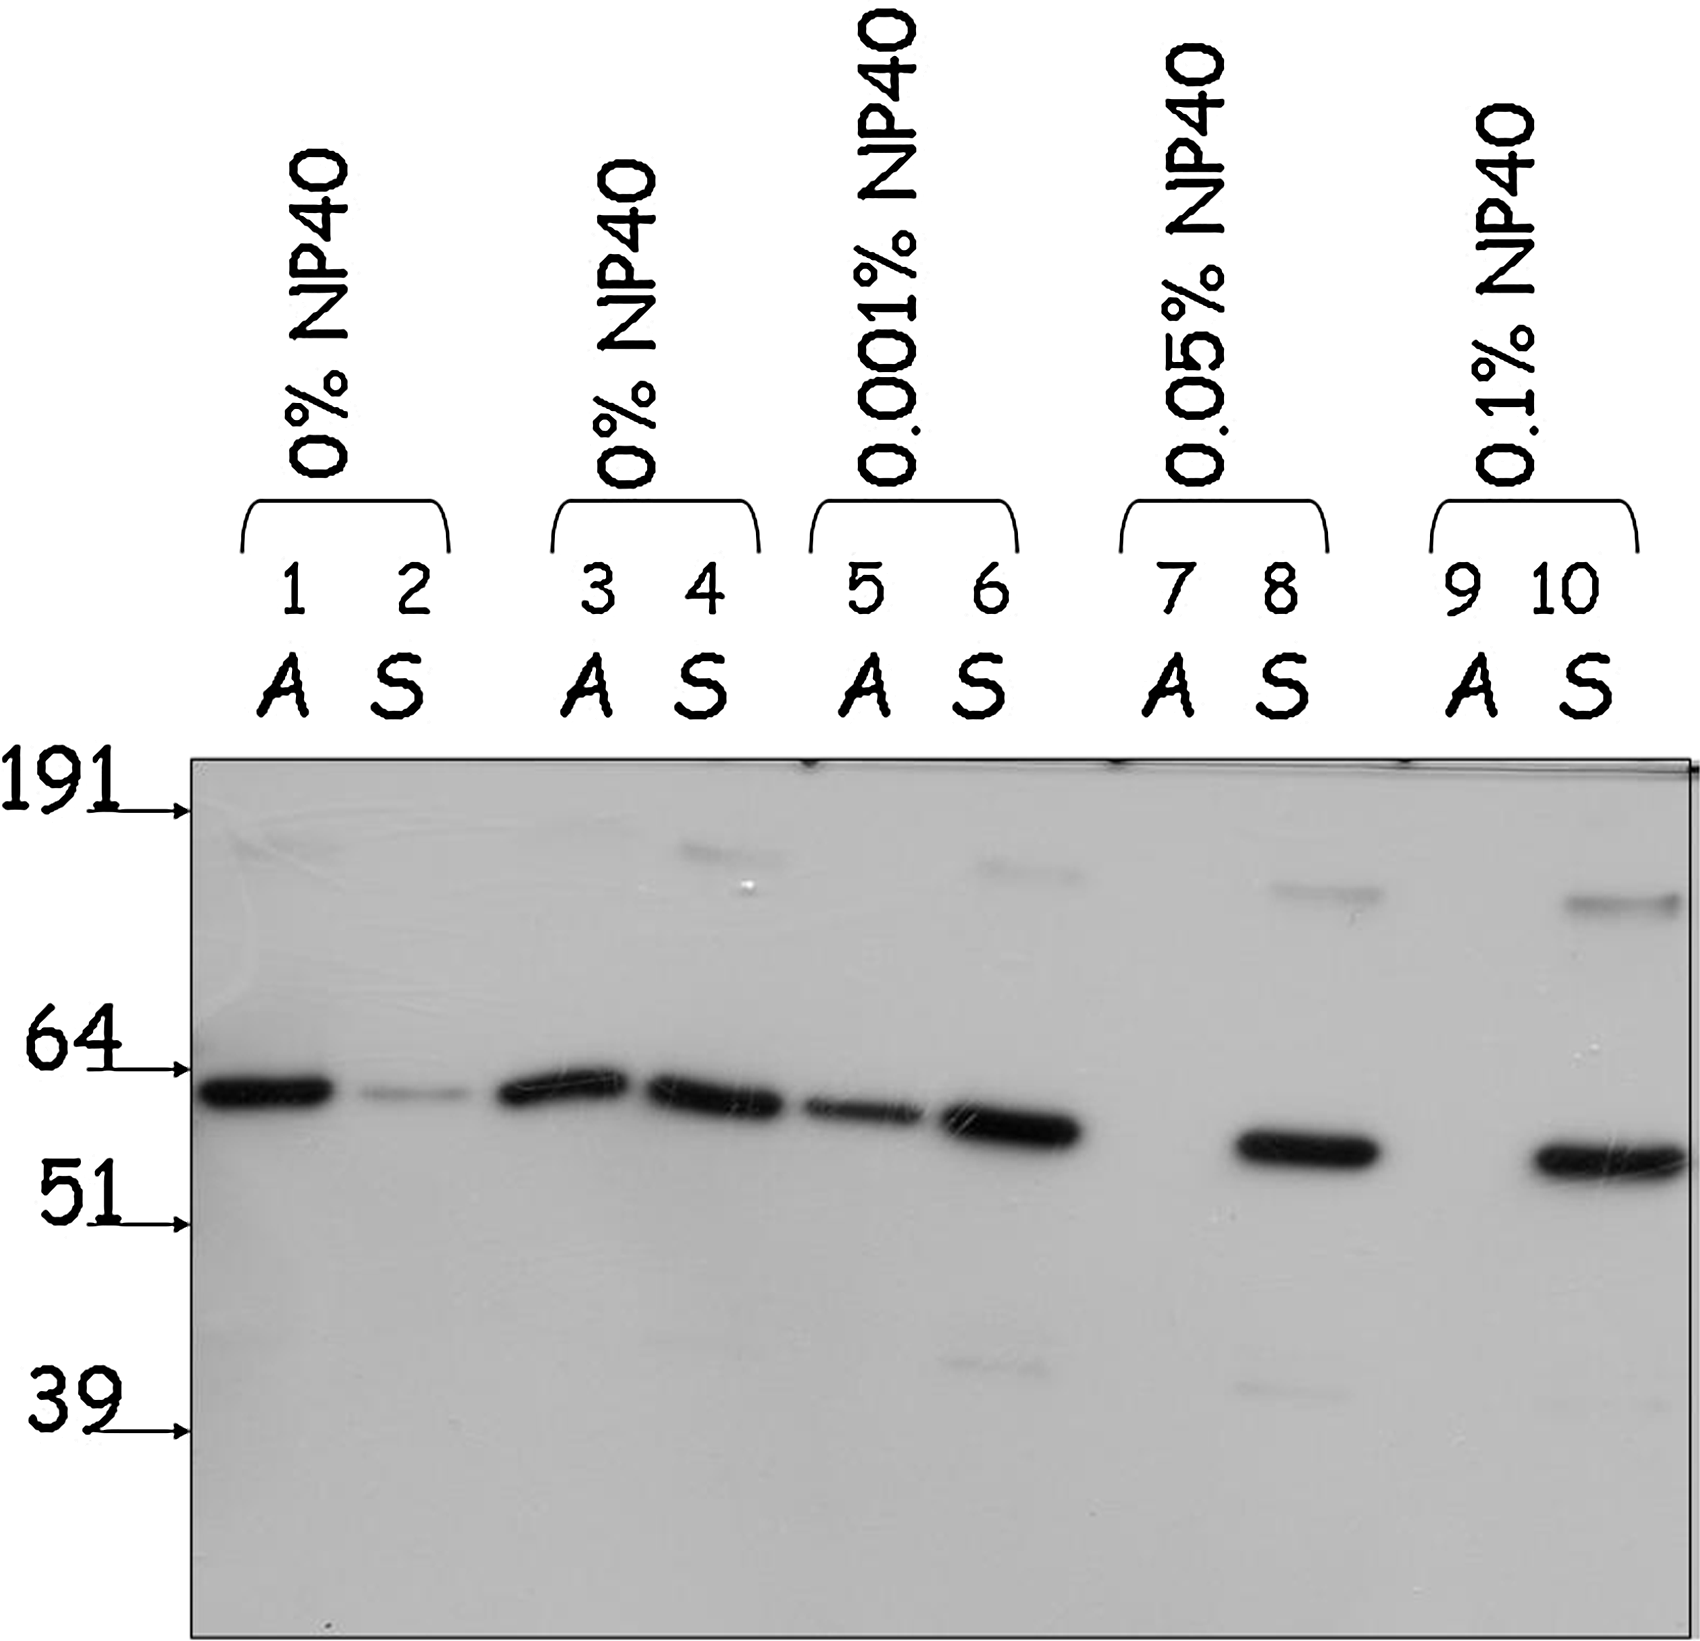
Aggregation assay of the FPLC- and gravity-flow purified GST-NR2E3 samples. Analysis was conducted using the Nanosep 300K Omega centrifugal device as described in the Methods section. FPLC-purified (lanes 1, 2) and gravity flow-purified (lanes 3–10) samples were diluted to the same protein concentration using the buffer containing 10 mM Tris–HCl, pH 7.5, 150 mM NaCl, 1 mM dithiothreitol, and 10% glycerol. NP-40 concentrations were adjusted as indicated in the figure. A and S lanes contain aggregated and native soluble protein fractions, respectively.
NR2E3 assay development and optimization (384-well format)
After comparing several synthetic and cloned fragments of corepressors SMRT, NCOR, and RetCoR for the ability to interact with purified apo-NR2E3, we developed an HTS-compatible TR-FRET assay that probes constitutive association of purified GST-NR2E3 and a biotinylated fragment of corepressor RetCOR in the absence of ligand. The purified proteins are added together in the presence of test compounds and Eu(K)-anti GST antibody and Streptavidin-XL665 (SA-XL665) or Streptavidin-D2 (SA-D2). Interaction between the RetCOR and NR2E3 partners brings the fluorophore-tagged antibody and Streptavidin together, leading to FRET between the fluorophores (Fig. 1). Test compounds that act as NR2E3 agonists would induce conformational changes in the NR2E3 LBD, leading to dissociation of the RetCOR corepressor and reduction in FRET signal. As NR2E3 is an orphan NR, no synthetic or endogenous agonist was available to serve as a positive control during assay development and implementation. To mimic the effect of an agonist (i.e., to assess FRET signal in the absence of SA-XL665/cryptate interaction), we measured the NR2E3–RetCOR interaction in the presence of 10 μM biotin (more than 1,000-fold molar excess over biotinylated RetCOR protein). After conducting optimization steps for incubation time, temperature, concentration of interacting proteins, and detection reagents in the 384-well format, several independent test runs were performed to assess the assay parameters. Consistent with excellent assay performance in the 384-well format, the test runs established the signal-to-background ratio (S/B) within the 4.7–5.5 range, %CV within the 4.5%–10% range, and a Z′-score within the 0.6–0.8 range.
PPARγ-NCOR2 counterscreen
The purpose of this biochemical assay is to determine whether compounds identified as active in the primary NR2E3/RetCOR screen are NR2E3 specific. PPARγ is known to constitutively interact with the corepressor NCOR fragment; a TR-FRET assay measuring agonist-dependent release of biotinylated NCOR2 peptide for purified PPARγ has been described in the literature. 30 We were able to reproduce and optimize the PPARγ–NCOR2 interaction assay to make it suitable for characterization of specificity for NR2E3 compounds. The IC50 value for roziglitazone, a well-characterized PPARγ agonist, was 50 nM, which is consistent with previously published data. 30
Characterization of a putative NR2E3 agonist (Compound 11a)
Identification of a single structural series of putative NR2E3 agonists exemplified by Compound 1 was previously reported. 23 A live-cell, transcription-based β-lactamase reporter assay was used to conduct the previously reported HTS that led to identification of Compound 1.22,23 Following that HTS, SAR optimization was possible only at a single position of this series where modifications of the benzimidazole 5-amide improved potency in transactivation and in mammalian 2-hybrid NCOR-release assays yielding Compound 11a. 23 In view of the fact that HTS screening, post-HTS characterization, and SAR optimization were performed in 2-cell-based reporter assays,22,23 there was a possibility that Compounds 1 and 11a may affect transcription of reporters indirectly. We resynthesized Compound 11a and conducted its analysis in the TR-FRET NR2E3–RetCOR interaction assay. We failed to detect any effect of Compound 11a on NR2E3–RetCOR interaction in the TR-FRET assay (Fig. 5A), thus proving that 11a does not act as a direct NR2E3 agonist in this assay. Moreover, while reproducing previously published data 23 on the effect of 11a on NR2E3–NCOR interaction in a cell-based mammalian 2-hybrid assay, we were able to confirm its dose-dependent inhibitory activity on NR2E3–NCOR interaction (Fig. 5B). However, this effect was nonspecific, as 11a similarly inhibited constitutive NCOR interaction with other NRs (TRβ and RARα), in control mammalian 2-hybrid experiments (Fig. 5C, D). Overall, it seems reasonable to suggest that the structural series exemplified by 11a does not comprise compounds representing direct NR2E3 agonists.
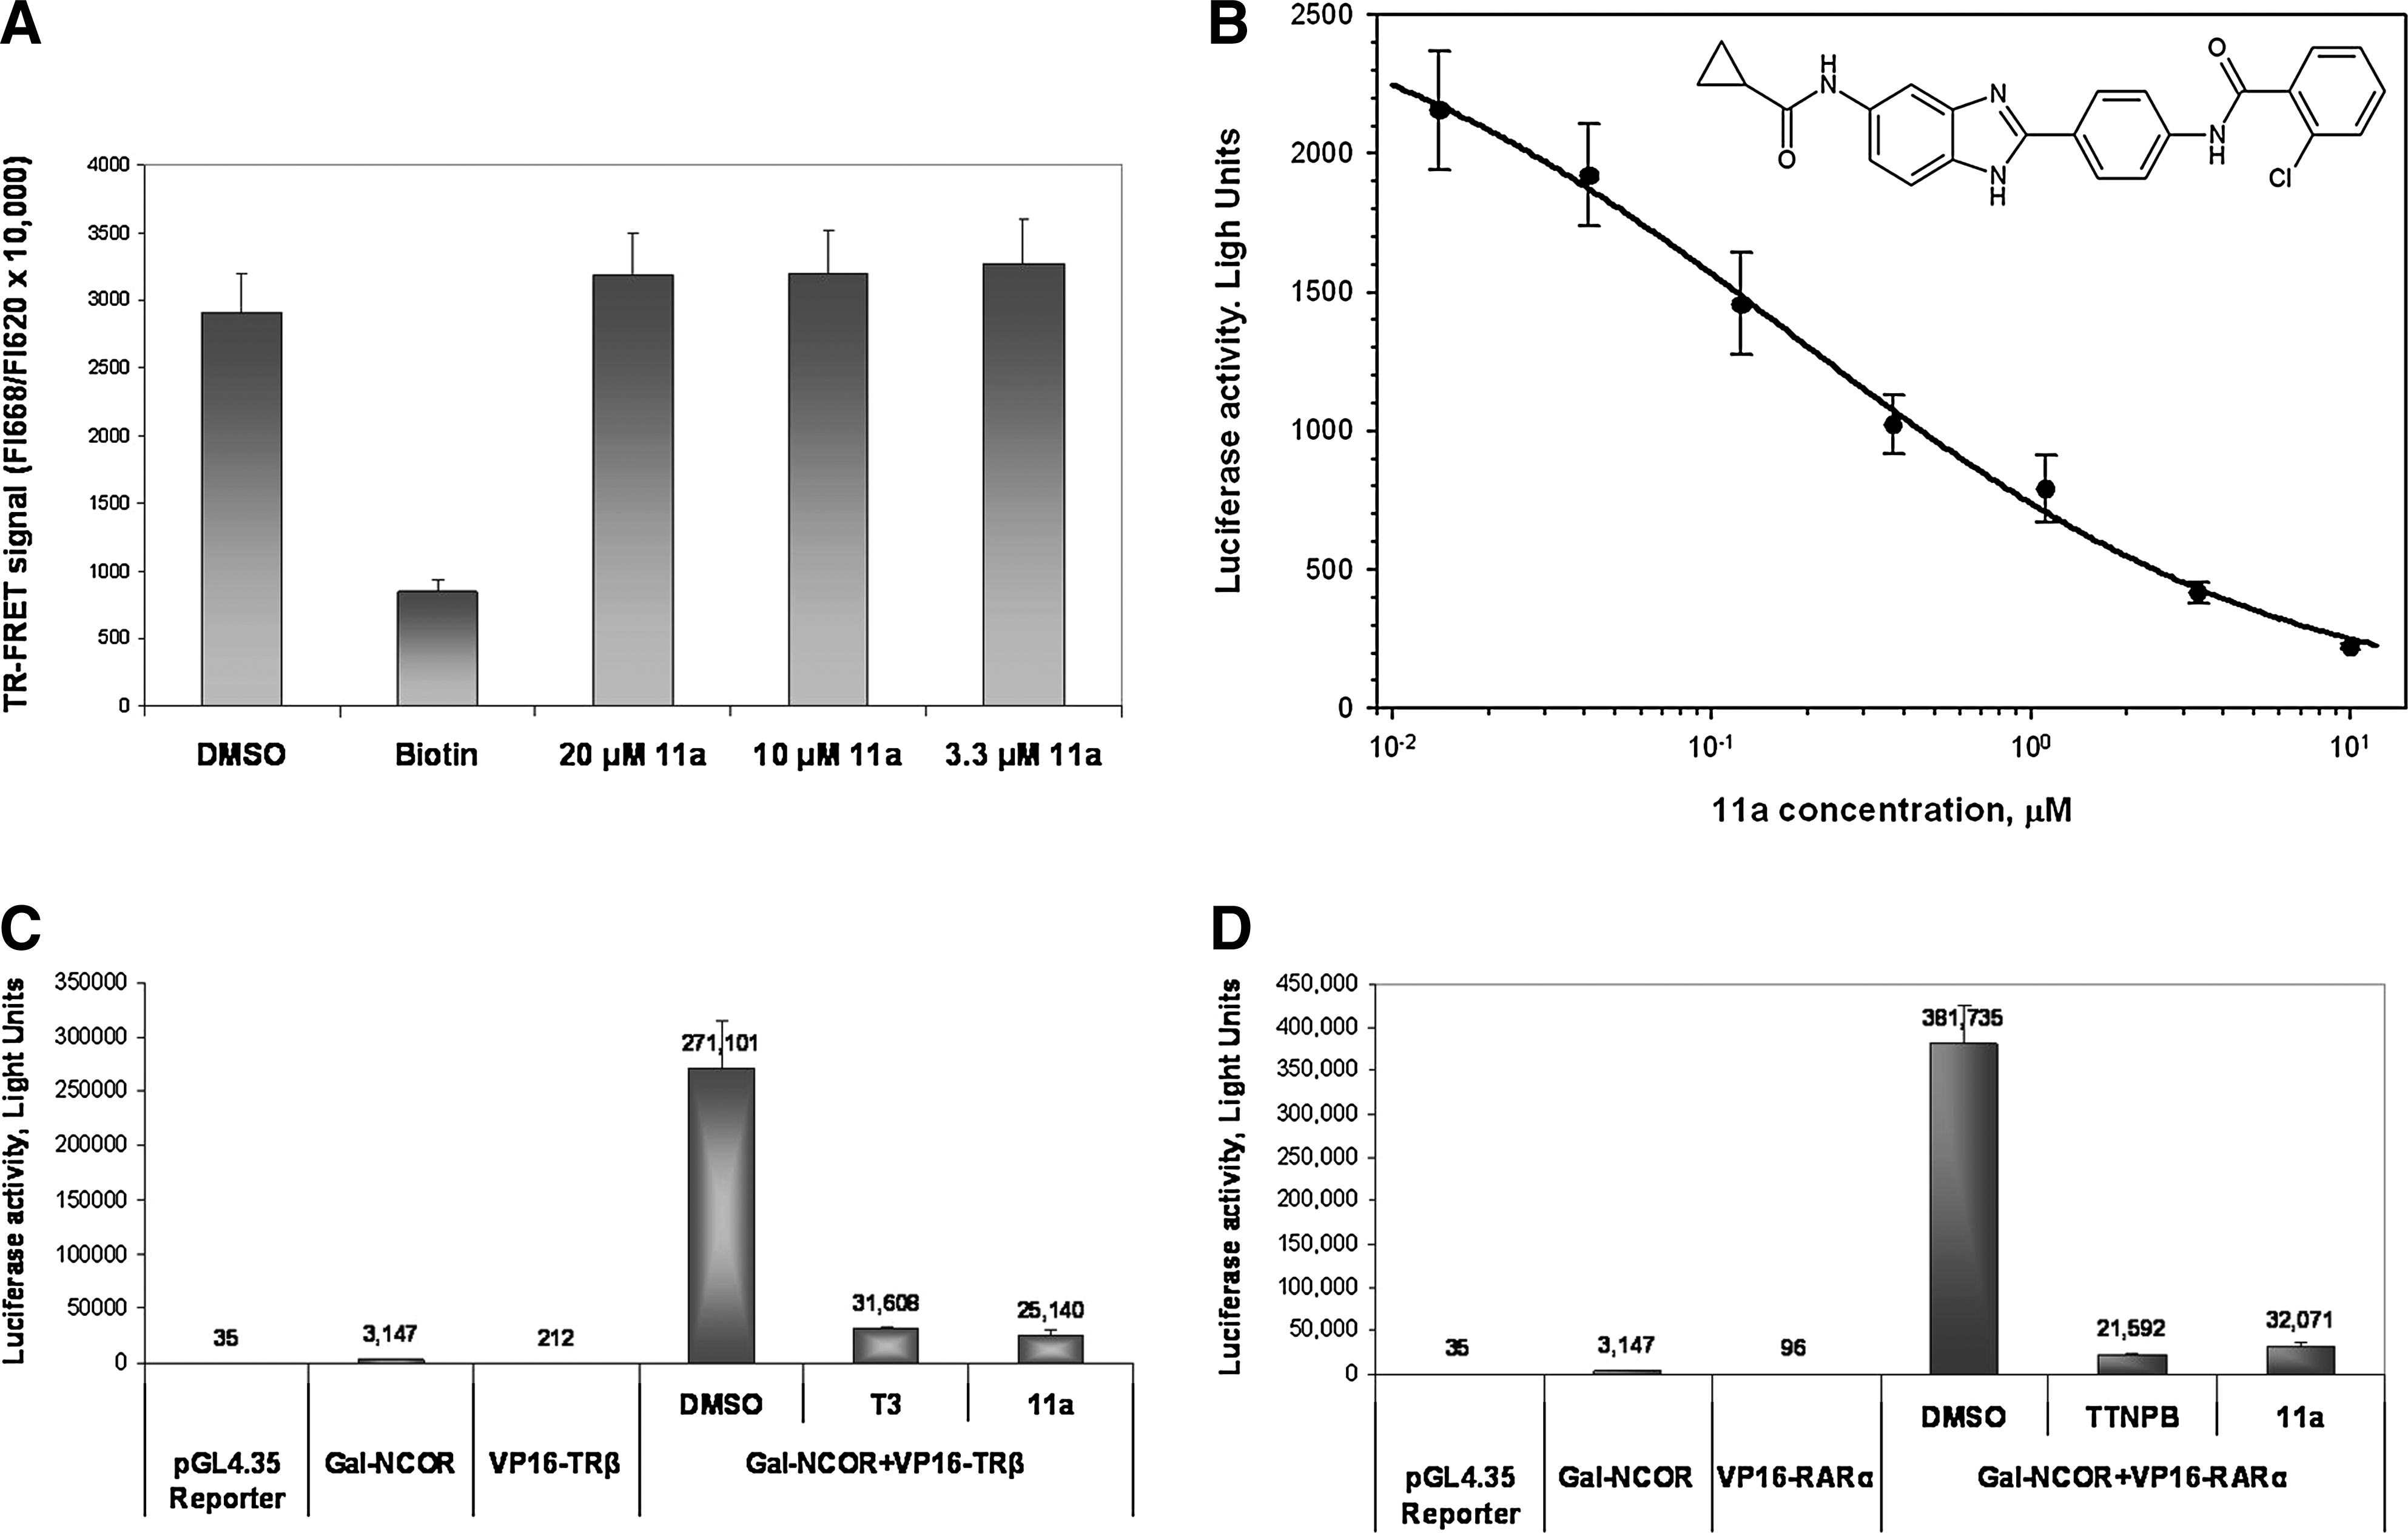
Effect of Compound 11a on interaction of nuclear receptors with transcriptional corepressors.
Miniaturization of the NR2E3–RetCOR interaction assay to the 1,536-well format
To identify small-molecule modulators of the NR2E3–RetCOR interaction by screening a large compound library (>300,000 compounds), the assay was miniaturized to the 1,536-well plate format. All critical variables of the assay, such as interacting partners and detection reagent concentrations, incubation time, and temperature, were carefully optimized to provide the best balance between assay performance, cost per well, and protocol suitability to the robotized platform. Optimization for concentration of interacting partners, NR2E3 and RetCOR, revealed concentration optima similar to the ones defined for the 384-well plate format (as illustrated in Fig. 6A for NR2E3), allowing final concentrations identical to the 384-well conditions. To reduce reagent addition steps during the screen, detection reagents were combined to the binding partners as antagonistic pairs. In addition to simplifying the protocol to a 3-step addition only, this enabled to dramatically shorten the incubation time from 16 to 5 h. Upon completion of the optimization phase, assay volumes were reduced by 63%. Under these conditions, the calculated Z′-value was >0.5, while biotin yielded the IC50 value of 21.9±2.4 nM (Fig. 6B). Finally, a DMSO tolerance assessment indicated that the assay was insensitive to DMSO up to 1.6% (Fig. 6C), a concentration 4-fold higher than the one aimed for the screening campaign. A LOPAC collection of 1,280 pharmacologically active compounds was used to validate the TR-FRET NR2E3-RetCOR assay before submitting it to the robotic platform. All compounds were tested in triplicates at 3.9 μM, mimicking compound concentrations during the HTS. In addition, a PPARγ-NCOR2 counterscreen was also evaluated in a 1,536-well format using the LOPAC collection. As expected, the LOPAC screen revealed that most of the compounds were inactive with no verifiable hits in the NR2E3 assay and very few hits in the PPARγ assays. The assay displayed excellent correlation, Z′- and S/B values (data not shown).
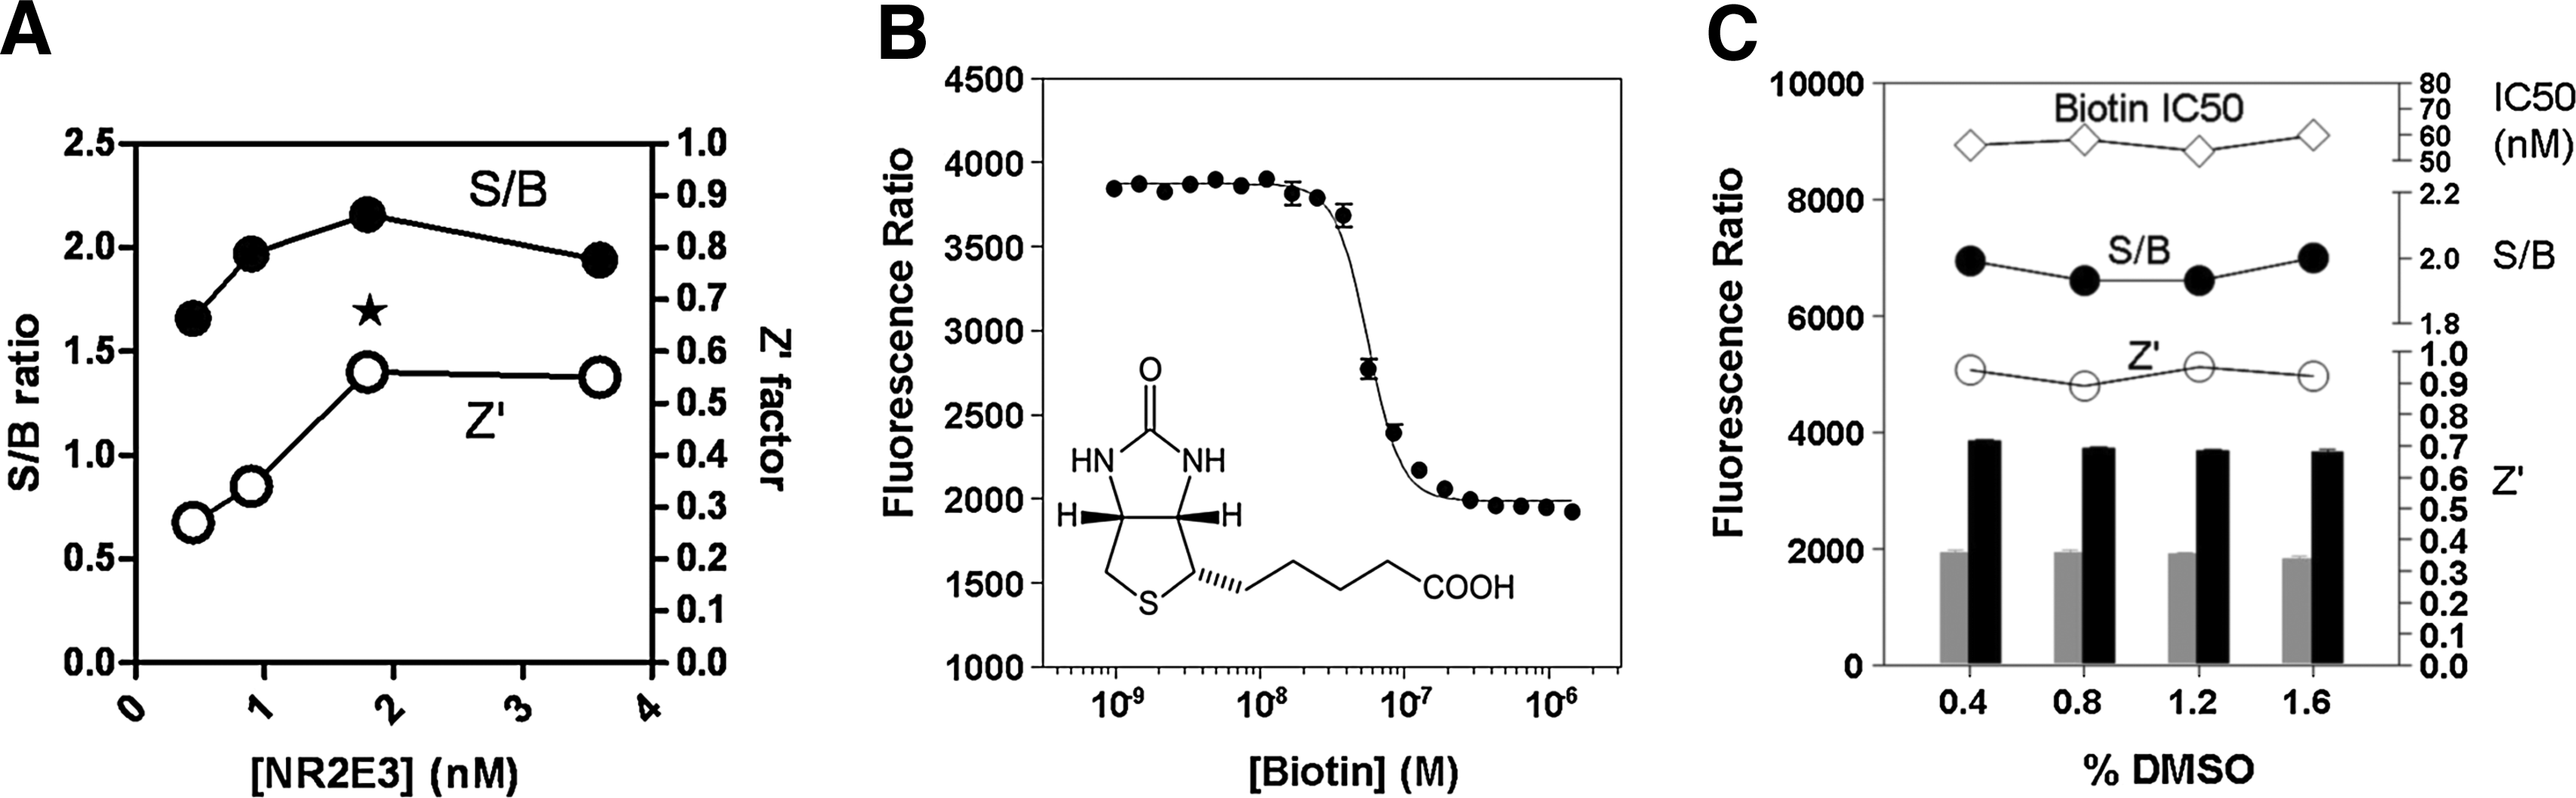
Outcomes of the primary assay optimization for the 1,536-well format.
Primary HTS campaign and characterization of HTS hits
A collection of 315,101 compounds from the NIH's MLSMR was interrogated in the miniaturized NR2E3 cell-based assay. The screen was executed at a final concentration of 3.98 μM on the robotic platform of the Scripps Research Institute Molecular Screening Center at a throughput of ∼15,000 compounds per hour. Assay performances were calculated on a per-plate basis based on the aforementioned high- and low-control wells. As illustrated in Fig. 7, the mean Z′ of the 257 compound plates tested was 0.89±0.01, indicative of an exceptionally robust primary screen. The S/B ratio was 2.45±0.12 (Fig. 7), which in good agreement with the S/B value obtained during the pilot screen of LOPAC collection. As anticipated, the vast majority of compounds were found inactive (Fig. 8) with a normal Gaussian distribution of activities with the activity mean close to 0% inhibition (0.62%±6.31%). The HTS hit cutoff value was defined at 19.55% inhibition, as it represented the sum of the mean% inhibition of all test compounds plus 3 times their standard deviation. As a result, 379 compounds showing a %inhibition greater than the calculated hit cutoff were designated as primary hits (0.12% hit rate). Of this number, 363 compounds were available for reanalysis in triplicates in the confirmatory NR2E3-RetCOR and counterscreen PPARγ-NCOR2 assays. About 39% of the compounds (140) showing percent inhibition greater than the primary hit cutoff were confirmed in the NR2E3 assay. A total of 164 compounds were also found active in the PPARγ-NCOR2 counterscreen (45%), with most of the confirmed NR2E3 hits showing similar activities in both assays (Fig. 9). All confirmed compounds that were available (129), even the compounds that showed activity in the PPARγ counterscreen assay, were reanalyzed by titrations in both the NR2E3-RetCOR and PPARγ-NCOR2 assays using 10-point serial dilutions starting at 39.8 μM. Results of this titration phase indicated that no compound was selective for NR2E3.
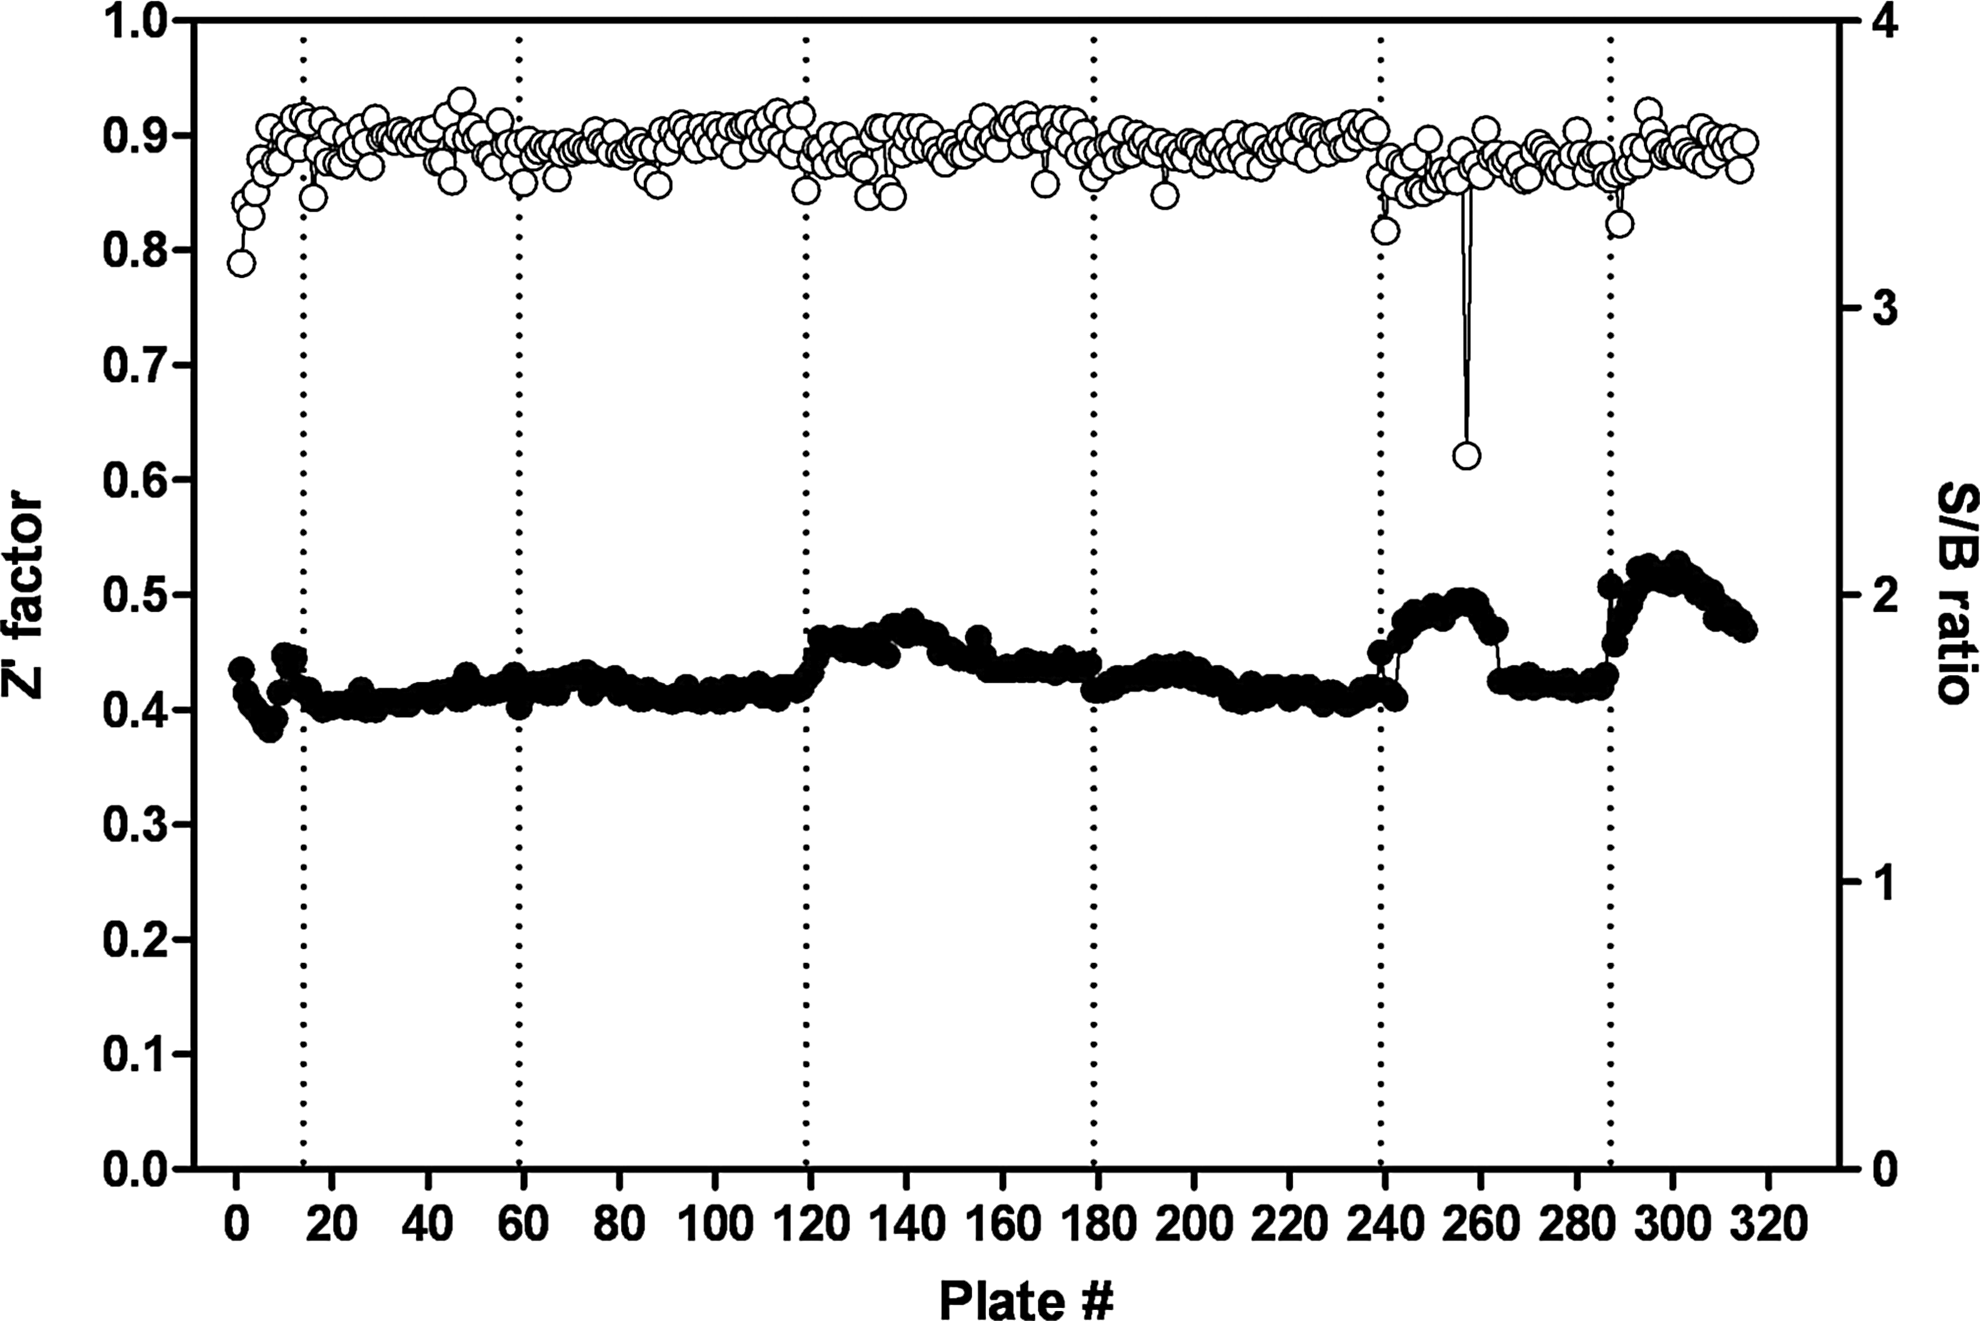
High-throughput screen (HTS) campaign statistics. The graph shows scatter plots of the calculated Z′-scores (○) and signal-to-background (S/B, •) values of the NR2E3 primary screen. Three hundred fifteen plates were run in 7 different batches, comprising a total of 257 compound plates. The average Z′-factor and S/B ratio for the entire primary screening campaign were 0.89±0.01 and 2.45±0.12, respectively.
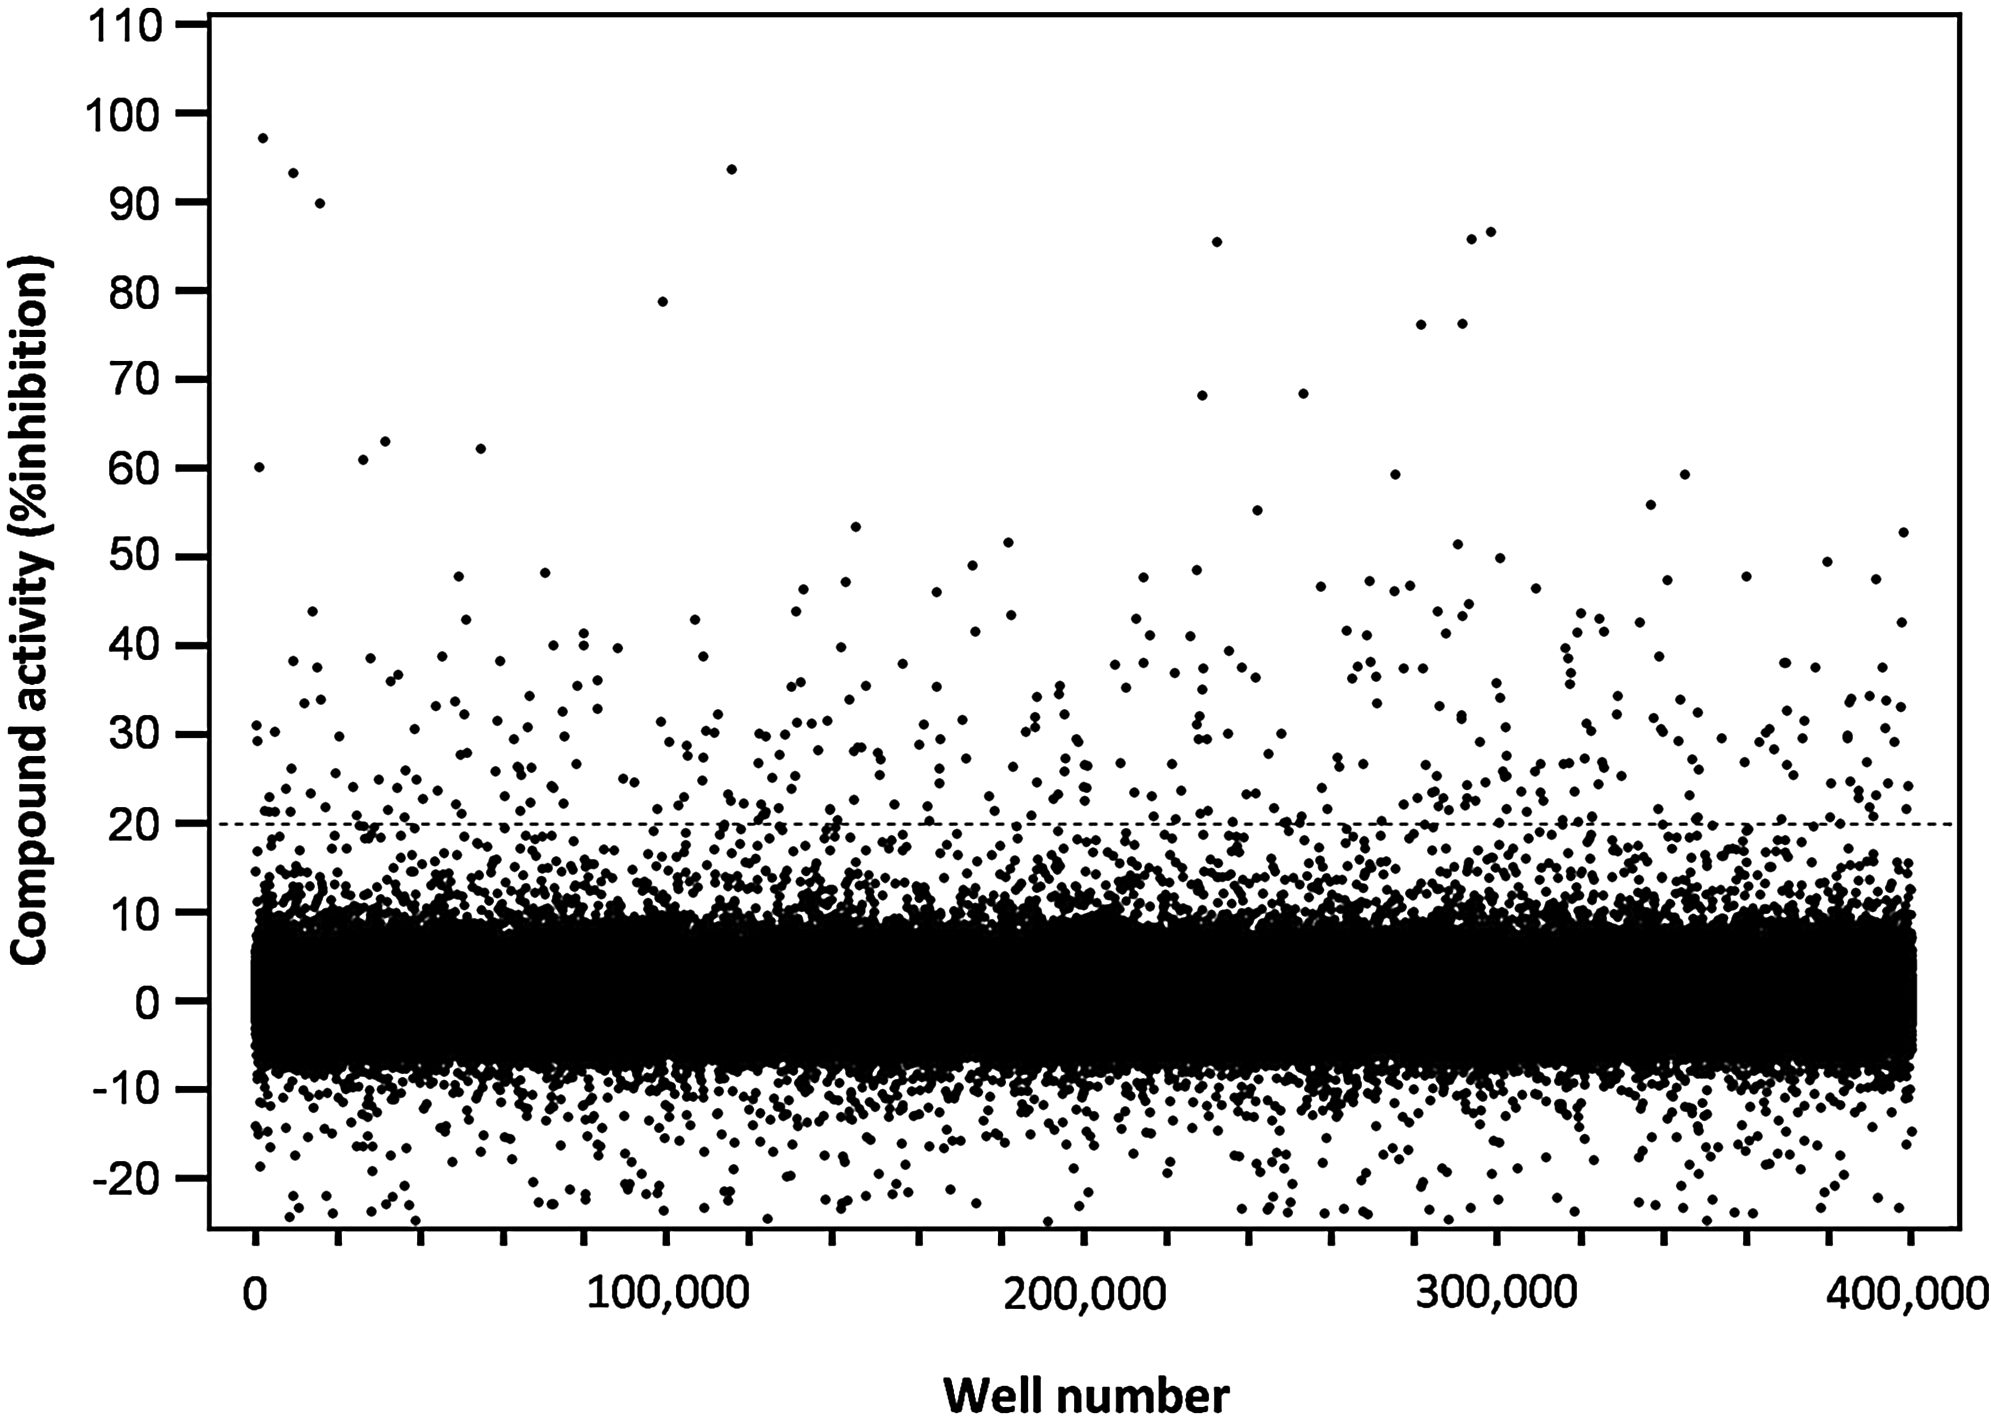
Scatter plot of the normalized percent inhibition for the 315,105 compounds tested in the primary HTS assay. Compounds were tested at 3.98 μM. The dashed line represents the hit cutoff calculated at 19.55% as described in the text. The 379 compounds (0.12% of the total) located above this line were designated as primary HTS hits.
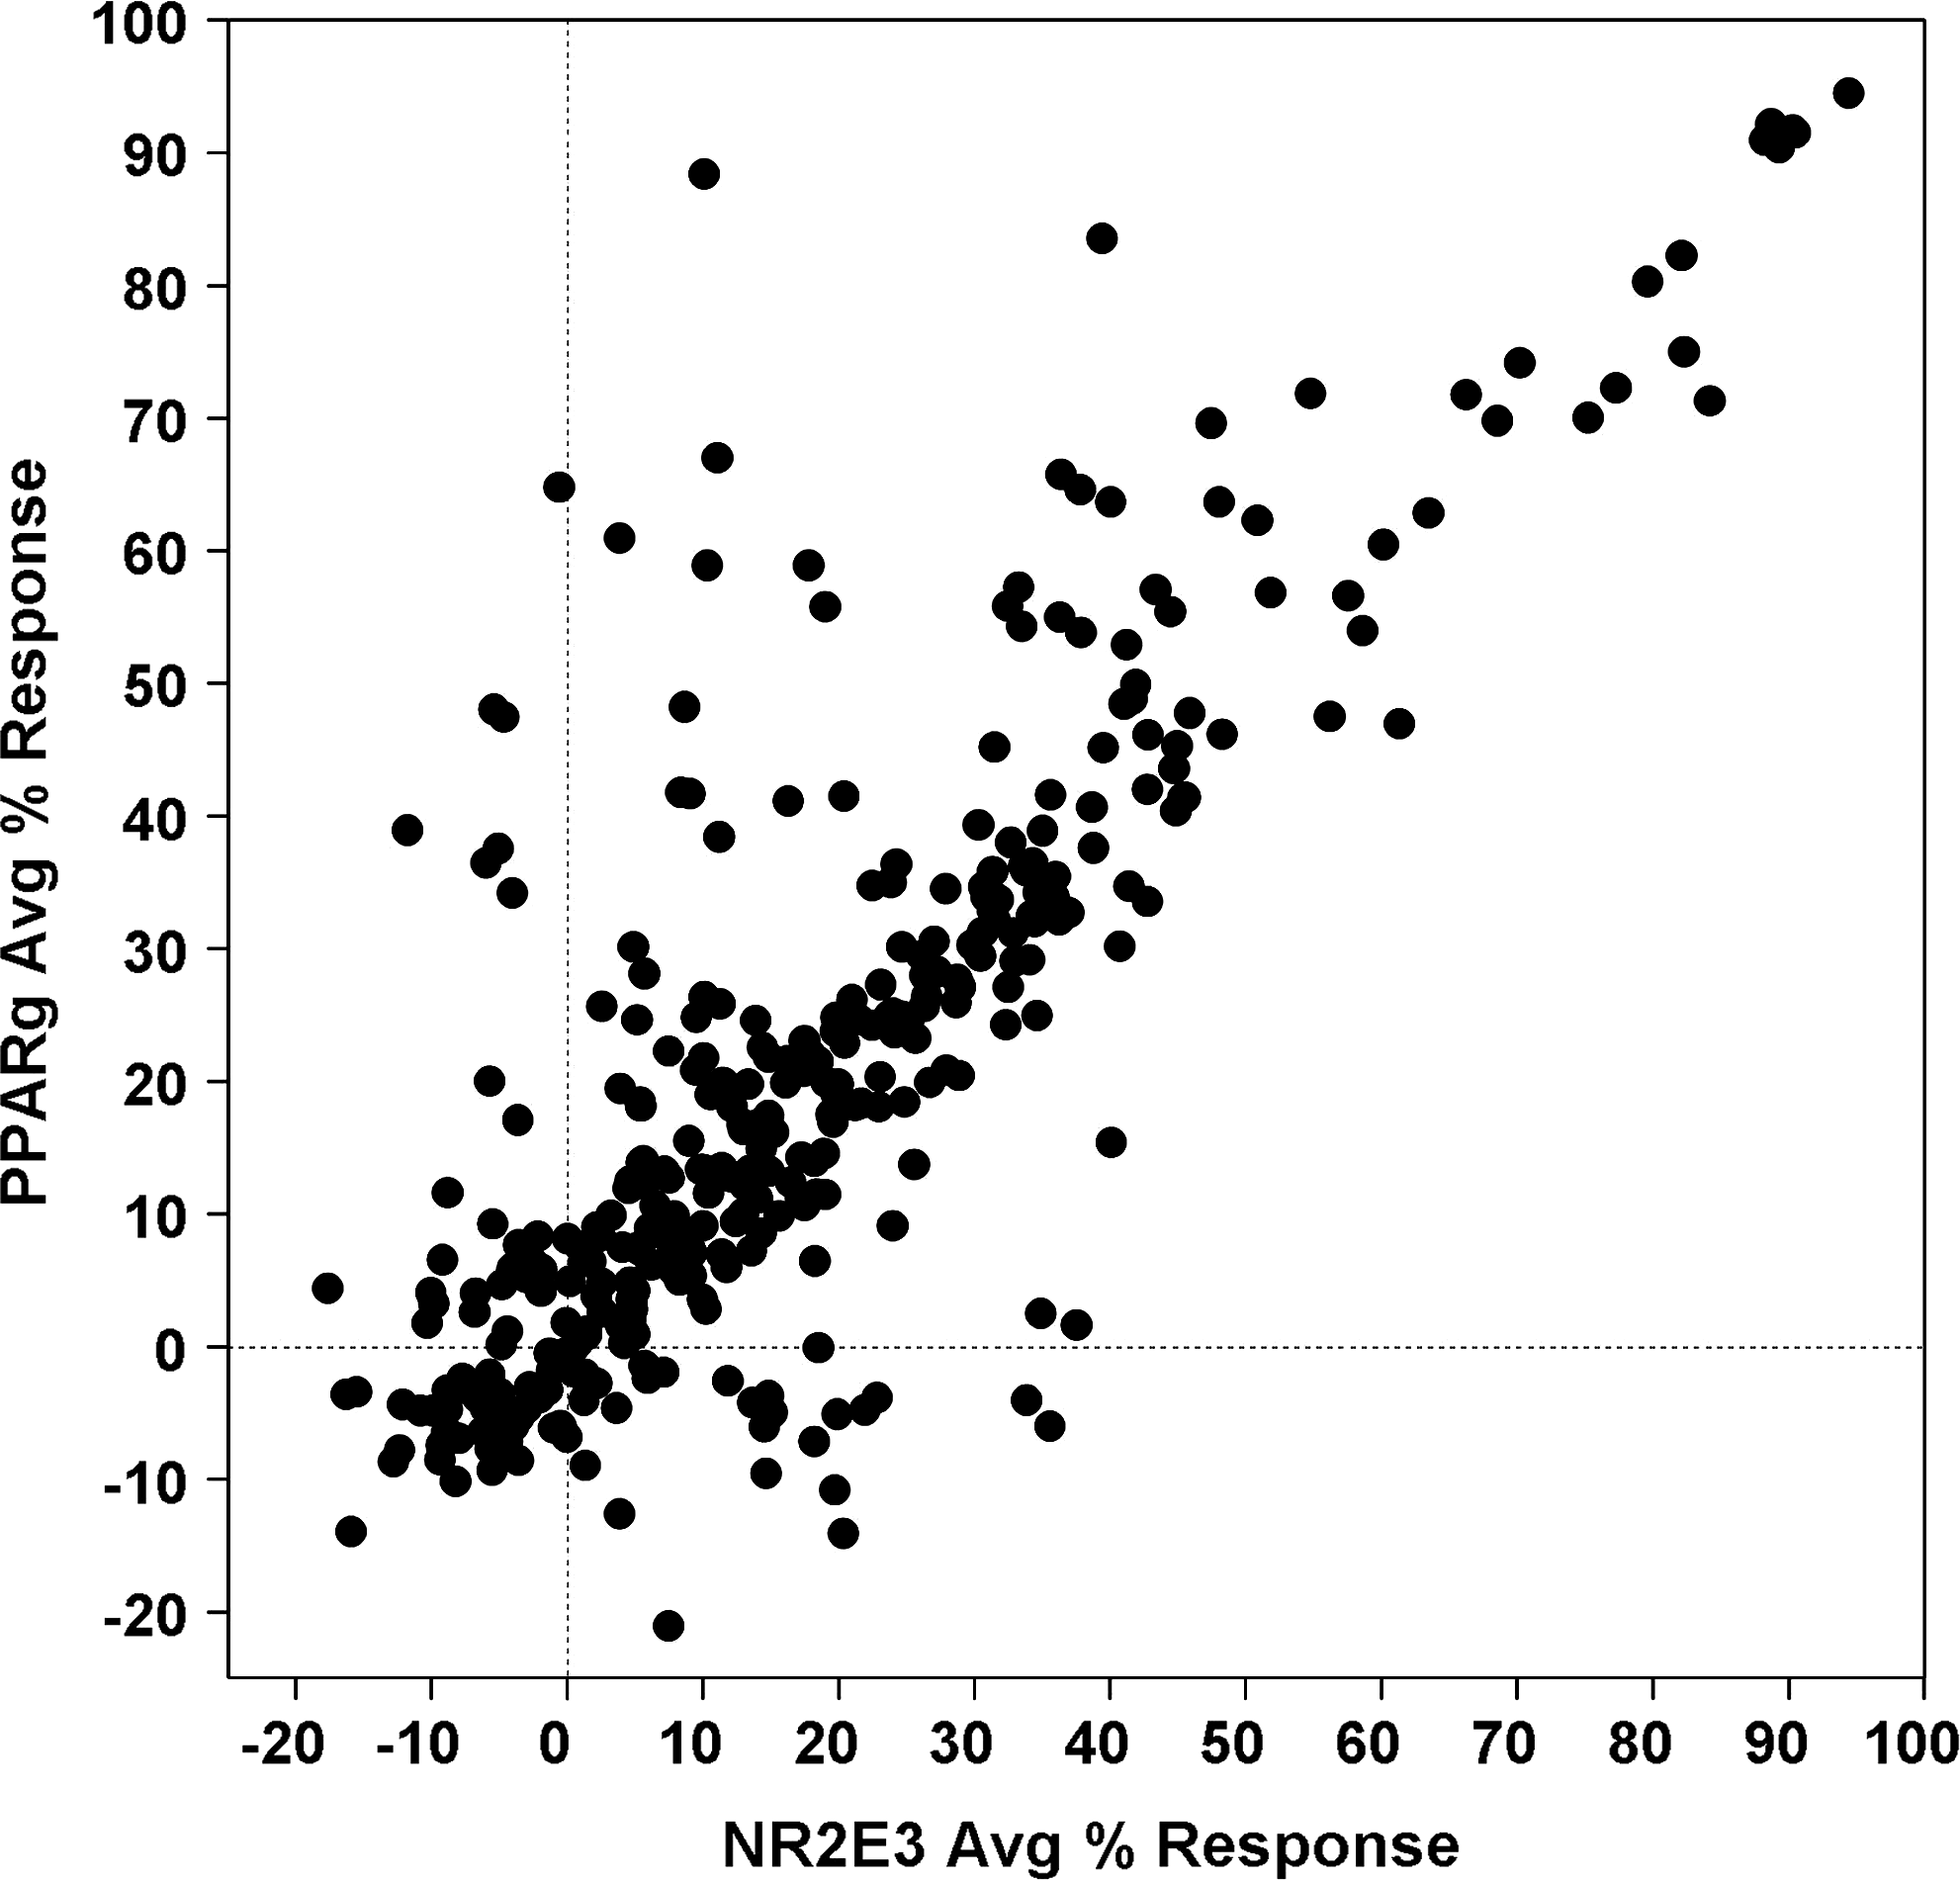
Results of confirmatory and counterscreens for primary HTS hits. The graph shows scatter plot of the averaged normalized percent inhibition (n=3) for the 363 compounds tested in parallel in the NR2E3 assay for confirmation and in the PPARγ counterscreen. Compounds were tested at 3.98 μM.
Inverse agonist screen
The results of the primary assay were subjected to additional evaluation with the purpose of finding of potential NR2E3 inverse agonists. Inverse agonists would strengthen the interaction between an NR and a corepressor, which in the context of the NR2E3-RetCOR primary assay would lead to increase in the TR-FRET signal. After reanalysis of data, 114 compounds that increased the TR-FRET signal in a primary assay were ordered for confirmation and counterscreen assays. Out of 114 compounds tested in the NR2E3 confirmation assay, 83 displayed activity in the primary assay, while 76 compounds displayed activity in the PPARγ counterscreen. After conducting dose–response experiments in the primary and counterscreens, no NR2E3-selective compounds with inverse agonist properties have been identified.
Discussion
Many classic NRs repress basal transcription of target genes in the absence of ligands through association with transcriptional corepressors such as SMRT and NCOR.24,25 Binding of an endogenous or synthetic agonist induces conformational changes in the LBD, resulting in the release of a corepressor complex and recruitment of transcriptional coactivators. Historically, screening assays for small-molecule modulators of nuclear hormone receptors are often based on ligand-sensitive interaction with transcriptional coactivators and corepressors.31–33 It has been shown that apo-NR2E3 is capable of interacting with corepressors N-CoR, SMRT, and RetCOR.22,26 Given that NR–corepressor interaction is agonist sensitive for the vast majority of NRs, we developed a cell-free HTS-compatible TR-FRET assay for small-molecule NR2E3 modulators, which is based on agonist-induced disruption of the interaction between GST-tagged apo-NR2E3 and MBP-tagged fragment of transcriptional corepressor RetCOR (Fig. 1). One of the major hurdles in assay development was purification of the functionally active NR2E3 protein. In the absence of a ligand that could be used for assessing NR2E3 functionality, we decided to use the ability of the protein to form functional heterodimers in the EMSA assay as an analytical tool for characterization of NR2E3 functionality in a process of selecting an adequate expression system and a purification protocol. As in vitro expressed NR2E3 contains low proportion of EMSA-active protein (Fig. 2A) and seems to form high-molecular-weight aggregates (Fig. 3A), we reasoned that post-translational modifications may be important in formation of the fully functional NR2E3 and selected eukaryotic baculoviral system for GST-NR2E3 expression. Even though production of functionally active NR2E3 could be achieved in the Sf9 cells (Fig. 2B), aggregation of the protein during purification was identified as a major issue. Using a protein aggregation assay, we were able to define conditions that allowed us purification of nonaggregated, though diluted, NR2E3, which was functionally active in the EMSA assay. Using this NR2E3 preparation along with the bacterial-expressed fragment of corepressor RetCOR, we established the TR-FRET-based NR2E3–RetCOR interaction assay and decided to reanalyze Compound 11a, which was previously reported to exhibit the properties of the NR2E3 agonist. 23 We failed to detect any effect of Compound 11a on NR2E3–RetCOR interaction (Fig. 5A), which indicates that 11a does not act as a direct NR2E3 agonist in this assay. In line with previously reported data, 23 we were able to reproduce the dose-dependent inhibitory activity of 11a on NR2E3–NCOR interaction in the mammalian 2-hybrid system (Fig. 5B). However, this effect was nonspecific, as 11a similarly inhibited constitutive NCOR interaction with other NRs (such as RARα and TRβ) in control mammalian 2-hybrid experiments (Fig. 5C, D). As a result of 11a characterization, it seems reasonable to conclude that the structural series exemplified by 11a does not comprise compounds representing direct NR2E3 agonists that underscored the importance of conducting a new HTS for NR2E3 ligands. After successful miniaturization of the primary assay to the 1,536-well format, the HTS was performed using a library containing 315,001 compounds. Despite excellent assay performance (Figs. 7 and 8), no NR2E3-specific compounds were identified among 379 primary HTS hits. Most of the primary hits represented biotin-like structure, preventing interaction of the detection reagent Streptavidin-d2 with biotinylated RetCOR. Given the lack of confirmed agonistic compounds, were analyzed the HTS dataset for the presence of other types of small-molecule NR2ER3 modulators. While NR agonists stabilize a coactivator-binding conformation inducing the release of transcriptional corepressors from the ligand-binding domain, an inverse agonist would stabilize a corepressor-binding conformation. We reasoned that if NR2E3-inverse agonists were present in the compound collection, they would increase the NR2E3–RetCOR interaction, which could be registered as an increase in the TR-FRET signal. Upon reanalyzing the data from the agonist screen, 114 compounds were found to increase the TR-FRET signal. Unfortunately, after their careful dose-dependent characterization in primary and counterscreen assays, no NR2E3 selectivity for the compounds could be established (data not shown). The results of the conducted HTS may have several plausible explanations. Hypothetically, in the case of structural similarity between NR2E3 and PPARγ agonists, positive HTS hits could have been erroneously rejected for the lack of specificity after the counterscreen analysis in the PPARγ–NCOR interaction assay. We retested a small subset of the HTS hits showing activity in primary and counterscreen assays using the unrelated TR-FRET assay and confirmed the promiscuity for the tested compounds. Given significant functional and structural differences between NR2E3 and PPARγ (e.g., ability to heterodimerize with RXR, recognition of different response elements, and dissimilar amino acid sequences), the overlap in structure of agonistic ligands between the 2 receptors seems unlikely. Alternative explanation for the negative results of the HTS screen may be a nature of the compound collection. Even though the NIH compound library has been successfully used in the past for identification of small-molecule ligands for NRs, 34 its diversity may not be deep enough to include structures resembling endogenous NR2E3 ligands present in the photoreceptor cells of the retina. If this is the case, the use of the TR-FRET assay described in this study in another, more diverse and abundant compound collection may yield the desired NR2E3 agonists.
Footnotes
Acknowledgments
The authors thank Pierre Baillargeon and Lina DeLuca (Lead Identification Division, Scripps Florida) for compound management. This research was supported by the NIH Grants 1R21NS061718-01 (K.P.), P30 EY019007 (Core Support for Vision Research; Columbia University Medical Center), U54 MH084512 (A.K., F.M., P.C., P.H.), and unrestricted funds from Research to Prevent Blindness (New York, NY) to the Department of Ophthalmology, Columbia University. This research was also supported by gifts from The Burch Family Foundation, the Mary Jaharis-John Catsimatidis Scholarship Fund, the Eye Surgery Fund, and the Kaplen Foundation.
Author Disclosure Statement
No competing financial interests exist.