
Abstract
Abstract
Purpose:
Anti-inflammatory activity of topical nonsteroidal anti-inflammatory drugs is mediated by suppression of cyclooxygenase (COX) isoenzymes. This study compared ocular penetration and inflammation suppression of topical ketorolac 0.45% and bromfenac 0.09% ophthalmic solutions in a rabbit model.
Methods:
At hour 0, 36 rabbits received ketorolac 0.45%, bromfenac 0.09%, or an artificial tear 3 times once every 20 min. Half of the rabbits in each group then received intravenous injections of lipopolysaccharide (LPS) and fluorescein isothiocyanate (FITC)–dextran at hour 1, and the other half at hour 10. Aqueous and iris-ciliary body (ICB) samples were collected in the former group at hour 2 (peak) and in the latter group at hour 11 (trough) An additional group of 6 animals received only FITC-dextran, and samples were collected 1 h later. Peak and trough nonsteroidal anti-inflammatory drug concentrations were compared with previously determined half-maximal inhibitory concentrations (IC50) for COX isoenzymes.
Results:
Peak and trough aqueous and ICB concentrations of ketorolac were at least 7-fold or greater than those of bromfenac. At peak levels, both ketorolac 0.45% and bromfenac 0.09% significantly inhibited LPS-induced aqueous prostaglandin E2 and FITC-dextran elevation (P < 0.01). At trough, both study drugs significantly inhibited LPS-induced aqueous prostaglandin E2 elevation (P < 0.05), but only ketorolac 0.45% significantly reduced LPS-induced aqueous FITC-dextran elevation (P < 0.01). Aqueous and ICB ketorolac concentrations exceeded its IC50 for COX-1 and COX-2 at peak and trough. Aqueous and ICB bromfenac levels exceeded its IC50 for COX-2 at peak and trough, but not for COX-1 at trough aqueous levels and peak and trough ICB levels.
Conclusions:
Both ketorolac 0.45% and bromfenac 0.09% effectively suppressed inflammation at peak. At trough, only ketorolac 0.45% effectively suppressed inflammation as measured by FITC-dextran leakage. The difference in inflammation suppression may be due to differences in tissue concentrations and/or greater COX-1 suppression by ketorolac 0.45%.
Introduction
Ketorolac, an extensively studied NSAID, has been shown to inhibit both COX-1 and COX-2 isoenzymes.6–8 In contrast, bromfenac has been shown to have greater selectivity for the COX-2 enzyme relative to COX-1. 8 Previously, ketorolac 0.4% (Acular LS®; Allergan, Inc., Irvine, CA) and bromfenac 0.09% (Xibrom®; ISTA Pharmaceuticals, Irvine, CA) were evaluated in an animal model of ocular inflammation. 8 In this model, it was shown that both ketorolac 0.4% and bromfenac 0.09% similarly inhibited lipopolysaccharide (LPS)-induced inflammatory response 1 h after last drop instillation. 8 While similar prostaglandin E2 (PGE2) levels were demonstrated at peak NSAID concentrations, a human study evaluating anti-inflammatory activity of NSAIDs at trough levels based upon on-label dosing of 4-times daily (QID) ketorolac 0.4% and twice-daily bromfenac 0.09% demonstrated statistically significant lower PGE2 levels 6 h postinstillation of ketorolac 0.40% compared with 12 h postinstillation of bromfenac in aqueous samples, which were obtained before cataract extraction.9,10
Recently, a new formulation of ketorolac ophthalmic ketorolac 0.45% solution (Acuvail®; Allergan, Inc.) was approved for twice-daily administration for pain and inflammation after cataract surgery. 11 Changes from the prior ketorolac 0.4% formulation, which was approved for the treatment of pain after refractive surgery, include reducing the pH from 7.4 to 6.8, removing the preservative (BAK) and surfactant (octoxynal 40), and adding carboxymethylcellulose to improve ocular tolerability. 12
As dosing regimens evolve, it is critical to assess if efficacy of a medication is sustained throughout the dosing cycle at both peak as well as at trough levels. The current study was designed to compare ocular penetration and inflammation suppression of ketorolac 0.45% and bromfenac 0.09% in an animal model of LPS-induced inflammation at peak and trough drug levels based upon twice-daily (12 h apart) dosing schedules.
Methods
Animals
Female New Zealand White rabbits (Western Oregon Rabbit Company; Philomath, OR) were utilized in the study. Animals were housed in an environmentally controlled facility with a 12-h light/12-h dark cycle at room temperature of 16°C to 22°C. The experimental animals were >3 months of age and weighed 2.0 to 4.0 kg without any visible ocular or systemic abnormalities. All animal care and experimental procedures were approved by the Institutional Animal Care and Use Committee of the Ames Research Center and conformed to the Association for Research in Vision and Ophthalmology statement for the Use of Animals in Ophthalmic and Vision Research.
Study design
The timing of study drug administration and procedures are summarized in Fig. 1. At hour 0, 36 rabbits were randomly assigned in 1:1:1 ratio to receive 1 drop (35 μL) of study medications, ketorolac 0.45%, bromfenac 0.09%, or artificial tear control (carboxymethylcellulose 0.5% solution, Refresh® Tears; Allergan, Inc.) once every 20 min for a total of 3 times. The administration of 3 drops before the LPS stimulus was intended to simulate a common dosing regimen, which occurs in the hour before cataract surgery. After instillation of study medications, rabbits were subdivided into the peak (n = 6) and trough (n = 6) groups based on the timing of sampling. The peak and trough groups were separated based on the peak and trough drug levels in a 12-h, twice-daily dosing regimen.
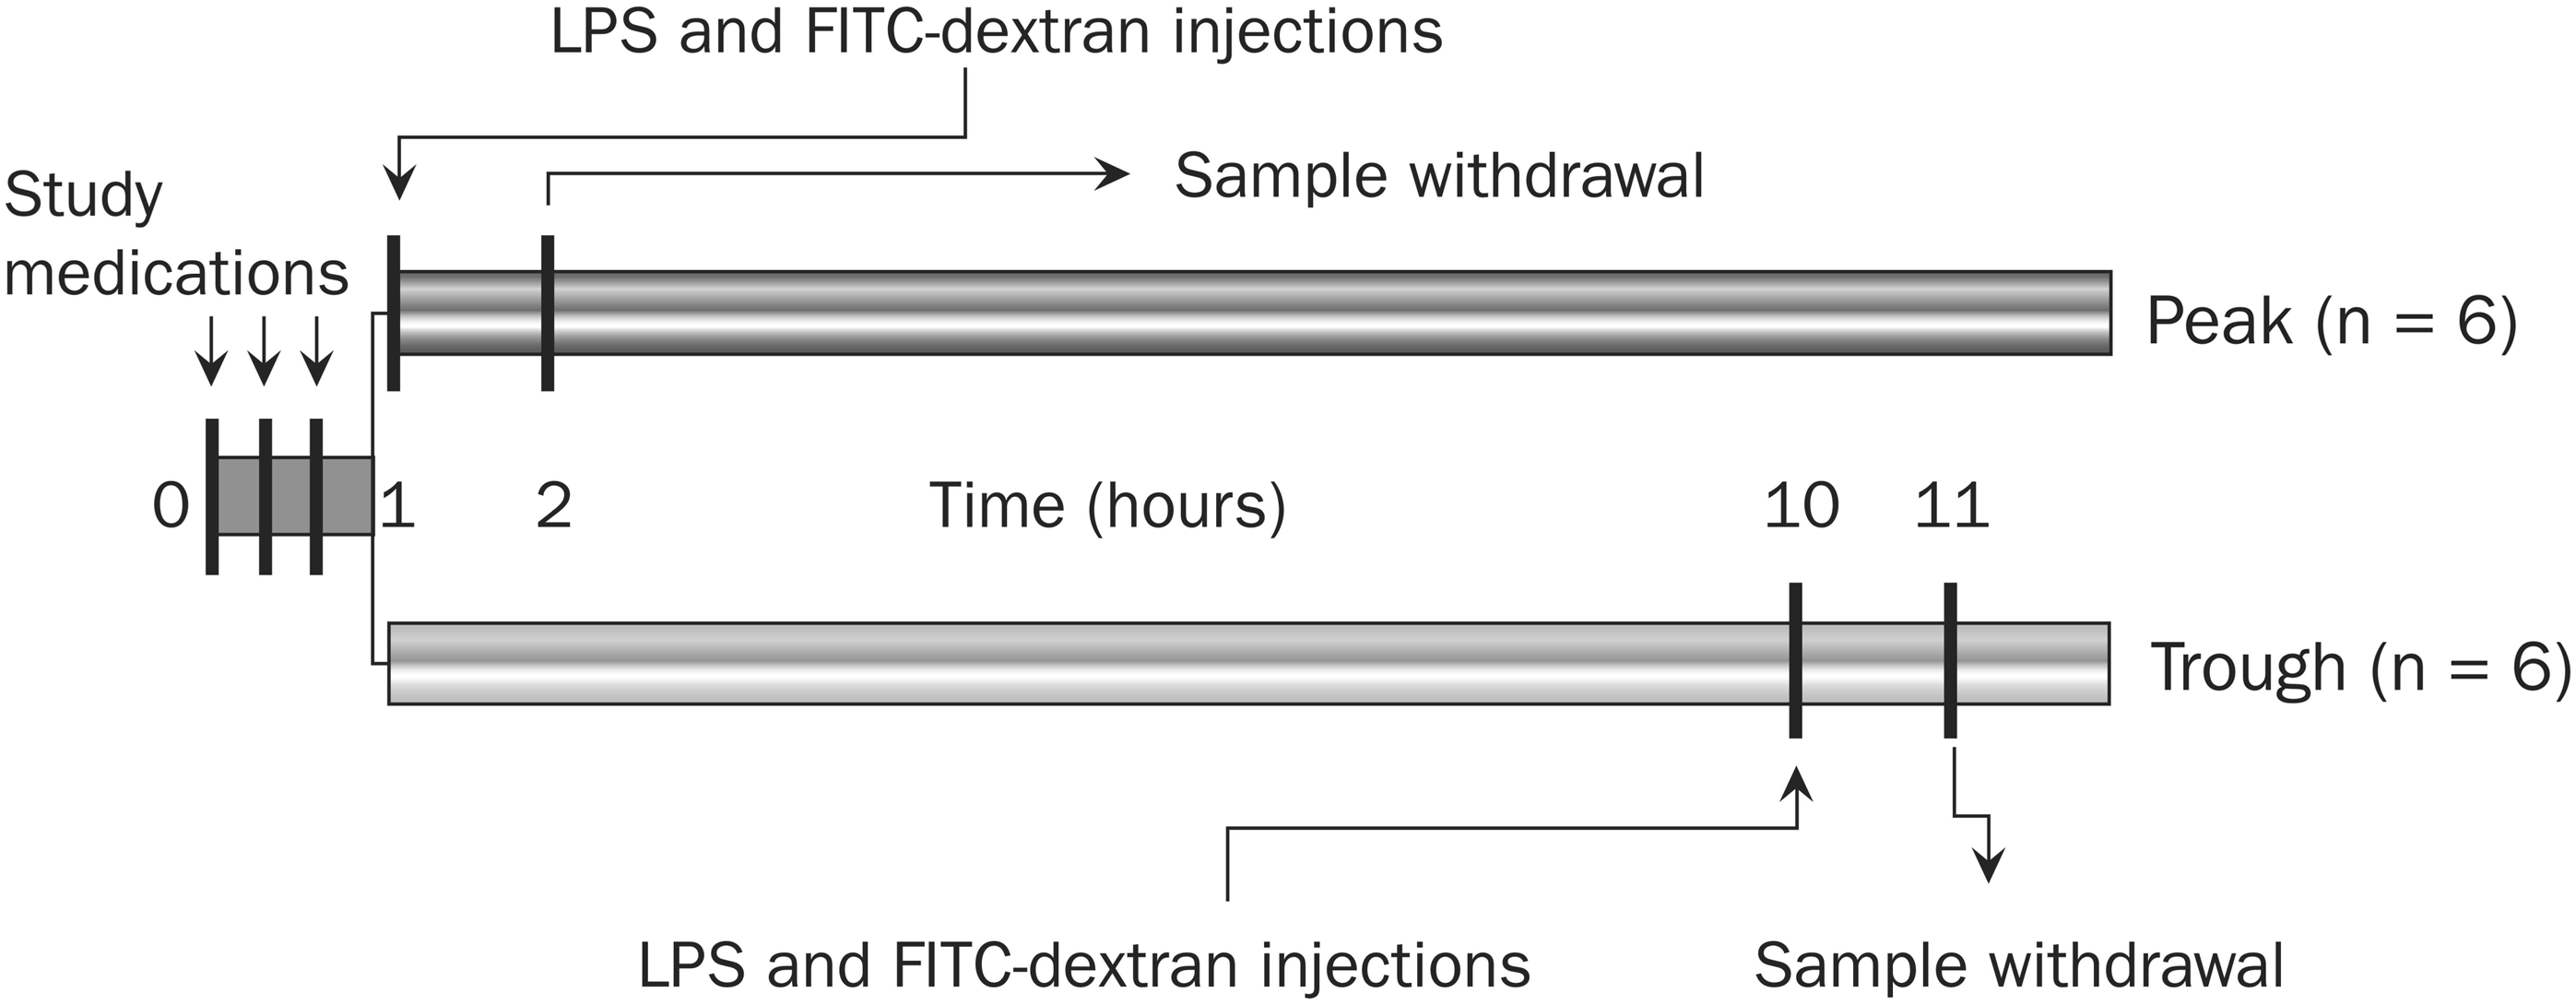
Timing of study medication administration and procedures. At hour 0, 36 rabbits were randomly assigned in a 1:1:1 ratio to receive 1 drop (35 μL) of ketorolac 0.45%, bromfenac 0.09%, or carboxymethylcellulose 0.5% solution (artificial tear) once every 20 min for a total of 3 times. Rabbits were then subdivided into a peak (n = 6) group, which received intravenous coinjection of LPS (10 μg/kg) and FITC-dextran (30 mg/kg) at hour 1 and trough (n = 6) group, which received coinjection of LPS (10 μg/kg) and FITC-dextran (30 mg/kg) at hour 10. Aqueous and iris-ciliary body samples were collected from the peak group at hour 2 and from the trough group at hour 11. An additional group of 6 animals received only FITC-dextran followed 1 h later by sample collection from aqueous and iris-ciliary body (not shown). FITC, fluorescein isothiocyanate; LPS, lipopolysaccharide; NSAIDs, nonsteroidal anti-inflammatory drugs.
Animals in the peak group received intravenous injections of LPS (10 μg/kg) and fluorescein isothiocyanate–dextran (FITC-dextran; MW ∼70,000, 30 mg/kg) at hour 1, and aqueous and iris-ciliary body (ICB) samples were collected for analysis at hour 2 (Fig. 1). In contrast, animals in the trough group received intravenous injections of LPS (10 μg/kg) and FITC-dextran (30 mg/kg) at hour 10, and aqueous humor and ICB samples were collected for analysis at hour 11.13,14 An additional group of 6 animals received only FITC-dextran, and aqueous and ICB samples were collected 1 h later for analysis.
Animals were euthanized with an intravenous injection of 0.22 mL/kg of Beuthanasia® (Intervet/Schering-Plough animal Health) into a marginal ear vein. Immediately after euthanasia, ∼300 μL of aqueous humor was removed from the anterior chamber of each eye with a 27-gauge needle on a 1-mL syringe and placed in a 2-mL cryovial. Samples were immediately placed on dry ice. Subsequently, a small incision was made in the superior corneascleral limbus. Through this incision the iris and attached ciliary body were removed with tissue forceps, freed of any adherent tissues, rinsed in phosphate buffered saline, blotted with filter paper, and immediately frozen in a preweighed 2.0 mL cryovial. The entire procedure was completed in less than a minute. Samples were stored at or below −40°C until analysis.
Quantification of ketorolac and bromfenac levels
Aqueous and ICB concentrations of ketorolac and bromfenac were quantified by a HPLC-mass spectroscopy system (API 3000; Applied Biosystems; Foster City, CA). Reverse-phase HPLC was performed using an Agilent ZORBAX Eclipse SB-C18 column (5 μm, 2.1 × 50 mm; Agilent Technologies, Inc., Santa Clara, CA) with water/methanol containing formic acid (0.1%) as gradient solvent at a flow rate of 0.25 mL/min. In preparation for analysis, the aqueous humor samples were acidified and then extracted with methyl tert-butyl ether. The ICB samples followed the same extraction procedure after homogenization in methanol/water. The minimum quantification limit of ketorolac and bromfenac in aqueous humor was 1 and 0.5 ng/mL, respectively.
Quantification of aqueous PGE2 levels
Aqueous PGE2 concentrations were determined using a commercially available competitive enzyme immunoassay kit (Parameter PGE2 Assay [KGE004B]; R&D Systems, Minneapolis, MN) according to the manufacturer's instruction. The assay was based on the competition between aqueous PGE2 and a PGE2-horseradish peroxidase conjugate for a limited amount of PGE2 monoclonal antibody. The antibody-PGE2 complex was then captured by a precoated antibody and assayed spectrophotometrically for the horseradish peroxidase activity at 450 nm. Rabbit aqueous humor was used as a surrogate matrix for preparation of the standards and quality control samples. The mean (range) minimum PGE2 quantification limit was 30.9 pg/mL (16.0 to 41.4 pg/mL).
Quantification of aqueous FITC-dextran levels
Aqueous FITC-dextran was quantified by a Picofluor fluorometer (Turner Biosystems, Sunnyvale, CA). Calibration of the fluorometer was performed before each assay according to manufacturer's instructions. The extinction and emission wavelengths were 475 and 515 nm, respectively. The minimum detection limit of the assay was 50 pM fluorescein. Aqueous humor samples were diluted 1:1,000 in phosphate buffered saline, pH 7.8, and read along with blanks and standards prepared from FITC-dextran, average molecular weight of 70,000 Da (Sigma Chemical Co, St. Louis, MO).
Data analysis
Data were presented as mean ± standard error of the mean. Two-sample t-tests were used for statistical comparison of between-group differences. A P value of <0.05 was considered a statistically significant difference.
The half-maximal inhibitory concentrations (IC50) of ketorolac and bromfenac were previously determined, using human recombinant COX isoforms, as 2 × 10⁻⁸ M and 21 × 10−8 M for COX-1 and 12 × 10−8 M and 0.66 × 10⁻⁸ M for COX-2, respectively. 8 Concentrations of ketorolac and bromfenac in the aqueous and ICB (assuming that 1 ng/g = 1 ng/mL) were then compared to these values at both peak and trough.
Results
Aqueous and ICB NSAID concentrations
The mean NSAID concentrations in the peak and trough groups are listed in Table 1. In the peak group, the mean ketorolac concentration was higher than that of bromfenac by 7.8-fold in the aqueous (737.8 ± 64.7 vs. 94.2 ± 13.8 ng/mL; P < 0.0001) and by 12.1-fold in the ICB (556.0 ± 36.0 vs. 45.9 ± 8.4 ng/g; P < 0.0001). In the trough group, the mean ketorolac concentration was higher than that of bromfenac by 7.7-fold in the aqueous (127.0 ± 18.9 vs. 16.5 ± 2.7 ng/mL; P < 0.001) and by 7.2-fold in the ICB (59.9 ± 6.5 vs. 8.3 ± 1.3 ng/g; P < 0.001).
ng/g for the iris-ciliary body.
P < 0.0001.
P < 0.001 compared to bromfenac.
Aqueous PGE2 and FITC-dextran concentrations
LPS significantly increased both PGE2 and FITC-dextran concentrations in the aqueous of control eyes compared to those that did not receive LPS (8,430 ± 1,055 vs. 2,115 ± 259 pg/mL, P < 0.001, and 16.05 ± 2.57 vs. 0.06 ± 0.04 μg/mL, P < 0.001, respectively) (Figs. 2 and 3). Ketorolac 0.45% and bromfenac 0.09% significantly inhibited LPS-induced aqueous PGE2 elevation at both peak (1,681 ± 224 pg/mL and 1,952 ± 313 vs. 8,430 ± 1,055 pg/mL, respectively; P < 0.01) and trough (2,250 ± 317 pg/mL and 2,323 ± 308 vs. 8,810 ± 2,201 pg/mL, respectively; P < 0.05) (Fig. 2). No differences were seen in PGE2 levels of animals treated with ketorolac 0.45% or bromfenac 0.09% at either peak (P =0.241) or trough (P = 0.877).
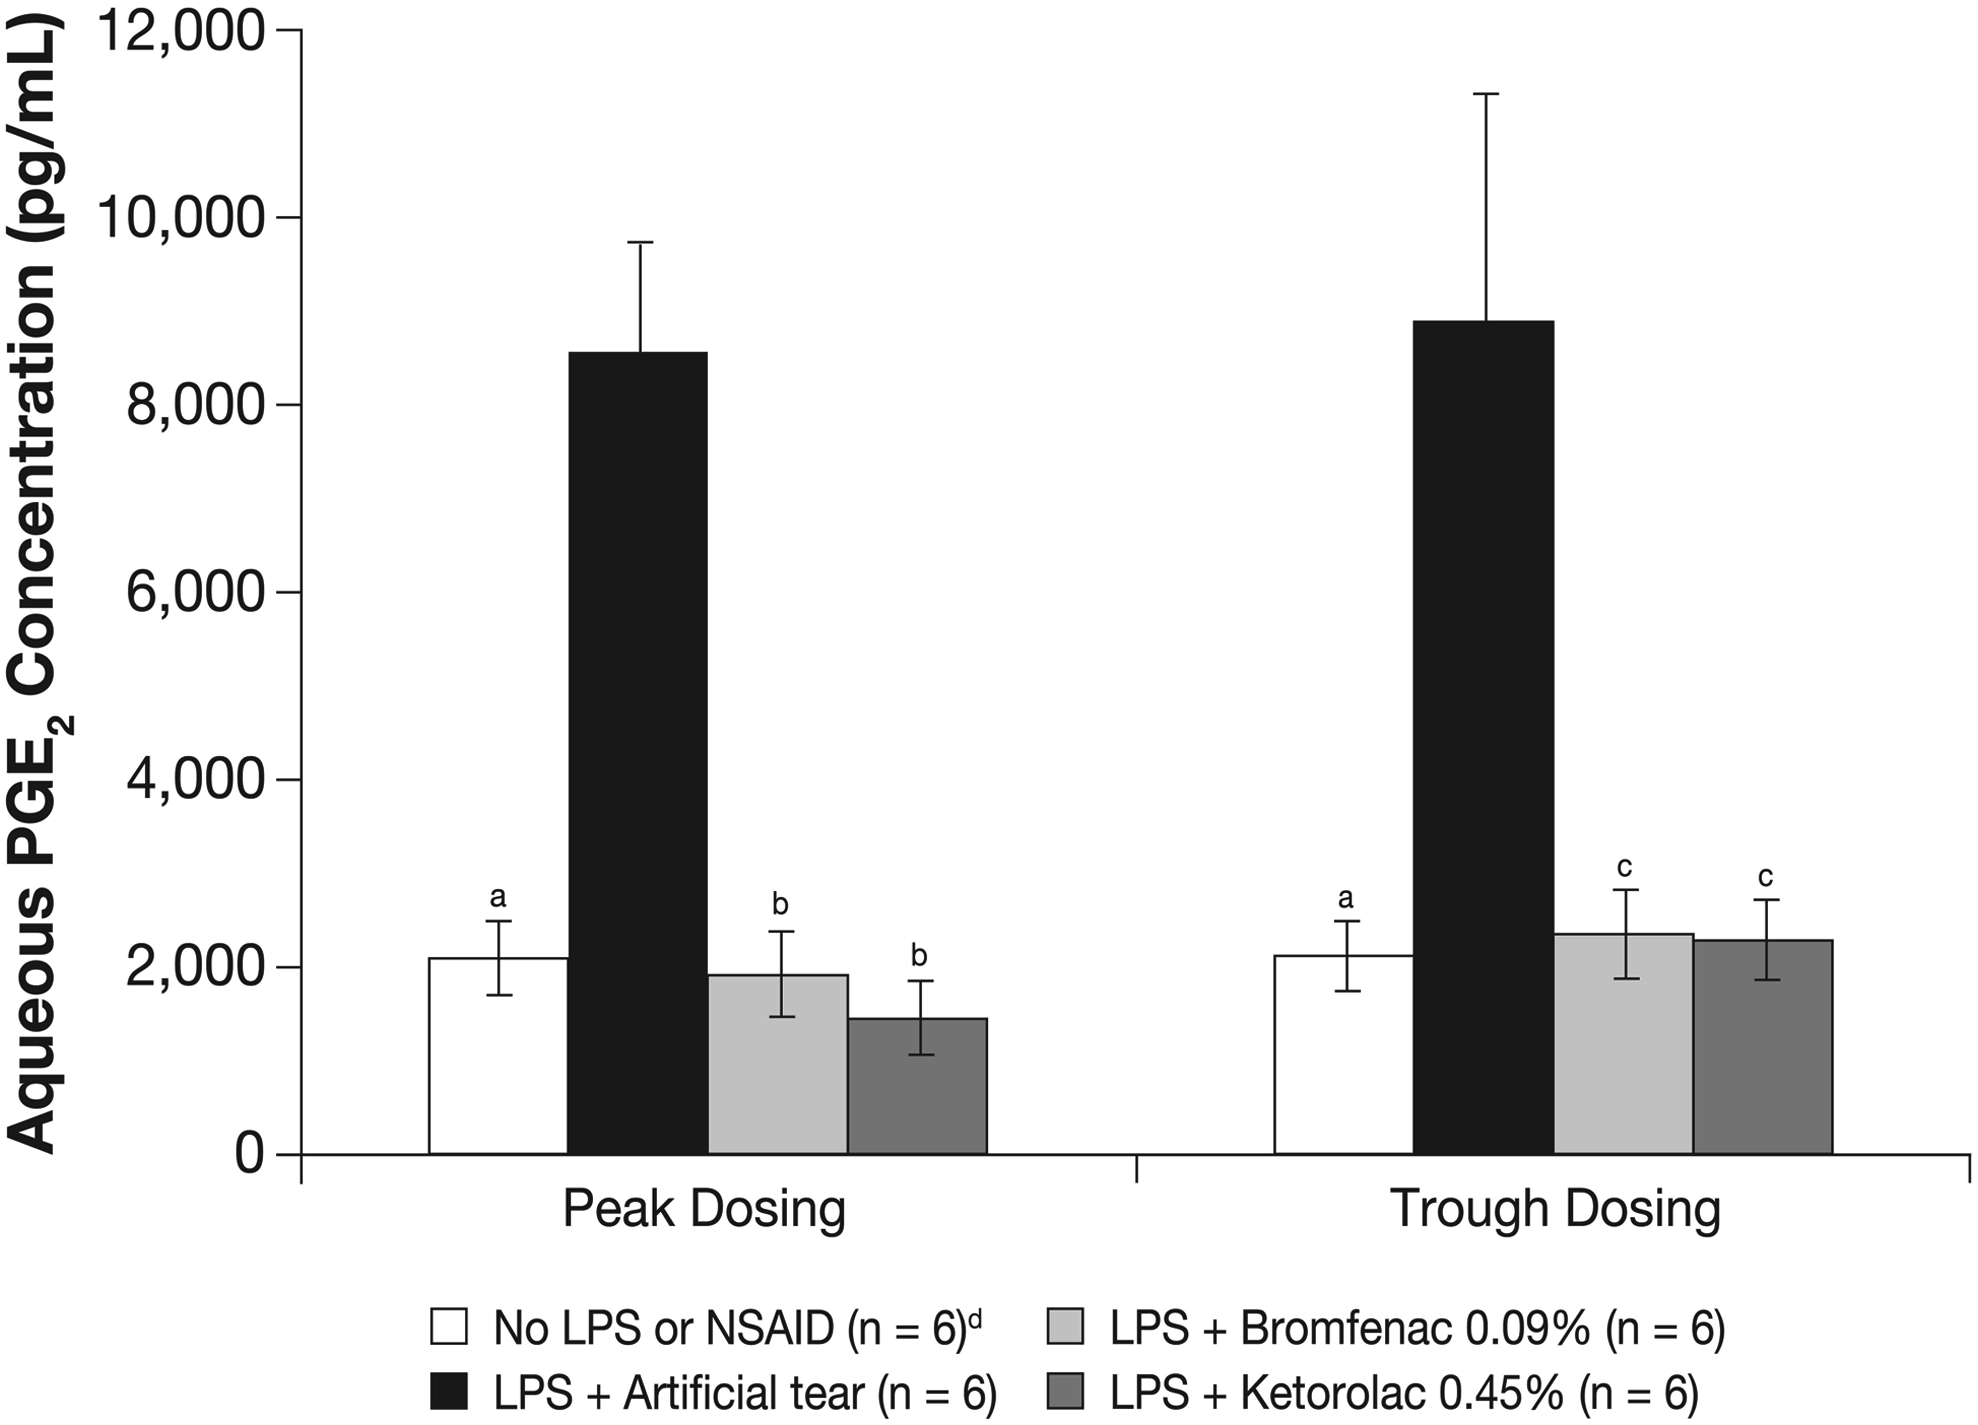
Aqueous PGE2 concentrations after peak and trough dosing of ketorolac 0.45% and bromfenac 0.09%. Aqueous PGE2 was quantified by a competitive enzyme immunoassay 2 h (peak) and 11 h (trough) after the first of 3 doses of study NSAIDs administered once every 20 min. Ocular inflammation was induced by intravenous injection of LPS 1 h before aqueous withdrawal for PGE2 quantification. aP < 0.001, bP < 0.01, and cP < 0.05 compared to LPS + artificial tears. dThe no LPS or NSAID group was the same for peak and trough dosing; it was shown twice for simplicity. Artificial tears = carboxymethylcellulose 0.5% solution. PGE2, prostaglandin E2.
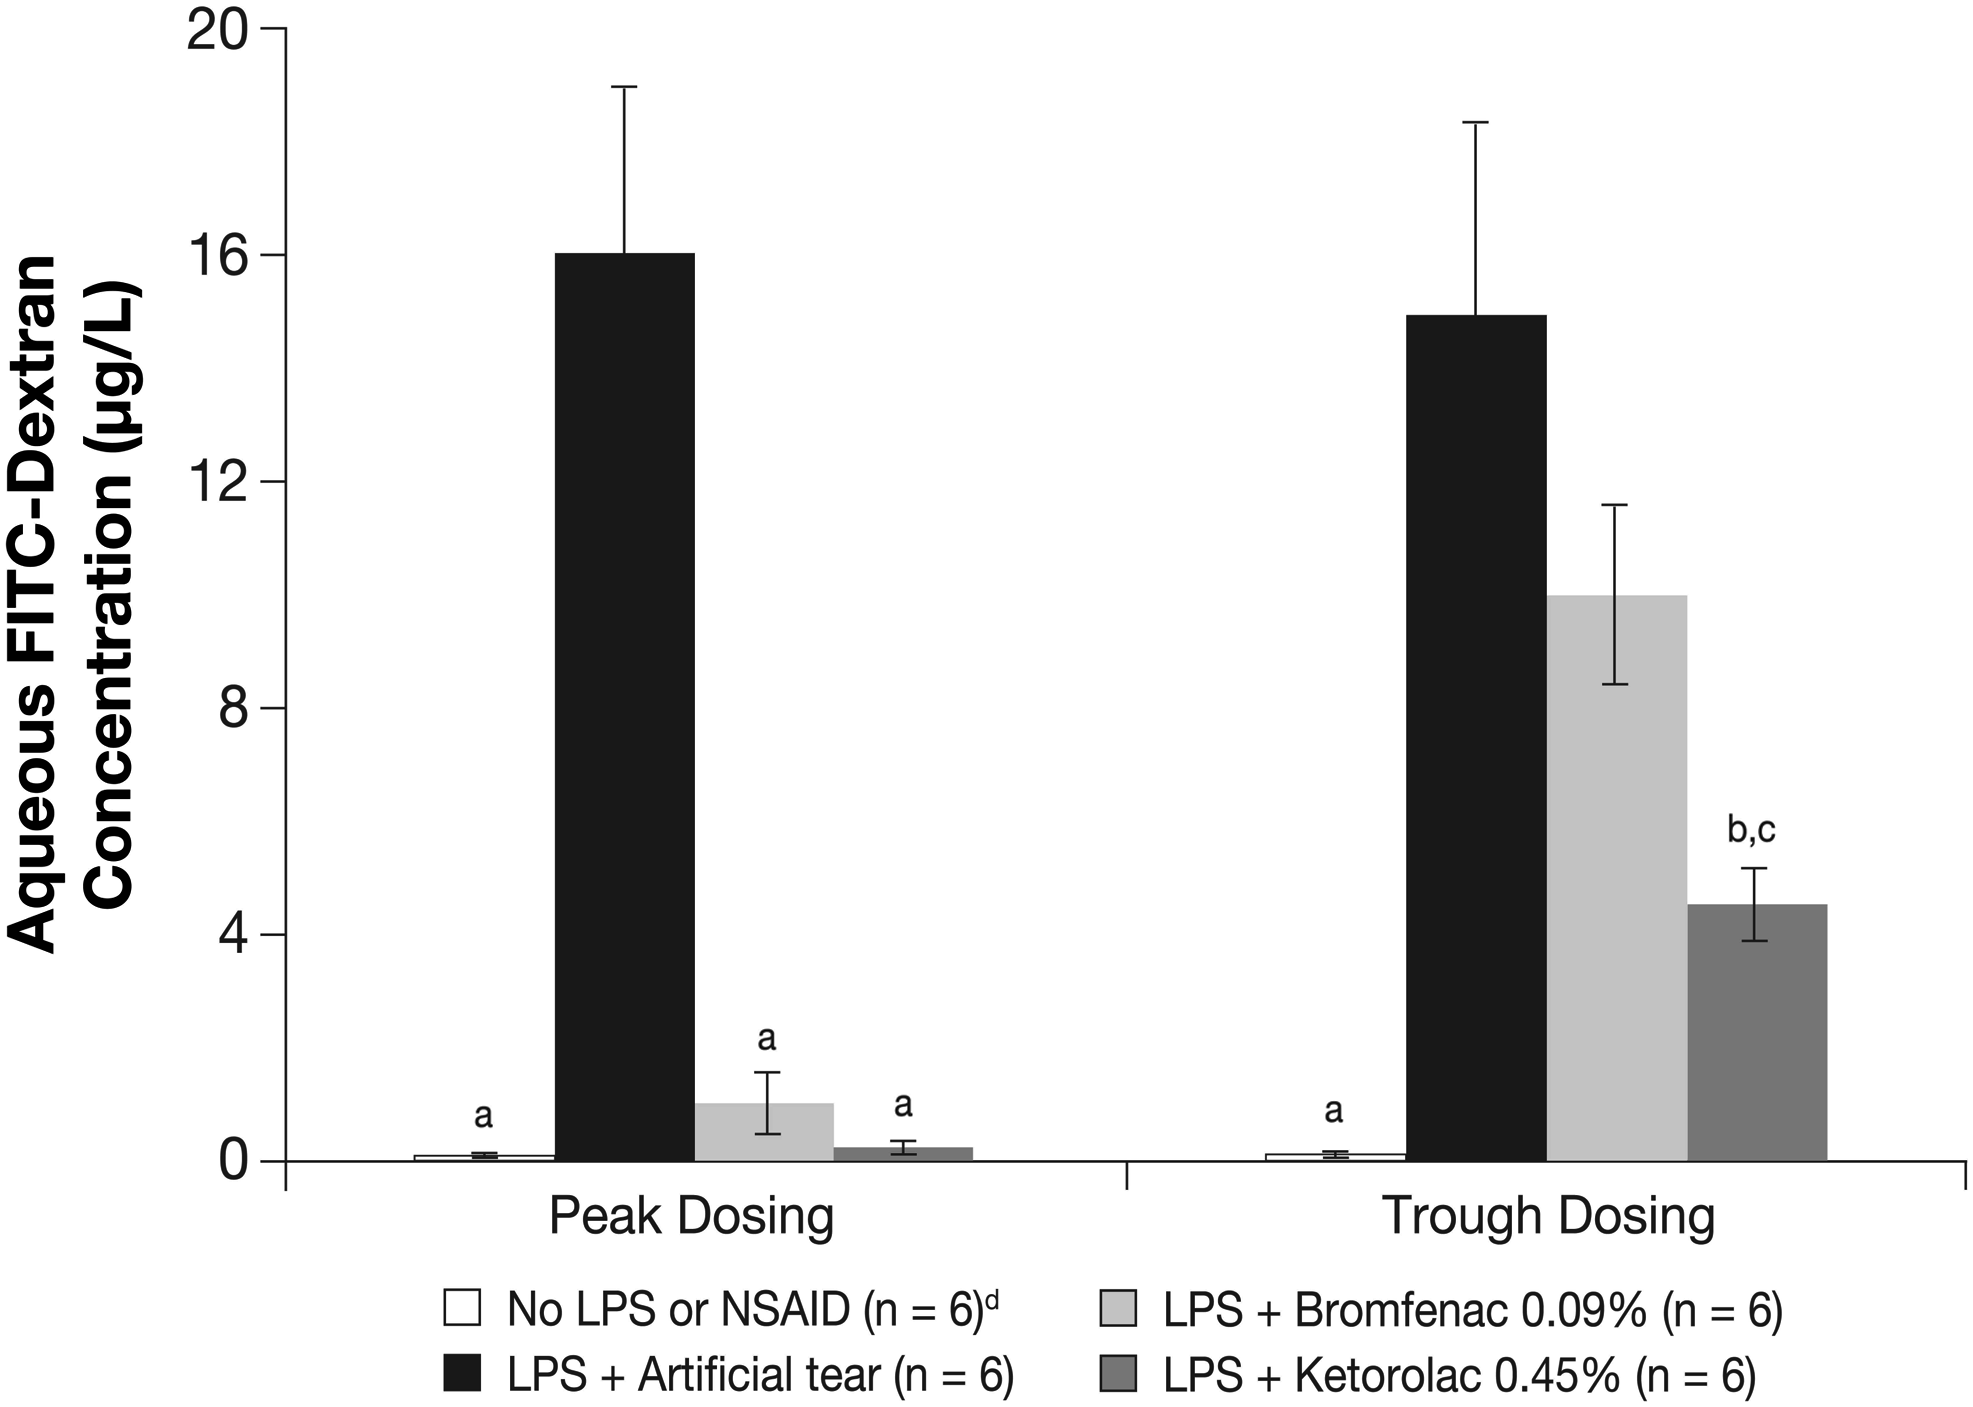
Aqueous FITC-dextran concentrations after peak and trough dosing of ketorolac 0.45% and bromfenac 0.09%. Aqueous FITC-dextran was quantified by a Picofluor fluorometer 2 h (peak) and 11 h (trough) after the first of 3 doses of study NSAIDs administered once every 20 min. Ocular inflammation was induced by intravenous injection of LPS 1 h before aqueous withdrawal for FITC-dextran quantification. aP < 0.001 and bP < 0.01 compared to LPS + artificial tears. cP < 0.05 compared to LPS + bromfenac 0.09%. dThe no LPS or NSAID group was the same for peak and trough dosing; it was shown twice for simplicity.
Treatment with ketorolac 0.45% or bromfenac 0.09% also significantly reduced LPS-induced aqueous FITC-dextran elevation at peak compared to the treatment with artificial tears (control) (0.26 ± 0.15 μg/mL and 1.24 ± 0.60 μg/mL vs. 16.05 ± 2.57 μg/mL, respectively; P < 0.001). In addition, ketorolac 0.45% also significantly reduced LPS-induced aqueous FITC-dextran elevation at trough (4.70 ± 0.75 vs. 15.37 ± 2.45 μg/mL; P < 0.01). In contrast, bromfenac 0.09% did not significantly reduce LPS-induced aqueous FITC-dextran elevation at trough (P = 0.110; Fig. 3). Aqueous FITC-dextran concentration after trough dosing of ketorolac 0.45% was significantly less than that of bromfenac 0.09% (4.70 ± 0.75 vs. 10.1 ± 1.61 μg/mL; P < 0.05).
COX activity
The mean peak and trough concentrations of ketorolac in the aqueous (737.8 and 127 ng/mL, respectively) and the ICB (556.0 and 59.9 ng/g, respectively) (Table 1) exceeded its IC50 value for both COX-1 and COX-2. The mean peak and trough concentrations of bromfenac in the aqueous (94.2 and 16.5 ng/mL) and the ICB (45.9 and 8.3 ng/g) (Table 1) exceeded its IC50 value only for COX-2 (0.66 × 10⁻⁸ M). While the mean peak aqueous concentration of bromfenac exceeded its IC50 value for COX-1 (21 × 10−8 M), the mean peak ICB bromfenac concentration as well as the bromfenac concentration at trough for both the aqueous and ICB were below its IC50 for COX-1.
Discussion
Ocular inflammation can cause pain, photophobia, and delayed visual rehabilitation after cataract surgery. 15 If left untreated, inflammation and excessive production of prostaglandins may result in a breakdown of the blood–retinal barrier and lead to cystoid macular edema, even after uncomplicated cataract extraction.2,16 Topical NSAIDs typically are administered preoperatively and are continued postoperatively for several weeks.11,17,18 Several studies have demonstrated that the addition of topical NSAIDs to a perioperative regimen of topical corticosteroids leads to less patient discomfort, reduced postoperative inflammation, prevention of miosis, and improvements in visual acuity in the early postoperative period relative to patients treated with topical steroids alone.2,18,19
As ophthalmic formulations evolve and less frequent dosing is required (ie, from 4-times-daily to twice-daily), it is critical to understand maximal drug levels achieved and whether there is sufficient medication present at the end of a dosing cycle just before the next drop instillation that can still have a meaningful clinical effect. The present study was designed to compare the ocular penetration and inflammation suppression of ketorolac 0.45% and bromfenac 0.09% in an animal model of inflammation at both peak and trough drug levels. This is the first comparison of these 2 twice-daily ophthalmic formulations as previous studies have compared twice-daily bromfenac to earlier formulations of ketorolac with 4-times daily regimens.
In the present study, ocular inflammation was induced by intravenous LPS administration, which resulted in overt inflammatory response evidenced by 4-fold and >250-fold increase in aqueous PGE2 and FITC-dextran levels, respectively. After 3 doses each separated by 20 min, ketorolac 0.45% achieved 7 to 12-fold higher intraocular concentrations than did bromfenac 0.09% at both peak and trough levels. This difference in intraocular tissue levels (aqueous and ICB) exceeds the 5-fold difference that would be expected based upon the concentrations of active agent in the topical formulations alone. This may be partially explained by the presence of CMC in the ketorolac 0.45% ophthalmic solution, which increases the ocular residence time and thereby enhances ocular absorption.20–23 The intraocular levels achieved with topical ketorolac 0.45% as well as bromfenac 0.09% were able to suppress inflammation as measured by PGE2 levels at both peak and trough NSAID concentrations. While suppression of inflammation was also demonstrated by FITC-dextran at peak levels of both ketorolac 0.45% and bromfenac 0.09%, only ketorolac 0.45% and not bromfenac 0.09% significantly inhibited inflammation as measured by leakage of FITC-dextran at trough NSAID levels.
In a previous study of topical NSAIDs, dose–response curves were constructed to determine the concentrations of either ketorolac or bromfenac, which produced a half-maximal inhibition (IC50) relative to control values. 8 In the present study, the concentration of ketorolac in both the aqueous and ICB exceeded the IC50 levels for both COX-1 and COX-2 isoforms at peak as well as at trough levels based upon a twice daily dosing regimen. While the aqueous and ICB concentrations of bromfenac exceeded the IC50 for COX-2 at both peak and trough, the concentrations in the ICB were below the IC50 for COX-1 at both peak and trough as was the aqueous concentration at trough. The difference in efficacy at trough between ketorolac 0.45% and bromfenac 0.09% in the present study evidenced by the degree of inhibition of FITC-dextran leakage may be the result of differences achieved in the tissue concentrations as well as differences between the relative selectivity of ketorolac and bromfenac for COX-1.
The iris is the major site for prostaglandin production in the eye. 24 While COX-1 has often been termed the constitutive isoform and COX-2 has been referred to as the inducible isoform,25,26 these strict definitions may be blurred. In a recent study evaluating the ocular inflammatory response 2 h after paracentesis, inhibition of prostaglandins was achieved by COX-1 selective inhibitors, but not by nimesulide, a COX-2-selective inhibitor. 27 In addition, there is evidence that the COX-2 enzyme is expressed constitutively in both the anterior and posterior segments of the human eye.28,29 In the present study, inflammation was assessed based upon both PGE2 aqueous concentrations as well as by the degree of FITC-dextran leakage from the iris blood vessels secondary to the breakdown of the blood–aqueous barrier. Further studies are necessary to assess whether measurement of FITC-dextran leakage is a more sensitive marker of inflammation than PGE2 levels.
There are several limitations to the present study. While the rabbit eye has often served as a model for inflammation,8,30–33 it remains only a surrogate for the human eye. For purposes of this and previous studies, both COX-1 and COX-2 enzymes are expressed in the iris and ciliary body of rabbits.28,29 The design of the study and the administration of 3 doses over the course of an hour before LPS injection was intended to simulate a typical preoperative dosing regimen, 18 but the timing of medication instillation in this study may not exactly correlate with various dosing regimens that may be employed perioperatively. The injection of LPS at hour 10 in the trough group was intended to evaluate the ability of the NSAID to suppress inflammation at trough levels of active agent. These trough levels of NSAID may vary in clinical practice depending on the number of preoperative doses over hours to days as well as the timing of the cataract surgery in relation to medication instillation.
The current model demonstrates that both ketorolac 0.45% and bromfenac 0.09% effectively suppress inflammation at peak levels. Ketorolac 0.45% may effectively suppress inflammation to a greater extent than bromfenac 0.09% at trough NSAID levels based upon a twice daily dosing regimen. Differences in efficacy may be based on differences in the intraocular tissue levels as well as differences in overall COX-1/COX-2 selectivity. Further studies in both animal models as well as humans are warranted to confirm the present findings.
Conclusions
Ketorolac 0.45% achieved aqueous and ICB concentrations that exceeded its IC50 values for COX-1 and COX-2 at both peak and trough. At peak, ketorolac 0.45% and bromfenac 0.09% inhibited LPS-induced anterior chamber inflammation as measured by both PGE2 and FITC-dextran leakage. At trough, while both NSAIDs inhibited LPS-induced aqueous PGE2 elevation, only ketorolac 0.45%, not bromfenac 0.09%, significantly prevented FITC-dextran leakage into the aqueous.
Footnotes
Acknowledgments
The authors thank Mary Ghebrial, B.Sc., of Allergan, Inc., for her assistance in data analysis and interpretation. Editorial assistance in the preparation of this article was provided by Hadi Moini, Ph.D., of Pacific Communications, a wholly owned subsidiary of Allergan, Inc.
Author Disclosure Statement
This study was funded by Allergan, Inc., Irvine, CA. L. David Waterbury received research support from Allergan, Inc. D. Galindo and C. Nguyen have no financial and/or conflicting interests to disclose. L. Villanueva, M. Patel, L. Borbridge, M. Attar, R.M. Schiffman, and D.A. Hollander are employees of Allergan, Inc.
Presented at Annual Meeting of the Association for Research in Vision and Ophthalmology (ARVO), May 2–6, 2010, Fort Lauderdale, Florida.