
Abstract
Aims:
To develop a model to estimate and compare the cost of changing therapy due to hyperemia in glaucoma patients treated initially either with latanoprost, bimatoprost, or travoprost monotherapy.
Methods:
Data collected from the HealthCore Integrated Research Database, as part of the Glaucoma Adherence and Persistency Study (GAPS), were used to populate the model. Patients with a documented diagnosis of glaucoma who were newly treated (no ocular hypotensive medication and no glaucoma-related procedure during 6 months before first prescription) with latanoprost, bimatoprost, or travoprost monotherapy were identified. The time horizon for the base-case model was the duration of chart abstraction (mean = 4.1 years); a 3-month model also was developed. Physician-reported rates of hyperemia were obtained from chart reviews of 300 patients. Transition rates reflected events related to reports of hyperemia where a physician-driven change (switch or discontinuation) in therapy was documented. The per-patient direct cost (2008) due to hyperemia-driven change in therapy was calculated as the sum of the cost of the initial prescription plus the cost of the office visit where the patient was evaluated and the decision to change therapy was made. Costs were stratified by whether patients were hyperemia free or discontinued the initial therapy due to hyperemia.
Results:
From the sample of 13,977 newly treated patients, 8,743 patients were started on a prostaglandin monotherapy only. Of these, 5,726 received latanoprost, 1,633 were treated with bimatoprost, and 1,384 received travoprost index monotherapy. Across all treatment groups, costs among hyperemia-free patients were US$73.67 versus US$140.02 for those who discontinued the initial prostaglandin due to hyperemia. Per-patient costs were lowest in the group treated initially with latanoprost. For the base-case model, with latanoprost as the reference, total per-patient incremental costs due to hyperemia-driven change in therapy were US$5.92 for bimatoprost and US$5.43 for travoprost. Results were not highly sensitive to increases either in the incidence of hyperemia among latanoprost-treated patients or in the cost of latanoprost.
Conclusions:
Hyperemia results in increased overall costs in patients treated with latanoprost, bimatoprost, and travoprost. Treatment with latanoprost is associated with lower hyperemia-related costs than treatment with bimatoprost or travoprost.
Introduction
P
Patient concern about and dissatisfaction with side effects are among the primary reasons for medication nonadherence and discontinuation.11–15 Hyperemia, a common side effect of the topical prostaglandins, may be of more immediate concern for glaucoma patients than long-term, largely asymptomatic disease progression.16 In a review of 300 patient charts, the Glaucoma Adherence and Persistency Study (GAPS)17 found that hyperemia was the most common documented side effect, noted in the charts of 45% of all patients on prostaglandins (monotherapy or combination therapy), and that stopping or switching medication was attributed to hyperemia in 63% of patients in whom side effect–related therapeutic changes were made.
Failure to follow treatment regimens as prescribed can lead to higher health-care costs,3,18 and therapy changes, in particular, have been associated with increased costs in glaucoma patients.19,20 We hypothesized that if there are differences among prostaglandins with regard to the frequency of hyperemia-related medication changes, these would be reflected in treatment cost differentials. To test this hypothesis, we developed a model to estimate and compare the cost of changing therapy due to hyperemia in glaucoma patients treated initially with latanoprost, bimatoprost, or travoprost monotherapy.
Methods
The HealthCore Integrated Research Database (HealthCore, Inc., Wilmington, DE) provides retrospective insurance claims data with access to medical charts, physicians, and patients for conducting HIPAA-compliant research. The database contains a geographically diverse sample of longitudinal claims data from health plans in the southeastern, mid-Atlantic, central, and western regions of the United States beginning from January 1, 1999. Data collected from this database, as part of the GAPS, were used to populate the model; detailed descriptions of the database and the GAPS have been reported elsewhere previously.21
Model parameters
Patient population. The GAPS included a population of 14,162,543 lives from the HealthCore database. Using diagnosis codes (Table 1 22), patients were identified with a documented diagnosis of glaucoma. Newly treated patients were identified from this pool. Patients were defined as “newly treated” if they had not been treated with any ocular hypotensive medications during the 6-month “pre-index period” (ie, before their first prescription) and also did not have a glaucoma-related procedure (eg, trabeculoplasty or trabeculectomy [Appendix 223]) during the 6-month pre-index period. From among newly treated patients, those started on latanoprost, bimatoprost, or travoprost index monotherapy only were identified.
Abbreviation: ICD-9, International Classification of Diseases, Ninth Revision.
Time horizons. The base-case model represented data collected over the duration of the chart abstraction period, an average of 4.1 years. A 3-month model also was developed.
Abbreviation: CPT, current procedural terminology.
Incidence rates. The physician-reported rates of hyperemia from chart reviews of 300 patients who were identified as having been treated initially with a prostaglandin in the GAPS were utilized for the analysis (Table 3). A group of 77 was excluded due to chart evidence of a prescription for an ocular hypotensive before the index prostaglandin; an additional 7 were excluded due to a claim for a prescription before the charted index prostaglandin.
aBased on data from the Glaucoma Adherence and Persistency Study (GAPS).
b2.5-mL size.
Abbreviation: AWP, average wholesale price.
Hyperemia was considered to be present at a visit if the chart included a notation of “hyperemia” or “red eye(s)” or if the conjunctiva was not assessed as clear or zero; conjunctival assessment values were trace (assigned a value of 0.5+), 1+ (mild), 2+ (moderate), 3+ (moderate/severe), and 4+ (severe). A chart notation of hyperemia or red eyes could have been in response to physician observation or patient report, but notations generally did not specify whether the condition was observed versus reported.
Physician-driven changes in therapy, either switch or discontinuation, related to reports of hyperemia were documented from chart reviews for each initiating prostaglandin. Transition rates, that is, the rates at which patients who changed their initial therapy switched to a given replacement product or discontinued therapy, were estimated (Table 4). The number of patients switched to a given replacement product was computed by multiplying the total number of patients who changed the initial product by the percentage switching to the replacement product. Patients could be switched from the initial prostaglandin to another prostaglandin; switched to fixed-combination dorzolamide/timolol, adrenergics, beta-blockers, or carbonic anhydrase inhibitors; or discontinued from current therapy. Transition rates were estimated for both prostaglandins alone and for prostaglandins in combination with other therapies. It must be noted that all patients included in the chart review whose medication was discontinued eventually were restarted on some ocular hypotensive medication at a subsequent point in time.24
aNo unfixed combinations were prescribed.
Abbreviations: CAI, carbonic anhydrase inhibitor; D/C, discontinued ocular hypotensive medication; FC, fixed combination.
Direct costs. The 2008 average wholesale prices (AWP) derived from the Drug Topics Red Book25 for the three prostaglandins were used in the model (Table 3). The median paid charge of an office visit from the HealthCore database was US$65.00 and was used accordingly in the analysis.
Model assumptions. The underlying assumption was that hyperemia will develop within a few days of therapy initiation. In these cases, the first prescription can be expected to provide, at most, a few days of therapy and essentially will be wasted. Discontinuation of the index medication was considered to be associated with an adverse effect if the effect and the discontinuation were noted on the same day. The model also assumed that there was an office visit for every patient whose initial prostaglandin was changed by the physician as the data source was physician notations on patient charts. The model did not account for the costs of treating hyperemia (eg, use of steroids and anti-inflammatory agents) and hence provides a conservative estimate of additional costs of hyperemia management. The model also did not account for costs associated with longer term therapy for glaucoma, such as patient compliance, dropout rates, time between refills, and estimated cost per day of therapy. Additionally, the model did not take into account product discounts, patient copayments, costs associated with hyperemia that did not lead to a change, or use of samples. The model accounted for direct costs from a payer perspective due to hyperemia-driven change in therapy.
Per-patient cost. The per-patient cost due to hyperemia-driven change in therapy was calculated as the sum of the cost of the initial prescription, using the AWP, plus the incremental cost of the office visit where the patient was evaluated and the decision to change therapy was made or due to an additional follow-up visit to assess whether the change was successful. Costs were stratified by whether patients were hyperemia free or discontinued use of the initial therapy due to hyperemia.
Results
Among the 54,778 patients with a documented diagnosis of glaucoma, 13,977 were newly treated patients, and 8,743 patients were started on a prostaglandin monotherapy (Table 5). Of these 8,743 patients, 5,726 received latanoprost, 1,633 were treated with bimatoprost, and 1,384 received travoprost index monotherapy.
The effect of hyperemia on per-patient costs associated with the initial prescription and a hyperemia-related follow-up visit was seen across patients overall and in each initial treatment group (Fig. 1). For all patients, cost per event among hyperemia-free patients was approximately half of those incurred by patients who discontinued the initial prostaglandin due to hyperemia (eg, US$73.67 vs. US$140.02, respectively). Per-patient costs were lowest in the group treated initially with latanoprost and were higher and similar in those treated first with bimatoprost or travoprost (Table 6). For the base-case model, with latanoprost as the reference product, total per-patient incremental costs due to hyperemia-driven change in therapy were US$5.92 for bimatoprost and US$5.43 for travoprost across the population of treated patients (Fig. 2).
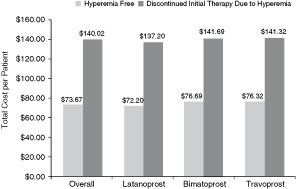
Total cost per patient for hyperemia-free patients versus patients discontinuing initial therapy due to hyperemia.
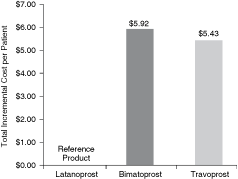
Incremental cost per patient per treatment change event with reference to latanoprost.
Sensitivity analyses
Sensitivity analyses were conducted on the incidence rates and costs to evaluate the robustness of model assumptions; findings are presented in Table 7. All other variables being held constant, latanoprost incidence and change rates would need to be increased >3 times (>5 standard deviations) to achieve breakeven with bimatoprost or travoprost. Sensitivity analysis on AWP25 revealed that, keeping latanoprost AWP constant, bimatoprost and travoprost costs would need to be decreased by at least 7% to breakeven. An additional sensitivity analysis using wholesale acquisition costs (WAC)26 yielded similar results. At least a 7% change in cost was observed in WAC over a period of 1 year for the prostaglandins.
aCompared to $78.66 (bimatoprost) and $78.17 (travoprost).
bCompared to $77.47 (bimatoprost) and $77.05 (travoprost).
Discussion
Based on a model populated with real-world data, total per-patient costs were nearly doubled in those who change from initial latanoprost, bimatoprost, or travoprost therapy due to hyperemia compared with hyperemia-free patients. In addition, latanoprost-treated patients had lower initial prescription and hyperemia-related follow-up costs than those first treated with either bimatoprost or travoprost, a finding not highly sensitive to increases either in the incidence of hyperemia among latanoprost-treated patients or in the cost of latanoprost.
Although hyperemia is the most common side effect associated with the use of topical ocular prostaglandins,16 the condition generally occurs less frequently among patients treated with latanoprost. For example, rates based on investigator assessments of the presence and grade of hyperemia at each visit using standard photographs during a 12-week, randomized, masked-evaluator study27 of the efficacy and safety of latanoprost, bimatoprost, and travoprost were 47.1%, 68.6%, and 58.0%, respectively (P = 0.001 for latanoprost vs. bimatoprost); differences among therapies in tolerability occurred despite the fact that treatment with the 3 prostaglandins resulted in similar intraocular pressure reductions. A prospective, randomized, double-masked, crossover, active-controlled comparison of the 3 prostaglandins also found that latanoprost-treated patients had the fewest complaints of ocular redness (P = 0.048).28 Product labeling for latanoprost,29 bimatoprost,30 and travoprost31 reports that hyperemia occurs in from 5% to 15%, 15% to 45%, and 30% to 50% of patients, respectively; the range of occurrence of hyperemia (30%–50%) is reported for travoprost both with and without the preservative benzalkonium chloride.31
Hyperemia was not the most common reason given by physicians for switching medication (43% due to lack of efficacy vs. 19% related to adverse events), but hyperemia was one of the most frequently reported adverse events occurring in one of every 2.21 patients treated with prostaglandin analogs.32 Although it has been suggested that the severity of prostaglandin-related hyperemia decreases over time,33 others27,32,34 have found the degree of hyperemia to be consistent over time. A previous analysis of GAPS data32 revealed that hyperemia was recorded at more than one visit in the charts of 77/135 (57%) of patients who ever had the condition; given that the average time between visits was 3–4 months, many patients had hyperemia which may have persisted for >6 months.
We developed our model using data from actual clinical practices in order to reflect real-world experience. Data from the GAPS chart reviews confirmed that hyperemia is the most frequently reported prostaglandin-associated adverse event as well as the relative frequency of hyperemia among patients treated initially with latanoprost, bimatoprost, and travoprost. The lower hyperemia rates in the GAPS likely reflect the fact that the GAPS data were collected retrospectively and reflected voluntary chart notations while the data published by Parrish and colleagues27 and Stewart and colleagues28 as well as that reported in product labeling29–31 were collected prospectively by investigators who were instructed to assess hyperemia at each visit.
One might have expected the change rate among patients with hyperemia recorded in their charts to have been higher than the 6% found in the GAPS and used in the cost model. However, this rate is similar to the 9% probability of discontinuing glaucoma medication due to side effects reported in a study of 3,333 users of topical glaucoma medication.35 In addition, the GAPS data17 were based on interviews with 225 patients that took place at a mean of 2.73 ± 1.03 years after the index prescription and 3.59 ± 1.68 years after the first charted glaucoma prescription. Therefore, these interview-based data reflect the perceptions of experienced patients and may not be highly sensitive to factors that influence adherence early in the course of treatment. Adverse effects often resulted in medication changes early in treatment, however.17
The current model estimates the short-term cost implications of hyperemia among patients initially treated with the most commonly prescribed class of ocular hypotensive medications, the prostaglandin analogs. The model provides only a conservative estimate of hyperemia-associated costs by including just the cost of the initial prostaglandin prescription and the cost of an office visit; comprehensive cost estimation awaits future research. Additional visits may have been incurred either to change medications or to evaluate the response to the new medication. The GAPS showed that among the studied charts, 40% (118/298) of patients were reexamined within 30 days and 63% (189/298) were reexamined within 60 days.24 It is notable that ocular side effects generally have been shown to negatively impact vision-related quality of life as well as patient satisfaction and compliance with therapy and to be associated with additional visits to an ophthalmologist.36
To our knowledge, the model described represents the first attempt to quantify the impact of hyperemia on costs. The study has several limitations, however. First, information in the charts did not allow us to differentiate between whether the patient or the physician first identified the hyperemia. Second, although the model assumed that there was a nonroutine office visit associated with every change in medication, in actual practice such changes could have been made via a telephone consultation with the physician or during a normally scheduled visit. Third, it is not known how many patients received an initial sample of one of the three prostaglandins, found the sample drug to be ineffective or intolerable (due to hyperemia or some other side effect), and were never given an initial prescription for the sample medication. These patients would not have been identified in the present model as having changed therapy. Fourth, patient’s self-report of adverse events may have been influenced by the tier of coverage and co-payments, which were excluded from the model.21,37 Finally, travoprost and bimatoprost had been on the market for a shorter time than latanoprost during the data collection period (1999–2003); it is possible that physicians were more conservative in their response to hyperemia associated with travoprost and bimatoprost due to their relative inexperience with these agents.
In conclusion, in patients treated with latanoprost, bimatoprost, and travoprost, hyperemia results in increased medical and pharmacy costs. Of the three prostaglandins, treatment with latanoprost is associated with the lowest hyperemia-related costs.
Footnotes
Acknowledgments
Editorial support, including contributing to the first draft of the manuscript, revising the article based on author feedback, and styling the article for journal submission, was provided by Jane G. Murphy, Ph.D., of Zola Associates and was funded by Pfizer, Inc., New York, New York.
The research was supported by Pfizer Inc, New York, New York. The sponsor participated in the study design, data analysis and interpretation, and preparation and review of the manuscript.
Author Disclosure Statement
G.F.S. and J.T. are consultants to Pfizer Inc. S.K. is an employee of Pfizer Inc.