
Abstract
Background:
Several countries have legalized cannabis (Cannabis sativa) and kratom (Mitragyna speciosa), increasing accessibility to these psychotropic plants for medicinal and recreational purposes. Cooking is a popular method to utilize cannabis and kratom at the household level. The aim of this research was to study the effect of cooking conditions on psychoactive compounds, namely cannabidiol (CBD) and tetrahydrocannabinol (THC) derivatives (△8, △9THC, and tetrahydrocannabinolic) in cannabis and mitragynine in kratom.
Methods:
Quantitative analysis of these substances was performed using LC/MS/MS. Cannabis and kratom were subjected to different cooking conditions based on popular cooking methods, including steaming, boiling, deep-frying, stir-frying, and products.
Results:
The results indicate that boiling and steaming retain the highest content of THC in cannabis. For mitragynine in kratom, there was a varied degree of mitragynine reduction by different cooking methods, which ranged from 20% to 50%. The total phenolic content of all treated samples was lower than the fresh samples.
Conclusion:
Various cooking methods and product formulation affect THC and CBD quantity, so it is important to assess the retention of those phytocannabinoids in the finished product. However, the adverse effects of THC are unlikely as they are present in low quantities.
Introduction
Several plants exhibit psychotropic effects on the body. The most well-known species are Mitragyna speciosa and Cannabis sativa, which are considered to be psychotropic plants despite some research showing their pharmaceutical potential. 1 These psychotropic plants are legalized in many countries, including Canada, Georgia, Malta, Mexico, South Africa, Thailand, and Uruguay, plus 21 states, 3 territories, and the District of Columbia in the United States of America and the Australian Capital Territory in Australia. The commercial sale of recreational cannabis is legalized nationwide in Canada, Thailand, and Uruguay. Recently, Thailand became the first country in Asia to authorize cannabis for industrial and recreational use, 2 making it the third nations in the world after Canada and Uruguay. Meanwhile, for M. speciosa, kratom leaf consumption was decriminalized in Thailand on August 26th, 2022. 3
M. speciosa, also called kratom, is a tree from Southeast Asia belonging to the family Rubiaceae and is best known for the utilization of its leaves in Thailand, Malaysia, and the Philippines. Kratom leaves have long been used as a drug due to their opioid-like effects. 4 Kratom is known for both stimulating and sedative effects. Kratom leaves were previously consumed to boost energy and lessen weariness and are a popular home remedy to cure muscle soreness. Both young and mature leaves are boiled with water, or components are extracted through concoction methods. The components include alkaloids such as mitragynine and 7-hydroxymitragynine which exhibit psychological effects. 5 Similar to cannabis leaves, most nations forbid the consumption of M. speciosa, but Thailand approved kratom consumption in 2022 along with many other countries such as Austria, Croatia, Spain, Hungary, France, the Netherlands, Sweden, and Greece. 6
Cannabis sativa L. is a plant species that grows in tropical areas and belongs to the Cannabaceae family. Cannabis and hemp both belong to this species, although they differ in terms of their tetrahydrocannabinol (THC) concentration, known as the “chemical phenotype.” 7 The United Nation Office on Drugs and Crime categorizes C. sativa into chemotype based on the proportion of THC and cannabinol (CBN) relative to cannabidiol (CBD). The plant is referred to as hemp (fiber-like) when the THC content in the total dry mass is lower than 0.2% and cannabis (drug-like) when the THC content is higher than 0.2%.
Regarding the effects on health, cannabis consumption can cause hallucinations. THC (Δ9-tetrahydrocannabinol), the psychoactive compound, and CBD, the nonpsychoactive compound, are the two main active substances. These are referred to as cannabinoids. The euphoric impact varies based upon the concentration of THC, producing feelings of well-being and relaxation, as well as increased appetite, paranoia, anxiety, and depression. Cannabinoids interact with the endocannabinoid system in the human body. The endocannabinoid system is composed of receptors that produce immunomodulatory, psychotropic, and metabolic effects on the nervous system and the brain. Moreover, phytocannabinoids exhibit significant therapeutic potential in treating various physical and mental health conditions, as indicated previously.8,9
Most cannabinoids are present in their acid form in nature, which means they contain a carboxyl (COOH) group. THC and CBD are obtained by decarboxylation, which eliminates the COOH group to obtain the active form. As a result, CBDA (cannabidiolic acid) is converted into CBD and THCA (tetrahydrocannabinolic acid) into THC. Therefore, to extract the psychoactive form, cannabis must be heated (smoked) to convert it to THC. Despite the therapeutic benefits, the high dose can cause adverse effects. Cannabis also poses therapeutic benefits, since it is a pain reliever, anti-inflammatory, and anti-cancer properties, but the effective dose is still unclear. Controlling the content is therefore essential to prevent these negative consequences on the body, especially when it is allowed to be used in food.
In recent decades, cannabis consumption as food has increased, especially since its legalization in some countries. The value of food and beverages containing cannabis in Thailand has been estimated at 800 million Thai baht, or around 21 million euros. 10 In addition, the accessibility of cannabis in these countries has become easier, increasing its potential use at the household level, such as in cooking and home remedies, including in chicken soup and stir-fries as flavor enhancers. Despite its widespread utilization, there is no suggested amount of cannabis that can be used, which could cause long-term undesirable effects due to unregulated household consumption. The leaves, roots, and stems are allowed as food ingredients despite the lack of scientific evidence and well-defined toxicological thresholds pertaining to cannabis products. The majority of the Thai population is unaware that consumption might cause undesirable effects. Cannabis is permitted as a food additive and ingredient in items such as candies, chewing gums, brownies, chocolate, tea, and muffins. Indeed, people tend to consume more because the psychoactive effects certainly do not manifest slower with inhalation. There are several case reports for the misuse and overuse of cannabis in food. Moreover, some individuals may be more sensitive than others, which could lead to severe effects. Consequently, the commercialization and consumption of cannabis should be strictly regulated based on reliable scientific evidence.
Therefore, this work aimed to study the effect of cooking conditions and heat processing on cannabinoid content and total phenolic content in cannabis leaves (C. sativa) and kratom (M. speciosa). The findings could inform regulations and recommendations for households in countries where these plants are already legalized. In addition, the information obtained can be used by countries planning to legalize these plants for medicinal or recreational purposes in addition to as a food ingredient to prevent undesirable effects on the population.
Materials and Methods
Plant materials
Plant samples were procured from Thailand in 2022. The samples were collected from a legalized greenhouse farm that breeds from seeds. The fresh leaves of M. speciosa 1 (red vein kratom leaves) were collected from a controlled greenhouse in Surat Thani, Southern Thailand. Fresh leaves of M. speciosa 2 (green vein kratom leaves) were collected in Pathum Thani, Central Thailand. C. sativa: The variety was Hang Kra Rog Phu Phan cannabis leaves, collected in Lampang, Northern Thailand.
Cooking conditions
Following the bibliographical study, four cooking modes were considered: steaming, boiling, stir-frying, and deep-frying, as these are popular cooking procedures. The best cooking times and temperatures for each process were determined in real practice based on the color change after cooking and the differences in time and temperature between the conditions. The objective was to analyze the effects of heat treatment on cannabinoids, mitragynine, and phenolic compounds. An experimental plan was therefore carried out, involving an ordered sequence of trials with different temperatures and times for each heating condition of each plant. After exploration, three conditions per cooking method were established: Boiling at 100°C for three intervals (5 min, 1 h, and 2 h); steaming at 100°C for three intervals (20 min, 1 h, and 4 h); stir-frying in palm oil for three intervals (145°C for 1 min, 130°C for 2 min, and 160°C for 3 min); and deep-frying in palm oil for three intervals (130°C for 1 min, 170°C for 40 sec, and 180°C for 15 sec). The first step was to standardize the method. For each cooking condition, a thermometer and a chronometer were used, along with adapted cooking equipment. The leaves were then subjected to the specified temperature for the predetermined time. The appearance of the cooked samples is shown in Figures 1 and 2. Each cooked sample was kept in the refrigerator at −20°C until further analysis. Fresh and dry samples were also studied. The fresh leaves were freeze-dried and used as dry samples.
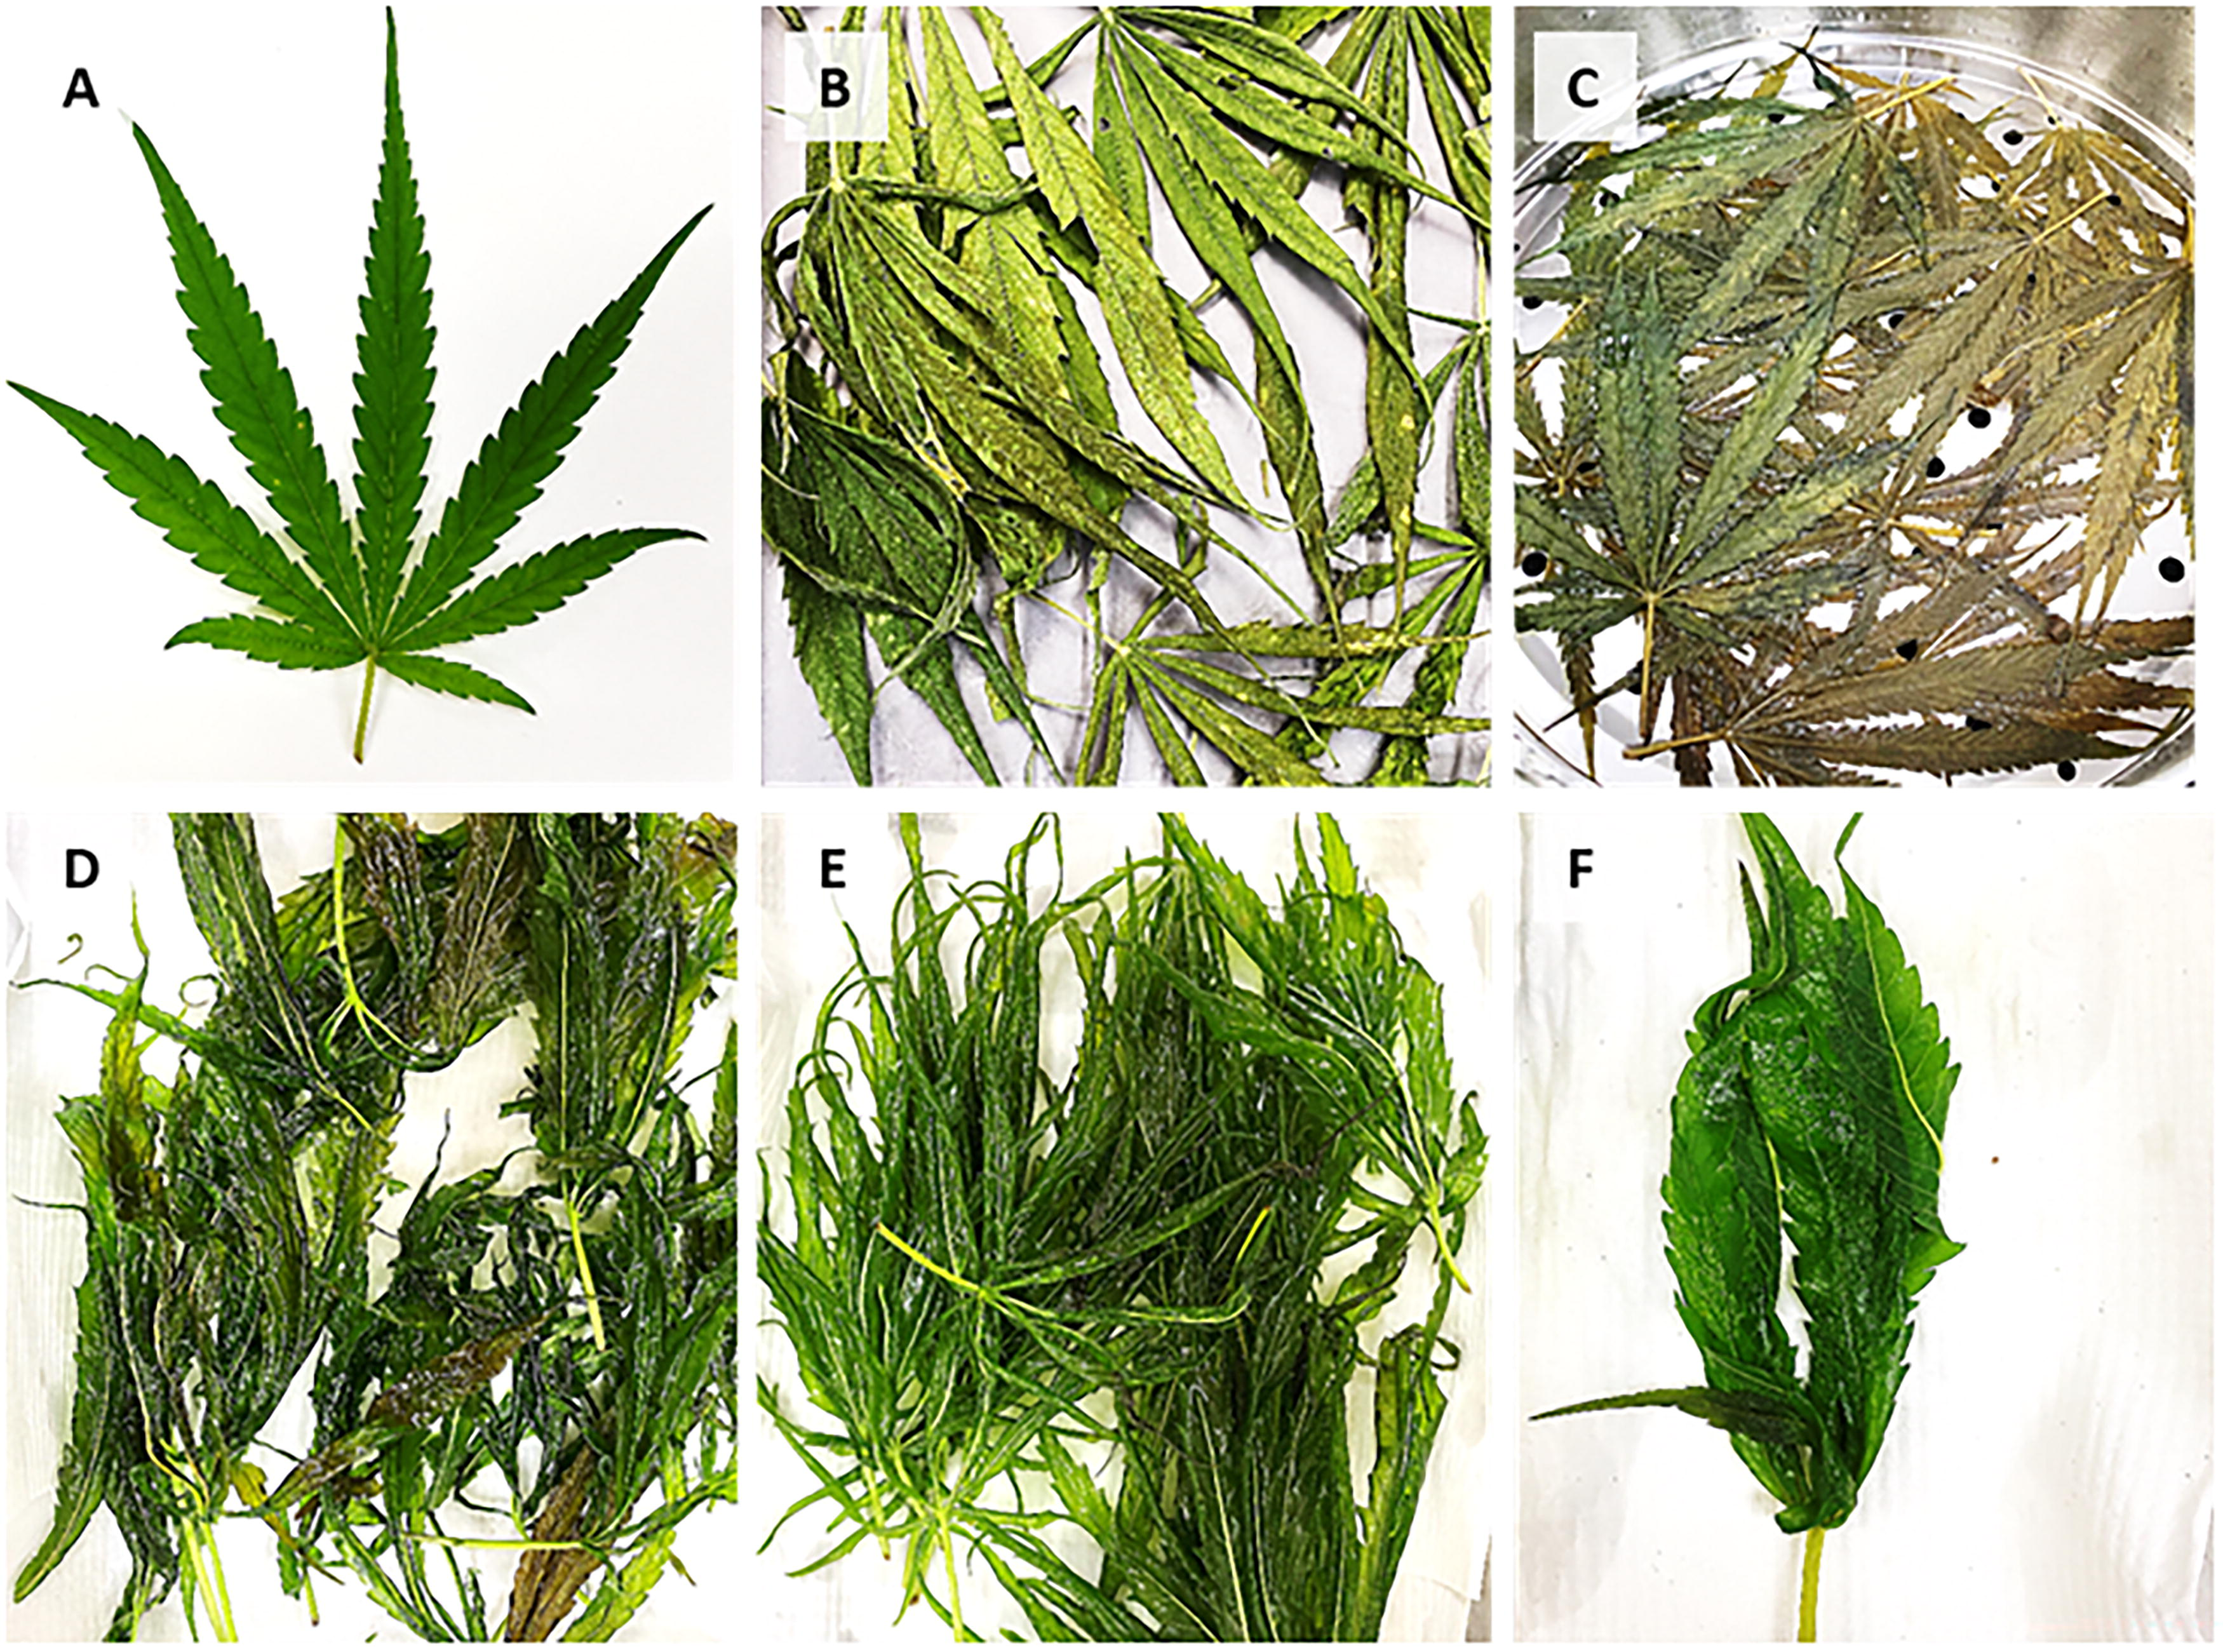
The appearance of Cannabis sativa from different cooking method
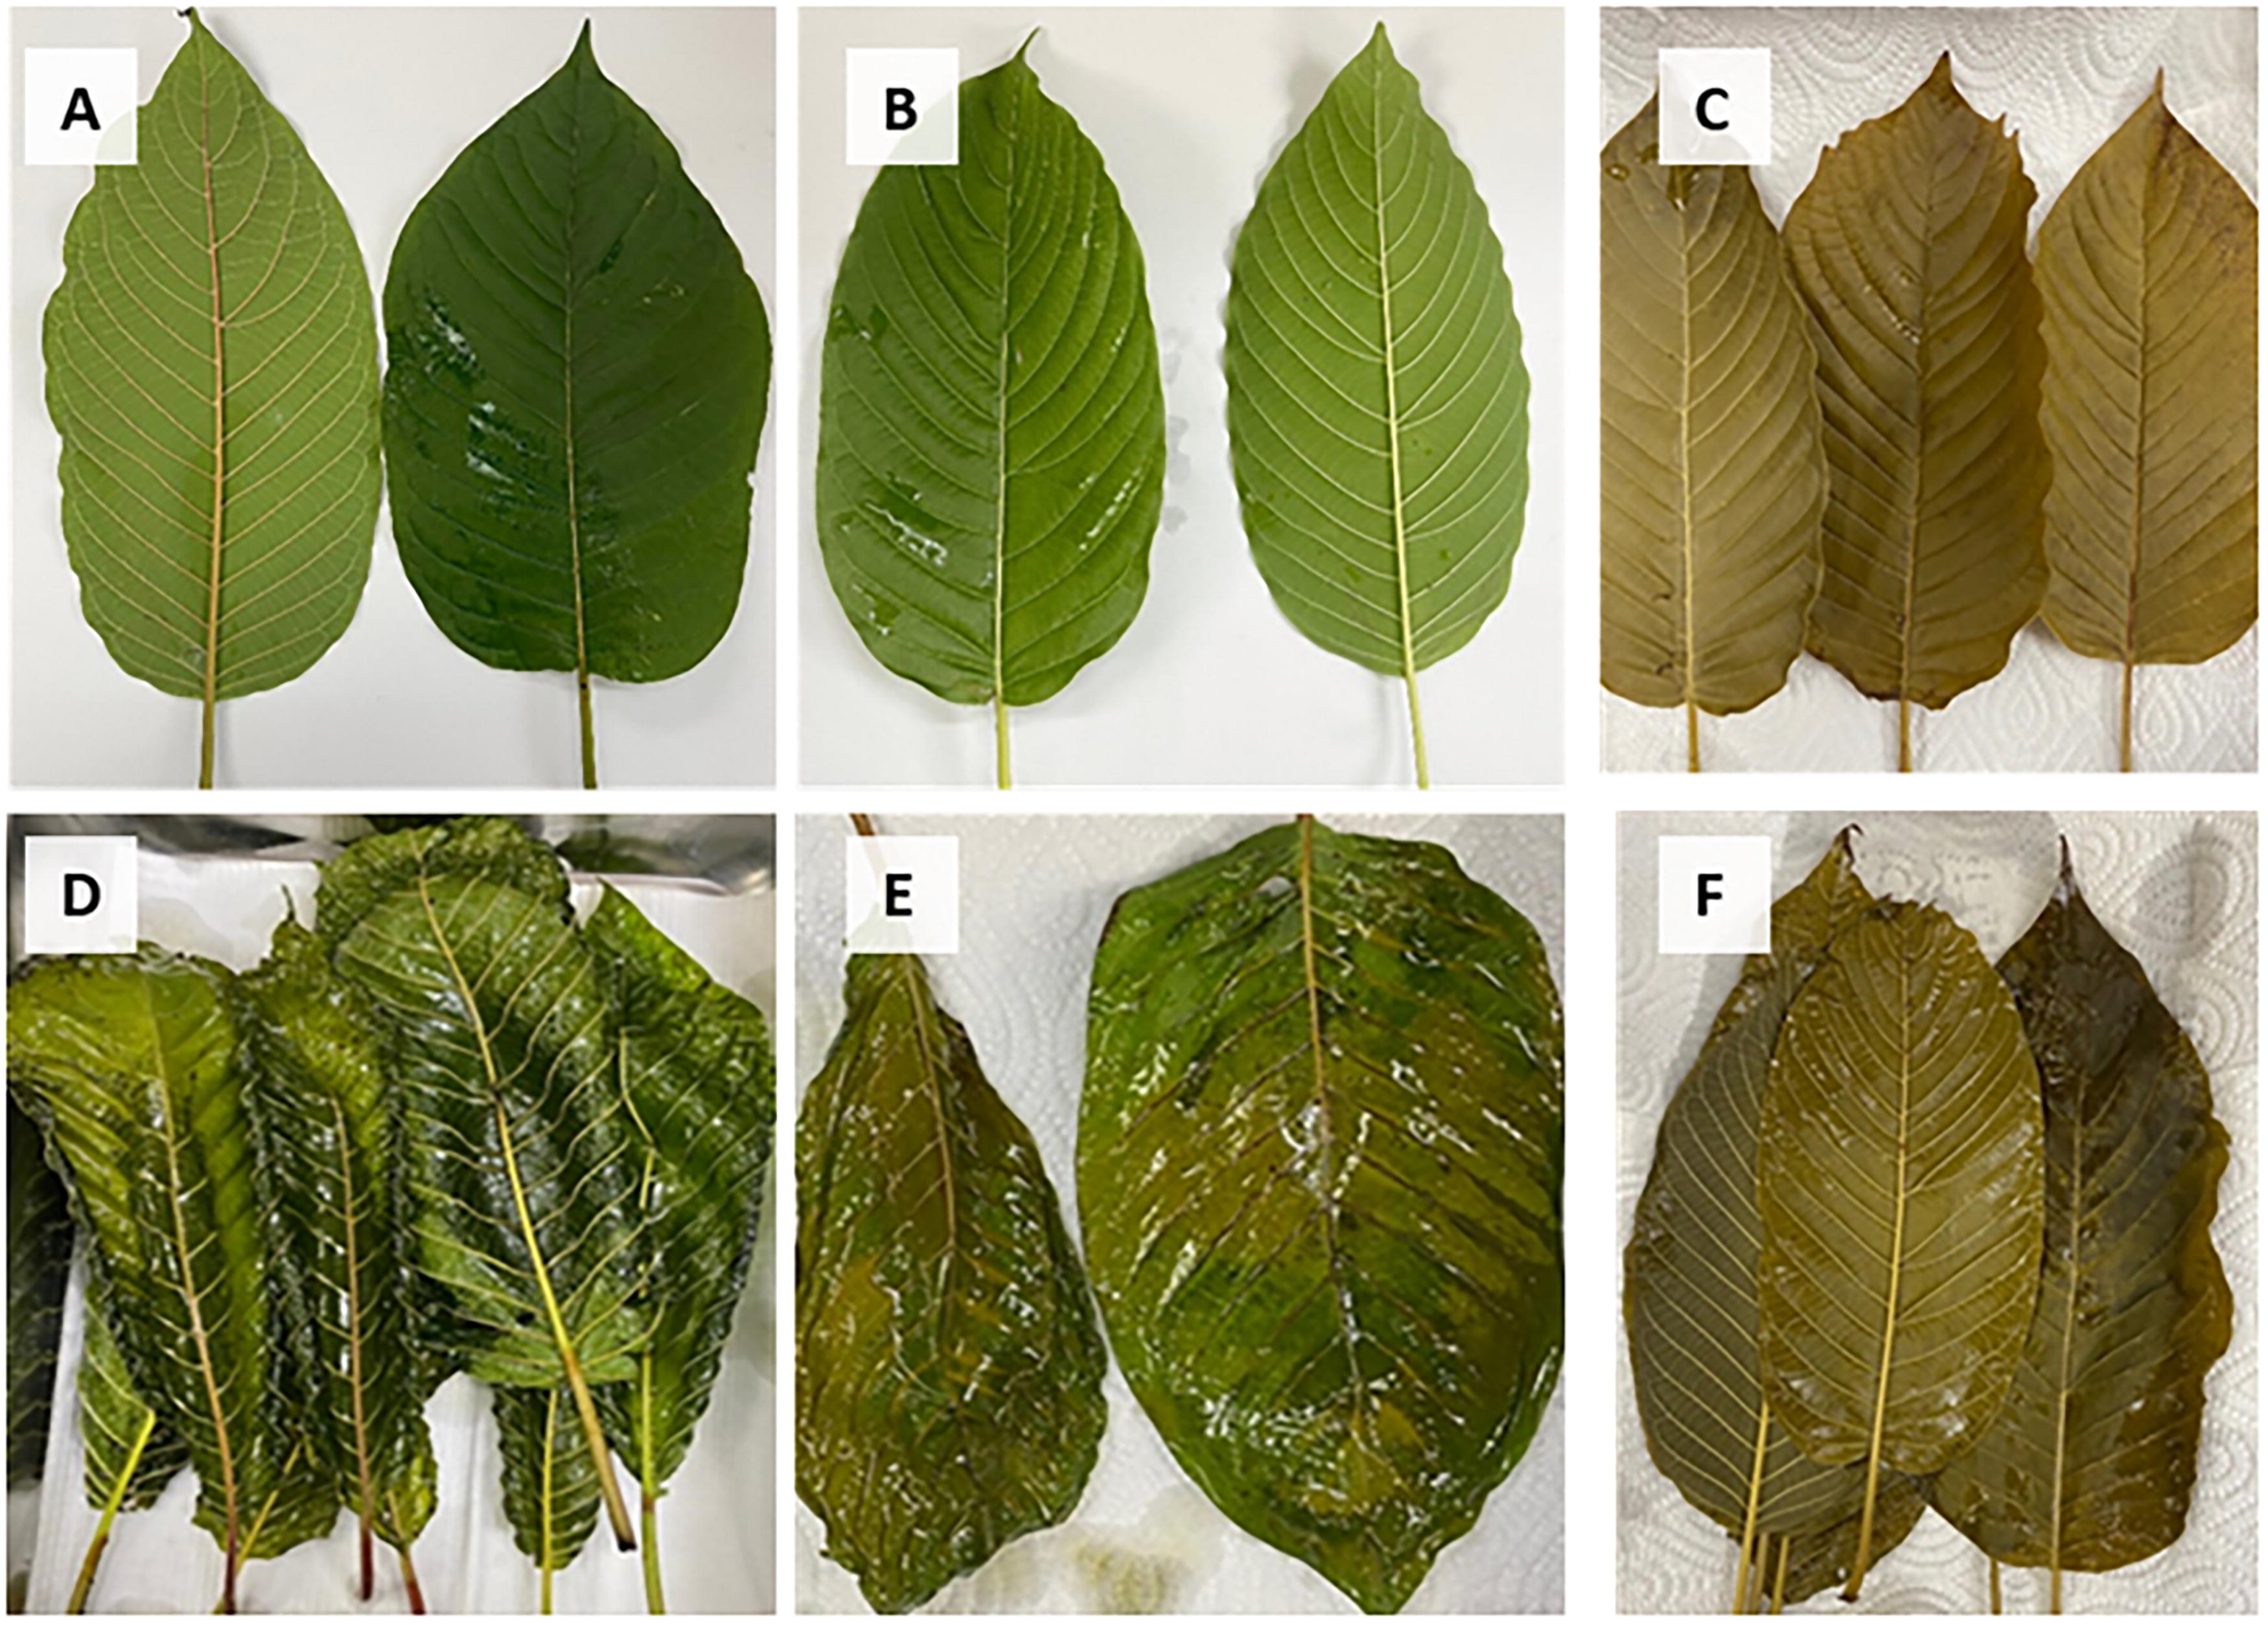
The appearance of Mitragyna speciosa (Kratom) from different cooking method
Cannabis butter recipe
To represent the use of cannabis extracts in some existing products, the experiment included an analysis of brownies and cannabis butter. For cannabis butter, decarboxylation of mashed fresh leaves was performed in the oven at 120°C for 1.5 h. Then, 10 g of dried leaves were mixed with 230 g of unsalted butter and cooked above boiling water for 4 h.
Brownie recipe and procedure of baking
For brownie preparation, the following ingredients were used: 83.5 g of chocolate, 50 g of cannabis butter, 20 g of flour, 50 g of sugar, 1 egg, and 1/3 of a packet of vanilla sugar. The cooking process of brownies involved melting all ingredients and mixing them until smooth, then baking at 180°C for 15 min. The brownies were decorated with cannabis leaves at the end of the process to be similar to the commercial one.
Nutritional composition
The nutrition compositions were analyzed according to the AOAC (2019) method, including the carbohydrate, protein (991.20), fat (922.06), ash (930.30), moisture content (925.45), and fatty acid profile (963.22, 969.33). The sample was sent to the Institute of Nutrition laboratory services for analysis.
Extraction and analysis of CBD and THC
Cannabinoids were extracted according to Roth et al. 11 A sample weighing 10 mg of ground plant/brownie/CBD butter was combined with 1 mL of 80% methanol. Using the horizontal inversion (DLAB SK L330 Pro) at 330 RPM for 30 min, the mixture was homogenized. After homogenization, the mixture was centrifuged (Hettich Rotina 38R centrifuge) for 5 min at 4600 RPM at 25°C. Then, the supernatant was collected, and 1 mL of 80% methanol was added to the solution, which was then vortexed with Daihan Scientific VM-10 for 30 sec. The extraction was performed twice. The supernatant was collected, and the final extracts were stored at −20°C in a freezer until further use. Cannabinoids were analyzed according to Roth et al. 11 and McRae and Melanson. 12 Beforehand, standards corresponding to cannabidiol (CBD), Δ9-tetrahydrocannabinol (Δ9-THC), Δ8-tetrahydrocannabinol (Δ8-THC), and Δ9-tetrahydrocannabinolic acid A (THC-A) were prepared. The standards and samples were filtrated using a nylon filter (0.22 μm) and placed in an amber spot glass. The UHPLC-MS/MS system consisted of a Diomex Ultimate 3000 series UHPLC (Thermo Scientific) coupled to a mass spectrophotometer TSQ Quantis Triple quadrupole (Thermo Scientific). UHPLC-MS/MS data were processed using Thermo Scientific™ Dionex™ Chromeleon™ 7.2 Chromatography Data System software. UHPLC separation for cannabinoids was optimized using an Accurore RP-MS column (100 × 2.1 particle size 2.6 μm) in the gradient mode of mobile phase A, consisting of 0.1% formic acid in acetonitrile, and mobile phase B consisting of 0.1% of formic acid in water, at a flow rate of 0.3 mL/min. The gradient flow started from 50% A, up to 80% in 10 min, then held at 95% for 6 min and lowered the volume of A to 50% until 23 min. The column temperature was 30°C. The injection volume was 5 μL. The MS/MS condition was applied with ESI-positive and negative mode. Spray voltage was 4000 V with the gas flow 30 and 10 for sheath and aux gas, respectively. The specific m/z were 315.3/193.197,259.238 for CBD, Δ8-THC, Δ9-THC, and 357.2/313.28, 245.137 for THCA. The chromatogram of mixed standards is presented in Supplementary Figure S1. The limit of detection (LOD) was 0.067 μg/mL for CBD and Δ9-THC, 0.036 μg/mL for Δ8-THC, and THCA-A had an LOD of about 0.65 μg/mL.
Extraction and analysis of mitragynine and 7-OH mitragynine
Mitragynine was extracted and analyzed according to Mudge et al. 13 5 mL of 0.5M acetic acid in 70% methanol was added to 30 mg of ground plant in a 50 mL centrifuge tube. The mixture was homogenized (DLAB SK L330 Pro). After 30 min, the mixture was centrifuged (Hettich Rotina 38R centrifuge) for 5 min at 4600 RPM at 25°C. The supernatant was collected, and 5 mL of acetic acid was added to the solution, vortexed with Daihan Scientific VM-10 for 30 sec, then shaken and centrifuged again. The supernatant was collected, and the final extracts were stored at −20°C in a freezer prior to analysis. 14 UHPLC separation for mitragynine was optimized using a Vertisep pH endure column C18 (100 × 2.1 particle size 2.5 μm) at 35°C, with mobile phase A consisting of acetonitrile and mobile phase B consisting of 0.1% of formic acid in water, with a consistent flow rate of 0.2 mL/min. Gradient mode was adapted, which started from 5% of mobile phase A for 2 min, and increased to 90% at 4–6 min, then the ratio of A was lowered to 50% and held for 2 min, and the final ratio was down to 10% A for 2 min. The injection volume was 5 μL. The UHPLC-MS/MS system consisted of a Diomex Ultimate 3000 series UHPLC (Thermo Scientific) coupled to a mass spectrophotometer TSQ Quantis Triple quadrupole (Thermo Scientific). The specific m/z were 399.429/174.042,226.125 for mitragynine and 415.343/190.042,397.125 for 7-OH-mitragynine. The MS/MS condition was ESI-positive mode with 3500 V spray voltage at 25 sheath and 5 aux gas flow. The chromatogram of mixed standards is presented in Supplementary Figure S2. The LOD was 0.01 μg/mL for both derivatives.
Total phenolic analysis
The sample was mixed with water (1:10 or 1:100), and 25 μL of inhibitors (gallic acid or sample) was added to the cell of the microplate. Next, 50 μL of Folin-Ciocalteu (10%, v/v) reagent was added to each cell, except the columns for the blank, for which distilled water was added. Finally, after 5 min, 200 μL of sodium carbonate, Na2CO3 (7.5%, w/v), was added, and the cell samples were set aside for 2 h in a dark at room temperature. The absorbance of each sample was measured utilizing a UV-spectrophotometer (SpectraMax Plus 384 Microplate Reader Molecular Devices) at 765 nm against a blank. 15
Statistical analysis
All the values shown are the mean averages of triplicate determinations. Data is reported as the mean and standard deviation of the mean (mean ± SD). The data was analyzed using GraphPad Prism version 5.01 (GraphPad Software, CA, USA).
Results and Discussion
Proximate analysis of cannabis (leaves and flowers) and kratom leaves
Fresh cannabis flowers contain 8 g/100 g, while the fresh leaves contain approximately 6 g/100 g of protein, which is similar to red vein and green vein kratom. There is a limited amount of proximate composition information on cannabis available due to the current illegal status of cannabis. A study of dried C. sativa leaves found 6 g/100 g of crude protein, which is similar to this study. 16 However, a higher content of protein (23 g/100 g) was found in C. sativa leaves grown in Nigeria. 17 In comparison to different edible parts, cannabis flower has the highest fat content (6 g), while its leaves and kratom leaves contain less than 1 g of fat (Table 1). It can be seen that different strains of cannabis plants can contain greatly varying quantities of phytonutrients. In addition, there are vast compositional differences among both plants and locations where the samples were taken.
Proximate Analysis of Fresh Cannabis and Kratom
Values are mean ± SD (n = 3).
Fatty acid profile of cannabis (leaves and flowers) and kratom leaves
Most of the fatty acid profiles studied were of C. sativa seed oil and hemp seed oil, while none of the analysis was conducted on C. sativa flowers and leaves. This could be due to the limited usage of its flowers and leaves. Since the leaves are highly utilized in Southeast Asia as a food ingredient, the fatty acid profile of these samples was analyzed (Table 2). Linoleic acid is the major fatty acid (2.4 g) found in cannabis flowers, followed by linoleic acid (1 g) and oleic acid (0.67 g), while linoleic acid and palmitic acid are the major fatty acids in cannabis leaves. Fresh cannabis flowers contain omega 6 (2.4%) and omega 3 fatty acids (1%). Compared to hemp oil, which typically contains 50–70% linoleic acid (omega 6) and 15–25% alpha-linolenic acid (omega 3), the nutritional perspective using oil extracted from C. sativa would be better compared to its fresh flowers and leaves for the same amount. Adding C. sativa leaves to the menu/product contributes to omega 3 and 6 intake. The fatty acid content of kratom leaves was approximately 0.28% palmitic acid, 0.13% linoleic acid, and 0.1% linolenic acid. Kratom fatty acid profiles of both red vein and green vein were not different in terms of fatty acid types and amounts.
Fatty Acid Profile of Fresh Cannabis and Kratom
Values are mean (n = 2).
N.A. (not detected).
Total phenolic content in cannabis and kratom
The phenolic content under all cooking conditions was determined, including fresh and dried leaves. Significant changes were observed with increasing time and temperature on the total phenolic content (TPC) (Fig. 3). There was no discernible difference between the content of phenolic compounds in methanol extracts from M. speciosa 1 and 2, ranging from (0.38 ± 0.04 mg GAE/g FW) to (6.80 ± 0.79 mg GAE/g FW) and from (0.52 ± 0.08 mg GAE/g FW) to (6.75 ± 0.26 mg GAE/g FW), respectively. Overall, the results from both plants are similar. The phenolic content of both plants was found to be highest in the dry extract, while the smallest amount of phenolic content was found in boiling for 2 h for red vein kratom and green vein kratom. Only time affected the TPC when steaming and boiling. As shown in Figure 1, the phenolic content in water (boiling and steaming) decreased with increasing time. After 5 min of boiling, the leaves (K1: 1.02 ± 0.01 mg GAE/g FW; K2: 1.39 ± 0.19 mg GAE/g FW), steamed for 20 min (K1: 2.11 ± 0.57 mg GAE/g FW; K2: 2.20 ± 0.05 mg GAE/g FW) to boiling for 2 h (K1: 0.38 ± 0.04 mg GAE/g FW; K2: 0.52 ± 0.08 mg GAE/g FW) and steamed for 4 h (K1: 2.12 ± 0.15 mg GAE/g FW; K2: 1.68 ± 0;02 mg GAE/g FW). There was a considerable decrease in TPC. This could be explained by the gradual dissolution of phenolic compounds in the cooking water over time. 18 Nevertheless, the TPC was higher with the steaming method than with the boiling method because the leaves are not in direct contact with water. This decrease is explained by the gradual solubilization of insoluble phenolic molecules. Meanwhile, stir-frying and deep-frying significantly affected the TPC. Phenolic compounds are very sensitive to heat treatment, even in a short period of cooking. With deep-frying, TPC decreased with increasing temperature and decreasing time. Meanwhile, with stir-frying, TPC increased with temperature and also with time. The findings suggest that the total polyphenol content was influenced by the presence of antioxidants in the oils. In addition, TPC rising with temperature may indicate that oil-insoluble chemicals are liberated from leaves during cooking. Similar results were observed in the kratom leaves; the phenolic content was found to be highest in the dry extract (0.51 ± 0.02 mg GAE/g FW) and lowest in boiling for 1 hour (0.05 ± 0.00 mg GAE/g FW). The proportion of phenolic compounds in C. sativa is nevertheless highly variable compared with M. speciosa. The order of methods in terms of highest TPC is dry, stir-frying, deep-frying, fresh, steaming, and boiling. Total phenolic content in water (boiling and steaming) decreased with increasing time. The TPC of cannabis cooked in water at various temperatures showed substantial variations, ranging from 0.18 ± 0.01 mg GAE/g FW for steaming at 100°C and reduced by half to 0.06 ± 0.02 mg GAE/g FW for boiling at 100°C. The increase in cooking temperature increased the TPC of cannabis, likely by allowing bound phenolic compounds to be released into the oil used for cooking. The total phenolic content of M. speciosa and C. sativa was influenced by the cooking process. The increase or decrease varies according to the type of vegetable as well as the size, form, and thickness. Moreover, the difference in TPC between C. sativa and M. speciosa can be explained by the fact that heating does not affect the leaves to the same degree depending on the proportion of other compounds such as flavonoids and phenolic acid that are present in the leaves.
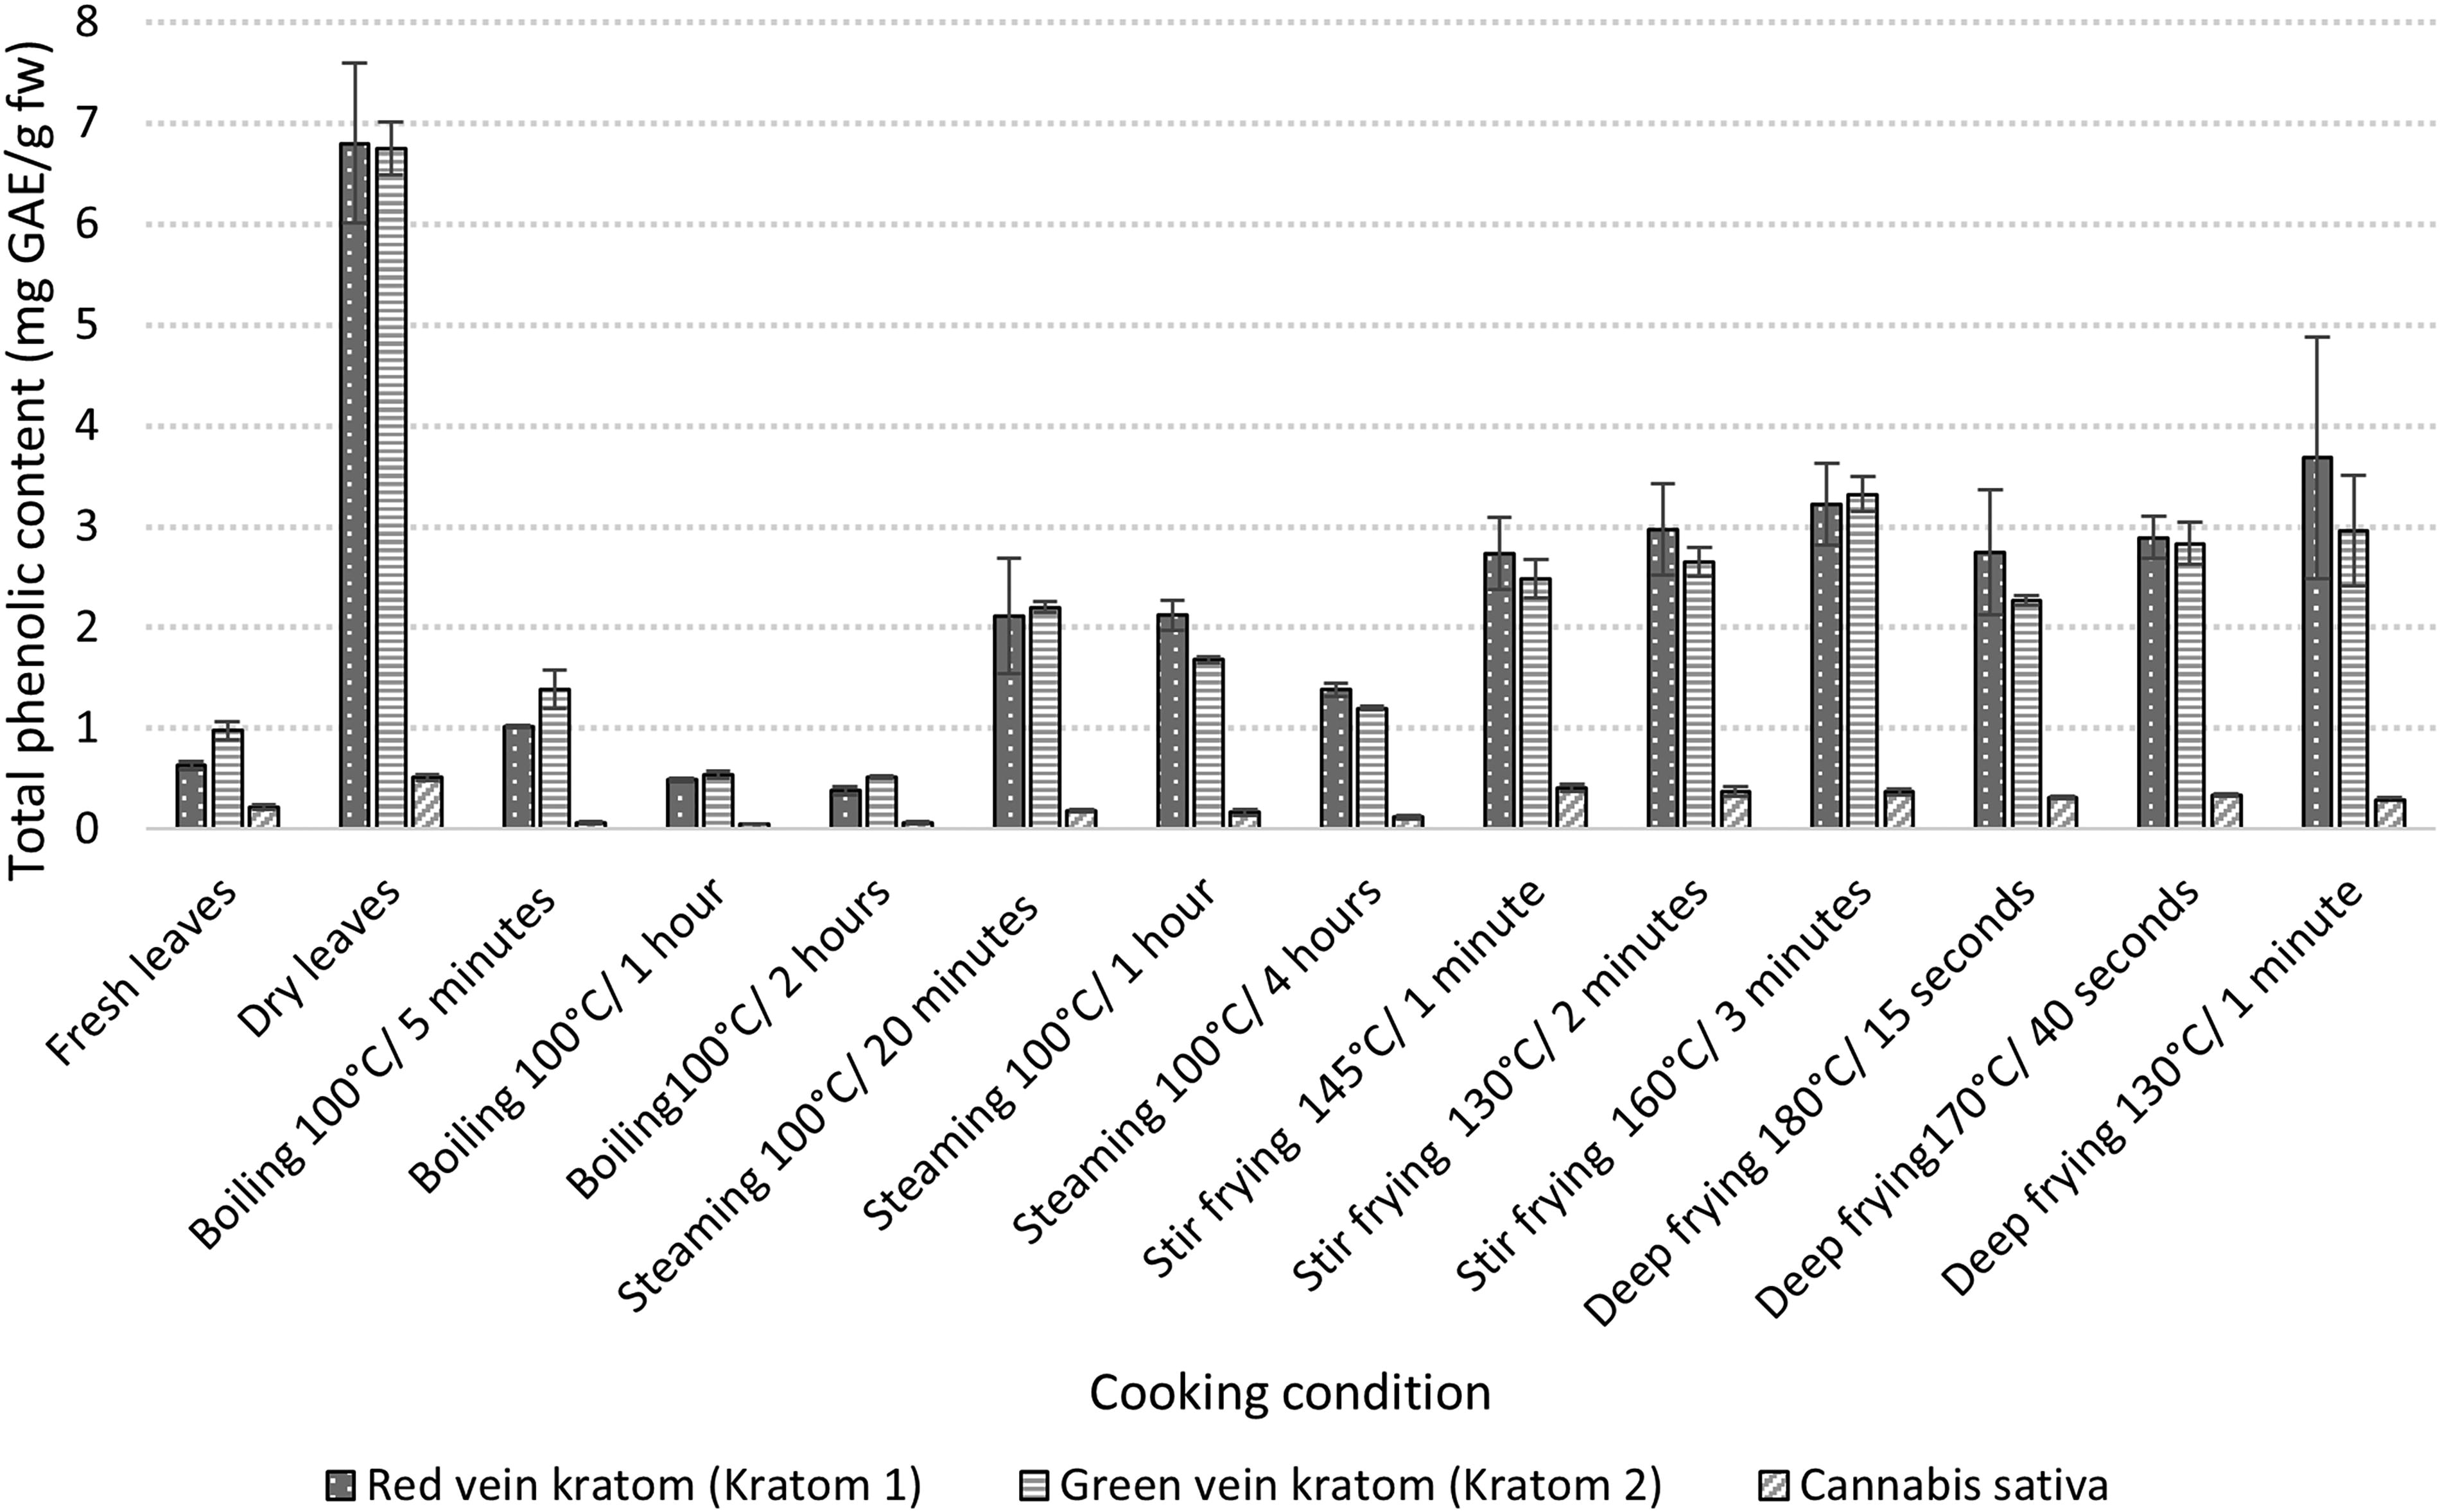
Total phenolic content in Cannabis and kratom leaves in different cooking condition.
Quantitative of psychoactive compounds, CBD, and THC derivatives (△8, △9 THC, and THCA) in cannabis and mitragynine in kratom
Mitragynine is the main psychoactive alkaloid in kratom leaves. The effect of kratom is dose-dependent in humans: at small doses, it produces “cocaine-like” stimulation, while larger dosages (10–25 mg) cause “morphine-like” sedative-narcotic effects.19,20 Fresh kratom leaves contain 0.40–0.59 mg/g FW mitragynine, with slightly higher amounts in red vein than in green vein (Table 3). In dried leaves, mitragynine levels increase twice as much compared to fresh weight due to the loss of moisture content. Clinical studies show that intake of up to a 50 mg oral dose of mitragynine produces motor excitement and loss of motor coordination. Therefore, from this study, 10–12 mg of mitragynine (considered to be a large dose) is equivalent to 10–25 fresh leaves. Hence, the consumption of a few leaves is unlikely to lead to fatal effects since mitragynine is able to bind to opioid receptors to exhibit the analgesic effect. 20
Mitragynine Content of Mitragyna speciosa (Red and Green Veins) in Different Cooking Condition
Values are mean ± SD (n = 3).
Superscript shown the significant difference between cooking condition (p < 0.05).
Values followed by different lowercase letters within the same column (or row) are significantly different at P < 0.05.
CBD and THC derivatives can be found in both fresh cannabis flowers and leaves. The cannabinoids content results are presented in Table 4. Fresh leaves contain approximately 0.01 mg/g FW of CBD, 0.01 mg/g FW of △9-THC, 0.02 mg/g FW of △8-THC, and 1.18 mg/g FW of THCA. Dried leaves contain 1.26 mg/g FW of THCA and 0.05 mg/g FW of CBD. An ingested dose of 5–20 mg of THC can cause impairment of attention, memory, executive functioning, and short-term memory, while the same dose in a pediatric case can produce more severe symptoms such as hypotension, panic, anxiety, myoclonic jerking, and respiratory depression. 21 Therefore, to avoid the lethal effects, the suggested amount of THC for adults was calculated to be less than 5 g for dried leaves and less than 100 fresh leaves, which is practical. There are slight variations in CBD and THC across different varieties. In addition, since CBD and THC are plant secondary metabolites, they can be affected by environmental factors such as climate and growing conditions.
Cannabinoids Content of Cannabis Sativa in Different Cooking Condition
Values are mean ± SD (n = 3).
Superscript shown the significant difference between cooking condition (p < 0.05).
N.A. (not detected), lower than limit of detection (LOD).
LOD of Δ8-THC is 0.036 µg/mL, THCA-A is 0.65 µg/mL.
Conversion rate = (initial THCA-A before cooking—THCA-A after cooking)/ initial THCA-A).
Values followed by different lowercase letters within the same column (or row) are significantly different at P < 0.05.
Effect of heat treatments on CBD, THC derivatives, and mitragynine derivatives
Cannabis is frequently used through the application of heat to decarboxylate THCA to THC, which is a more potent form. Regarding the cooking conditions, steaming produced the highest THC content, followed by boiling, stir-frying, and deep-frying. The degradation of THC by decarboxylation ranged in temperature from 110°C, 22 hence, steaming and boiling, which were processed at less than 110°C, resulted in more THC content being retained, while stir-frying and deep-frying temperatures exceeded 110°C, which resulted in a higher loss of THC. In addition, THC could leach out during deep-frying and stir-frying as it is fat-soluble. In contrast, THCA and CBD are more heat labile, and the maximum temperature was 120–125°C. Steaming at 100°C for 4 h resulted in the highest CBD content. Overall, the conversion rate of THCA to THC for each cooking method ranged from 0.97 to 0.11. The steaming method had the highest conversion rate of THCA to THC.
There was a varied degree of mitragynine reduction by different cooking methods, with most showing a 50% reduction after heat applications. Cooking with water as the medium retained more mitragynines compared to oil, as mitragynine is an alkaloid compound that does not dissolve well in water. The effect of cooking on mitragynine retention was as follows in ascending order: boiling, deep-frying, stir-frying, and steaming. The mitragynine content ranged from 0.29 ± 0.01 mg/g FW in the deep-frying method at 170°C for 40 sec to 1.01 ± 0.04 mg/g FW for the dried sample for red vein kratom. Deep-frying green vein kratom at 170°C for 40 sec retained the greatest mitragynine content (0.78 ± 0.10 mg/g FW), whereas deep-frying at 130°C for 1 min retained the lowest mitragynine content (0.26 ± 0.01 mg/g FW).
CBD and THC content in cannabis products (brownie and butter)
Cannabis butter contains 0.82 mg/g FW of Δ9-THC. The amount of dried cannabis leaves added to the butter was 10 g; therefore, Δ9-THC should be 3.86 mg/g in the butter. This indicates the 4-fold loss of Δ9-THC during the butter-making process. For brownies, Δ9-THC, CBD, and Δ8-THC were not significantly different between brownies with and without cannabis butter, except for the trace THCA that was present in brownies with cannabis butter.
Conclusion
The legalization of cannabis and kratom in Thailand is still a controversial subject due to the unknown side effects of these plants. Since the long-term consequences on health are undiscovered but edibles are currently sold in Thailand, the impacts of legalization are mostly economic in scale. Heat treatment on C. sativa and M. speciosa has a significant influence on the mitragynine, total phenolic, and cannabinoids content. The analysis of the total phenolic content of M. speciosa suggests that heat treatment does lower TPC with time by boiling, while the mitragynine content increases with time in water. In addition, TP content increases with temperature by stir-frying and decreases with temperature by increasing time with deep-frying. However, there was an effect of temperature on the TP content of C. sativa in oil, represented by an increase. This study demonstrated that the most abundant cannabinoids found are Δ9-THC, THCA-A, and CBD. THCA-A was present when decarboxylation did not occur, corresponding to cooking in oil, deep-frying, and stir-frying. Δ9-THC was found in higher proportions using the steaming and boiling methods, showing that decarboxylation had happened. Overall, there was no obvious correlation between the chosen temperatures and times under the experiment’s settings. It would have been necessary to extend the analysis and attempt other conditions. Both plants have a future in food because of their content of phenolic chemicals, which are known to be healthy.
Footnotes
Acknowledgment
The author would like to thank Institute of Nutrition, Mahidol University for providing funding for student internship.
Authors’ Contributions
W.S. and W.C.: Review and editing (equal). W.S.: Conceptualization (lead), writing—original draft (lead), formal analysis (lead), writing—review and editing (equal). J.C. and W.S.: Software (lead), writing—review and editing (equal). L.V. and W.C.: Methodology (lead), writing—review and editing (equal). W.C., J.C., and W.S.: Conceptualization (supporting), writing—original draft (supporting), writing—review and editing (equal).
Disclosures
No competing financial interest exist.
Funding Information
The project was partially supported by the program management unit for competitiveness (PMU-C) grant number C10F640252.