
Abstract
Background:
Phytocannabinoids naturally occur in the cannabis plant (Cannabis sativa), and Δ9-tetrahydrocannabinol (THC) and cannabidiol (CBD) predominate. There is a need for rapid inexpensive methods to quantify total THC (for statutory definition) and THC–CBD ratio (for classification into three chemotypes). This study explores the capabilities of a spectroscopic technique that combines ultraviolet-visible and fluorescence, absorbance-transmittance excitation emission matrix (A-TEEM).
Methods:
The A-TEEM technique classifies 49 dry flower extracts into three C. sativa chemotypes, and quantifies the total THC–CBD ratio, using validated gas chromatography (GC)-flame ionization (FID) and High-Performance Liquid Chromatography (HPLC) methods for reference. Multivariate methods used are principal components analysis for a chemotype classification, extreme gradient boost (XGB) discriminant analysis (DA) to classify unknown samples by chemotype, and XGB regression to quantify total THC and CBD content using GC-FID and HPLC data on the same samples.
Results:
The A-TEEM technique provides robust classification of C. sativa samples, predicting chemotype classification, defined by THC–CBD content, of unknown samples with 100% accuracy. In addition, A-TEEM can quantify total THC and CBD levels relevant to statutory determination, with limit of quantifications (LOQs) of 0.061% (THC) and 0.059% (CBD), and high cross-validation (>0.99) and prediction (>0.99), using a GC-FID method for reference data; and LOQs of 0.026% (THC) and 0.080% (CBD) with high cross-validation (>0.98) and prediction (>0.98), using an HPLC method for reference data. A-TEEM is highly predictive in separately quantifying acid and neutral forms of THC and CBD with HPLC reference data.
Conclusions:
The A-TEEM technique provides a sensitive method for the qualitative and quantitative characterization of the major cannabinoids in solution, with LOQs comparable with GC-FID and HPLC, and high values of cross-validation and prediction. As a spectroscopic technique, it is rapid, with data acquisition <45 sec per measurement; sample preparation is simple, requiring only solvent extraction. A-TEEM has the sensitivity to resolve and quantify cannabinoids in solution based on their unique spectral characteristics. Discrimination of legal and illegal chemotypes can be rapidly verified using XGB DA, and quantitation of statutory levels of total THC and total CBD comparable with GC-FID and HPLC can be obtained using XBD regression.
Introduction
Cannabis sativa is a dioecious plant that produces >500 compounds of varying medical importance. The therapeutic properties of cannabis are mainly attributed to cannabinoids, 1 which are mostly concentrated in the female inflorescence (buds) of this species. 2 Cannabinoids are terpenophenolic compounds unique to cannabis. 3 To date, 125 cannabinoids have been identified. 4
Δ 9 -Tetrahydrocannabinol (THC) and cannabidiol (CBD) are the most well-known cannabinoids for their therapeutic properties.5,6 THC has been approved by the Food and Drug Administration (FDA) for the control of nausea and vomiting associated with chemotherapy and for appetite stimulation of AIDS patients suffering from the wasting syndrome. The drug, however, shows other biological activities that lend themselves to possible therapeutic applications, such as in the treatment of glaucoma, 6 migraine headaches,7,8 spasticity, 9 anxiety, 10 and as an analgesic. 9 The second major phytocannabinoid, CBD, has attracted much attention for development as a medicine for several conditions.
CBD has long been known for its anticonvulsant activity 11 and more recently recognized as a treatment for epilepsy. 12 CBD was also reported to show neuroprotective activity,13–17 and has just been shown to prevent entry of live SARS-CoV-2 into cells. 18 Recently, the FDA has approved CBD as a treatment for two rare forms of childhood epilepsy namely Dravet syndrome and Lennox–Gastaut syndrome that are resistant to current drugs.19,20
Although many of the minor cannabinoids are of interest and commonly analyzed,4,21 cannabis is classified into three major chemotypes based on the ratio of only THC and CBD, as most recently recommended by the USP expect panel. 22 The three chemotypes are defined as (1) THC-dominant, (2) THC–CBD-intermediate, and (3) CBD-dominant. 22 THC-dominant chemotype consists of samples in which the ratio of total THC to total CBD is not less than (NLT) 5:1. In the THC–CBD-intermediate chemotype, the ratio of the total THC content to total CBD content is NLT 0.2:1 and not more than (NMT) 5:1. The ratio of the total THC content to total CBD content is NMT 0.2:1 for the CBD-dominant chemotype. 22
A variety of analytical techniques have been developed for the detection and quantification of cannabinoids and other compounds such as the terpenes in the cannabis plant. Most analytical methods for cannabinoids rely on highly specialized and expensive equipment,23,24 mainly based on liquid chromatography with tandem mass spectrometry (LC-MS/MS)25–28 and gas chromatography (GC),29,30 (although other methods are also available, such as electrochemical sensors 31 ), High-Performance Liquid Chromatography (HPLC) with photodiode array (PDA) detection, 32 high performance thin layer chromatography, 33 ultra-performance liquid chromatography, 32 and matrix-assisted laser desorption ionization mass spectrometry. 34
GC with flame ionization (GC/FID) or MS detection (GC/MS) is the most commonly used chromatographic methods in the analysis of cannabinoids.29,30,35–37 In GC/MS, a standardized electron ionization method is used to fragment the analytes permitting the use of compound libraries for compound identification.
Without derivatization, GC methods provide quantification of the total (the sum of the acidic and neutral) cannabinoids. 36 The acidic cannabinoids undergo decarboxylation directly after injection due to the high temperature at the injection port.36–38 Thus, acidic cannabinoids cannot be determined by GC unless they are derivatized before analysis. 35 Unlike GC, HPLC allows the differentiation between acidic and neutral cannabinoids 39 without derivatization before analysis.40,41
Therefore, HPLC provides a more comprehensive chemical report of cannabis samples compared with GC. Recently, a validated LC-MS/MS method for the quantification of 17 cannabinoids in cannabis and hemp has been reported with high sensitivity, specificity, accuracy, precision, and stability during analysis of cannabis and hemp samples and can be adapted to concentration ranges and additional matrices as required. 25
Cost is another point of comparison in evaluating methods. Set up, maintenance, and running costs are often considered in selecting analytical techniques, especially in industry settings. The running cost of GC, HPLC, and LC/MS can be quite high, given the expenses associated with the mobile phase, stationary phase, standards, and waste disposal fees. Moreover, these methods require highly trained personnel to perform accurate and reliable analyses and require high-level laboratory settings.
A variety of vibrational spectroscopic approaches, such as Raman, near infrared (NIR), and Fourier transform infrared (FT-IR), have been proposed to overcome the mentioned limitations of speed and expense of chromatographic measurements, but they present their own limitations, specifically specificity and sensitivity. 25 Fluorescence excitation emission matrix (EEM) spectroscopy has sensitivities comparable with chromatography, but its primary limitation has been a lack of specificity, in large part due to the inner filter effect (IFE), which distorts the measured fluorescence spectrum in a concentration-dependent manner, due to reabsorption that occurs at higher concentrations. 42
The standard IFE correction protocol uses concentration values from a separate ultraviolet-visible (UV/Vis) measurement to correct the fluorescence signal. Absorbance data recorded on a separate instrument provide an imperfect correction, with the result that an EEM for a single component is often not reproducible. 43 This has limited the utility of traditional fluorescence EEM spectroscopy for robust component identification and quantification.
A-TEEM™ 42 (absorbance, transmittance and fluorescence EEM), is a 2-in-1 technique that combines UV/Vis/NIR with fluorescence spectroscopy in the same instrument. The absorption spectrum used for IFE correction is collected at the same time on the same sample as the fluorescence measurement, resulting in a very reproducible correction. The A-TEEM technique can be used as a robust and extremely sensitive analytical technique, comprising the best attributes of both molecular spectroscopy (speed, low per measurement cost, laboratory-to-line placement) and chromatography (sensitivity and selectivity).
A-TEEM, therefore, has the potential to displace separations methods (HPLC, GC, LCMS, and GCMS) for certain analyses as a simpler and faster analytical tool, with significantly lower per-sample measurement costs. The specific applications where A-TEEM will provide the most benefit are yet to be determined, but its attributes point to many potential applications in food and natural products such as potency, authenticity, and detection of adulteration.
This study describes the development of an A-TEEM method for (1) rapid and robust classification of the three specific chemotypes of C. sativa already described; (2) robust quantification of the major cannabinoids relating to statutory levels 43 (<0.3% by dry weight of THC) of total THC and total CBD. The total THC and total CBD levels in the evaluated samples are determined with validated (GC/FID) 44 and (HPLC) 45 methods run on the same samples.
A-TEEM data with GC-FID reference data are used to verify chemotype classification and to create and test a multivariate regression model for quantification of major total THC and CBD levels. A-TEEM data with HPLC reference data are used to create and test a multivariate regression model for quantification of the individual neutral and acid (THC and THCA) forms, and neutral and acid (CBD and CBDA) forms. Total THC and total CBD quantification with HPLC are performed through the summation of the acid and neutral components (THC+THCA) and (CBD+CBDA).
Materials and Methods
Dry flower samples
C. sativa plants of the three major chemotypes (THC-dominant, THC–CBD intermediate, and CBD-dominant) were grown at the Marijuana garden, the University of Mississippi. The harvested flower buds were dried and ground before analysis. Dry flower samples from 49 separate plants (44 for calibration, 5 for validation) representative of the three chemotypes were prepared as extracts, for measurement with three different techniques: GC-FID, HPLC, and A-TEEM.
Cannabinoid standards and calibration curves
Standard solutions of pure THC, THCA, CBD, and CBDA were isolated in our laboratory 46 from plants grown in the medicinal plants garden, with purity of >95%. They were used to calibrate the HPLC and GC methods as previously described.44,45
GC-FID analysis
Dry flower materials (100 mg) were extracted by 3 mL of IS solution [1 mg/mL of 4-Androstene-3,17-dione in CH3OH–CHCl3 (9:1)] for 1 h followed by filtration (working solution for GC). Data were collected on 49 samples, all samples were analyzed using a Varian (Palo Alto, CA) 3380 GC equipped with a Varian CP-8400 automatic liquid sampler, dual capillary injectors, and dual flame ionization detectors (GC/FIDs).
The following instrument parameters were employed: air, 30 psi (300 mL/min); hydrogen, 30 psi (30 mL/min); column head pressure, 14 psi (1.0 mL/min); split flow rate, 100 mL/min; split ratio, 50:1; septum purge flow rate, 5 mL/min; makeup gas pressure, 20 psi (30 mL/min); injector temperature, 240°C; detector temperature, 270°C; oven program, 170°C (hold 1 min) to 250°C at 10°C/ min (hold 3 min); run time, 12 min; injection volume, 1 μL, the GC column was J&M Agilent (Santa Clara, CA) (15×0.25 mm DB-1, 0.25 μm). 44
HPLC analysis
Dry flower materials (1 g) were extracted with 10 mL of IS solution [1 mg/mL of 4-Androstene-3,17-dione in CH3OH–CHCl3 (9:1)] for 1 h followed by filtration then dilution of the extract (100 mg/mL) (3:1) by methanol (working solution for HPLC). Data were collected on 49 samples and HPLC analysis was performed on a Waters (Milford, MA) 2695 separations module (Empower 3 software) connected to a Waters 2996 PDA detector (190–500 nm). The HPLC column was Phenomenex (Torrance, CA), Luna C18(2) (150 mm×4.6 mm×3 μm), the mobile phase composed of ACN–H2O–formic acid 77:23:0.1. The detector is PDA at wavelength 220 nm, injection volume 10 μL, flow rate 1.2 mL/min, and the run time 20 min. 45
A-TEEM analysis
Dry flower materials (1 g) were prepared for A-TEEM analysis by extraction with 10 mL of CH3OH–CHCl3 (9:1) for 1 h followed by filtration then dilution of the extract (100 mg/mL) to 25 mg/mL with MeOH then further dilution to 0.083 mg/mL (working solution for A-TEEM). All samples were run using the A-TEEM technique on Aqualog-UV-800-C (HORIBA Scientific, Piscataway, NJ). Standards and extracts were measured in 3 mL of 1 cm quartz cuvettes with methanol as the blank at 20°C. The excitation/emission wavelength range was 220–800 nm/250–800 nm with 5 nm intervals and an integration time of 0.25 sec.
Correction for the solvent background, dark detector signals, Rayleigh and Raman scattering, normalization to water Raman scattering area, and inner-filter effects were automatically applied using HORIBA Aqualog v4.2 software. Extracts were prepared in quadruplicate and each sample measurement was repeated three times. For the calibration samples, there was one for which only one replicate per repeat was recorded, for a total of 517 files on 44 unique plant samples. For validation, five unique plant samples were prepared in quadruplicate, with each sample measurement repeated three times. The validation files omitted one sample repeat for a total of 59 files. Table 1 summarizes this information for the calibration and validation of A-TEEM data sets.
Summary of Experimental Design for Absorbance-Transmittance Excitation Emission Matrix Measurements
Calibration set contained 1 sample with only 1 replicate per repeat (total 517 files).
Validation set omitted one sample repeat due to data anomaly (total 59 files).
Data processing—multivariate analysis and linear regression
All multivariate analyses were performed with Eigenvector, Inc. (Wenatchee, WA) Solo v8.8. The A-TEEM analysis in Solo started with unfolding the EEM data into a two-way array for both principal components analysis (PCA) and extreme gradient boost (XGB) discrimination and regression; unfolded data were further preprocessed using automatic clutter removal, centering, and scaling. For regression analysis, the concentration data were mean centered. The validation (prediction) data included only unique samples and their A-TEEM replicates compared with the calibration data. Linear regression was subsequently performed on the combined calibration and validation data, using HORIBA Aqualog v4.2 software.
Classification is performed with two different techniques: (1) a PCA for a simple classification based on spectral variance and (2) XGB discriminant analysis to generate a method that can be used to classify unknown samples, with GC-FID results used as reference data. Two quantitative methods to determine total THC and total CBD using A-TEEM are developed, one with GC-FID reference data and the other with HPLC reference data. Both rely on XGB regression to establish the model. For the HPLC method, total THC and total CBD content are determined by adding the neutral and acid forms of each, respectively, as determined by HPLC.
Results and Discussion
GC-FID and HPLC results
Table 2 gives the cannabinoid concentration parameters measured by GC-FID for data, calibration, and validation combined, characterizing the three chemotypes: maximum and minimum CBD–THC ratios and the absolute maxima and minima for CBD and THC measured. The samples have typical ranges of THC–CBD ratios, 22 which tend to be well separated from the defined limits, in other words typical THC-dominant samples have a THC–CBD ratio of ≥20:1, even though a ratio of ≥5:1 is sufficient for classification.
Cannabidiol (CBD) and Tetrahydrocannabinol (THC) Concentrations as Determined with Gas Chromatography-Flame Ionization Method as Reference (Dry weight %), and the THC–CBD Concentration Ratios Defining the Class Groupings for THC-Dominant Chemotype, THC–CBD Intermediate Chemotype, and CBD-Dominant Chemotype
CBD, cannabidiol; THC, tetrahydrocannabinol.
Testing samples that are closer to the limit definitions is outside the scope of this article. Based on the previously reported GC/FID method, 44 the limit of detection (LOD) value for total THC/THCA and total CBD/CBDA is 0.01%, whereas their limit of quantification (LOQ) value is 0.025%. Based on the previously published HPLC method, 45 the LODs of the four tested cannabinoids are 0.037% (CBD), 0.010% (CBDA), 0.014% (THC), and 0.007% (THCA), whereas the LOQ values are 0.110% (CBD), 0.029% (CBDA), 0.041% (THC), and 0.020% (THCA).
A-TEEM for chemotype identification—qualitative discrimination
The first step to establish the capabilities of the A-TEEM method is to demonstrate that it can qualitatively distinguish the three C. sativa chemotypes based on relative THC–CBD content of dry flower extracts. Looking at representative data is a good starting point, and Figure 1 shows A-TEEM contours (A–C) and excitation (D) and emission (E) profile spectra of representative examples (same w:v extraction) for the three THC–CBD variety extracts designated as THC-dominant, THC–CBD-intermediate, and CBD-dominant from the GC-FID reference data, respectively.
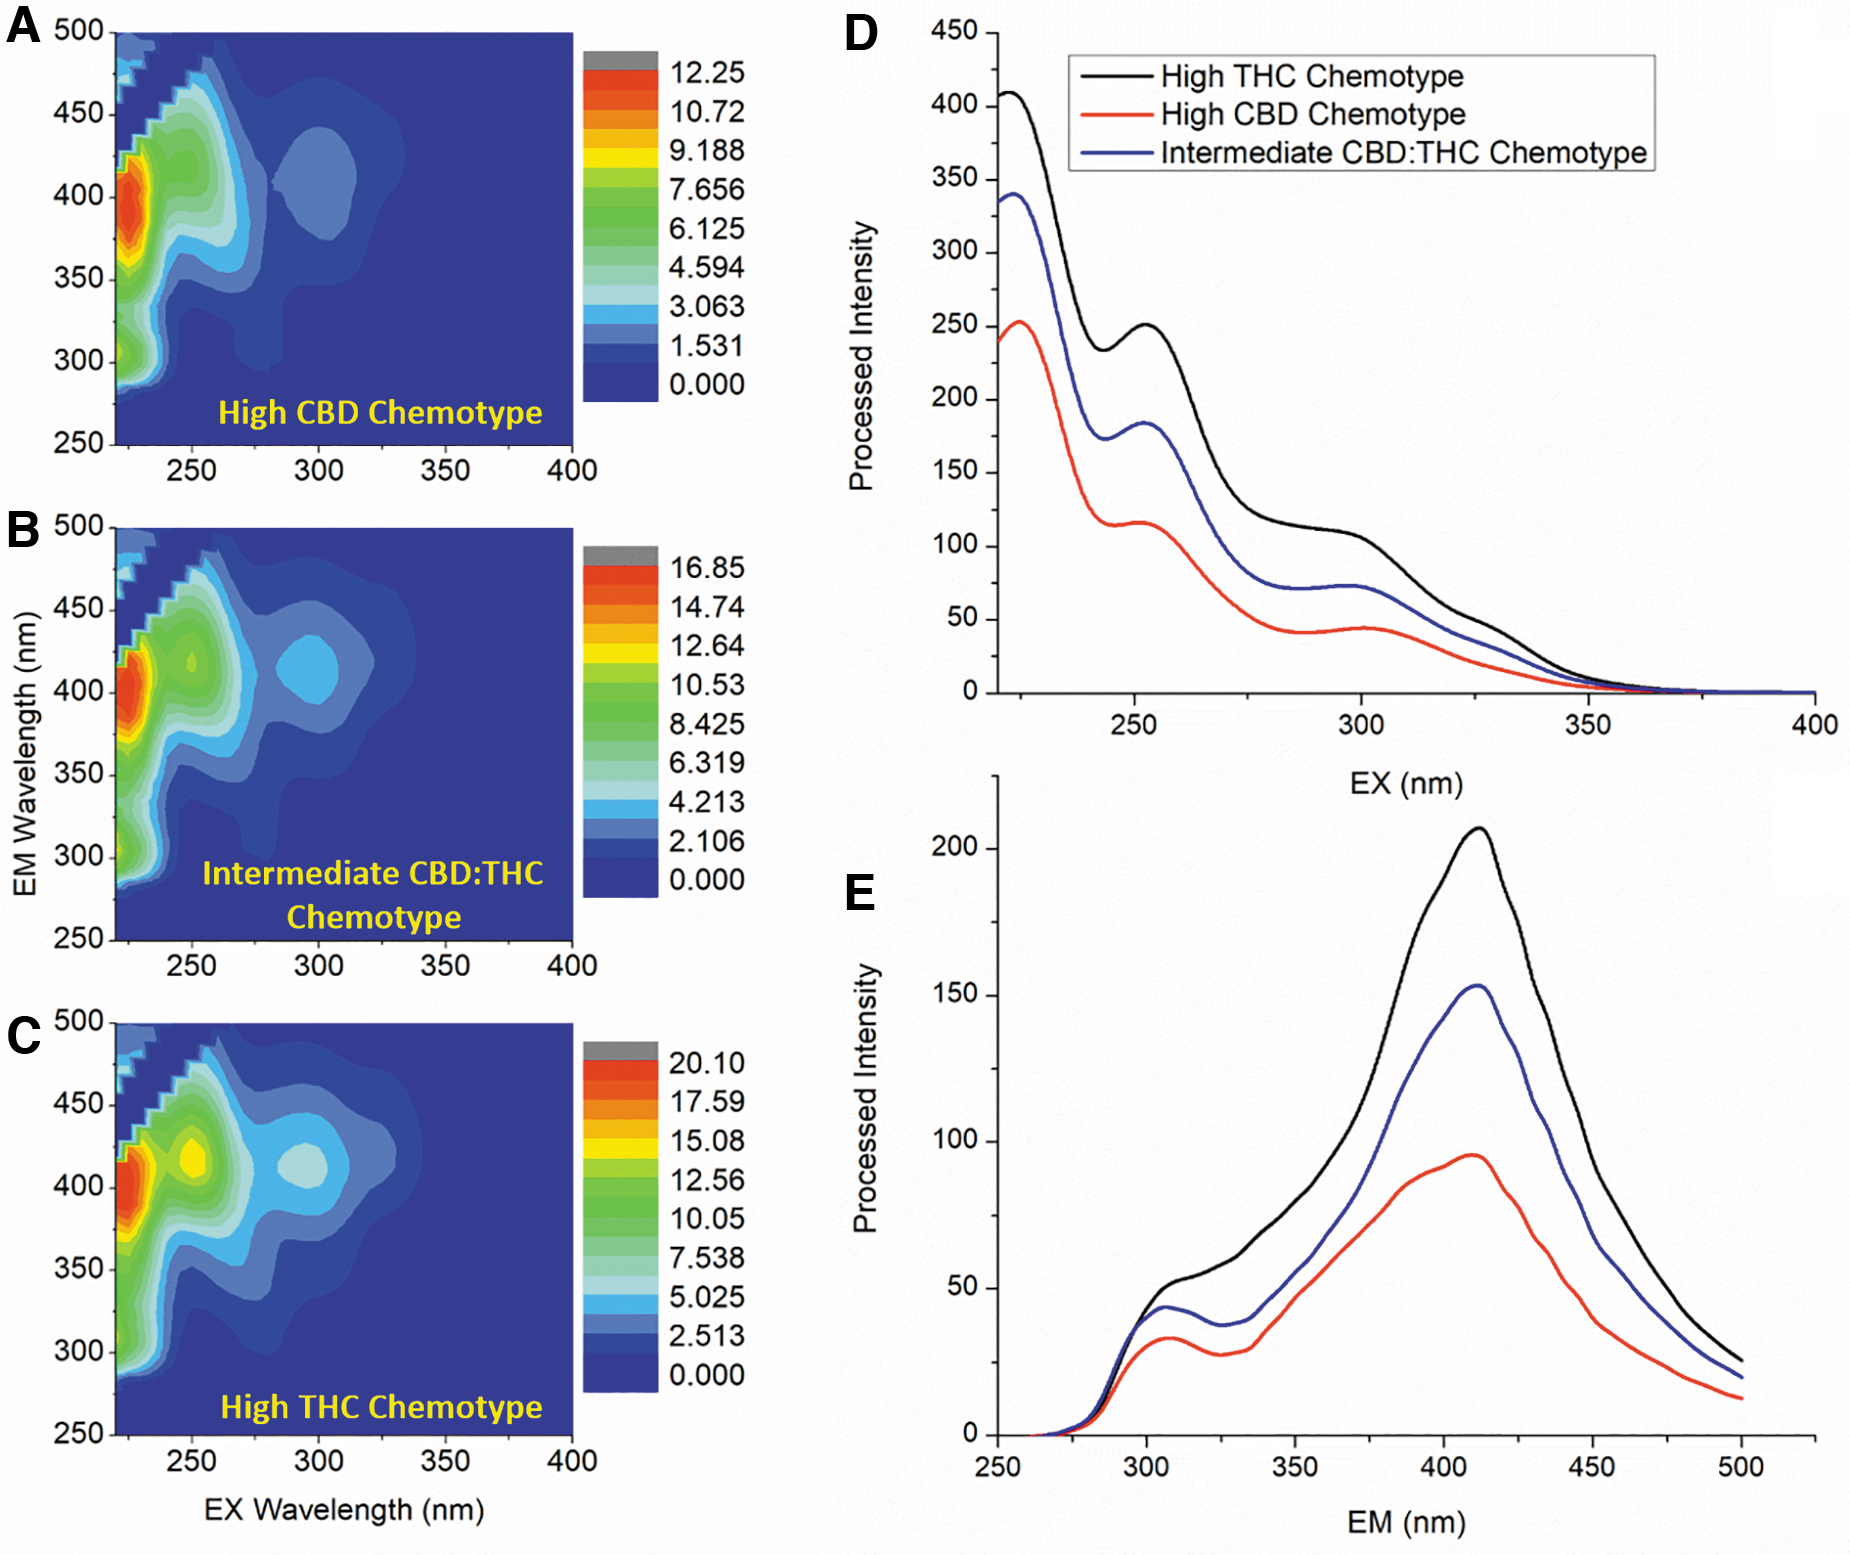
Peak-normalized A-TEEM contours
The A-TEEM contours are each scaled to the peak excitation–emission intensity (λex/λem=225/400 nm). THC levels increase from A to B to C, and there is a feature (λex/λem=250/420 nm) in the A-TEEM contour whose intensity increases similarly. The integrated excitation (D) and emission (E) profiles are unscaled, and also show systematic differences with increasing THC. Both excitation and emission profiles increase in intensity corresponding to increasing THC content from CBD-dominant to THC–CBD-intermediate to THC-dominant.
To classify the hundreds of measurements collected, multivariate methods are required to automate classifications, determine how well the discrimination is working, and to create models against which unknowns may be classified. Figure 2 shows how effectively a simple PCA separates the 556 calibration and validation A-TEEM data points from the 49 unique plants into 3 separate clusters. As a PCA is totally unsupervised, these clusters are based on spectral variance alone. The GC-FID data were used to assign each data point to a specific chemotype, and this confirms that that unique clusters correspond to unique chemotype.
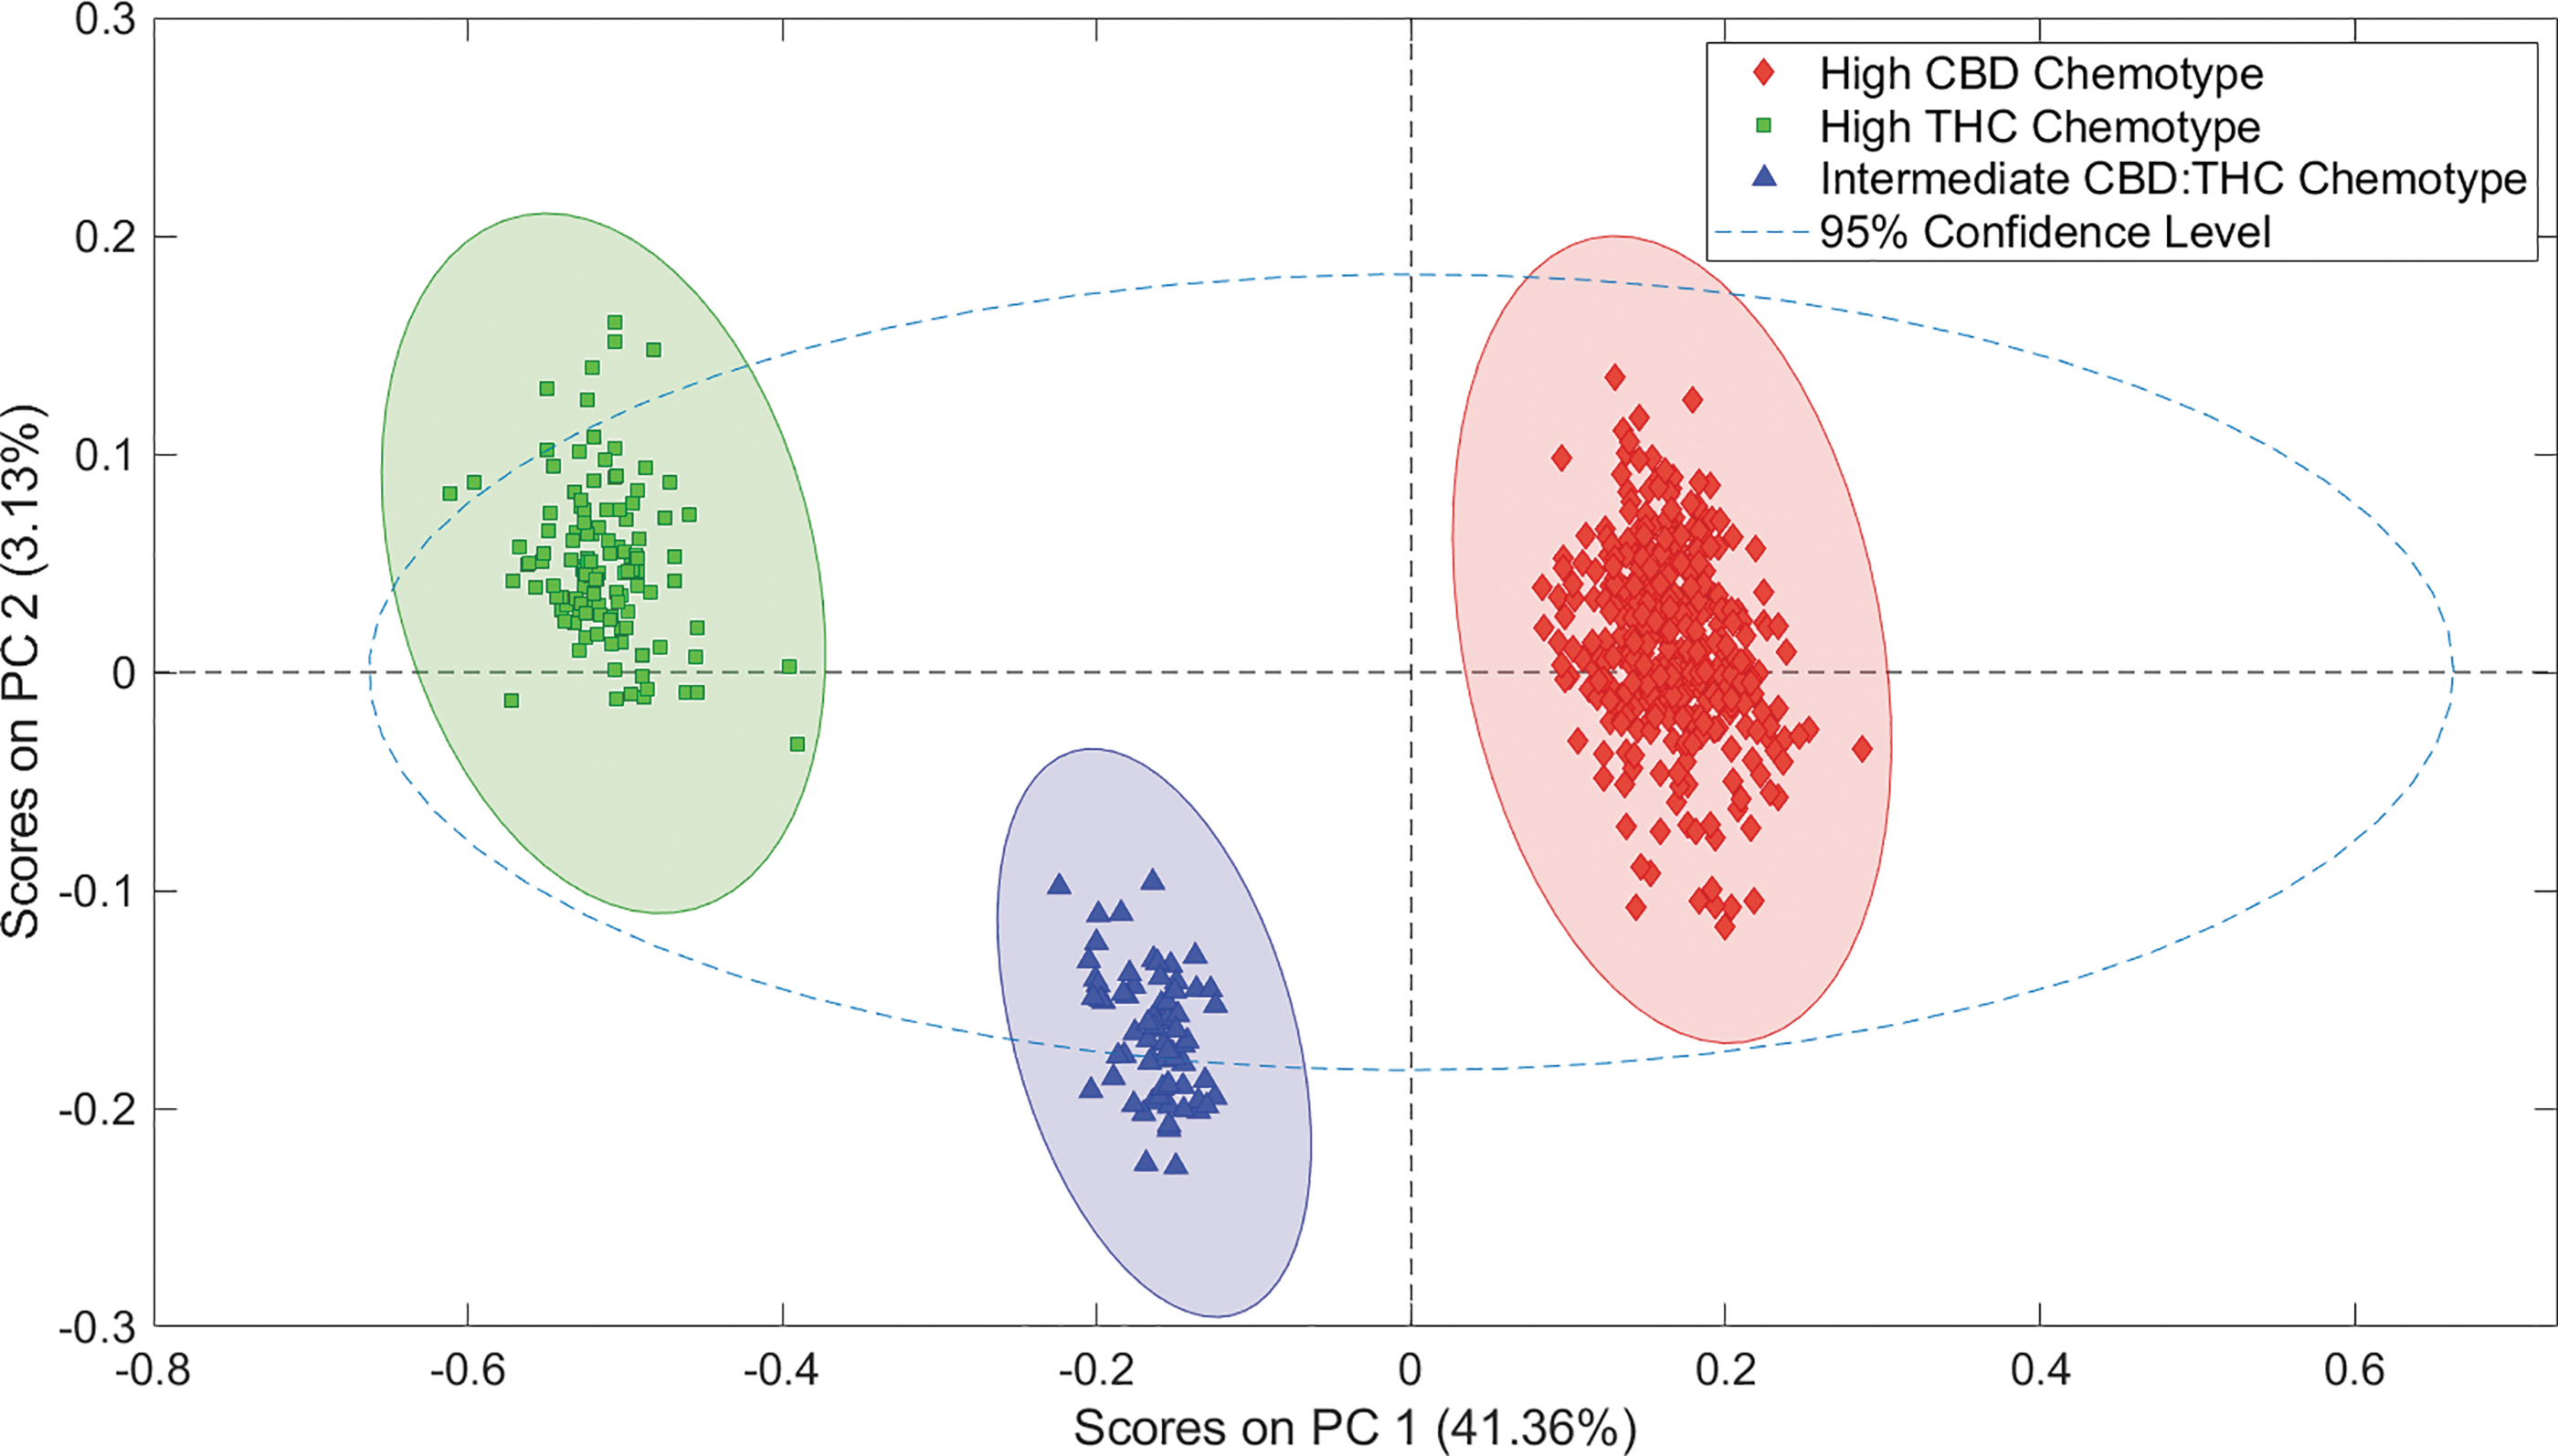
PCA of THC-dominant (HTHC), THC–CBD-intermediate (HCBDHYBRID), and CBD-dominant (HCBD) cannabis varieties. Represented in each 99% confidence level ellipse are all calibration and validation samples for each class group. PCA, principal components analysis.
The CBD-dominant and THC-dominant samples are differentiated by PC1, THC-dominant samples have negative PC1 scores, whereas CBD-dominant samples have positive PC1 scores. The THC–CBD-intermediate chemotype has intermediate PC1 scores, as would be anticipated, but are more similar to the CBD-dominant samples than the THC-dominant samples. The GC-FID classification results given in Table 2 show the same trend, that the TCH–CBD ratio for intermediate samples is closer to the CBD-dominant than to the THC-dominant ratio. There is no overlap between the chemotypes in this scatter plot, with >99% confidence, indicating that A-TEEM data are sensitive to the spectral differences between these samples.
To further evaluate the ability of A-TEEM to discriminate these three varieties, the calibration and validation data were evaluated using the extreme gradient boost discrimination analysis algorithm. In previous studies with wine and grape classification, the approach has been shown to yield accurate classification of wine varietals.47–49 The benefit of this approach is that a discriminant model can be used to classify unknown samples, in contrast to PCA that simply analyzes spectral variance.
Table 3A–C gives the confusion matrices for calibration, cross-validation, and prediction classifications using the “strict rule.” The cross-validation was performed using (k=10) Venetian blinds method described previously.47–49 The tables show that 100% of samples are classified correctly, there are no false positive or false negatives, all classifications are true positives and true negatives.
(A–C) Confusion Matrices Highlighting 100% Predictive Accuracy of Absorbance-Transmittance Excitation Emission Matrix Method (Using Gas Chromatography-Flame Ionization Reference Data) to Classify Samples into Three Cannabis Varieties: Tetrahydrocannabinol (THC)-Dominant Chemotype, THC–Cannabidiol (CBD) Intermediate Chemotype, and CBD-Dominant Chemotype
Results from XGBDA. Calibration (A), cross-validation (B), and prediction (C) all reflect 100% predictive accuracy.
XGBDA, extreme gradient boost discrimination analysis.
Quantification of total CBD and THC by A-TEEM regression calibration with GC-FID
The next test of the capabilities of A-TEEM is to evaluate its powers of quantitation. Regression models for A-TEEM data were created and evaluated for total CBD (combined acid and neutral forms: CBDA and CBD) and total THC (combined acid and neutral forms: THCA and THC) using GC-FID reference data, noting that GC-FID is unable to distinguish between the acid and neutral forms of CBD or THC for the underivatized samples used in this study. The regressions were performed using the XGB regression algorithm. The multivariate fit coefficient of determination (R2) for the actual calibration, cross-validation, and prediction data is given in Table 4. These values are all >0.99, showing that the model is performing reliably.
Results of Absorbance-Transmittance Excitation Emission Matrix Model for Total Cannabidiol and Total Tetrahydrocannabinol Quantification with Gas Chromatography-Flame Ionization Reference Data
Coefficients of determination (R2) for the XGB regression for total CBD and total THC measured by GC-FID for calibration, cross-validation, and prediction (validation) data. High values (>0.99) for all indicate the model is working well for the prediction of these components.
FID, flame ionization; XGB, extreme gradient boost.
Figure 3A and B shows the cross-validation data (open red circles) and validation data from five unique plants (solid black squares) with linear regression lines for total CBD and total THC, respectively. This includes all data in the calibration and prediction sets. As noted previously, the primary limitation of standard spectroscopic methods (FT-IR, Raman, and NIR) is that the LOD and LOQ are typically not sufficient to determine statutory levels of THC and CBD. An evaluation of the LOQ for A-TEEM can be calculated from the y-intercept and standard error of the y-intercept (SE) of the linear fit, if the slope of the regression is constrained to unity.
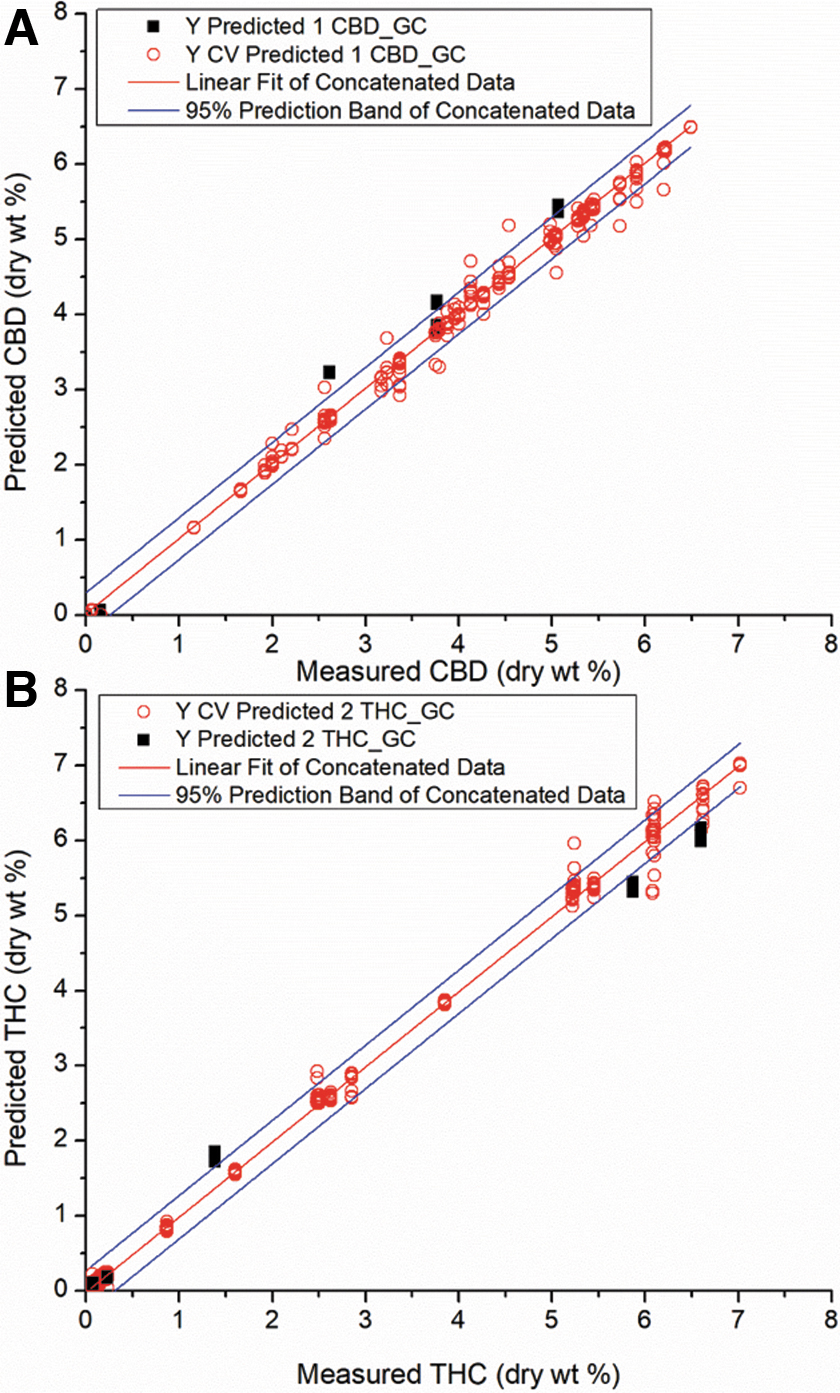
Concatenated XGB regression fits of cross-validated (open red) and validation (black) A-TEEM sample data for total CBD
Table 5 presents the regression fits for A-TEEM and GC-FID methods for both THC and CBD, including all calibration and validation data, along with the values determined using the GC_FID reference method. Using the following formula, LOD=3.3×SE, and LOQ=3.3×LOD, the predicted LODs by component for the A-TEEM models are 0.019% (CBD) and 0.020% (THC). The predicted LOQs by component for the A-TEEM models are 0.059% (CBD) and 0.061% (THC), sufficiently low for statutory purposes.
Linear Regression Statistics from Extreme Gradient Boost Model That Includes All 576 Prediction and Cross-Validation Data Points for Total Cannabidiol and Total Tetrahydrocannabinol Measured by Gas Chromatography-Flame Ionization
The slope for A-TEEM data was constrained to unity. Defined are the y-intercept (intercept), SE of the y-intercept (SE), LOD=3.3×SE, LOQ=3.3×LOD, the adjusted R2, and number of files (n) that combines calibration and validation.
A-TEEM, absorbance-transmittance excitation emission matrix; CBDA, cannbidiolic acid; GC, gas chromatography; LOD, limit of detection; LOQ, limit of quantification; NA, not applicable; SE, standard error; THCA, tetrahydrocannabinolic acid.
Quantification of CBD, CBDA, THC, and THCA by A-TEEM regression calibration with HPLC
As HPLC methods are commonly used for quantification of THC and CBD levels, it is important to establish an A-TEEM method using HPLC reference data as well. In addition, as individual THC, THCA, CBD, and CBDA components are resolvable by HPLC, an A-TEEM model for the quantification of these components can also be developed. In previous studies with wine and grape classification and phenolic compound quantification, the XGB regression algorithm has documented superior fit statistics compared with the partial least squares algorithm.47–49 An XGB regression model for A-TEEM was created with HPLC reference data, to quantify and predict individual acid and base THC and CBD compounds, as well as combined total THC and CBD levels important for statutory purposes.
Table 6 gives the multivariate coefficients of determination (R2) values for the calibration, cross-validation, and prediction data for the individual acid and neutral forms. Calibration values for all four components are >0.99, with cross-validation values all ≥0.99. For prediction, only one value was <0.99, specifically the R2 for CBD prediction was >0.98, still very high. These numbers indicate that the A-TEEM method for quantification of these components using HPLC reference data is highly predictive.
Results of Absorbance-Transmittance Excitation Emission Matrix Model for Cannabidiol, Cannabidiol Acid, Tetrahydrocannabinol, and Tetrahydrocannabinol Acid Quantification with High-Performance Liquid Chromatography Reference Data
Coefficients of determination (R2) for the XGB regression for calibration and cross-validation (n=517) and prediction (validation) (n=59). High values (>0.98) for all indicate the model is working well for the prediction of these components.
Figure 4A and B is the HPLC-based analogue to the GC-FID model results presented in Figure 3A and B, and, respectively, show the prediction and cross-validation results and linear fit of predicted versus measured data for total THC and CBD. These values are determined by adding results for the acid and neutral forms (THCA + THC) and (CBDA + CBD), in contrast to the GC-FID data where the totals were directly measured. Open red circles are the summed (acid and neutral) cross-validated values, and solid black squares are the summed (acid and neutral) validation values from five unique plants.
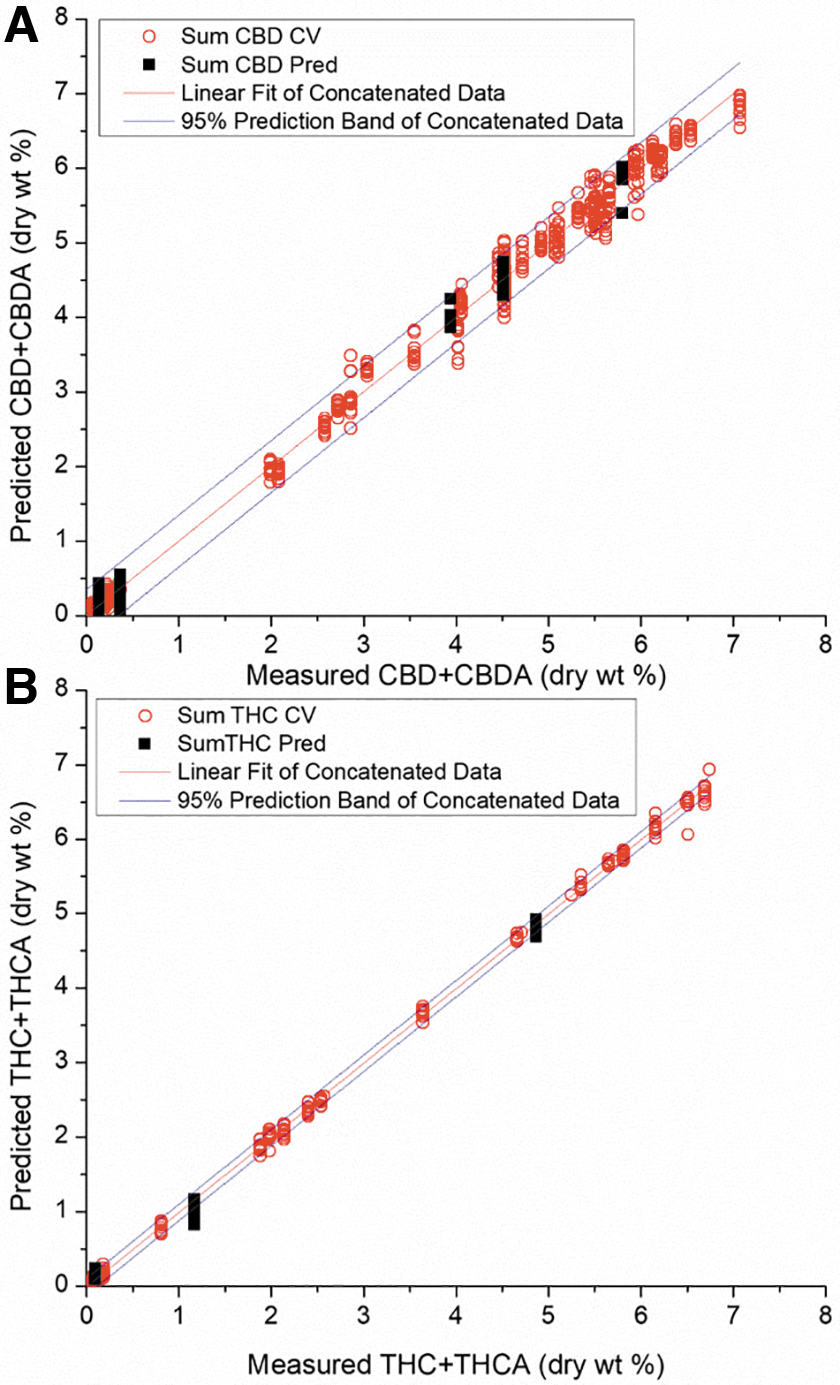
Concatenated XGB regression fits of cross-validated (open red) and validation (black) A-TEEM sample data for total CBD
Using the same formula already referenced in the GC-FID quantification section, the predicted LODs by component for the A-TEEM models are 0.024% (CBD/CBDA) and 0.008% (THC/THCA). The predicted LOQs by component for the A-TEEM models are 0.080% (CBD/CBDA) and 0.026% (THC/THCA) as given in Table 7, along with the values determined using the HPLC reference method.
Linear Regression Statistics from Extreme Gradient Boost Regression Model That Includes All 576 Prediction and Cross-Validation Data Points for Total Cannabidiol and Tetrahydrocannabinol Measured by HPLC
The A-TEEM slope was constrained to unity. Defined are the y-intercept (intercept), SE of the y-intercept (SE), LOD=3.3×SE, LOQ=3.3×LOD, the adjusted R2, and number of files (n) that combine calibration and validation.
HPLC, High-Performance Liquid Chromatography; NA, not applicable.
A-TEEM for substatutory quantitative prediction on THC and CBD
To assess the A-TEEM performance in the determination of low levels of THC, a measurement that is important for statutory determination, CBD-dominant samples are examined separately. Figure 5 compares A-TEEM predictions of the substatutory levels of THC against GC-FID reference data (A) and HPLC reference data (B), respectively. There were 372 individual data points classified as CBD-dominant (Table 3A, C), 348 from calibration and 24 from validation samples, corresponding to 31 individual plants. For these 372 A-TEEM measurements, there were no false positive statutory assignments, and the standard deviation of the residual errors σ was 0.0294 (GC-FID reference data) and 0.0254 (HPLC reference data).
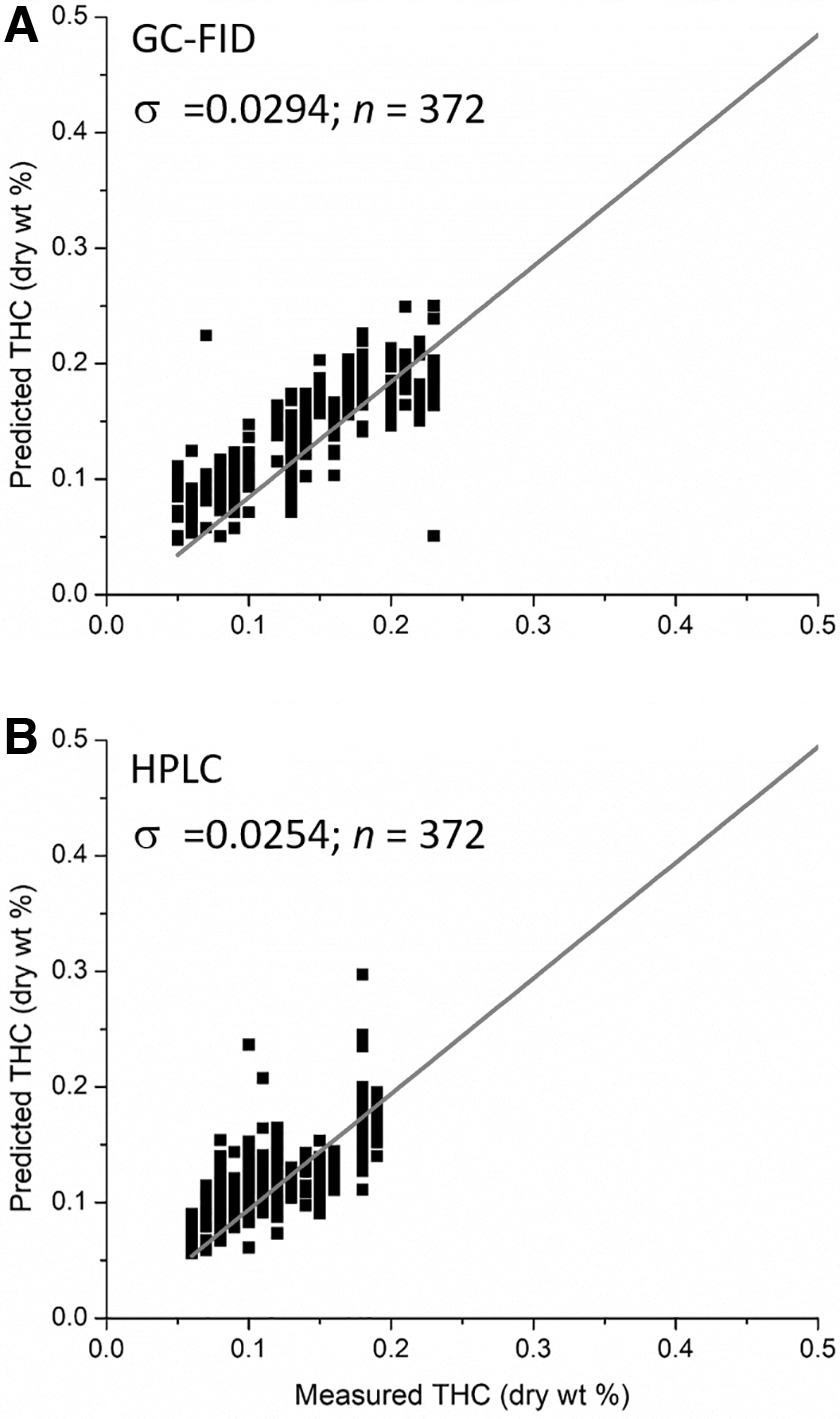
Comparison of A-TEEM predictions of substatutory THC determinations for GC-FID
Conclusions
A-TEEM is a rapid (<45 sec per measurement) method, with simple sample preparation (extraction and dilution), and low per-run cost compared with GC-FID and HPLC methods. Sensitivity and specificity are comparable with chromatography, and LODs and LOQs are low enough for statutory classification. A-TEEM with GC-FID reference data is able to classify cannabis varieties based on THC–CBD ratio and classify independent validation samples with 100% accuracy. Furthermore, A-TEEM regression models calibrated with both GC-FID and HPLC data yield LOQ values significantly <0.1%, indicating A-TEEM is suitable for evaluating statutory THC concentrations.
In practice, the models performed with 100% accuracy, yielding no statutory misclassifications in samples with THC levels significantly below the 0.3% w/w limit. Importantly, the A-TEEM model application can be automated for rapid analysis reporting in a laboratory environment. HORIBA products and solutions are intended to be used for quality control and safety testing in facilities where such use is permitted under applicable local or federal law.
Footnotes
Acknowledgment
We acknowledge the help of Sean M. Travers in reviewing the article.
Authors' Contributions
A.M.G., J.B.H., and A.E.R. conceived of the experiments; A.M.G., M.M.R., and M.A. Elshohly designed the experiments; M.A. Elhendawy, M.M.R., and A.S.W. performed the experiments; A.M.G. and M.A. Elhendawy analyzed the data; M.A. Elhendawy, M.M.R., A.M.G., and L.H.K. drafted the article with critical intellectual input to the article from J.B.H.; and A.M.G., J.B.H., M.G., and M.A. Elshohly supervised the project. All authors reviewed the article and approved its submission.
Author Disclosure Statement
No competing financial interests exist.
Funding Information
This study was supported in part by the National Institute on Drug Abuse (contract no. N01DA-15-7793).