
Abstract
Introduction:
In vitro models for liver disease suffer from the lack of well-established and sensitive biomarkers of cellular damage. MicroRNAs (miRNAs; small noncoding RNAs) represent potential biomarkers for the detection of drug-induced liver injury in vivo and in vitro. Altered physiological state caused by disease or tissue damage results in altered release of exosomal- or protein-bound miRNAs, detectable in body fluids and cell culture media.
Materials and Methods:
Here, we exposed 3D-HepaRG cultures to methotrexate (MTX) and acetaminophen (APAP) and used q-RT-PCR to investigate miRNAs as potentially sensitive markers of hepatotoxicity in vitro, with a specific focus on the exosomal release. We investigated three miRNAs, miR-122-5p and miR-192-5p, both associated with hepatic damage, and miR-34a-5p, involved with apoptosis. Metabolic activity, urea and albumin release were assessed to confirm key hepatocellular characteristics of 3D-HepaRG.
Results:
The 3D-HepaRG model was able to metabolise testosterone, produced urea and albumin. APAP treatment increased exosomal release of all three tested miRNAs, while MTX increased miR-122-5p release only. Absolute quantification of miR-122-5p corroborated the release of this miRNA by both treatments.
Discussion:
Exosomes could be efficiently isolated from 3D-HepaRG, characterized, and used for miRNA extraction and quantification. We identified that total extracellular and exosomal-miR-122-5p release occurred at concentrations lower than those leading to MTX-induced apoptosis/necrosis, which corroborate previous findings using other hepatotoxic compounds.
Conclusion:
Our results demonstrate the suitability of 3D-HepaRG combined with exosomal miRNA measurement for the detection of hepatotoxicity in vitro. Specifically, exosomal-miR-122-5p is a sensitive marker of APAP- and MTX-induced in vitro damage.
Introduction
Drug-induced liver injury (DILI) is a major challenge in clinical medicine and drug development. It is categorized as acute or chronic and can be the result of direct toxicity or immune-mediated mechanisms, as hepatocyte destruction may be further enhanced by a subsequent inflammatory reaction. 1 Acetaminophen (APAP) is a classic example of a drug causing acute dose-related DILI. High concentrations of APAP lead to acute hepatocellular necrosis/apoptosis and liver failure,1,2 whereas methotrexate (MTX) elicits chronic DILI in patients, potentially leading to hepatic fibrosis and ultimately cirrhosis.3–5
Current diagnostic methods include serum biomarkers such as alanine aminotransferase (ALT), aspartate aminotransferase (AST), alkaline phosphatase, albumin levels, and total bilirubin that are incapable of detecting early signs of liver damage. 6 Liver biopsies are still the standard diagnostic method despite their invasive nature, sampling error, and potential clinical complications. 7 Similarly, there is a lack of appropriate in vitro biomarkers of hepatocellular damage. Therefore, novel methods for detecting early signs of hepatocellular damage in commonly used in vitro systems, such as HepaRG cultures, are required.
The small regulatory RNAs known as microRNAs (miRNAs) are single stranded noncoding RNAs consisting of 21–25 nucleotides. They are not only present in cells but are also released into biofluids, including plasma, serum, urine, and cell culture media. 8 It has been shown that a variety of diseases such as cancer result in aberrant expression of miRNAs and selective miRNA release by injured cells.9–13 Owing to the stability of extracellular miRNAs (ECmiRNAs) in biofluids they have already been described as circulating biomarkers for a variety of pathologies and evidence suggests that ECmiRNAs have increased sensitivity over other viability assays and traditional serum markers in kidney and liver models.8,14–16 One described miRNA release mechanism is through extracellular vesicles (EV) known as exosomes that are 30–100 nm in diameter, making them the smallest EVs.17,18 Exosomes are characterized by a variety of antigens, including tetraspanins (CD9, CD63, CD37, CD81, CD82), heat-shock proteins, tumor susceptibility gene 101 protein (Tsg101), and ALG2-interacting protein X (Alix).17,19,20 miRNAs are not only selectively loaded into exosomes but ECmiRNAs are also detected in the microvesicle-free fraction indicating an alternative release mechanism through association to protein complexes that have been found in cell culture media. 21
Several miRNAs have been identified as potential DILI biomarkers in clinical samples and using both 2D and 3D in vitro models. They include liver-specific miR-122-5p that is predominantly expressed in hepatocytes and released into the blood upon hepatocellular damage. Alongside miR-122-5p, miR-192-5p also appears elevated in serum during DILI and other forms of liver damage.22–27 APAP-induced liver injury has been associated with increased release of miR-122-5p and miR-192-5p in vivo in animals and human.23,28
Less is known on the effect of MTX on miRNA release, but it has recently been described that bioprinted multicellular human liver tissue releases miR-122 into the cell culture supernatant after long-term MTX exposure. 29 Rodent in vivo studies showed that miR-122-5p can be released either in exosomes or attached to the AGO2 protein complex.9,16,30 In vivo studies using APAP have quantitatively shown that miR-122 is predominantly released through the protein-rich fraction, but a significant increase in miR-122 has also been reported within the exosomal-fraction.16,30 In primary human hepatocytes (PHHs) increased exosomal release of miR-122 has been reported after exposure to APAP and Tolvaptan, in both cases preceding treatment-induced necrosis.14,16 Moreover, exosomal miR-122 release was detectable earlier in total ECmiR-122 than other traditional biomarkers such as ALT and albumin measurements. 14
In this study, we extracted exosomes released by 3D-HepaRG to measure specific miRNAs associated with hepatocellular damage. The miRNAs selected include miR-122-5p and miR-192-5p due to their known association with DILI 26 and miR-34a-5p, which plays a role in regulating proliferator-activated receptor gamma and apoptosis 31 during disease and nephrotoxicity.15,32–35 HepaRG is a cell line widely used for in vitro assays in toxicology and metabolism studies due to their suitable characteristics, including cytochrome p450 isoenzyme (CYP) expression, bile canaliculae formation as well as urea and albumin production.36–39 HepaRG have also been shown to release exosomes,40,41 yet the miRNA content of exosomes released by 3D-HepaRG has not been thoroughly investigated.
Materials and Methods
Human cell lines
HepaRG cells were obtained from Biopredic International (Rennes, France). The cells were seeded at 1 × 10⁵ undifferentiated cells/cm2 in medium with growth supplements ADD710 (Biopredic). The cells were cultured at 37°C in 5% CO2 for 14 days before differentiation. After 14 days of culture, cell differentiation was induced with medium with differentiation supplements ADD720 (Biopredic) for 14 days. Then the cells were maintained in differentiation medium for up to 4 weeks. HepaRG were passaged using Trypsin-EDTA (Cat. No. 25300; Invitrogen).
Generation of 3D-HepaRG
3D-HepaRG were generated using round bottomed ultralow adherence (ULA) plates (Nunclon™ Sphera™; 174929; ThermoFisher) or using the Sigma micro-mold system (Z764051-6EA; Sigma). Cells were counted and 2000 HepaRG/microtissue were resuspended in William's E Medium + GlutaMAX (Cat. No. 32551; Invitrogen), 2 mM
Induction of CYP3A4
For functional characterization, CYP3A4 induction was carried out using 20 μM rifampicin (RIF; R3501; Sigma) directly after the aggregation phase of the 3D-HepaRG medium. RIF treatment was refreshed at 24 hours and ended at 48 hours. After this, the induced 3D-HepaRG were either tested for CYP3A4 activity, gene or protein expression as described hereunder.
mRNA analysis
3D-HepaRG were collected and washed using phosphate-buffered saline then lysed using Qiazol Lysis Reagent (79306; Qiagen) and RNA was extracted using a standard TRIzol procedure with the addition of Glycogen (LT-02241; ThermoFisher). RNA was reverse transcribed using a M-MLV Reverse Transcriptase (M1705; Promega,), M-MLV RT buffer (M531A; Promega), dNTP Mix (02-31-00100; Solis BioDyne), and Oligo dT-Primer (79237; Qiagen). The quantitative real-time polymerase chain reaction (qRT-PCR) was carried out using TaqMan probes from ThermoFisher for Cytochrome P450 3A4 (Hs04260376_m1) and Beta-2 microglobulin as a house-keeping gene (Hs00187842_m1), using FastStart TaqMan Polymerase (04673433001; Roche), The program used: 10 minutes denaturation at 95°C, followed by 40 cycles of 15 seconds at 95°C and 1 minutes at 60°C. The Ct values were generated using the Corbett Rotorgene Analysis Software 6000 and processed on GraphPad Prism and data are expressed as fold change.
Cytochrome p450 assay
P450-Glo™ CYP3A4 Assay with Luciferin-IPA (V9001; Promega) was used to determine the CYP3A4 activity in RIF treated and untreated 3D-HepaRG. The P450-Glo assay was carried out as described in the manufacturer's protocols and adjusted to quantities necessary for the 3D-HepaRG. The luminescence was measured at 1000 m/s using a Flexstation 3 microplate reader (Molecular Devices).
High-performance liquid chromatography mass spectrometry
Substrate conversion by 3D-HepaRG (35 microtissues/well) in a 24-well plate was determined in RIF treated and untreated 3D-HepaRG by measuring the conversion of 60 μg/mL testosterone (86500; Sigma) to hydroxytestosterone over time. Cell culture supernatant was collected at 0, 6, and 24 hours for the determination of testosterone and hydroxytestosterone. Medium samples were diluted in water supplemented with 2 mM ammonium fluoride solution and measurements were performed using high-performance liquid chromatography mass spectrometry (HPLC-MS/MS) (Agilent Technologies LC unit: Agilent Technologies, 1100; MS detector: Agilent Technologies, 6410; columns SB-C8, Zorbax, 4.6 × 50 mm, 1.8 mm, Agilent Technologies). Calibration standards were made of 1, 5, 10, 50, and 100 ng/mL testosterone in water supplemented with 2 mM ammonium fluoride. The absolute concentration of testosterone was calculated based on the calibration standards. Production of hydroxytestosterone was qualitatively assessed by determining the area under the curve.
Urea assay
Urea production was measured in the supernatant from RIF treated and untreated 3D-HepaRG using the QuantiChrom™ Urea Assay Kit (DIUR-100; BioAssay Systems). The QuantiChrom assay was carried out as described in the manufacturer's protocols and adjusted to quantities necessary for the 3D-HepaRG. The absorbance was detected at 520 nm using a Flexstation 3 microplate reader (Molecular Devices).
Albumin enzyme-linked immunosorbent assay
The albumin enzyme-linked immunosorbent assay (ELISA) analysis was performed using Human Albumin ELISA Quantitation Set kit (Cat. E80-129; Bethyl Laboratories). Supernatants from untreated, APAP-treated, and MTX-treated 3D-HepaRG were collected at 72 hours. Wells of a high binding 96-well plate were coated with goat anti-human albumin antibody for 1 hour, washed with buffer, blocked with blocking buffer for 1 hour, and washed with buffer again. Then 100 μL of the diluted medium samples were pipetted into the wells and incubated for 1 hour. After the incubation, the wells were washed again and the secondary antibody (horseradish peroxide-conjugated goat anti-human antibody) was added to the wells and incubated for 1 hour. After another wash step with buffer, 100 μL of enzyme substrate (tetramethylbenzidine) was added to the wells, incubated for 15 minutes in the dark, and the reaction was stopped by adding 100 μL stopping solution. All incubations were carried out at room temperature. The absorbance was detected at 450 nm using a Flexstation 3 microplate reader (Molecular Devices).
Immunostaining
3D-HepaRG were fixed using 4% PFA (18814-20; Polysciences, Inc.) and stained whole using the protocol described by Ravenscroft et al. 42 using the primary anti-cytochrome p450 enzyme CYP3A4 antibody (A131254; Merck), the secondary goat anti-rabbit IgG H&L (Alexa Fluor® 488; A11070; Invitrogen) and DAPI (10236276001; Sigma). Images were taken using Colibri 7 LED system (Zeiss).
3D-HepaRG compound treatment
For the determination of cytotoxicity, 3D-HepaRG were treated with MTX (M8307; Sigma) using the concentration range 3.75–120 μM and APAP (A5000; Sigma) using the concentration range of 1–8 mM. Medium with or without substances was exchanged every day. Subsequent experiments were performed with concentrations of 4 and 8 mM for APAP and 30 and 60 μM for MTX.
Cell viability assay
Cell viability was assessed using the CellTiter-Glo® Luminescent Cell Viability Assay (Cat. No. G7570; Promega) to detect intracellular ATP content. The CellTiter-Glo assay was carried out as described in the manufacturer's protocols and adjusted to quantities necessary for the 3D-HepaRG. The luminescence was measured at 1000 mseconds using a Flexstation 3 microplate reader (Molecular Devices).
Exosome extraction
The cell culture supernatant from the final 24 hours of the exposure period was collected from three wells each containing one 3D-HepaRG spheroid and used to extract exosome-rich fractions (ER-fractions) and collect the exosome poor fractions (EP-fractions). The cell culture supernatant was centrifuged at 800 g for 5 minutes followed by a second centrifugation at 3200 g for 10 minutes to remove dead cells or cellular debris.
Exosomes were collected using the exoRNeasy® Serum/Plasma Kit (Cat. No. 77044; Qiagen), which collects vesicles with an expected size range of 50–200 nm by using a membrane-based affinity binding step to isolate exosomes and other EVs. The supernatant was added to the column and after centrifugation, the flow-through was collected as an exosome-poor fraction (EP-fraction). Depending on the further processing, the exosomes were either eluted with elution buffer (76214; Qiagen) or collected in Qiazol, which was included in the kit.
miRNA analysis
miRNA was extracted from cell culture supernatant samples using the miRNeasy Serum/Plasma Kit (Cat. No. 217184; Qiagen) and was carried out as described in the manufacturers protocol. Cell culture supernatant was centrifuged at 800 g for 5 minutes to remove dead cells and larger cell debris. ER-fractions and total ECmiRNA were processed using the columns from the miRNeasy Serum/Plasma Kit to extract miRNA. Reverse transcription and qRT-PCR was carried out using TaqMan MicroRNA Reverse Transcription Kit (Cat. No. 4366596; Thermofisher), qRT-PCR master mix (Cat. No. 4444557; Thermofisher) and all TaqMan qRT-PCR primers were purchased from Invitrogen (Table 1). miRNA extraction and processing were carried out using 80 μL supernatant. The reaction mix was prepared according to the manufacturer's instructions for a final reaction volume of 10 μL containing 3 μL miRNA extract.
TaqMan miRNA Primers
The polymerase chain reaction (PCR) conditions were set for 30 minutes at 16°C followed for 30 minutes at 42°C and 5 minutes at 85°C. The qRT-PCR reaction mix contained TaqMan® Fast Advanced Master Mix 1x (4444557; Applied Biosystems™), TaqMan microRNA Assay primer 1x (Applied Biosystems; Table 1), and 1.3 μL cDNA in a final reaction volume of 20 μL. The PCRs were run at 95°C for 20 seconds followed by 40 cycles of 1 second at 95°C and 20 seconds at 60°C. Media samples were normalized using the cel-miR-39 spike in method, whereas total intracellular miRNA (ICmiRNA) were normalized using RNU44 to obtain the (ΔCT). Data are expressed as –ΔΔCT (Log2FC) to give a relative abundance with respect to the untreated samples (ΔΔCT).
Absolute quantification of miR-122-5p
Pure synthetic miR-122-5p (5′ UGGAGUGUGACAAUGGUGUUUG 3′) was purchased from Microsynth. Reverse transcription and qRT-PCR was carried out using TaqMan MicroRNA Reverse Transcription Kit, qRT-PCR master mix (Cat. No. 4444557; Thermofisher), and miR-122-5p-5p TaqMan qRT-PCR primer was purchased from Invitrogen (Table 1). The reaction mix was prepared according to the manufacturer's instructions for a final reaction volume of 10 μL with 3 μL synthetic miR-122-5p-5p diluted to a range of concentrations (100 μM–0.0001 fM). The PCR conditions were set for 30 minutes at 16°C followed for 30 minutes at 42°C and 5 minutes at 85°C. The qRT-PCR reaction mix contained TaqMan Fast Advanced Master Mix 1x (4444557; Applied Biosystems), TaqMan microRNA Assay primer 1x (Applied Biosystems; Table 1), and 1.3 μL cDNA in a final reaction volume of 20 μL. The PCRs were run at 95°C for 20 seconds followed by 40 cycles of 1 second at 95°C and 20 seconds at 60°C. Standard was plotted as CT value versus miR-122-5p concentration. Unknowns were calculated using GraphPad Prism 8. The standard curve is depicted in Supplementary Figure S1.
Exosomal characterization
The cell culture supernatant from three wells of 3D-HepaRG was used to extract ER-fractions and collect the EP-fraction. Samples for dot blot and for transmission electron microscopy (TEM) were collected using elution buffer (76214; Qiagen) and concentrated using 100,000 MWCO Vivaspin concentrator columns; 25 μL of exosome suspension was obtained for each sample (VS0141; Sartorius).
Lyophilized exosome standard (HBM-PES-30/2; HansaBioMed) was used as a positive control alongside the extracted samples. Samples were lysed using RIPA buffer (89900; ThermoFisher) and then 1 μL of exosome standard and sample was loaded onto a nitrocellulose membrane and blocked in 1 × Tris-buffered saline + 0.1% Tween 20 (TBS-T) containing 4% milk powder. The membrane was washed for 5 minutes three times and then incubated with the primary antibody (Table 2) overnight at 4°C. The wash step was repeated, and the membrane was incubated with the secondary antibody (Table 2) for 2 hours and washed once again. The membrane was visualized using the Odyssey CLx Infrared Imaging System by 700 nm.
Antibodies Used in Dot Blot
The ER- and EP-fractions were concentrated and 4 μL was loaded onto a carbon film on a copper grid (1GC400; Ted Pella), then washed with water and stained with 2% uranyl acetate (73943; Fluka). The images were taken with a FEI T12 Spirit Electron microscope at 80 kV with a Morada CCD-camera by Olympus.
Statistical analysis
Data were analyzed using GraphPad Prism 8 (Version 8.0.2; GraphPad Software) and expressed as mean values ± standard deviation. The unpaired Student's t-test was used for comparison between two groups. One-way analysis of variance (ANOVA), followed by a Dunnett's test for subsequent pairwise comparisons with the control group was used for dose–response analysis. p < 0.05 was considered to be significant: no significance (ns), p > 0.05; *p ≤ 0.05; **p ≤ 0.01; ***p ≤ 0.001.
Results
Characterization of 3D-HepaRG
3D-HepaRG were generated using 2000 predifferentiated HepaRG/microtissue and allowed to aggregate for 72 hours. The 3D-HepaRG showed basal and RIF-induced expression and activity of CYP3A4. qRT-PCR results demonstrate that 3D-HepaRG respond with a significant >10-fold increase of CYP3A4 expression after induction with RIF (Fig. 1A). The increased expression led to significantly higher CYP3A4 activity as determined using the P450-Glo CYP3A4 assay and an increased conversion of testosterone to hydroxytestosterone as measured by HPLC-MS/MS. After 72 hours, the luminescence intensity measured using the P450-Glo CYP3A4 assay was significantly increased by RIF treatment (Fig. 1B). Time-course experiments showed that the quantity of testosterone decreased in both the RIF-treated and untreated 3D-HepaRG at a similar rate in the first 6 hours. However, at 24 hours there were lower testosterone levels in the medium from the RIF-treated 3D-HepaRG, concomitant with an increase in the production of hydroxytestosterone (Fig. 1C). These results show that, under the current conditions, 3D-HepaRG display CYP3A4 activity that is inducible by RIF. In addition, the CYP3A4 activity is higher in 3D than in 2D cultures (Supplementary Fig. S1). Immunostaining for CYP3A4 demonstrated that both the untreated and RIF-treated 3D-HepaRG express CYP3A4 protein. However, the RIF-treated 3D-HepaRG appeared to have more CYP3A4 protein (Fig. 1E).
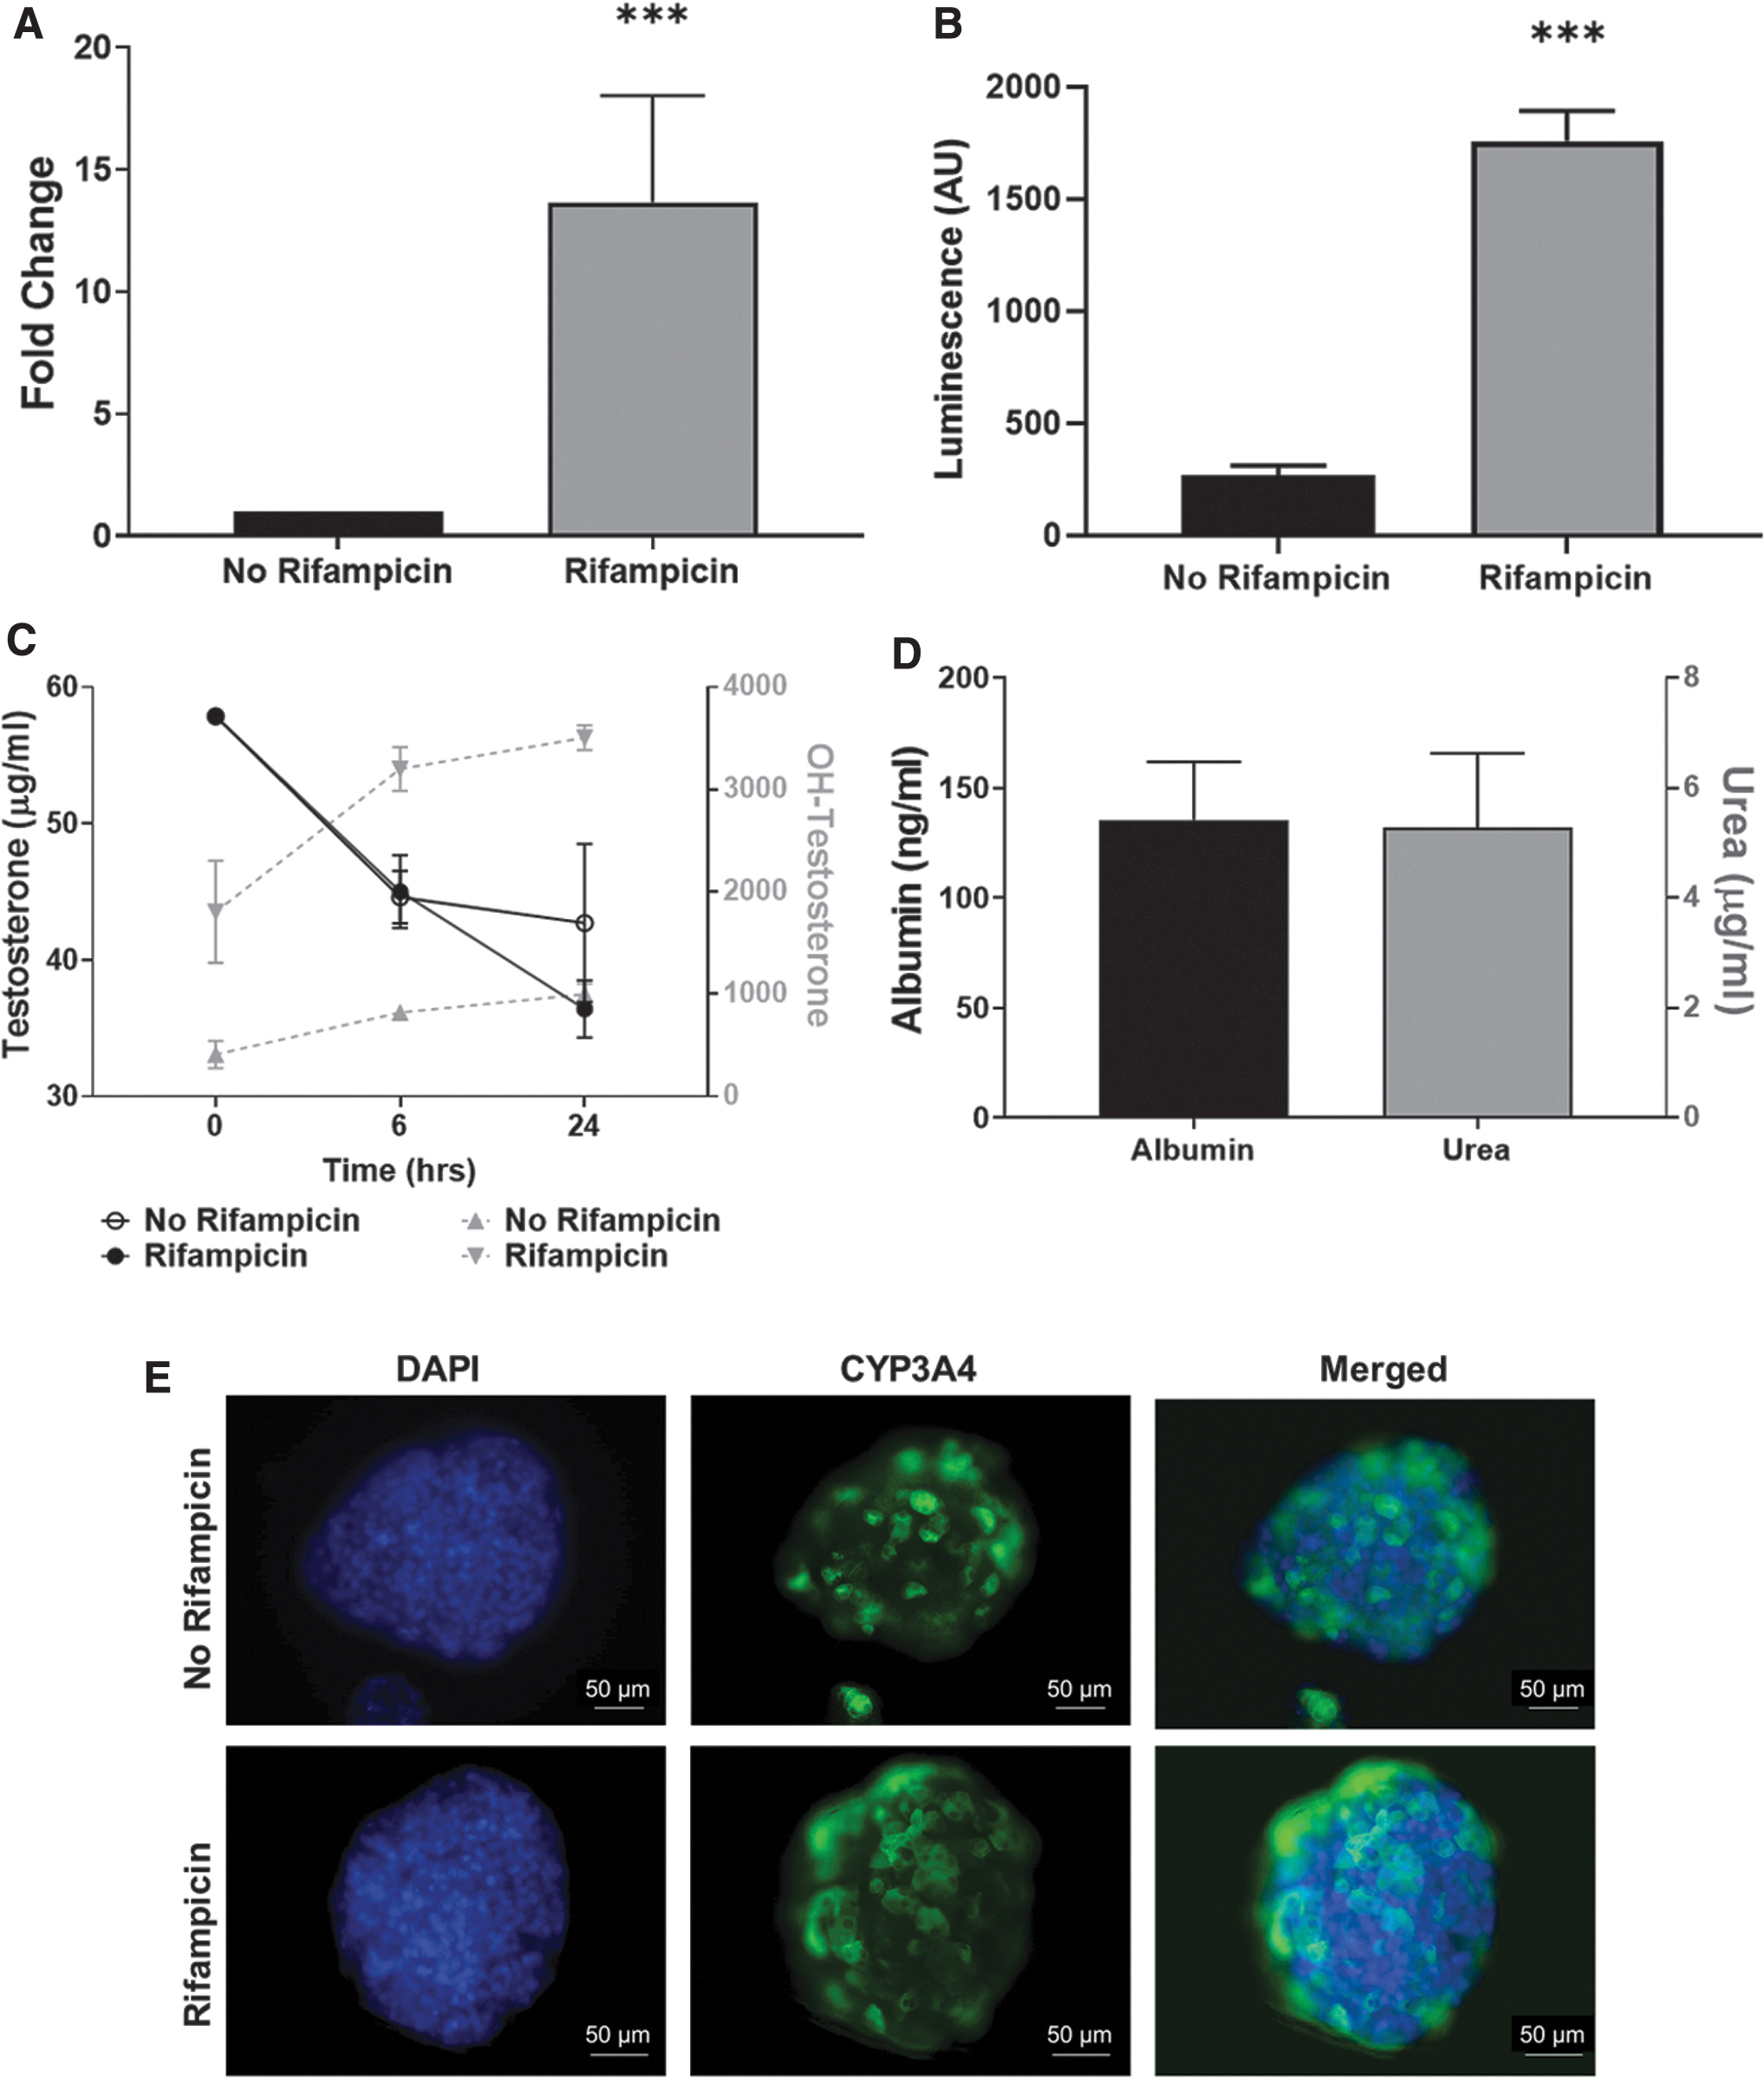
Characterization of 3D-HepaRG. 3D-HepaRG were generated using 2000 HepaRG, allowed to aggregate for 72 hours and then exposed to 20 μM Rifampicin for 48 hours. Expression of CYP3A4 determined by qRT-PCR, expressed as fold change in comparison with the control; N = 2 biological and two technical replicates
As an additional parameter, urea and albumin production were also measured to confirm 3D-HepaRG functionality. Untreated 3D-HepaRG released ∼1.5 μg/mL urea and 130 ng/mL albumin into the cell culture supernatant for a 24-hour period.
HepaRG cells cultured in 3D microtissues release exosomes
Exosomes were isolated from cell culture supernatants obtained from control (untreated) and treated (APAP, 8 mM) 3D-HepaRG and subsequently characterized. TEM images show EVs were present in both the ER- and EP-fractions (Fig. 2A). However, there were considerably fewer EVs in the EP-fraction (Fig. 2B, C) and the EVs were significantly smaller in size (Fig. 2B, C). Contrarily, the ER-fraction contained more than double the number of EVs (Fig. 2B, C) and the average size was significantly larger (Fig. 2B, C). The size of the EVs was not affected by the treatment, as no significant difference in diameter was observed between control and treated samples (Fig. 2). The EP-fraction did not contain any vesicles >150 nm in diameter, thereby demonstrating that the isolation method was efficient in retaining larger EVs and the small number that flowed through were smaller in size (Fig. 2B, C). In the ER-fraction EVs were found to be 80–200 nm, but the majority of EVs were ∼100–150 nm in size (Fig. 2B).
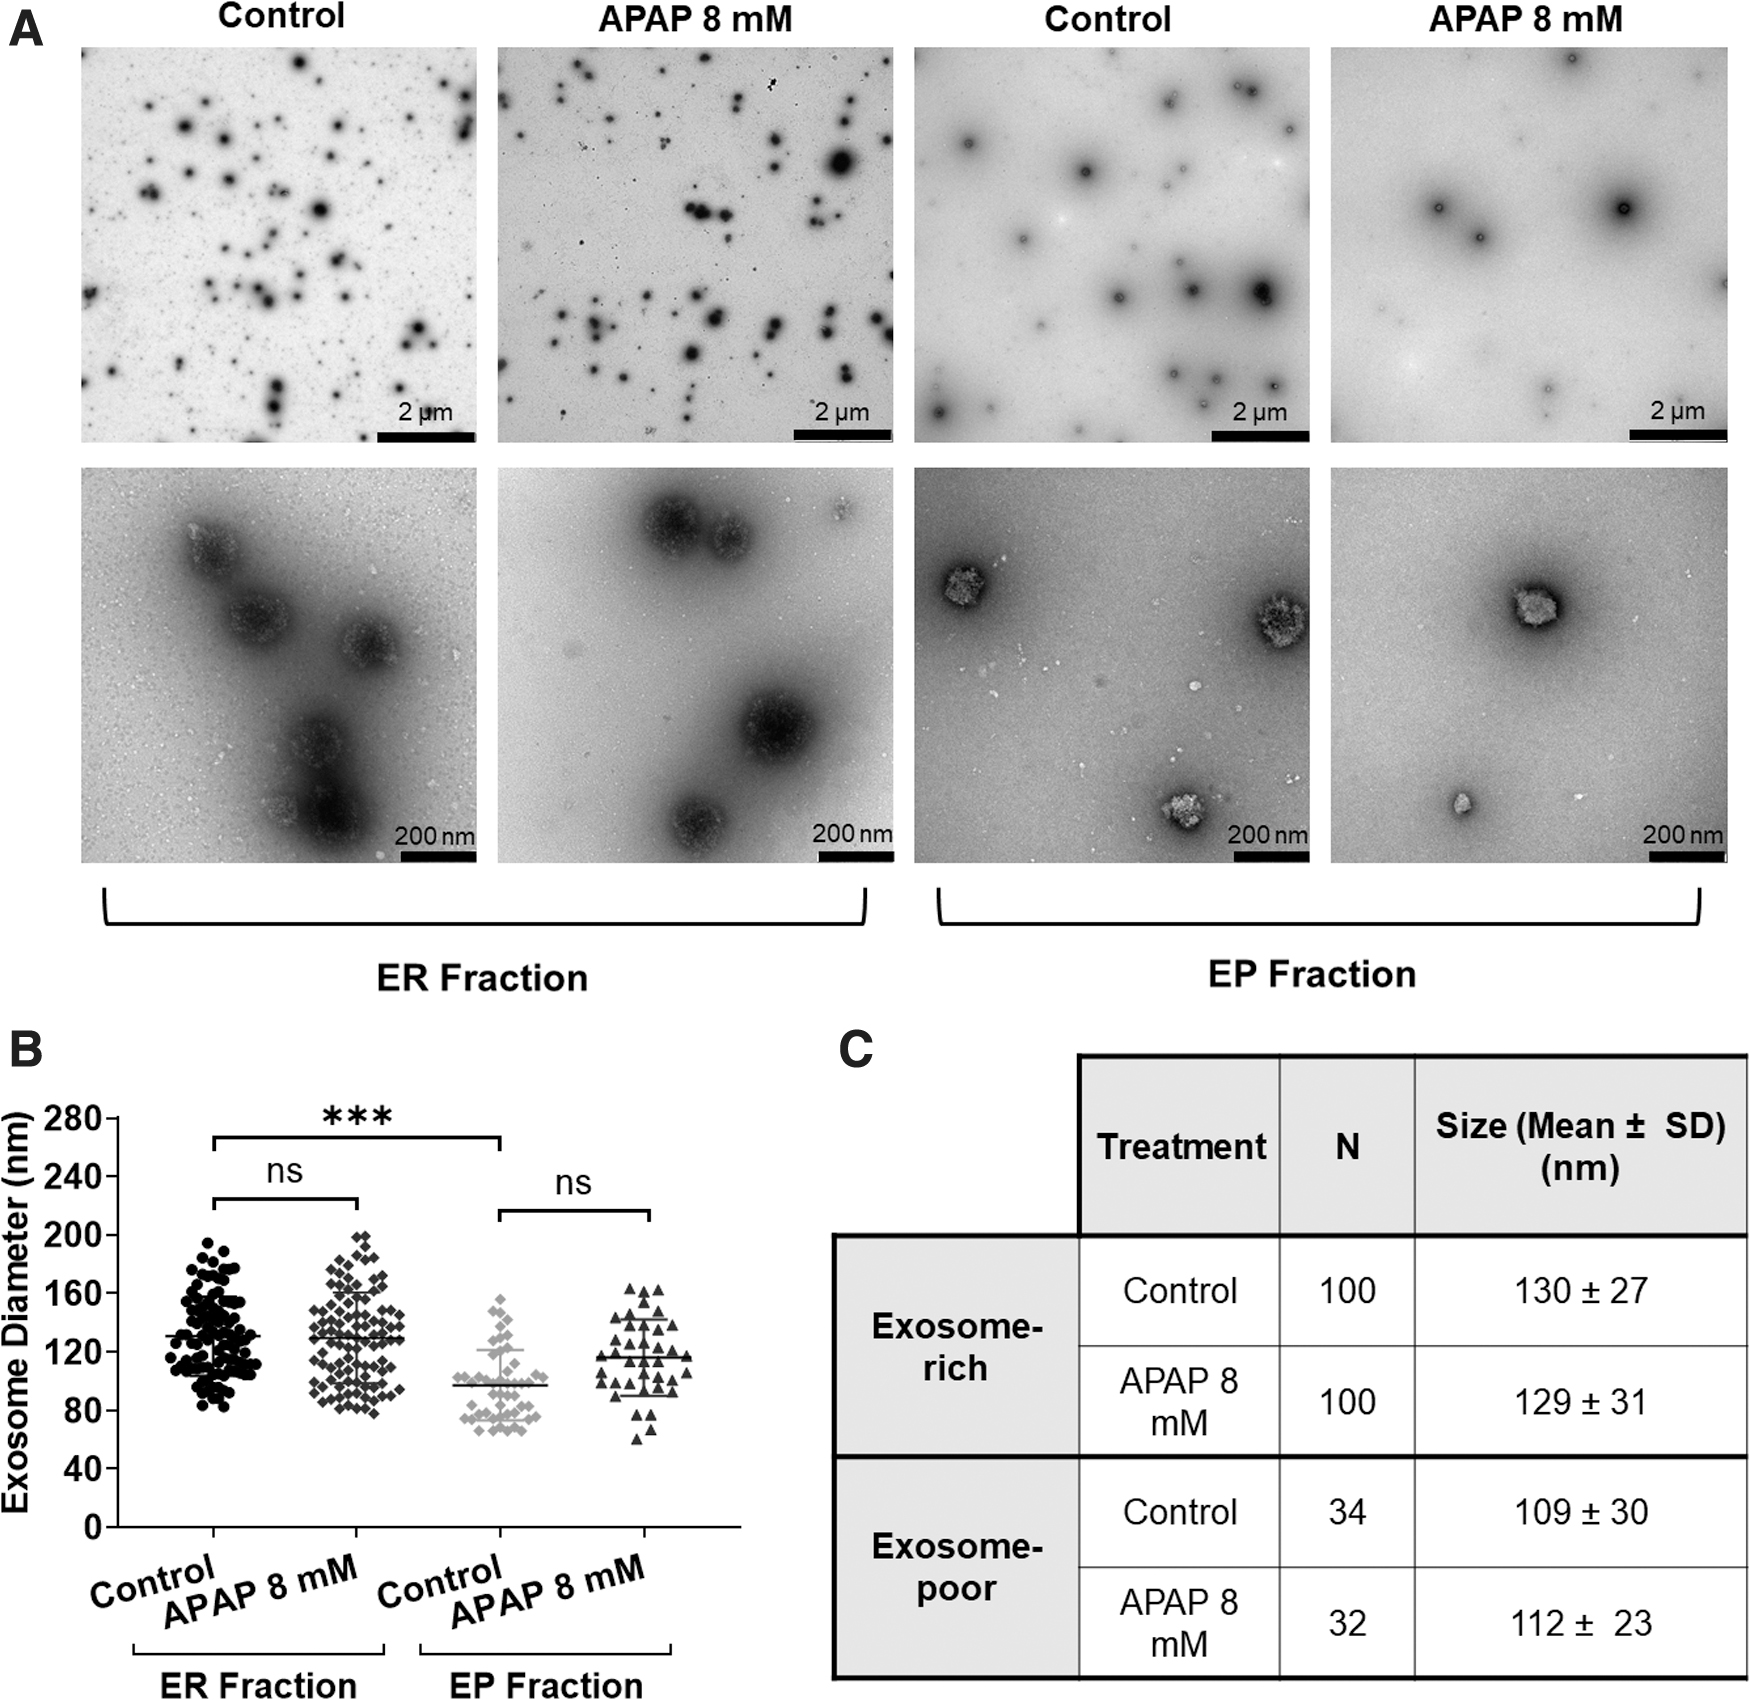
Visualization and measurement of exosomal fractions. The cell culture supernatant from three wells of 3D-HepaRG was used to extract exosome-rich and collect the exosome-poor fraction. Samples for TEM were collected using elution buffer and concentrated using 100,000 MWCO Vivaspin concentrator columns until 25 μL of exosome suspension was obtained. Four microliters were loaded onto a carbon film on a copper grid and stained with 2% uranyl acetate. The images were taken with a FEI T12 Spirit Electron microscope at 80 kV. Two magnifications are shown, the scale bar for the top row is 2 μm and the second row is 200 nm
Further characterization of the secreted vesicles with immunostaining of specific markers showed that the EVs express exosomal markers: CD9, CD63, Tsg101, Alix, and Flotillin-1 (Fig. 3). Calnexin was used as a negative control and was not detected in any of the samples, including the lyophilized exosome standard. The exosomal surface marker CD9 was detected in both native and lysed samples. Overall, the results confirmed that the HepaRGs in 3D culture release exosomes into the medium.
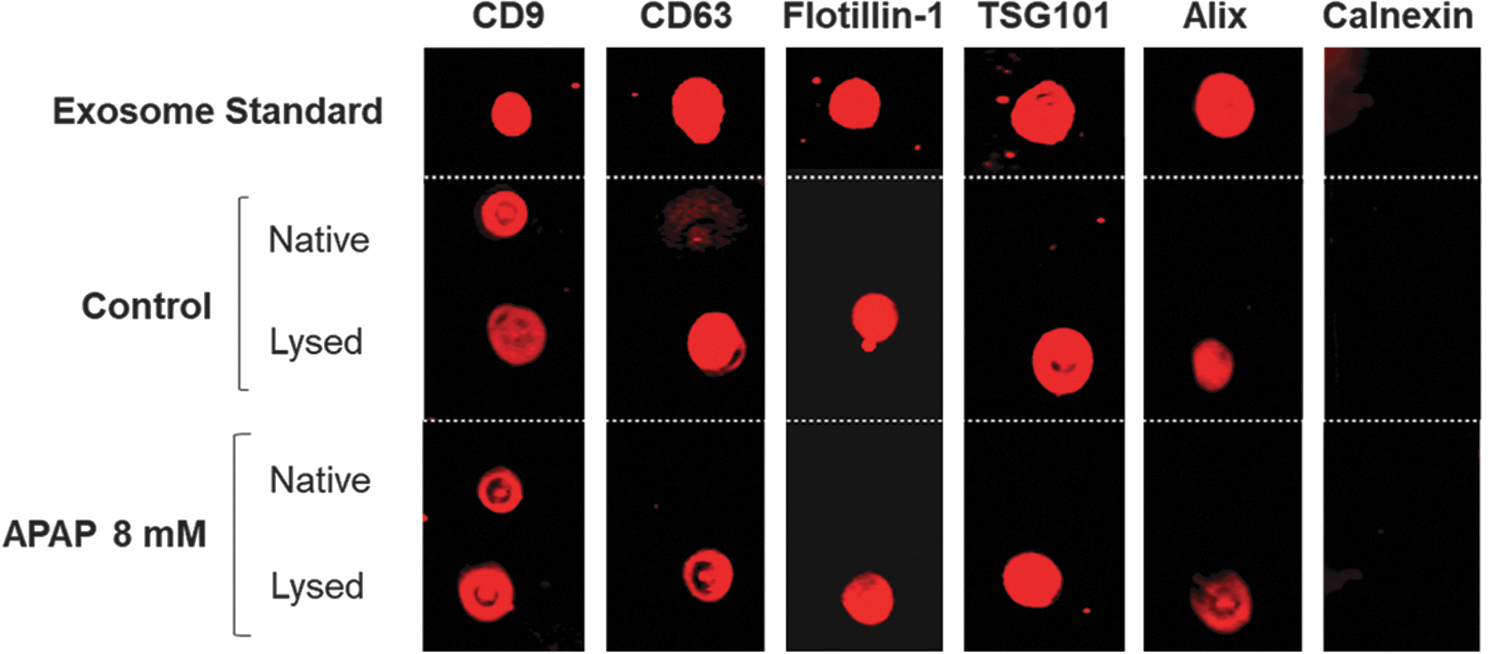
Exosomal characterization by dot blot. The cell culture supernatant from three wells of 3D-HepaRG was used to extract exosome-rich samples collected using elution buffer and concentrated using 100,000 MWCO Vivaspin concentrator columns until 25 μL of exosome suspension was obtained. The exosome standard was purchased in a lysed form, whereas the samples were either lysed or left in the native form. One microliter of sample or exosome standard was loaded on a nitrocellulose membrane and processed according to the materials and methods section. The membrane was visualized using the Odyssey CLx Infrared Imaging System by 800 nm. Color images are available online.
APAP toxicity leads to increased exosomal miRNA release
3D-HepaRG were treated with a range of APAP concentrations (0–8 mM) leading to the expected concentration-dependent decrease in viability with an IC50 of 5.3 ± 0.65 mM, based on ATP content (Fig. 4A). APAP-induced hepatocellular injury was also confirmed by a decrease in albumin secretion measured by ELISA, which demonstrated a decrease in hepatocyte functionality caused by APAP at 4 and 8 mM (Fig. 4B). Microscopic observation further substantiated the findings as it showed a visible accumulation of debris and a reduction on the size of the microtissue after treatment with APAP (Fig. 4C and Supplementary Fig. S2A).
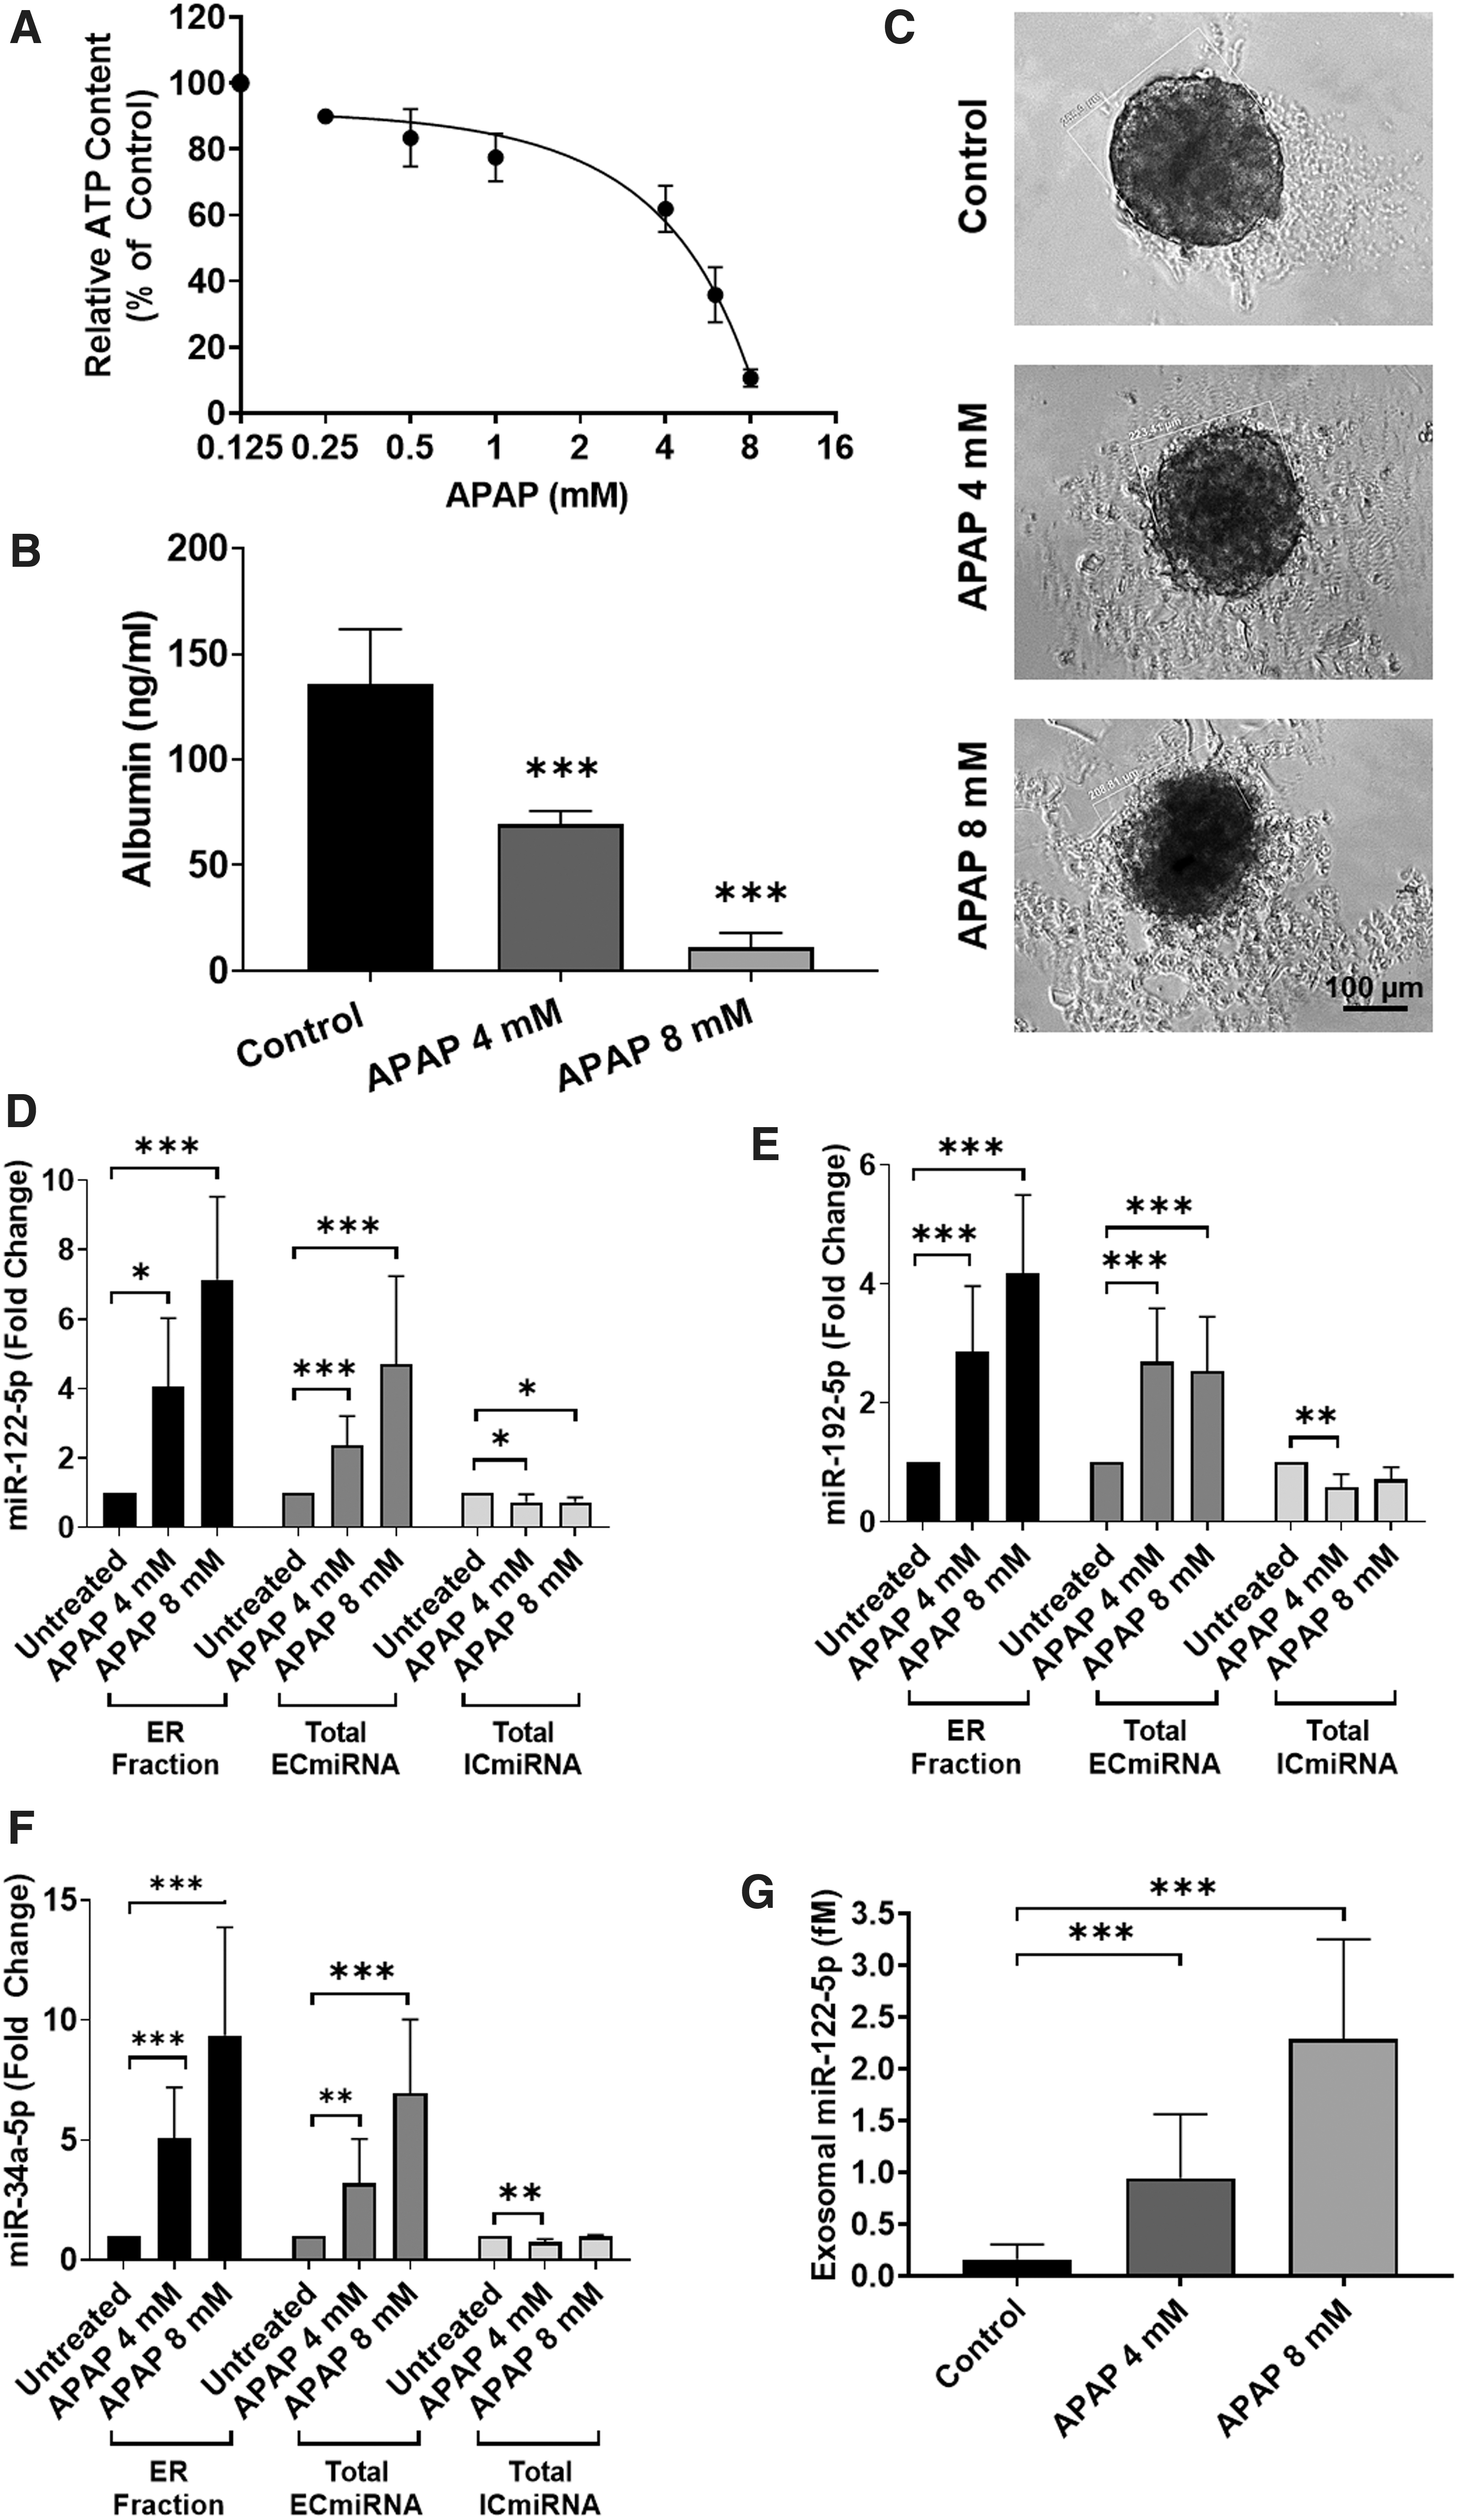
Assessment of hepatocellular damage of 3D-HepaRG exposed to APAP. Differentiated HepaRG were cultured as 3D-HepaRG and were exposed to APAP for 72 hours. Upon exposure to APAP concentrations ranged from 1 to 8 mM viability was assessed using ATP assay and the IC50 was calculated to be 5.3 ± 0.65 mM. Viability data values are expressed as percentage ± SD of control (100%), N = 3 biological repeats with three technical replicates
Total ECmiRNA from cell culture supernatant and total ICmiRNA from cell lysates were collected at 72 hours for miRNA analysis using qRT-PCR. The total ICmiRNA showed a small yet significant decrease in expression of miR-122-5p for 3D-HepaRG exposed to both concentrations of APAP (Fig. 4D). A significant decrease of miR-192-5p and miR-34a-5p was observed in 3D-HepaRG exposed to 4 mM APAP (Fig. 4E, F). Relative quantification of extracellular miRNA was carried out using qRT-PCR in the total ECmiRNA and the ER-fraction. Exposure to APAP elicited a significant concentration-dependent increase in release of miR-122-5p in the total ECmiRNA and the ER-fraction (Fig. 4D). Exposure to APAP also elicited a significant increase in miR-192-5p in the total ECmiRNA and ER-fraction (Fig. 4E). The total ECmiRNA showed a significant increase in miR-34a-5p release upon exposure to APAP similarly to the ER-fraction (Fig. 4F).
Using a standard curve produced with synthetic miR-122-5p, absolute quantification of the exosomal miRNA was carried out (Supplementary Fig. S3). Results show that there is a significant increase in miR-122-5p concentration upon exposure to both 4 and 8 mM APAP and we demonstrate small quantities (2.5 fM) can be detected by qRT-PCR (Fig. 4G), thus demonstrating the development of a successful protocol requiring small cell numbers and medium quantity (∼6000 HepaRG and 300 μL) for analysis (Fig. 4G).
Exosomal miR-122-5p release increases upon subtoxic exposure to MTX
To further extend our study, 3D-HepaRG were treated with a range of MTX concentrations (0–128 μM) and ATP content as a measure of viability was assessed. A small nonconcentration-dependent decrease in ATP content was detected in MTX-treated 3D-HepaRG (Fig. 5A). Albumin release was also measured by ELISA, which demonstrated that no significant decrease was observed after exposure of the microtissues to up to 60 μM MTX (Fig. 5B). Microscopic observation showed that there was no obvious morphological change in microtissues size and no accumulation of debris was visible (Fig. 5C and Supplementary Fig. S2B).
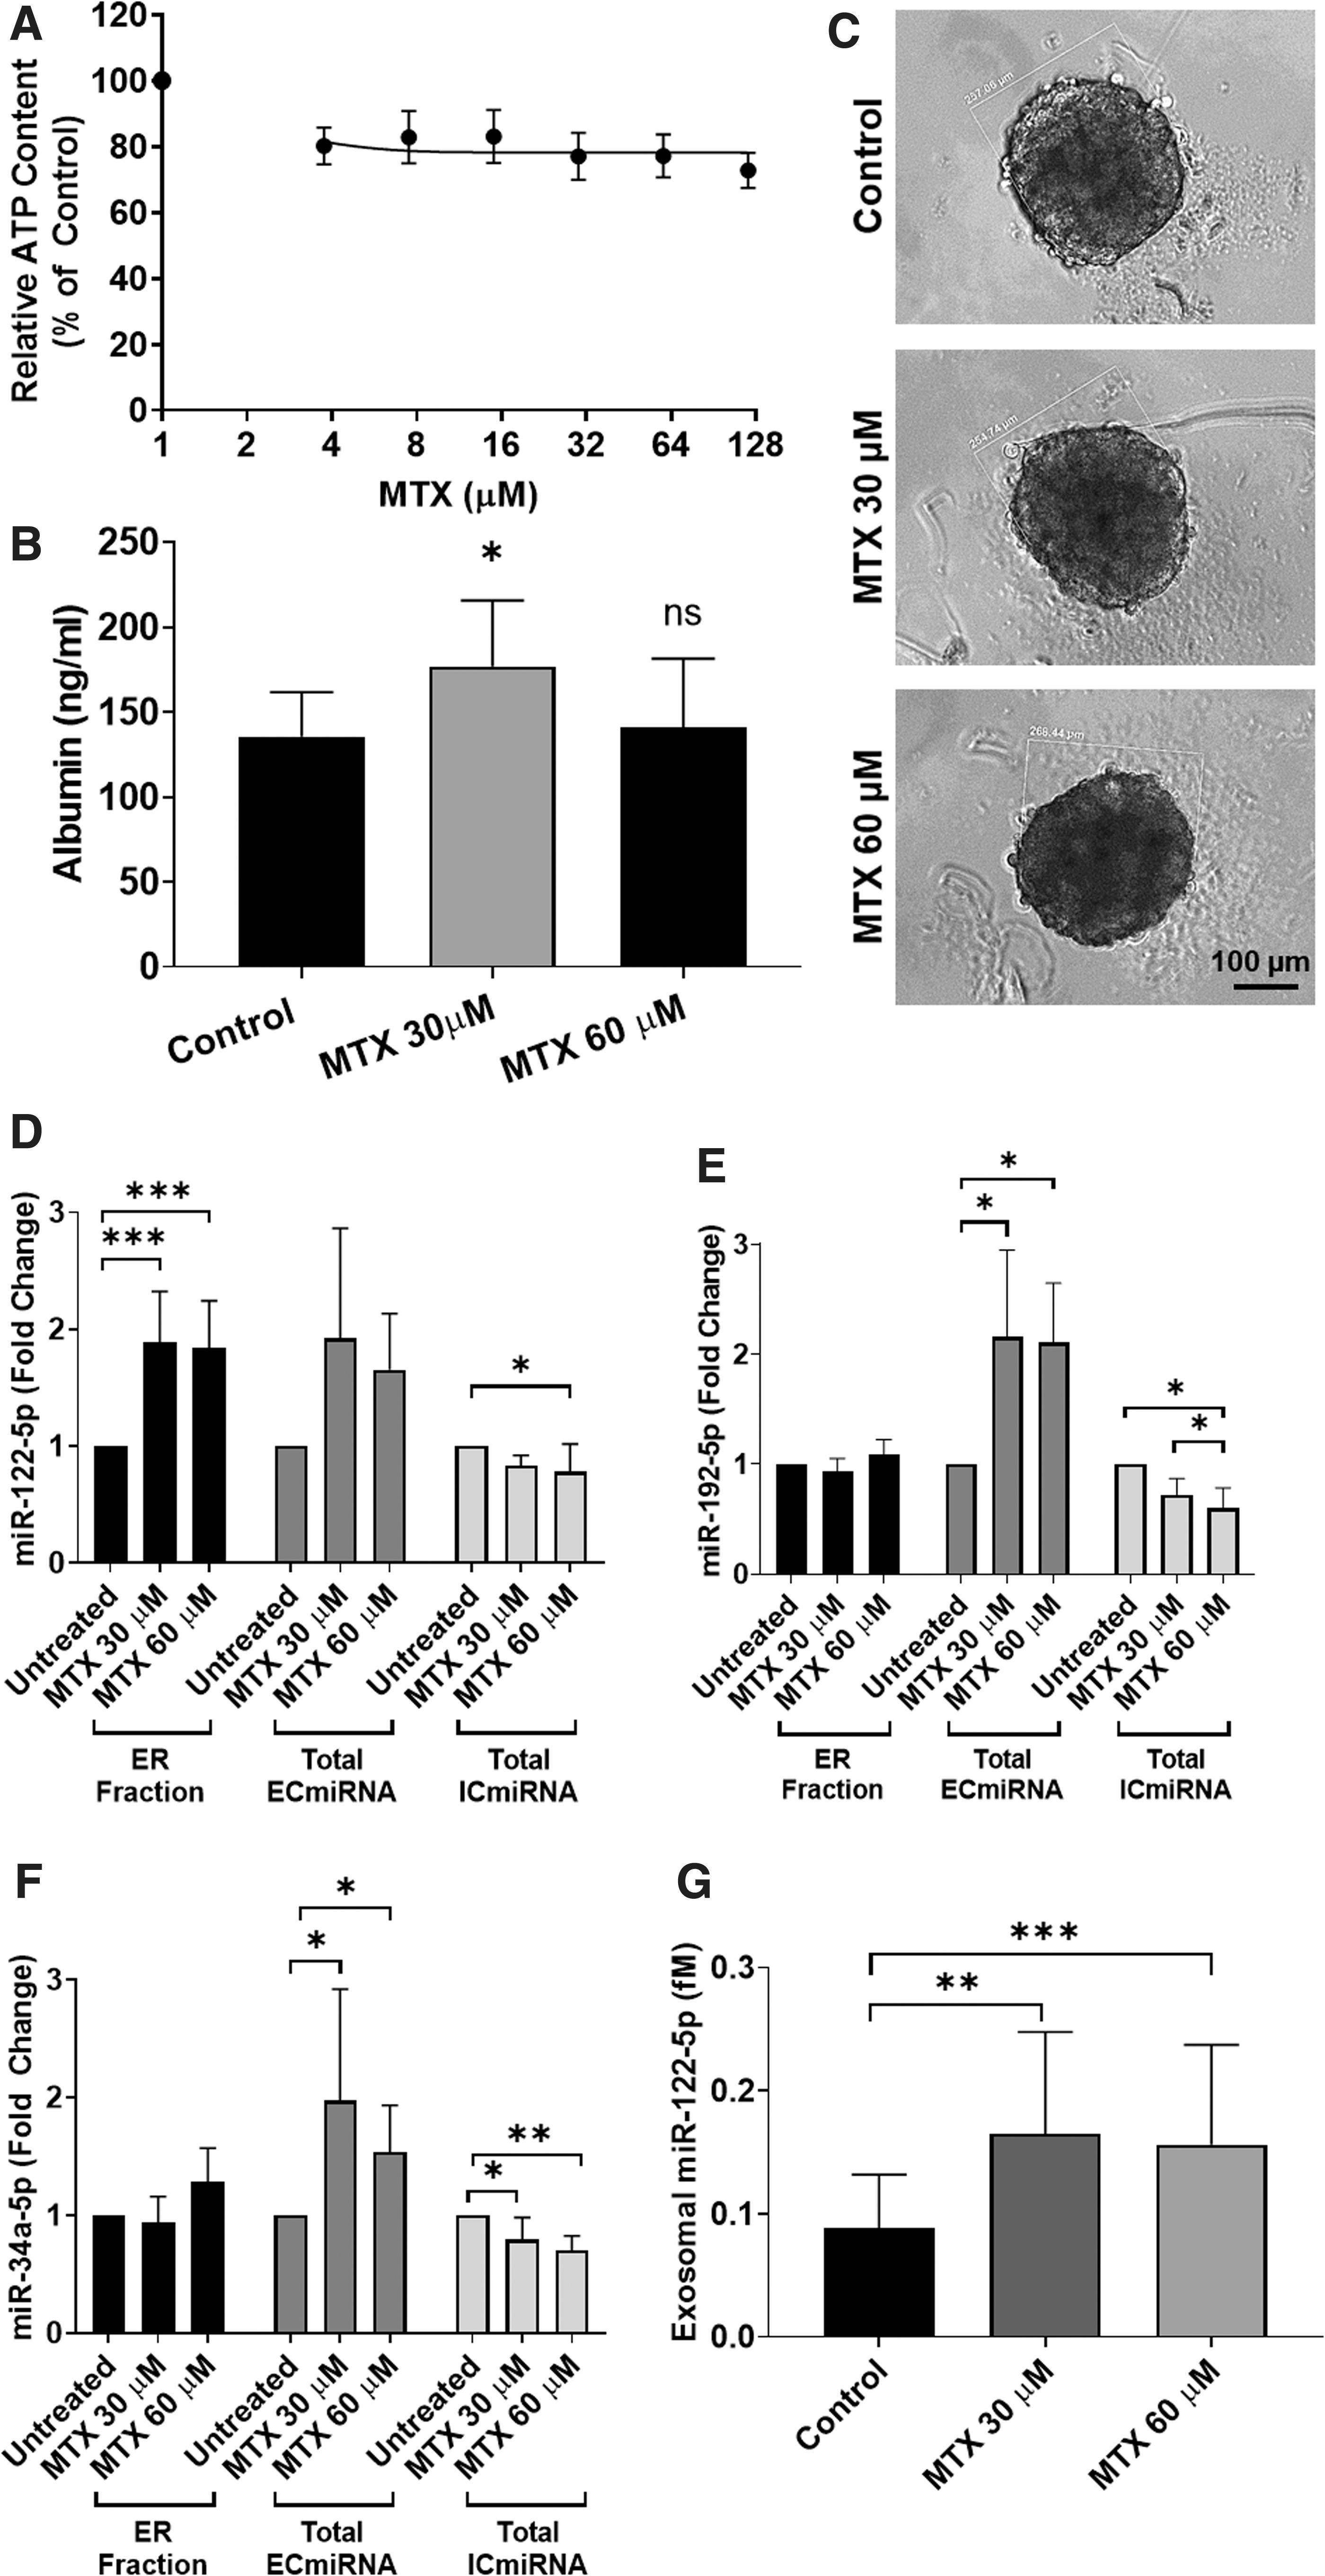
Assessment of hepatocellular damage of 3D-HepaRG exposed to MTX. Differentiated HepaRG were cultured as 3D-HepaRG and were exposed to MTX for 72 hours. Upon exposure to MTX concentration ranged from 3.75 to 120 μM viability was measured but no IC50 could be calculated. Viability data values are expressed as percentage ± SD of control (100%). N = 3 biological repeats with three technical replicates
Isolated exosomes from MTX-treated 3D-HepaRG were also examined based on their content in miRNAs by qRT-PCR. Total ECmiRNA and total ICmiRNA were collected at 72 hours for miRNA relative quantification in the total ECmiRNA and ER-fraction. Exposure to MTX elicited a slight but significant decrease in intracellular miR-122-5p, miR-192-5p and miR-34a-5p expression and a significant increase in miR-122-5p release, in the ER-fraction (Fig. 5D–F). Neither concentration of MTX had a significant effect on the release of miR-192-5p or miR-34a-5p in the ER-fraction, but led to increased release of both miRNA species in the total ECmiRNA, suggesting a nonexosomal release mechanism for these two miRNAs (Fig. 5E, F). Quantitative measurement also confirmed a significant release of miR-122-5p in the exosomal fraction, although less marked than that observed after treatment with APAP (Fig. 5G).
Discussion
In this study, we investigated the response of 3D-HepaRG to two compounds that show clinically relevant hepatotoxicity with the goal of assessing the suitability of exosomal miRNAs as markers of hepatocellular damage in vitro. To this end, we exposed 3D-HepaRG to the classic acute DILI compound APAP or to MTX is known to cause DILI in some patients undergoing chronic treatment.1–3,5 We also successfully implemented methodologies to isolate exosomes and quantify miRNAs. We demonstrated that 3D-HepaRG released exosomes and that treatment did not affect this process: APAP had no significant effect on exosome size or composition but did affect their miRNA content. From a biomarker perspective, release of exosomal miR-122-5p, -192-5p, and -34a-5p was significantly increased upon APAP-induced toxicity. For miR-122-5p, absolute quantification in the ER-fraction corroborated the finding.
Characterization of the in vitro model and determination of compound concentrations
Xenobiotic metabolism is a key function of hepatocytes and is mostly catalyzed by CYPs, some of which can be transcriptionally induced by RIF. 43 A large number of drugs (50%–60%) are metabolized by CYP3A4 and a variety of studies have demonstrated that RIF is able to induce this CYP in HepaRG grown in traditional monolayer and 3D cultures.35,44–46 Therefore, we assessed expression and induction of CYP3A4 in our 3D-HepaRG.
We demonstrated basal and induced expression of CYP3A4 using immunostaining, qRT-PCR, and enzymatic activity measurements (using P450-Glo CYP3A4 assay and hydroxylation of testosterone with HPLC-MS/MS). Moreover, 3D-HepaRG showed increased basal and induced CYP3A4 activity when compared with HepaRG grown in monolayer cultures (Supplementary Fig. S1). These results are in accordance with findings by Berger et al. who demonstrate similar CYP3A4 activity in PHH and that 3D culture conditions results in enhanced basal CYP activity over monolayer cultures. 46 Furthermore, we also confirmed that 3D-HepaRG display other typical hepatocyte characteristics such as urea and albumin production as described elsewhere.47–49 Taken together, these results show that this in vitro system represents a good surrogate model for the study of hepatocyte responses to chemicals.
Suitable concentrations of the test compounds APAP and MTX were determined based on known Cmax, the maximal drug concentration in human plasma. The range surrounding the Cmax has been investigated by Xu et al. wherein they justified the use of doses up to 100 × Cmax in PHH cultures to account for interindividual differences in drug concentrations within the liver. 50 The plasma concentration of MTX of psoriasis patients is ∼0.01–1.4 μM; therefore, the tested concentrations (3.5–120 μM) are within the 100 × Cmax. 51
Determining the Cmax of APAP is problematic due to the nature of APAP-induced liver injury that occurs either by accidental or intentional overdose. Plasma levels vary between patients but have been reported to reach 400 mg/mL (2.6 mM).52,53 In addition, previous reports in vitro and ex vivo demonstrated that APAP elicits toxicity at 5–20 mM dependent on the system.54–56 Therefore, we investigated the concentration range of 0.5–8 mM and chose 4 and 8 mM for further analysis based on cell viability results in our system. Exposure of HepaRG to 4 and 8 mM APAP elicited the expected hepatocellular damage in 3D culture conditions. Contrarily, MTX did not exert significant toxicity in 3D-HepaRG. 3D-HepaRG shape, size, and albumin release were maintained when exposed to MTX suggesting hepatocellular function was not largely affected.
Exosomal miRNA release is significantly increased upon exposure to APAP
To elucidate the potential of exosomal miRNAs as markers for hepatocellular responses, we extracted extracellular exosomes and confirmed their identity by immunostaining with specific markers (CD9, CD63, Tsg101, Alix, and Flotillin-1). These results strongly suggest that the ER-fraction contains exosomes.17,19,20 In addition, TEM was used to visualize EVs and as expected, the ER-fraction contained more EVs than the EP-fraction. The EP-fraction consisted of mostly smaller EVs, whereas the majority of EVs in the ER-fraction were significantly larger (100–150 nm). The estimated diameter of the exosomes in the ER-fraction is slightly larger than expected based on previous publications.17,18,57–59 However, the methodology of TEM by negative staining can result in desiccation and flattening of EVs, which may lead to a misinterpretation of their true morphology and size. 60 Interestingly, the number of exosomes for both treated and untreated 3D-HepaRG was not significantly affected, which is in agreement with previous findings where treatment of PHHs did not affect the number of exosomes being released. 16
It has been previously shown that APAP elicits increased release of miR-122-5p and miR-192-5p in vivo and in vitro,22–27 which we could also confirm using 3D-HepaRG. Interestingly, the increase of these miRNAs was more marked in the ER-fraction than in the total ECmiRNA. This may indicate that the exosomal fraction provides more precise measurements, as suggested by others. 14 The fact that the absolute quantification shows a clear dose-dependent increase of miR-122-5p further supports this assessment. Moreover, exosomal release of miR-192-5p and miR-34a-5p has also been observed in other biological systems61–63 ; and PHHs treated with 10 mM APAP release miR-122 in the ER-fraction. 16 In summary, 3D-HepaRG exposed to APAP results in increased release of exosomal miR-122-5p, miR-192-5p, and miR-34-5p.
Exosomal miR-122-5p is a sensitive marker of MTX-induced DILI
Under the current experimental conditions, MTX did not cause overt toxicity to the 3D-HepaRG at concentrations up to 60 μM, as judged by albumin secretion, morphology of microtissues, and ATP content. The slight decrease in intracellular ATP depicted in Figure 5A lacked dose dependence and was, therefore, not considered a sign of MTX-induced toxicity.
At the same concentrations, a small but significant increase in release of miR-192-5p and miR-34a-5p was detected in the total ECmiRNA, whereas the levels in the ER-fraction remained unchanged. This may indicate that these two miRNA-species, related to liver damage or apoptosis,26,31 are indicators of MTX-induced hepatocellular changes but are not released in exosomes. Contrarily, the levels of miR-122-5p were significantly increased in the ER-fraction, whereas minor changes were detected in the ECmiRNA. This suggests that exosomal miR-122-5p may be more sensitive than ECmiRNA and arguably than other markers of toxicity (such as ATP content and albumin production). The increase of exosomal miR-122-5p was consistent with the absolute quantification, although the levels reached with subtoxic concentrations of MTX were ∼10-times lower than those measured with cytotoxic concentration of APAP.
The link between miR-122 release and liver damage after MTX-induced toxicity has been established in multicellular bioprinted tissues generated with human primary cells at cytotoxic concentrations. 29 However, exosomal miR-122 has not been investigated for MTX-induced DILI and our results show for the first time that exosomal miR-122-5p detects MTX-induced hepatocellular damage at concentrations that do not significantly affect albumin production or ATP content in 3D-HepaRG. This observation is in accordance with in vitro data from Mosedale et al. who demonstrated that exosomal miR-122 detected hepatocellular damage earlier than other measurements such as ALT and total ECmiRNA samples. 14 This is also in line with in vivo data from Bailey et al., as they state miRNAs outperform ALT and AST as toxicity biomarkers in terms of sensitivity and specificity. 64
Conclusion
Based on the characterization the model and its response to APAP, we deemed 3D-HepaRG a suitable model for investigating substances that lead to hepatocellular damage. The system can be easily adapted to 96- and 384-well plates and thus represents a scalable and automatable in vitro assay. In this study, we could successfully isolate exosomes released by 3D-HepaRG and determine exosomal miRNA content in a relative (to the control) and absolute (actual concentration) manner. Our results strongly support the use of miRNAs as markers of hepatocellular damage, in accordance with published clinical results and in vitro data.
We demonstrated that miR-122-5p is released in exosomes of 3D-HepaRG exposed to MTX and APAP, whereas exosomes released by untreated 3D-HepaRG contain significantly lower amounts of this miRNA. With this, we corroborate findings in similar systems indicating that miR-122-5p release is a suitable biomarker for hepatocyte injury and also show that absolute quantification of exosomal miR-122-5p may prove more precise. Thus, in our hands, quantitative measurement of exosomal miR-122-5p appears to be a sensitive marker of hepatocellular injury in a 3D-HepaRG-based cell culture system.
Footnotes
Acknowledgments
We would like to acknowledge insight provided by Anna Weston and Michaela Caj that assisted the research. We are thankful to Frank Senner for his help with the analytical methods (HPLC/MS). We would also like to thank Dr. Mohamed Chami from the BioEM-Laboratory at the University of Basel for carrying out the TEM and for providing his expert advice on image interpretation. Finally, we would like to acknowledge the financial support of the Swiss Centre for Applied Human Toxicology (SCAHT) and the Institute for Chemistry and Bioanalytics at the University of Applied Sciences and Arts Northwestern Switzerland.
Author Disclosure Statement
No competing financial interests exist.
Funding Information
Funding was provided by the Swiss Centre for Applied Human Toxicology, Basel, Switzerland University of Applied Sciences of Northwestern Switzerland, School of LIfe Sciences, Muttenz, Switzerland.
References
Supplementary Material
Please find the following supplemental material available below.
For Open Access articles published under a Creative Commons License, all supplemental material carries the same license as the article it is associated with.
For non-Open Access articles published, all supplemental material carries a non-exclusive license, and permission requests for re-use of supplemental material or any part of supplemental material shall be sent directly to the copyright owner as specified in the copyright notice associated with the article.