
Abstract
Inwardly rectifying I K1 potassium currents of the heart control the resting membrane potential of ventricular cardiomyocytes during diastole and contribute to their repolarization after each action potential. Mutations in the gene encoding Kir2.1 channels, which primarily conduct ventricular I K1, are associated with inheritable forms of arrhythmias and sudden cardiac death. Therefore, potential iatrogenic inhibition of Kir2.1-mediated I K1 currents is a cardiosafety concern during new drug discovery and development. Kir2.1 channels are part of the panel of cardiac ion channels currently considered for refined early compound risk assessment within the Comprehensive in vitro Proarrhythmia Assay initiative. In this study, we have validated a cell-based assay allowing functional quantification of Kir2.1 inhibitors using whole-cell recordings of Chinese hamster ovary cells stably expressing human Kir2.1 channels. We reproduced key electrophysiological and pharmacological features known for native I K1, including current enhancement by external potassium and voltage- and concentration-dependent blockade by external barium. Furthermore, the Kir inhibitors ML133, PA-6, and chloroquine, as well as the multichannel inhibitors chloroethylclonidine, chlorpromazine, SKF-96365, and the class III antiarrhythmic agent terikalant demonstrated slowly developing inhibitory activity in the low micromolar range. The robustness of this assay authorizes medium throughput screening for cardiosafety purposes and could help to enrich the currently limited Kir2.1 pharmacology.
Introduction
Inhibition of the voltage-dependent potassium channels Kv11.1, also referred to as human Ether-à-go-go Related Gene (hERG), which mediates the delayed rectifier I Kr potassium current in the heart, has been identified in the 1990's as a central mechanism associated with “Torsades de Pointe” (TdP) arrhythmias and sudden cardiac death. This major cardiosafety issue caused the market withdrawal of a significant number of pharmaceuticals. 1 Disruption of hERG function slows the repolarization phase of the cardiac action potential (AP), increasing its duration and favoring the initiation of early after depolarizations and ventricular arrhythmia, which can degenerate in TdP. 2 In accordance with internationally harmonized guidelines, 3,4 these findings prompted the systematic early cardiosafety benefit/risk assessment of new drug candidates through evaluation of their functional effects at hERG channels in vitro, along with action potential duration (APD) measurements in ex vivo ventricular conductive tissue preparations such as rabbit Purkinje fibers. 5,6 These studies are combined with in vivo measurements of the time interval between Q-wave and T-wave (QT) on the electrocardiogram, typically conducted in conscious dogs, 6,7 and are followed as appropriate by specific thorough QT (TQT) studies during the early clinical development phases.
Despite the fact that these guidelines resulted in no further drugs being withdrawn from the market for arrhythmia liabilities since their implementation, the consistency of the surrogate markers examined as unequivocal predictors of TdP risk has recently been challenged. In addition, their stringency when taken individually as compound prioritization criteria may have generated unnecessary attrition of otherwise efficient and innovative drugs. For example, it has been shown that among nearly one hundred preclinical compounds, hERG inhibition translates into APD prolongation in only half of the cases, with one-third revealing no activity on APD, and one-sixth actually shortening it. Moreover, it was shown that drugs either prolonging or shortening the APD could produce ventricular arrhythmia, at least in excised hearts. 8 Similarly, a retrospective analysis of several tens of advanced candidates, which underwent TQT studies in humans, showed that the predictive value of hERG inhibition alone, while being sensitive, substantially lacks specificity. 9
Hence, several drugs from various pharmacological classes with diverse chemical structures do not induce proarrhythmia in clinical practice, despite being significant hERG inhibitors at therapeutically relevant concentrations. Kramer et al. 10 suggested that, for many of these drugs, the discordance could result from compensatory inhibitory activities at depolarizing cardiac ion channels other than hERG contributing to shape the AP. Specifically, it was shown that among 55 small molecules with a clinically documented high or low TdP risk, additional inhibitory activity at CaV1.2-mediated I Ca,L calcium currents (and to a lesser extend at NaV1.5-mediated I Na peak sodium currents) better describes their cardiosafety profile compared to knowledge of hERG inhibition alone.
The ongoing comprehensive in vitro proarrhythmia assay (CiPA) initiative is a public–private collaboration put in place a few years ago with the objective to propose better ways to predict the proarrhythmic potential of preclinical compounds. This endeavor proposes to address the cardiosafety risk of a compound by combining its inhibitory profile at multiple cardiac ion channels with the predictions of an in silico model of human ventricular electrophysiology previously trained with the inhibitory profile of clinical drugs with documented high, medium, or low torsadogenic potential. The predictions would then be optionally compared with actual measurements on stem cell-derived cardiomyocytes before being assessed by electrocardiography monitoring during the early phases of clinical development. The panel of channels selected for the CiPA profiling comprise the depolarizing CaV1.2- and NaV1.5-mediated I Ca,L and I Na peak and late currents, as well as the repolarizing Kv11.1-, Kv7.1-, Kv4.3-, and Kir2.1-mediated I Kr, I Ks, I to, and I K1 currents. 11 –15 In this study, we have developed a medium throughput screening assay based on automated whole-cell patch-clamp recording of Kir2.1-mediated I K1 currents.
Inwardly rectifying Kir2.1 potassium channels belong to a family of transmembrane proteins sharing the property to flux K+ ions more readily in the inward than in the outward direction. This “biological diode”-like behavior is linked to their voltage-dependent block by cytoplasmic polyamines or magnesium ions, which plug their conduction pore at depolarized voltages. 16,17 Kir2.1 and other members of the Kir2.x subfamily display strong rectification properties and contribute thereby to the control of the membrane resting potential in excitable tissues by constantly dragging the membrane toward the K+ equilibrium potential E K. They also support repolarization following AP firing (reviewed in refs. 18 –21 ).
Despite the dearth of selective and potent pharmacologic agents, 22 and the fact that several different Kir2.x subunits expressed in the heart can assemble into functional heterotetramers, 23 convergent lines of evidence concur to support a primary role for Kir2.1 subunits to conduct I K1 in cardiac ventricles. First, I K1 currents are significantly reduced in rat ventricular cardiomyocyte exposed to antisense oligonucleotides targeting Kir2.1 mRNAs. 24 Second, no I K1 currents can be recorded from cardiac cells in neonate Kir2.1 knockout mice during the few hours they survive. 25 Third, I K1 can be enhanced or decreased in guinea pig hearts treated with adenovirus encoding wild-type Kir2.1 or a dominant-negative mutant Kir2.1 protein, respectively. 26 Fourth, a clear translational path links rare human hereditary diseases involving loss- or gain-of-function mutations in the KCNJ2 gene encoding Kir2.1 subunits with cardiac rhythm abnormalities. 27,28
One important aspect of the evaluation of drug effect at multiple cardiac ion channels pertains to adopting profiling methods reliably assessing the intrinsic activity of test articles using unbiased functional readouts. Authier et al. 29 recently published a survey on current practices in the pharmaceutical industry, indicating that patch-clamp electrophysiology on human ion channels expressed in cell lines is the most common approach to the CiPA ion channel strategy. The development in the last decade of automated planar patch-clamp systems providing gigaseal quality recordings allows sufficient throughput to adequately expedite early cardiosafety support for the curtailed optimization cycles of modern medicinal chemistry. In this study, we undertook the validation of a Kir2.1 assay on such a platform, allowing rapid quantification of drug inhibitory activity to complement an integrated drug discovery cardiosafety liability assessment panel.
Materials and Methods
Kir2.1 Cell Line
A Chinese hamster ovary (CHO) cell line stably expressing the human KCNJ2 gene product (GenBank NM_000891.2) under the control of a tetracycline-inducible promoter was obtained from a commercial source and cultivated according to the vendor instructions (Charles River; Cat. No. CT6127). The cells were grown in a humidified 95% air/5% CO2 atmosphere in Dulbecco's modified Eagle's medium/F-12 Nutrient Mixture (ThermoFisher Scientific) supplemented with 10% fetal bovine serum and the appropriate selection antibiotics (0.01 mg/mL blasticidin and 0.4 mg/mL zeocin). For stock cultures, cells were grown in T175 flasks and passaged every 3–4 days below 80% confluence. Cell detachment was obtained by exposure to TrypLE Select™ (Gibco, ThermoFisher Scientific) for 2–3 min at 37°C. Flasks prepared in view of electrophysiological recordings were typically seeded 2 days before the experiments with an inoculum containing about 2.5 million cells per T175 flask filled with 25–30 mL growth medium. Expression of the Kir2.1 channels was obtained by overnight induction with 1 μg/mL doxycycline added to the growth medium. On the day of recording, detached cells were spun down, washed, resuspended to 5–8 million cells/mL in a glucose-containing extracellular buffer, and placed in the cabinet of a QPatch® 48X workstation (Sophion Bioscience, Denmark). This standalone instrument comprises a robotic pipetting arm ensuring distribution of cell suspensions into disposable 48-well recording plates (QPlates®) and the sequential application of drug solutions at final test concentration, while whole-cell patch-clamp is maintained without interruption. 30
Automated Patch-Clamp
All recordings were performed at room temperature. Experiments aimed at characterizing the electrophysiological properties of the currents were conducted on biochips endowed with a unique pinhole orifice engineered at the bottom of each of the 48 wells of disposable measurement plates (i.e., single-hole QPlates). Currents were activated by application of a series of 500 ms-long square voltage pulses delivered every 90 s and incremented in 5 mV steps from a holding potential of −20 mV. Currents measured over 30 ms at the end of each step served to plot current-voltage (I–V) relationships. In some experiments, the external potassium [K+]out concentration was changed, while maintaining internal [K+]in constant to change the K+ equilibrium potential. In other single-hole recordings, the I–V relationships were established in an external buffer supplemented with various concentrations of alkaline or alkaline-earth metal ions.
Experiments aimed at characterizing the pharmacology of small molecules were conducted with 48-well measurement plates, each fitted with biochips perforated with 10 holes, so that each recording site sums up the signal from multiple cells (i.e., multi-hole QPlates). The voltage protocol used was a step-ramp protocol applied every 30 s, which first stepped the membrane from a holding potential of −20 mV down to −120 mV for 500 ms, then ramped it up to 0 mV over 1 s, and eventually stepped the membrane potential back to −20 mV, where the cells were held until the next voltage cycle. This protocol allowed for long-time (30 min) recordings comprising a stable baseline and ample space for the application of multiple drug concentrations in a row. Moreover, the voltage ramp permitted to check the recording quality over time by monitoring the stability of the zero-current reversal potential value. The size of the inward current measured at the end of the initial hyperpolarizing 500 ms-step to −120 mV was used to evaluate drug effect.
For all experiments, the intracellular recording buffer contained (in mM) 5.37 CaCl2, 1.75 MgCl2, 10 ethylene glycol tetraacetic acid, 10 HEPES, 120 KCl, and 4 Na2-ATP (pH 7.2, 300 mOsm) and the standard extracellular recording buffer contained (in mM) 2 CaCl2, 1 MgCl2, 10 HEPES, 4 KCl, 145 NaCl, and 10 Glucose (pH 7.4, 310 mOsm).
Drugs
All test articles were from Sanofi's internal libraries, except ML133 (CAS Number 1222781-70-5; Wang et al. 31 ), which was obtained from a commercial source (Sigma-Aldrich, Saint-Quentin-Fallavier), and PA-6 (CAS Number 1199627-07-0, Takanari et al. 32 ), a pentamidine derivative, which was synthesized following published procedures and references therein. 32,33 Figure 5 depicts the structural formula and IUPAC chemical names of ML133, PA-6, and the five other small-molecule inhibitors examined in this study. Compounds were dissolved as 10, 50, or 100 mM concentrated stocks in dimethyl sulfoxide (DMSO) using sonication as needed for complete dissolution, then aliquoted into capped polypropylene vials, and kept frozen at −20°C until use. On the day of study, stock solutions were diluted to the final concentrations intended for cell applications in standard 96-well microtiter plates (MTP) containing the extracellular buffer supplemented with 0.06% Pluronic F-68™ (Gibco, ThermoFisher Scientific). The latter surfactant was added to help slow unseen precipitation (if any) of poorly soluble drugs in the MTP wells upon dilution. 34 The final drug solutions also contained 0.3% residual DMSO from the dilution processes. The test article solutions were typically applied to the cells within 30 min of preparation. Concentration–response data were either obtained from the cumulative applications of six increasing concentrations to the same cells within a given recording well, each concentration being exposed for 3 min, or by applying a single different concentration into given wells with an exposure duration extended to 15 min.
Data Handling
Current amplitude measurements and normalization for the fitting of concentration–response curves were done with Sophion's dedicated analysis software (Odense 5.6.4). Time course of current amplitude was visualized offline and analyzed following optional rundown compensation as needed using built-in routines proprietary to this software (uncorrected rundown measured in N = 5 vehicle-treated cells did not exceed 1% per min in single application experiments). All recordings for pharmacological determinations were concluded by the application of a supramaximal concentration (3 mM) of barium as full block. Residual leak currents remaining under full block (if any) were subtracted from precedent data points. A professional graphing package (Prism 7.02; GraphPad Software) was used for drawing exported current traces, plotting I–V curves, and performing statistical calculations. Half-maximal inhibitory concentrations (IC50) were obtained by fitting the average of the two or the five last current amplitude readings at the end of each drug concentration exposure period in a cumulative or noncumulative application mode, respectively. A classical four-parameter Hill equation following normalization with respect to predrug baseline readings was used for data fitting to a sigmoidal curve with minimum and maximum constrained to 0% and 100%, respectively. Estimated IC50 and Hill coefficient (nH) values are reported along with their estimated 95% confidence interval (CI). Mean of individual replicates is represented with their calculated standard deviations shown as error bars on graphs where appropriate.
Results and Discussion
Electrophysiological Characterization
The upper part of Figure 1A illustrates the typical appearance of whole-cell currents recorded from stably transfected CHO cells induced to express the human KCNJ2 gene product. Inward or outward currents reaching steady state within a 100 ms developed when the membrane was stepped tens of mV below or above the K+-equilibrium potential (E K), respectively (Fig. 1A). At more depolarized potentials, the current–voltage (I–V) relationship displayed a strongly inward rectifying profile. This profile fully concurs with the I–V outline of native ventricular I K1 currents. 35 Specifically, the amplitudes of the inward currents below E K grew linearly in proportion to the negativity of the membrane, reaching relatively large values at strong hyperpolarization (e.g., −2.3 ± 0.4 nA at −120 mV, N = 10, Fig. 1B), whereas the positive currents above E K culminated at potentials around −60 to −50 mV (e.g., 0.31 ± 0.09 nA at −60 mV, N = 10, Fig. 1B). Virtually no currents were detected in induced cells at potentials more positive than −20 mV (Fig. 1B) nor at any potential in noninduced CHO cells (Fig. 1A bottom), even when the latter were stepped to very negative potentials (e.g., 0.07 ± 0.05 nA at −120 mV, N = 10), indicating the absence of endogenous I K1-like currents in the host CHO cell line. The success rate of exploitable recordings obtained from single-hole QPlates routinely exceeded half of the 48 wells. For example, statistics derived from N = 3 single-hole QPlates indicated that, from 126 cells, which successfully entered whole-cell mode (i.e., 88% of the 144 theoretically possible), a total of N = 65 cells formerly exhibiting seal resistances well above 200 MΩ provided complete I–V curves after 30-min recording, demonstrating that 52% of the cells recovered satisfactorily from clamp engagement and remained stable during repeated voltage stepping cycles. Figure 1C illustrates the current size frequency distribution for this sample of 65 cells. The median inward steady-state current amplitude at −120 mV was −2.4 nA, along with an interquartile range spreading from −1.7 to −2.9 nA.
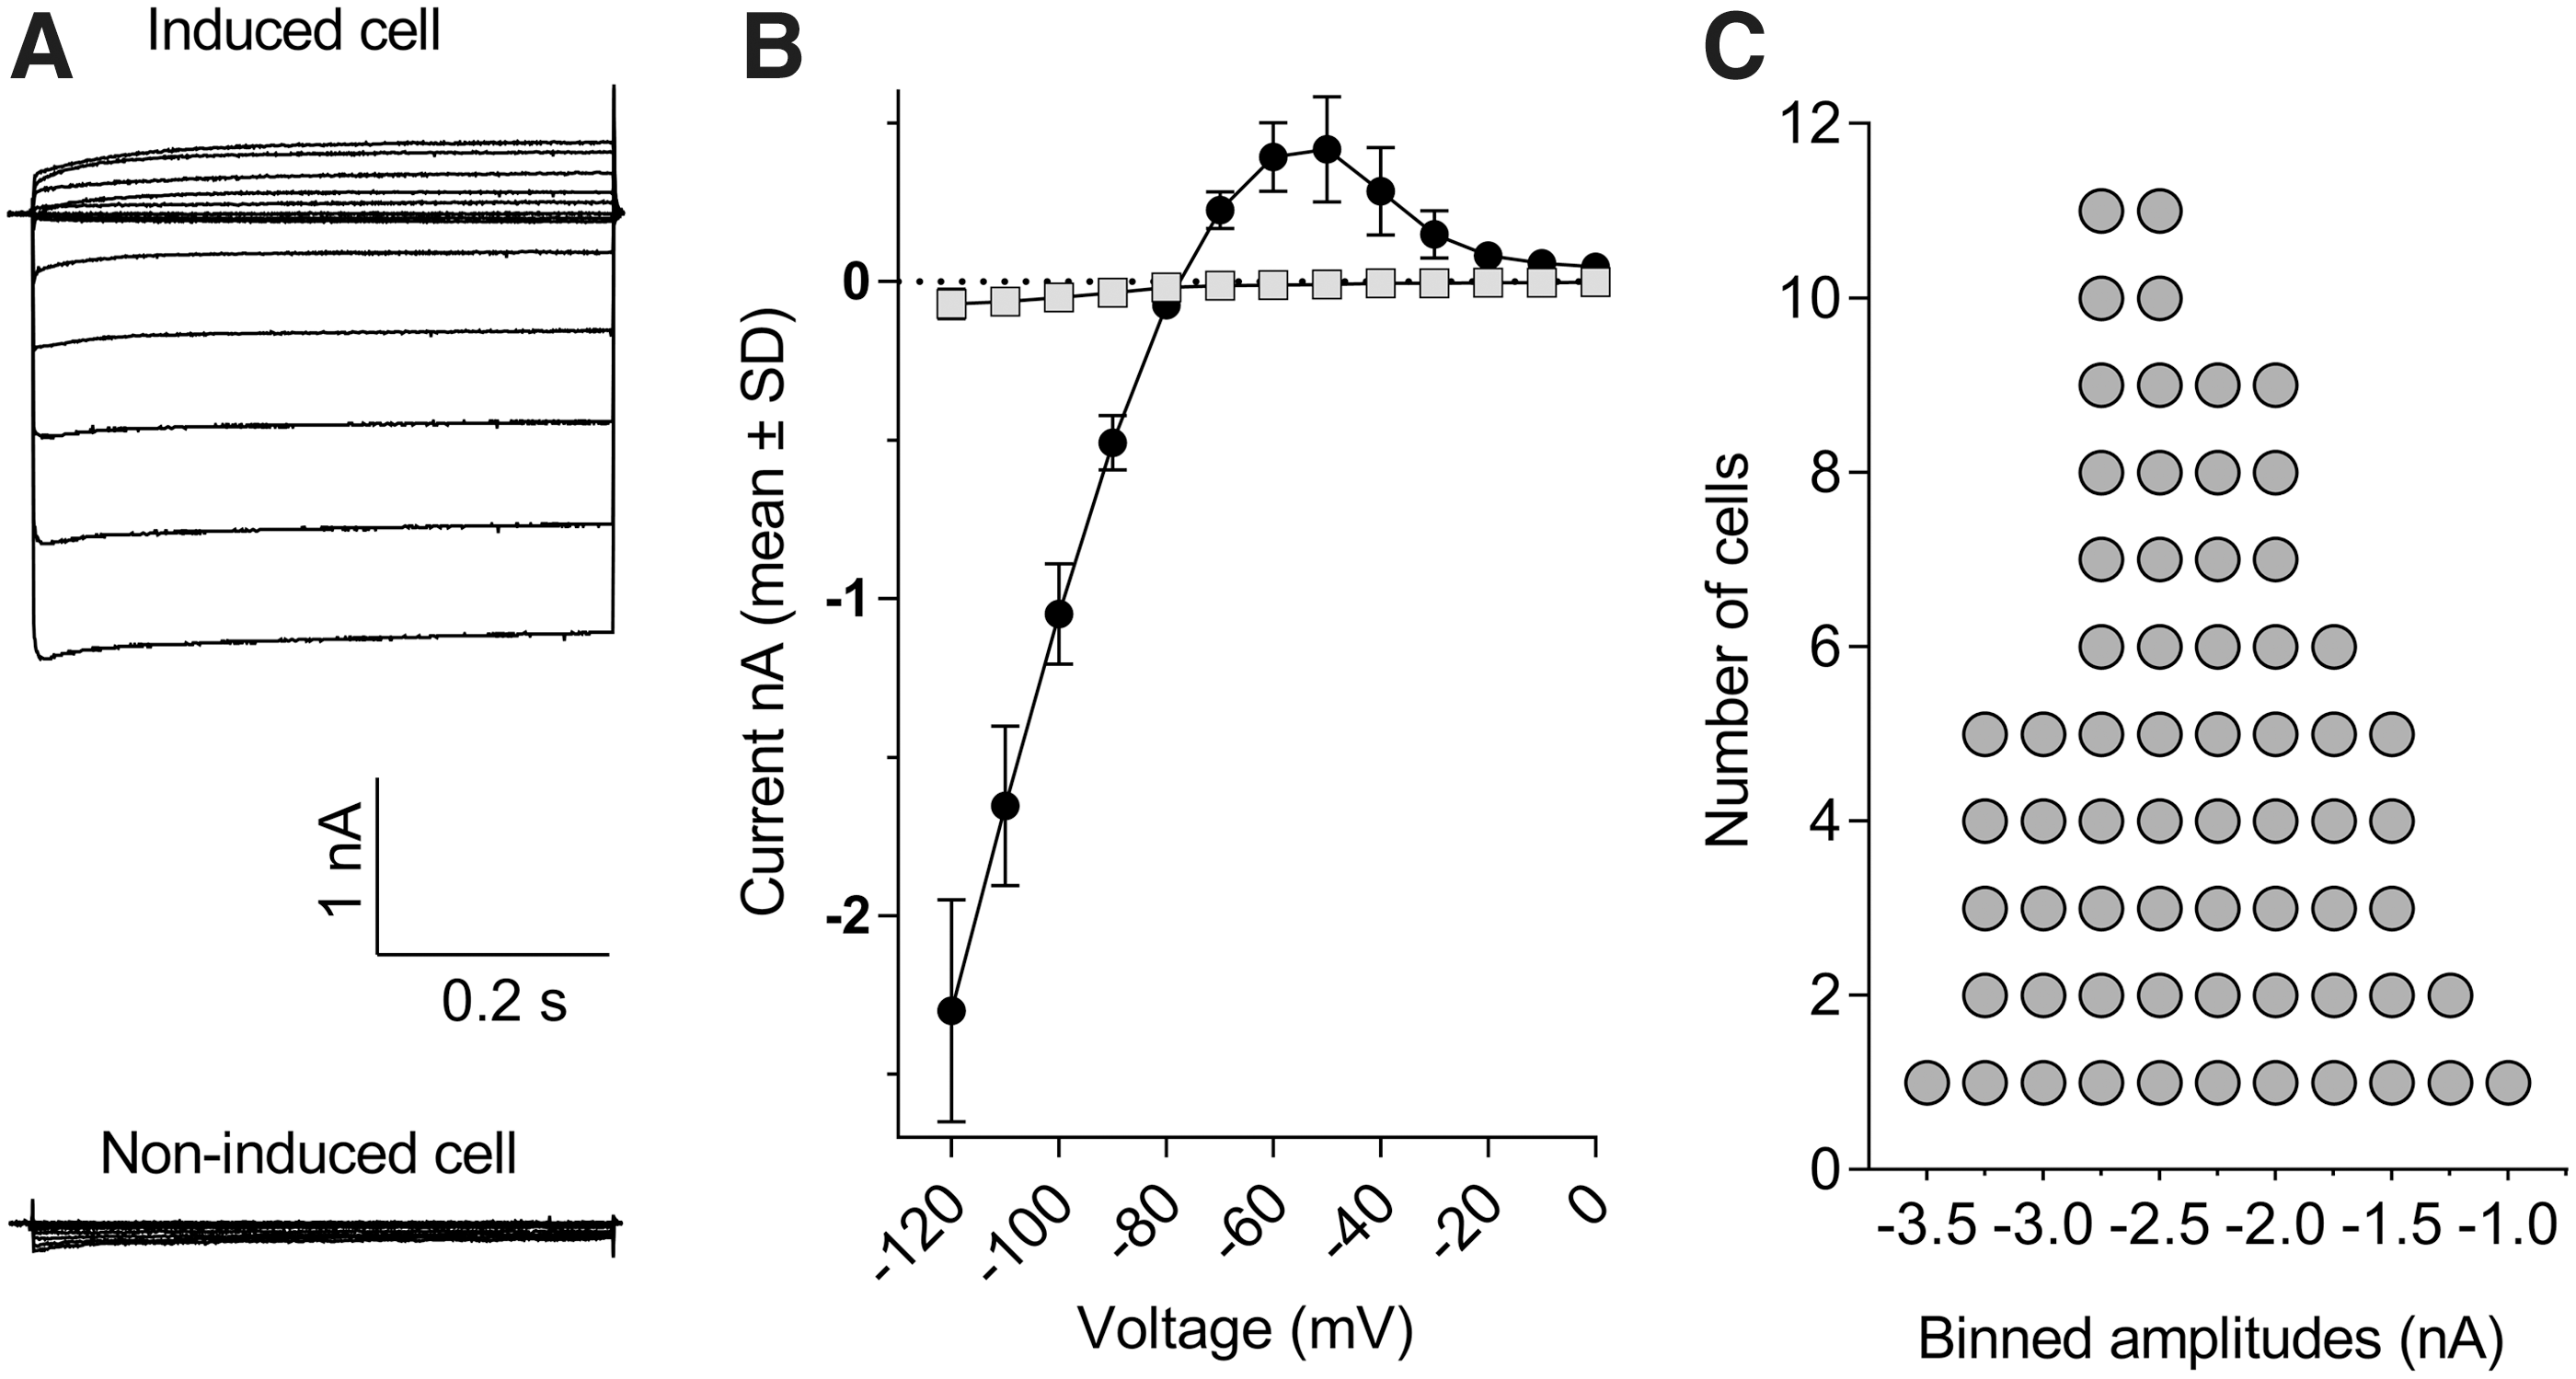
Inward and outward currents in CHO cells stably expressing the human KCNJ2 gene recorded with single-hole QPlates.
A prominent property of currents flowing through Kir2.x channels is their activation by external potassium [K+]out. This counterintuitive behavior (given the decreased electrochemical gradient when [K+]out is increased) results from an increased open-channel conductance in response to elevation of external K+. 36 In the experiments illustrated in Figure 2, [K+]out was varied over four concentrations ranging from 2 to 20 mM, while internal potassium was kept constant at [K+]in = 120 mM. The I–V relationships outlined by the four pairs of buffers exhibited a rightward shift proportional to [K+]out, along with a concomitant increase in the size of both the inward and outward currents. The latter culminated at 0.12 ± 0.06, 0.26 ± 0.08, 0.37 ± 0.10, and 0.74 ± 0.20 nA when the external buffer contained 2, 4, 10, and 20 mM [K+]out, respectively (N = 5–10 cells per condition, Fig. 2). Beyond these maxima, the I–V curves presented regions of negative slope conductance until complete extinction of the currents. Their steepness was also proportional to [K+]out, and the superposition of the outward currents in these voltage regions of the I–V curves draw a series of typical “cross-over” patterns as previously described by others. 35,37 In response to the increasing [K+]out, the zero-current potential of each I–V relationship shifted rightward from −92 ± 1.2 mV at 2 mM [K+]out to −75 ± 2.7 mV, −56 ± 1.5 mV, and −36 ± 1.2 mV for 4, 10, and 20 mM [K+]out, respectively. Linear regression of these data as a function of log [K+]out yielded a highly significant (r 2 = 0.992) fit (Fig. 2, inset) with an estimated 54 ± 3.4 mV shift of the zero-current potential per tenfold variation of external [K+]out, in good agreement with the Nernst equation prediction of 58 mV per decade.
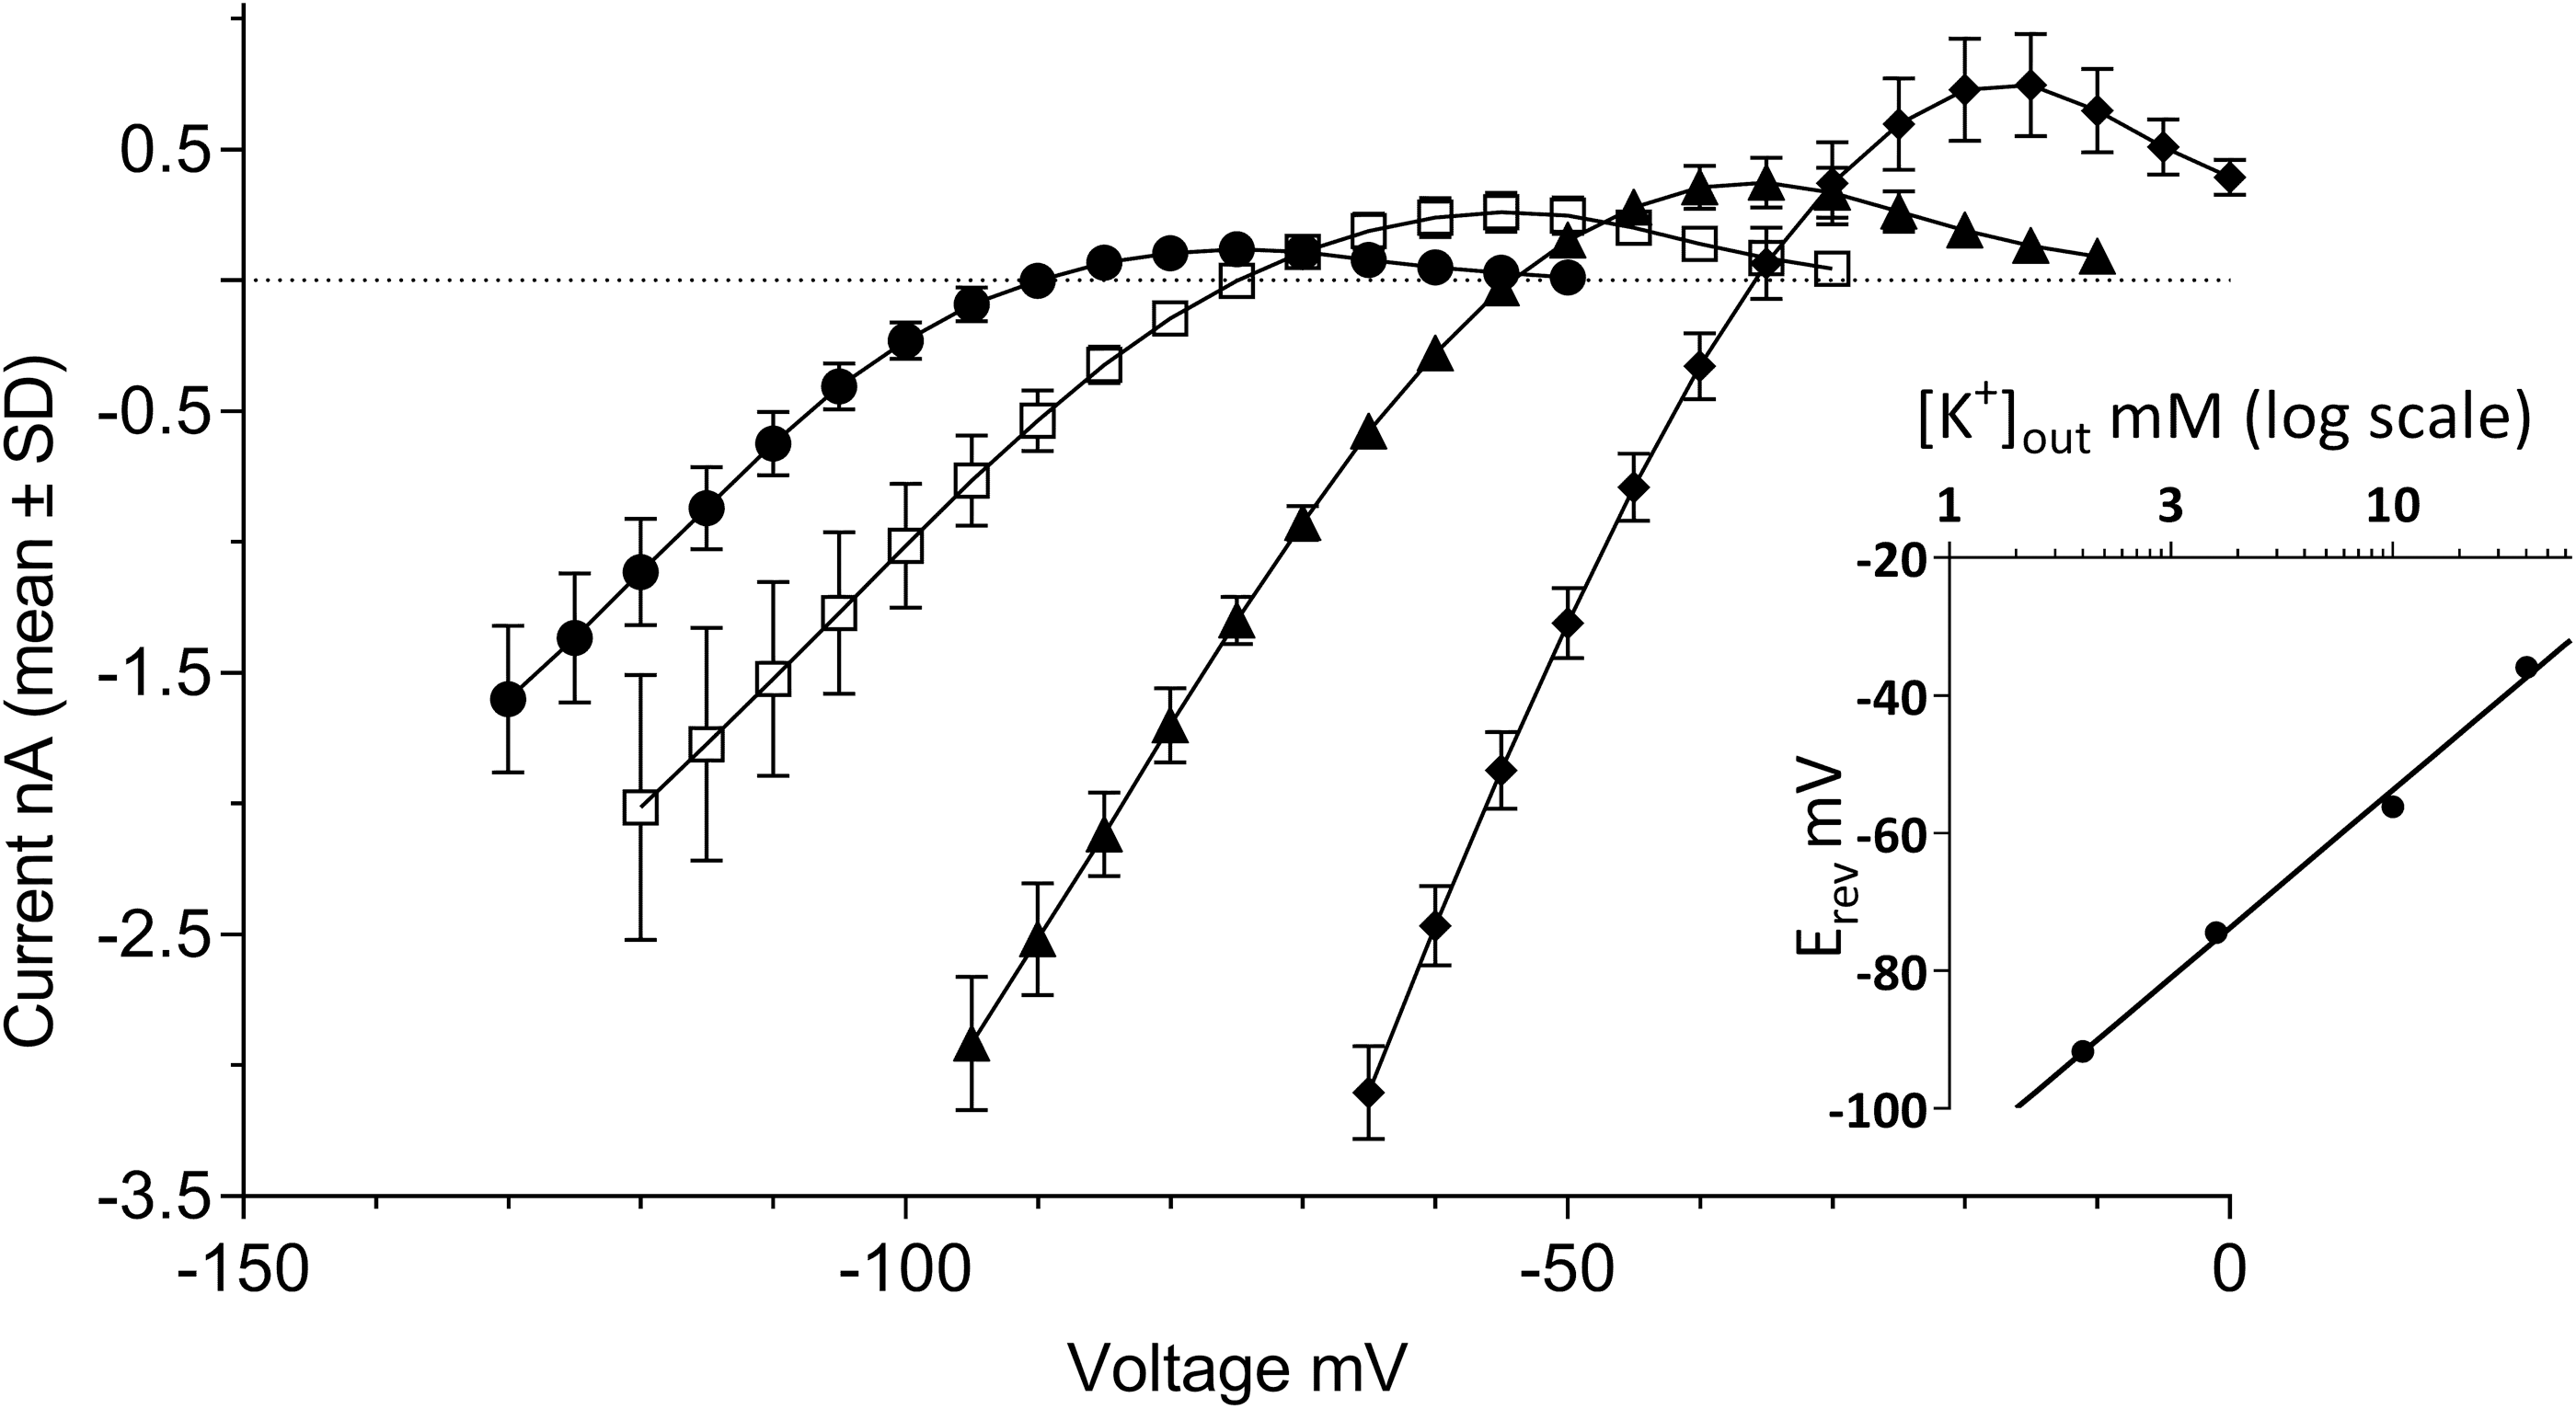
Potassium selectivity of the currents in KCNJ2 expressing CHO cells. The graph shows I–V relationships established in external recording buffer containing various [K+]out concentrations. Steady-state currents were recorded in [K+]out = 2 mM (closed circles), [K+]out = 4 mM (open squares), [K+]out = 10 mM (closed triangles), or [K+]out = 20 mM (closed diamonds). Error bars represent standard deviation for data derived from N = 5–10 cells. The inset depicts a linear regression fit of the log10 of [K+]out concentration to the membrane potential values at which no current is observed (i.e., zero-current reversal potential).
Taken together, the electrophysiological features summarized in Figures 1 and 2 demonstrate rectification properties and activation by external potassium typical of Kir2.1-mediated I K1 currents. Of note, the high yield of decent currents collected simultaneously allowed to expedite the characterization of a number of electrophysiological features with minimal need of experiments.
Pharmacological Characterization
Cations such as Cs+ and Ba2+ are blockers of native I K1 currents in sheep Purkinje fibers, 38 starfish eggs, 39,40 or frog leg muscles, 41 abolishing the influence of [K+]out on the I–V profile and blocking I K1 in a concentration- and voltage-dependent manner. These cations are fast-acting open-channel blockers, reaching steady-state inhibition of the current flow within a few seconds after external exposure. This property was used to document Kir2.1 channels when they were first isolated by expression cloning in Xenopus oocytes. Figure 3 illustrates the effects of micromolar Ba2+ concentrations on Kir2.1-mediated I K1 currents activated by a step-ramp voltage protocol in KCNJ2 expressing CHO cells. As previously described by Kubo et al., 42 external Ba2+ blocked the steady-state current more strongly toward the end of the hyperpolarizing pulses than the initial instantaneous current (Fig. 3A). Moreover, this time-dependent inhibition was also voltage dependent, the channel block increasing when the membrane was stepped to more negative potentials (Fig. 3B). Group data obtained from N = 3 single-hole recordings indicated that the inhibition of the inward current produced by 3 μM Ba2+ reached 17% at −120 mV, increasing to 48% at −150 mV. Similarly, the 58% inhibition of the current afforded by 10 μM Ba2+ at −120 mV rose to 77% at −150 mV. These properties result in characteristic changes in the I–V relationship profile in the presence of Ba2+ (Fig. 3B) and Cs+ ions (data not shown). Figure 3C depicts the time course of the effect of cumulative applications of increasing concentrations of Ba2+ into a multi-hole recording well. The Kir2.1-mediated I K1 currents stabilized within several minutes after whole-cell access. As expected from a fast-acting pore blocker, the inhibitory effect of each cumulatively applied concentration of Ba2+ fully developed within the first couple of voltage-protocol cycles immediately at the beginning of each 3-min application period. The IC50 value (calculated from the average normalized inward current amplitudes collected at the two last voltage steps down to −120 mV of each incubation period) was estimated at 8.2 μM (95% CI: 7.6–8.8 μM, N = 6, Fig. 4). The Hill coefficient (nH) associated to the sigmoidal fit of the normalized data was close to unity (nH = 1.03; 95% CI: 0.96–1.1), consistent with a mechanism involving a single ion blocking each channel pore according to first-order kinetics. Notwithstanding the voltage dependency of the blocking effect of Ba2+, this value is in fairly good agreement with published values on Kir2.1 currents recorded in HEK cells (IC50 = 7.9 μM at −90 mV, Shen et al. 43 ) or Xenopus oocytes (IC50 = 16 μM at —120 mV, Schram et al. 23 ). The time course and the inhibitory effects of Cs+ and Sr2+ ions using the same cumulative concentration–response application protocol were very similarly to Ba2+, exhibiting full inhibitory activity immediately at the beginning of each application period. These blockers were less potent than Ba2+, yielding IC50 values of 833 μM (95% CI: 789–880 μM, N = 12) with nH = 1.07 (95% CI: 1.0–1.1), and 4,585 μM (95% CI: 4,308–4,881 μM, N = 11) with nH = 0.92 (95% CI: 0.87–0.98), respectively (Fig. 4). The potency obtained for Cs+ on human Kir2.1 channels was one order of magnitude weaker than published data for mouse Kir2.1 overexpressed in a murine erythroleukemia cell line (IC50 = 91 μM at —100 mV, Abrams et al. 44 ), raising the possibility that Kir2.1 expression in a conspecific rather than ectopic cell environment affects voltage dependency of Cs+ blockade. We did not find quantitative pharmacological data with which to compare our potency determinations for Sr2+ ions.
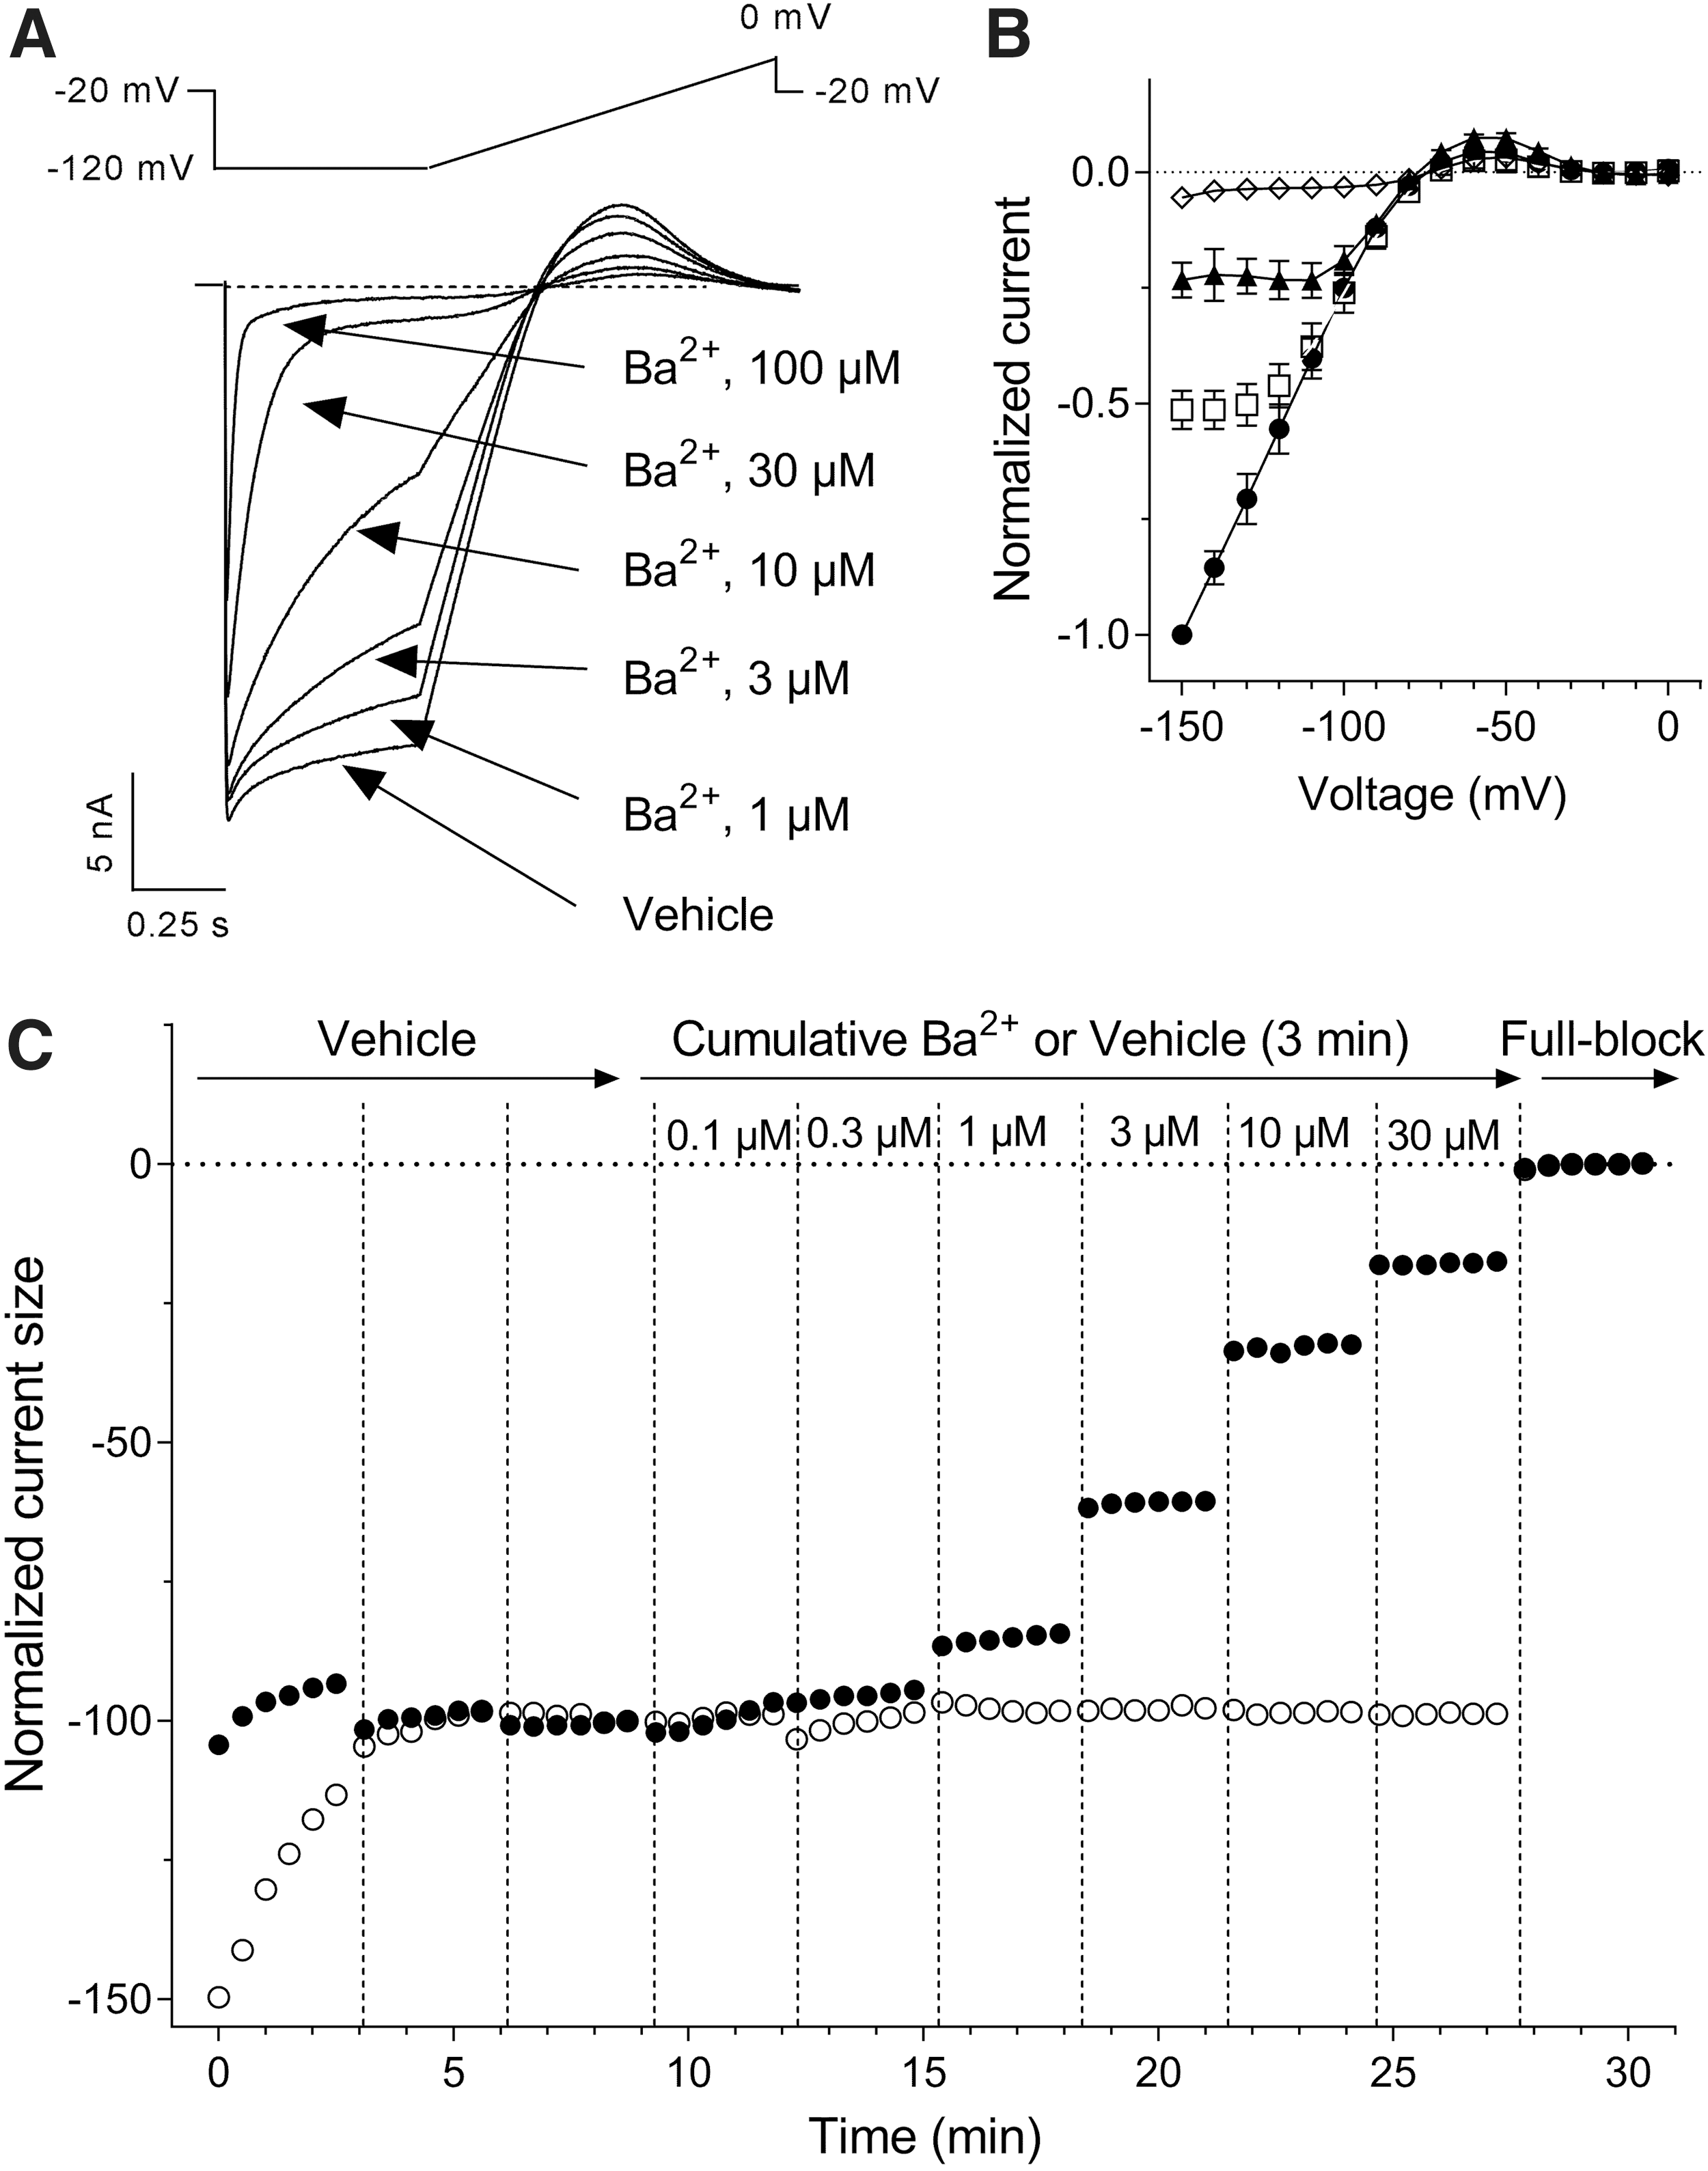
Sensitivity of K+ currents in KCNJ2 expressing cells to external Ba2+ ions.
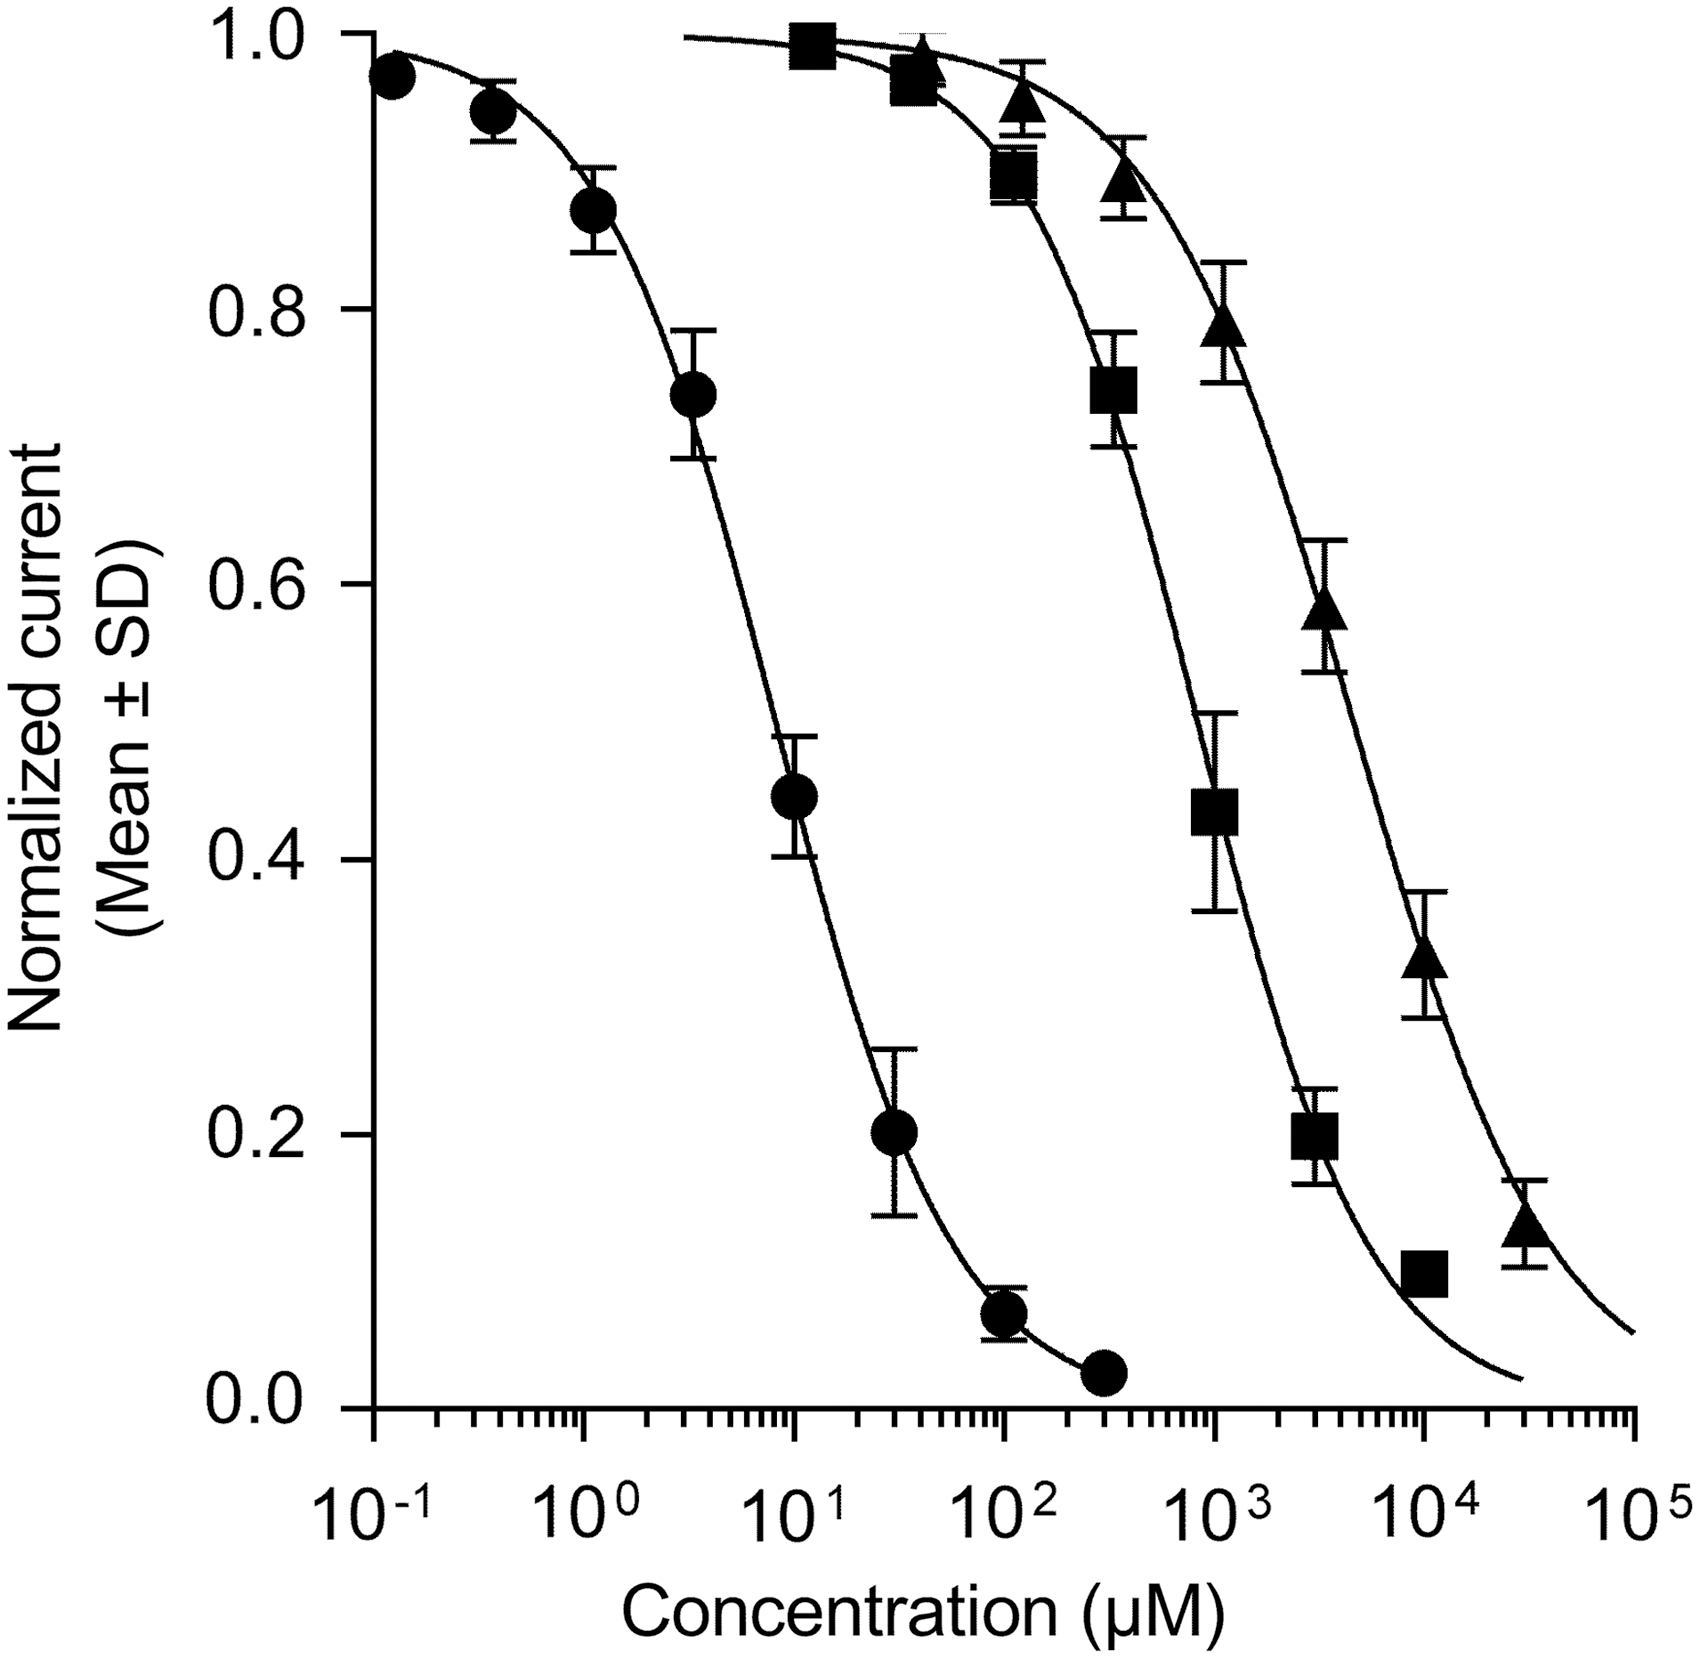
Inhibition of Kir2.1-mediated I K1 currents by alkali or alkaline-earth channel blockers. Ba2+ (circles), Cs+ (squares), and Sr2+ (triangles) ions were tested as chloride salts in multi-hole QPlates. Group estimates were derived from at least N = 3 wells from overlapping concentration ranges applied cumulatively to the same cells (see legend to Fig. 3C and text for details and estimated IC50 values with 95% confidence intervals). IC50, half-maximal inhibitory concentrations
There are currently no selective small-molecule Kir2.1 inhibitors with nanomolar potency described in the literature. 22 Even in the realm of toxins isolated from the venom of poisonous species, which are a rich source of high affinity ion channel modulators, no Kir2.1 selective peptide inhibitors have been described so far. 45 We therefore went on to characterize the pharmacology of the Kir2.1-mediated I K1 currents expressed in CHO cells using seven small-molecule inhibitors displaying micromolar potencies in manual patch-clamp experiments (Fig. 5). We started with the aromatic diamidine derivative PA-6, 32 the methoxybenzyl-methanamide ML133, 31 and the antimalaria drug chloroquine 46 using the six-point cumulative application paradigm adopted with Ba2+ and the other ionic pore blockers. However, the active concentrations of these weak amines did not reach full inhibition within the 3-min exposure periods. Previous studies comparing the inhibitory activity of these compounds in the inside-out and whole-cell patch-clamp configurations evidenced an accelerated inhibition rate and increased potency against Kir2.1 currents when excised patches were assayed. These data pointed to cytoplasmic sites of actions for these three compounds, and further studies with mutants established the involvement of negatively charged glutamate and aspartate residues at the level of the cytoplasmic Kir2.1 pore domain. 31,32,46 In the automated patch-clamp configuration, the time course for inhibition observed for such weak amine test articles applied externally results therefore from a combination of association kinetics at their internal sites of action and membrane permeation of their uncharged molar fraction at neutral pH. Entry by organic cation transporters has been shown for pentamidine, 47 but it remains to be established whether such carriers are significantly expressed in CHO cells. We therefore adopted a noncumulative cell treatment protocol for the evaluation of PA-6, ML133, and chloroquine inhibitory potency. Cells were exposed to single concentrations of each compound in individual wells recorded in parallel. Figure 6A illustrates the time course of the effects of PA-6 when applied at concentrations ranging from 1.25 to 10 μM. Extension of the exposure duration to 15 min proved sufficient to reach stable inhibition for PA-6, ML133, and chloroquine. In contrast to Ba2+, the inhibitory action of PA-6 on the Kir2.1 current traces indicated no time dependency during the hyperpolarizing pulse, displaying identical inhibition on its instantaneous and steady-state components (Fig. 6B). The inhibitory potency of PA-6 calculated on the average current amplitudes collected over the five last voltage steps to −120 mV under drug exposure was IC50 = 1.3 μM (95% CI: 1.2–1.4 μM, N = 3–5, Fig. 6B) along with a Hill slope value near unity (nH = 1.2, 95% CI: 1.2–1.4, Table 1). When tested with the same prolonged 15-min exposure protocol, ML133 and chloroquine yielded micromolar potencies (Table 1). Hill coefficients were close to 1, except for ML133, suggesting a cooperative mechanism of action for this compound independent of its slow kinetics of action as proposed by others. 31 These inhibitory activities are consistent with published data obtained using traditional manual patch-clamp. Thus, whole-cell Kir2.1 currents elicited at −110 mV in KCNJ2-tranfected HEK cells were inhibited by 68% in the presence of 3 μM external PA-6, 48 whereas ML133 showed an IC50 value of 1.8 μM at −100 mV. 31 Similarly, in feline ventricular myocytes, 3 μM chloroquine decreased I K1 currents at −100 mV by 67%. 49
Chemical structure of disclosed compounds with Kir2.1 inhibitory properties evaluated in this study: PA-6, N,N′′-((pentane-1,5-diylbis(oxy))bis(4,1-phenylene)) dibenzimidamide 32 ; ML133, N-(4-methoxybenzyl)-1-(naphthalene-1-yl) methanamine 31 ; Chloroquine, 4-N-(7-chloroquinolin-4-yl)-1-N,1-N-diethylpentane-1,4-diamine 46 ; Chloroethylclonidine, N-[2,6-dichloro-4-[[2-chloroethyl(methyl)amino]methyl]phenyl]-4,5-dihydro-1H-imidazol-2-amine 50 ; Chlorpromazine, 3-(2-chlorophenothiazin-10-yl)-N,N-dimethylpropan-1-amine 51 ; SKF-96365, 1-[2-(4-methoxyphenyl)-2-[3-(4-methoxyphenyl)propoxy]ethyl]imidazole 52 ; Terikalant, 1-[2-[(4S)-3,4-dihydro-2H-chromen-4-yl]ethyl]-4-(3,4-dimethoxyphenyl)piperidine. 53
Slow inhibition of Kir2.1-mediated I
K1 currents by the pentamidine derivative PA-6.
Potencies of Kir2.1 Inhibitors
CI, confidence interval; IC50, half-maximal inhibitory concentrations.
Only a few small-molecule Kir2.1 inhibitors have their molecular mechanism of action deciphered, and this was not an objective of this study. We rather extended our efforts to assess structurally diverse Kir2.1-preferring or multichannel inhibitors to generate a high-quality patch-clamp data set for further pharmacological assay or protocol comparisons. Chloroethylclonidine, 50 chlorpromazine, 51 SKF-96365, 52 and the class III antiarrhythmic agent terikalant 53 are known to affect Kir2.1-mediated I K1 currents in recombinant or native cell systems at micromolar concentrations. We first screened them with the cumulative concentration application mode and observed slow inhibition kinetics for all of them, suggesting common actions at the cytoplasmic side of the Kir2.1 channels. We therefore used the single-concentration noncumulative parallel application mode also for these four compounds; results of these quantitative evaluations are reported in Table 1. Only chloroethylclonidine appeared to reach fast-enough steady-state inhibition fitting a cumulative mode evaluation, which doubled its apparent potency with an IC50 value of 25 μM (95% CI: 23−28 μM, N = 3) compared to the noncumulative application mode (data not shown).
Together with I Kr and I Ks currents flowing through the voltage-gated Kv11.1 and Kv7.1 channels, respectively, I K1 currents contribute to the “repolarization reserve” of the cardiac AP, 2,54 suggesting Kir2.1 as a possible off-target for drug-induced cardiac side effects. Several screening assays for Kir channels have previously been reported based on other readouts and formats. For example, a ratiometric fluorescence resonance energy transfer assay using cells in which Kir-mediated potential changes are triggered by elevation of external [K+]out could be miniaturized to a 1,536-well format. 55 However, although well suited for high-capacity screening, assays based on fluorescence readouts tend to generate significant numbers of false positives. Another screening format utilized yeast strains rendered unable to grow in low [K+]out media by genetic cancellation of their endogenous K+ transporters. Rescue of this phenotype by expression of mammalian Kir2.1 and subsequent optical monitoring of yeast growth inhibition allowed the identification of a novel, although weak, catechol inhibitor. 56 However, expression of mammalian proteins in prokaryotic hosts could lead to folding alterations or yeast-specific glycosylations, which may potentially alter the channel pharmacology. Unfortunately, assays based on cardiomyocytes induced from human pluripotent stem cell cannot be used for the detection of Kir2.1 inhibitors since they express insufficient amounts of I K1 to prevent them from spontaneously depolarizing and automatically beating. 57 Thus, the assay we describe in this study provides a useful tool for cardiovascular safety screening. Furthermore, it provides a platform for the discovery of novel Kir2.1 channel ligands as drug candidates.
Conclusion
We have validated an automated patch-clamp assay for Kir2.1 channels that reproduces cardinal features known for native I K1 currents and that generates concentration–response data for inhibitor tool compounds that agree with manual electrophysiology data. This assay is ready for cardiosafety screening of somewhat larger compound sets advancing toward preclinical development.
Footnotes
Acknowledgments
We are grateful to Luc Bertin and Quentin Janet for the synthesis of PA-6, and to Drs. David Rampe and Rasmus Jacobsen for critical reading of the article before submission.
Disclosure Statement
The authors are current or former employees of Sanofi and declare no conflict of interests.