
Abstract
Metastasis accounts for the poor prognosis of the majority of solid tumors. The phenotypic transition of nonmotile epithelial tumor cells to migratory and invasive “mesenchymal” cells (epithelial-to-mesenchymal transition [EMT]) enables the transit of cancer cells from the primary tumor to distant sites. There is no single marker of EMT; rather, multiple measures are required to define cell state. Thus, the multiparametric capability of high-content screening is ideally suited for the comprehensive analysis of EMT regulators. The aim of this study was to generate a platform to systematically identify functional modulators of tumor cell plasticity using the bladder cancer cell line TSU-Pr1-B1 as a model system. A platform enabling the quantification of key EMT characteristics, cell morphology and mesenchymal intermediate filament vimentin, was developed using the fluorescent whole-cell-tracking reagent CMFDA and a fluorescent promoter reporter construct, respectively. The functional effect of genome-wide modulation of protein-coding genes and miRNAs coupled with those of a collection of small-molecule kinase inhibitors on EMT was assessed using the Target Activation Bioapplication integrated in the Cellomics ArrayScan platform. Data from each of the three screens were integrated to identify a cohort of targets that were subsequently examined in a validation assay using siRNA duplexes. Identification of established regulators of EMT supports the utility of this screening approach and indicated capacity to identify novel regulators of this plasticity program. Pathway analysis coupled with interrogation of cancer-related expression profile databases and other EMT-related screens provided key evidence to prioritize further experimental investigation into the molecular regulators of EMT in cancer cells.
Introduction
Amajor concern in cancer is the metastasis of tumor cells to distant organs, as this accounts for the majority of treatment-refractory cancers and the poor prognosis of the disease. Indeed, metastasis is responsible for ∼90% of cancer deaths. 1 Epithelial-to-mesenchymal transition (EMT), where there is loss of epithelial differentiation and acquisition of a more mesenchymal phenotype, endows tumor cells with migratory and invasive capabilities that enable spread to distant sites. The reverse process, mesenchymal-to-epithelial transition (MET), is implicated in secondary tumor growth where the mesenchymal-like cells readopt epithelial properties to enable colonization at secondary sites. 2,3
While there is no single unique marker of EMT/MET, 4 EMT is typically characterized by the loss of the epithelial cell–cell adhesion molecule E-cadherin and the presence of the mesenchymal intermediate filament protein vimentin. 2,3 Apart from this phenotypic switch, the cells transform from their epithelial cobblestone-like appearance with apicobasal polarity to an elongated and more variable shape. Most of the studies on EMT modulators have focused on one or two pathways to decipher the functions of a given gene and typically use single-parameter assays. High-throughput, high-content screening (HCS) provides a discovery approach that allows multiple cellular parameters to be quantified in a single well enabling a complex biological process to be better understood. To identify modulators of EMT/MET, a multiparametric HCS assay using the TSU-Pr1-B1 bladder cancer cell line 5 was developed using a fluorescent promoter reporter construct based on vimentin and cell morphology. A CMFDA fluorescent whole-cell mask was used to label cells at the end of the experiment to enable cell segmentation and quantitation of cell shape.
We report a multiparametric high-content screen of genome-wide protein-coding siRNA, microRNA, and small-molecule kinase inhibitor libraries to modulate tumor cell epithelial/mesenchymal state in TSU-Pr1-B1 metastatic bladder cancer cells. Multiple phenotypic parameters enable several distinct binning classes to finely dissect EMT. Using a defined analysis pathway, the data obtained using the 3 libraries were integrated and used to provide additional evidence to rank hits, with the goal of minimizing the generation of false positive and false negative results that can occur in RNAi-based screening. Validated hits were subsequently assessed for potential biological significance using gene ontology pathway analysis and association with clinical cancer phenotypes to provide further information regarding their potential role in EMT/MET.
Materials and Methods
Cell Culture
All bacterial culture work utilized the DH5alpha strain of Escherichia coli in either 25 g/L Difco™ LB Broth, Miller or 40 g/L Difco™ LB Agar, Miller (Becton Dickinson) and where required supplemented with 100 μg/mL of carbenicillin or 30 μg/mL of kanamycin.
TSU-Pr1-B1 cells were maintained in Dulbecco-modified Eagle's medium (DMEM), containing 5% fetal bovine serum (FBS), L-glutamine, and 4.5 g/L D-glucose (Gibco®). 5 Cells were routinely passaged at 7.5 × 10⁵ cells per T75 flask (Greiner) using 0.25% trypsin in EDTA. Frozen stocks were stored at 2 × 10⁶ cells per vial in 10% DMSO/20% FBS/DMEM.
Generation of Fluorescent Protein Reporter Constructs and Clonal Cell Lines
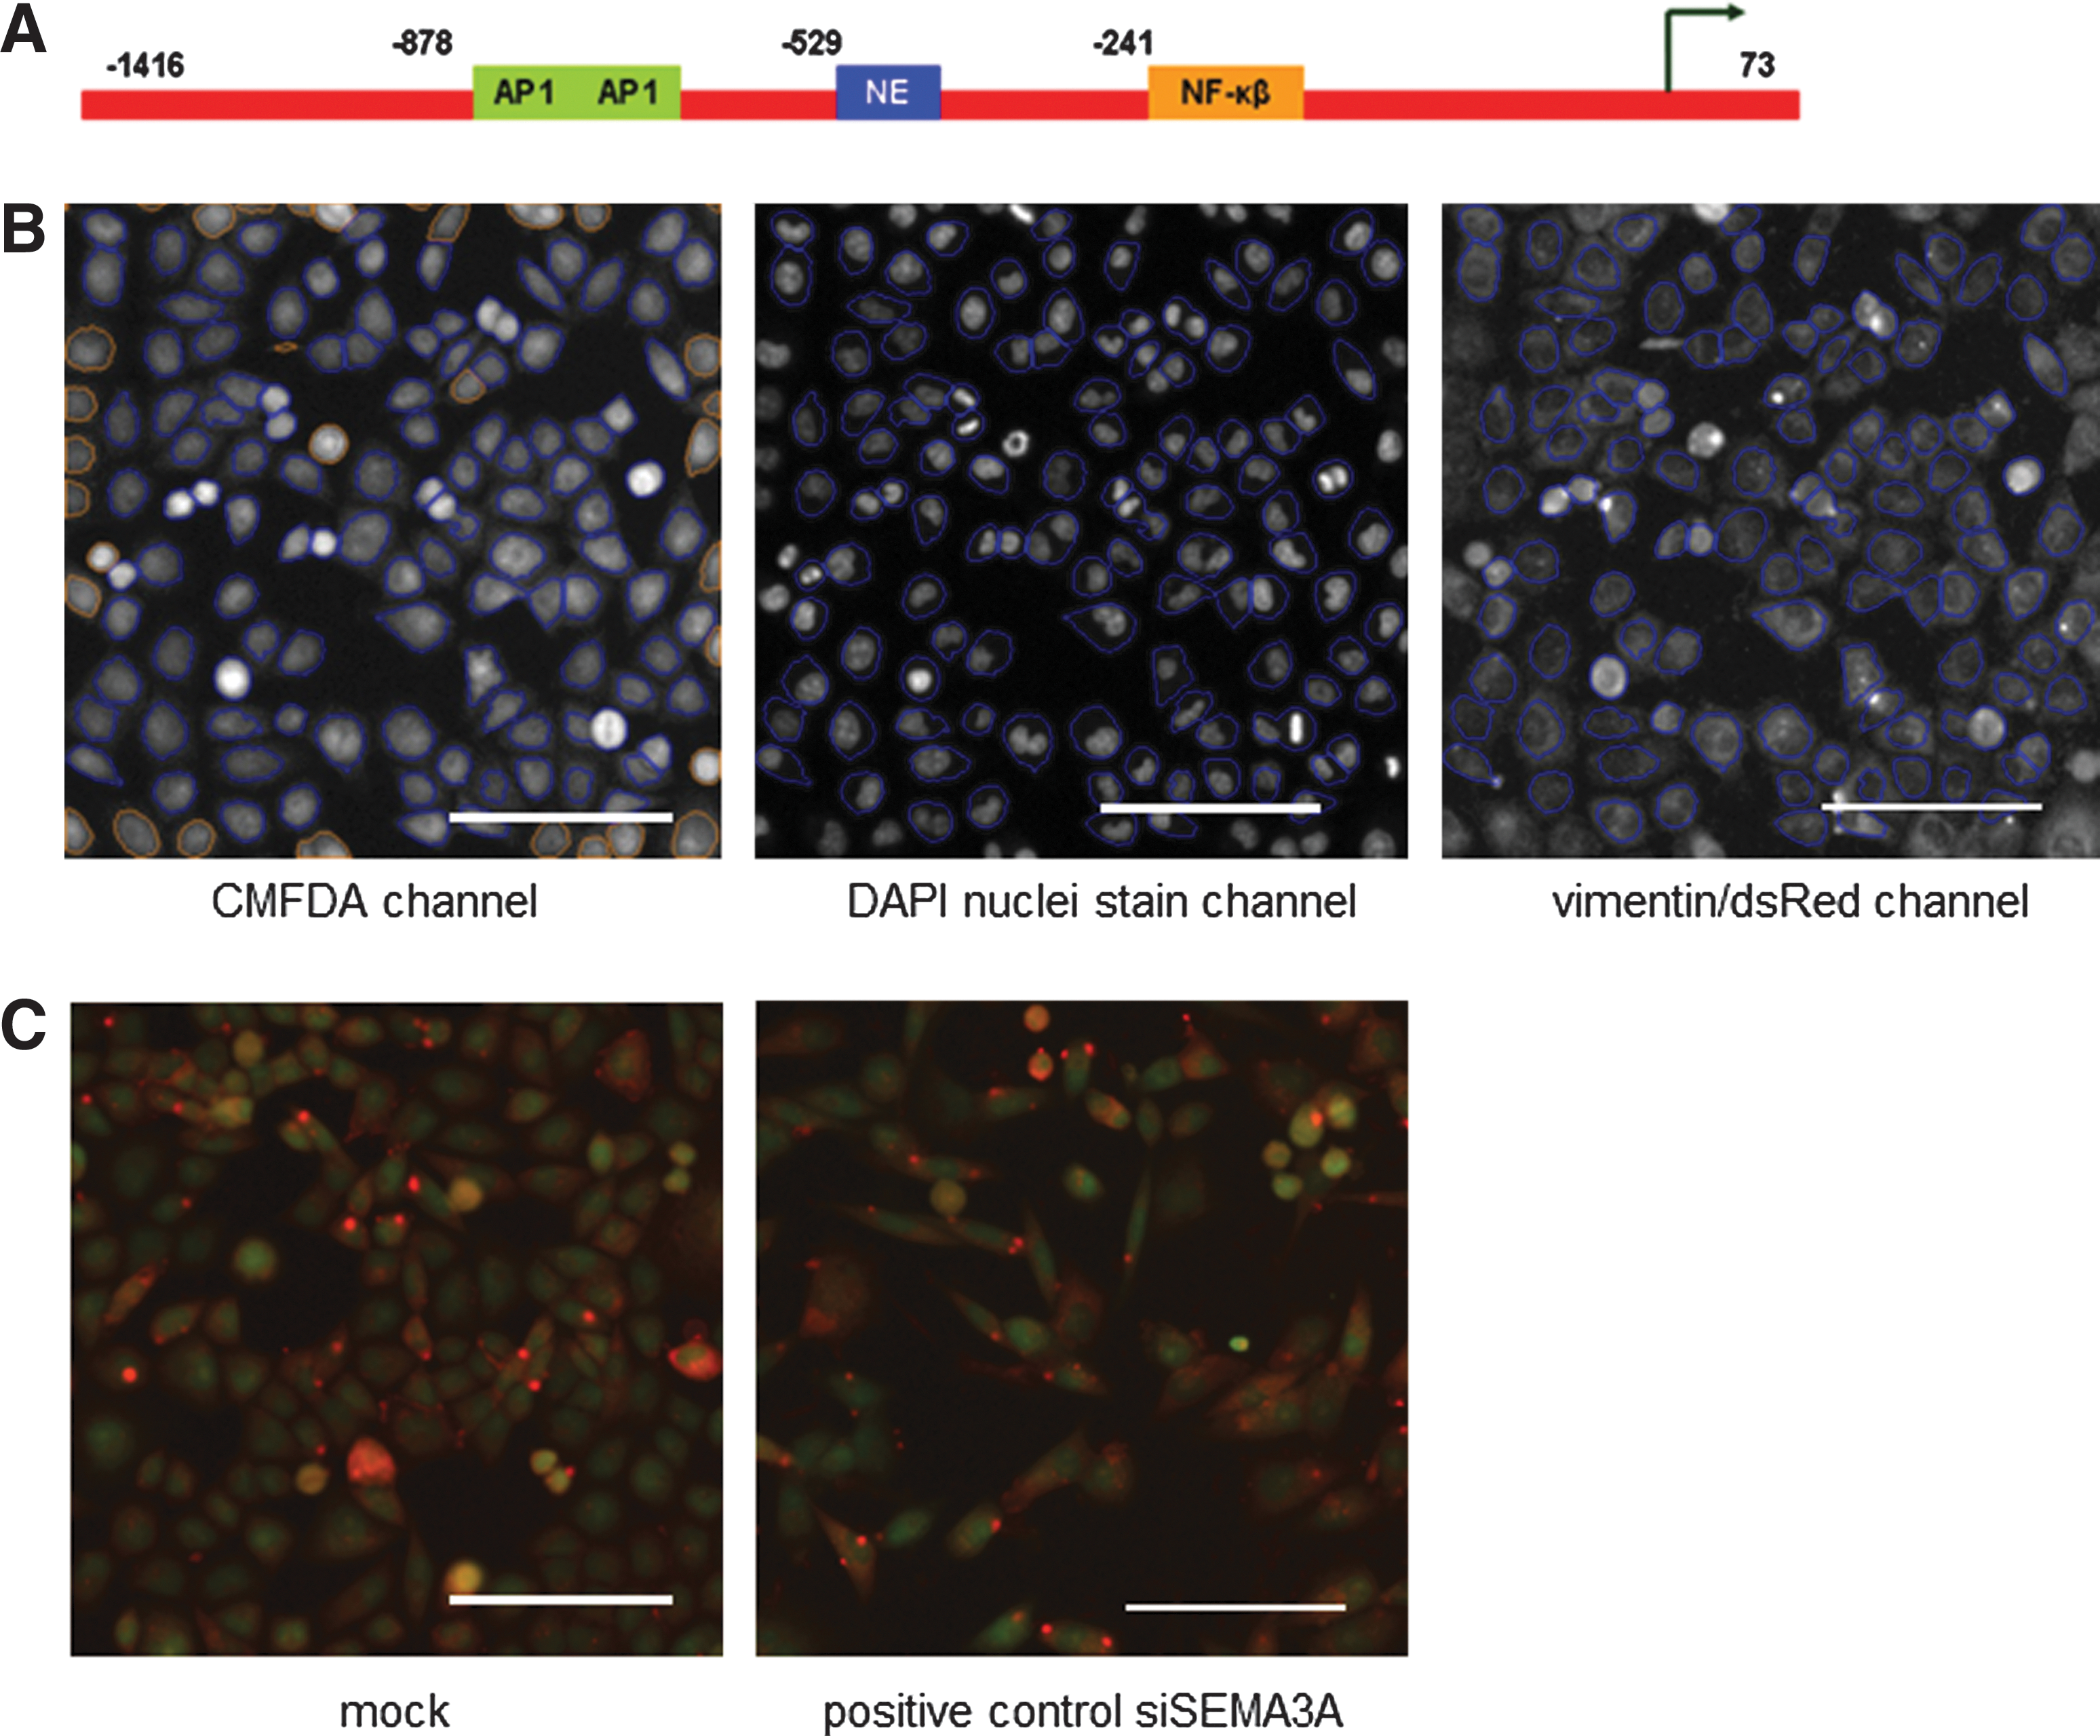
Vimentin fluorescent reporter construct was generated by replacing the CMV promoter using NdeI and SalI sites of the pDsRed2-N1 vector (Clontech) with the vimentin promoter sequences (Fig. 1A; Supplementary Materials and Methods
; Supplementary Fig. S1; Supplementary Data are available online at
Development of the reporter and screen imaging.
Stable transfectants were cloned individually by limiting dilution (Supplementary Materials and Methods). Cell suspensions (100 μL) were aliquoted into 96-well plates at a concentration of 0.5 cells/well, 3 cells/well, and 10 cells/well. The presence of a single cell per well was verified by microscopy and monitored for proliferation. Viable clones were expanded and the presence of the fluorescent vector was confirmed using the Arrayscan VTi high-content microscope (Cellomics) and FACS sorted (MoFlo™ Flow Cytometer machine; Beckman Coulter) based on dsRed expression.
High-Content Screen
Cell lines were maintained in culture medium as described previously, supplemented with 800 μg/mL geneticin (Life Technologies). Cells were resuscitated from the cell bank (passage number 46, 2×10⁶ cells per vial), and passaged twice (seeded at 7.5×10⁵ cells per T75 flask at each passage every 3 days) prior to each experiment. The same serum batch (Life Technologies) was used for the entire screen.
The HCS protocol is summarized in Table 1. A Biotek 406 liquid dispenser/plate washer (BioTek) was used to dispense cells, change media, add transfection reagent, and fix and stain cells. The z-height was set at a conservative level of 42 for all aspirating steps, leaving 15 μL residual volume. A Caliper Sciclone ALH3000 (Caliper LifeSciencesA) liquid-handling robot was used to deliver the siRNA to the lipid for complexing.
High-Content Screening Assay Protocol Table
For siRNA/miRNA:
1a. siRNA/miRNA screening was performed in duplicate using 384-well, black-walled, clear-bottom plates (Corning 3712). The lipid/DMEM mixture was dispensed using the Biotek platform in a tissue culture hood.
1b. siRNA addition was performed using the Caliper liquid-handling robot. Controls were preplated at final concentration. For siRNA and miRNA, controls are in the following positions: mock in wells A02, B02, F02, G02, J02, N02, O02, P02, A23, B23, C23, E23, I23, K23, O23, P23; siSEMA3A in wells D02, I02, K02, F23, L23, N23; Columns 1 and 24 were left empty.
1c. Plates were incubated at room temperature.
For kinase inhibitors:
1a. Each compound was used at 11 concentrations in 384-well, black-walled, clear-bottom plates (Corning 3712). Medium containing the drugs was prepared at Walter and Eliza Hall Institute of Medical Research before transportation to the Victorian Centre for Functional Genomics (VCFG) for cell dispensing. For kinase inhibitor screening, columns 1–11 or 12–22 contain 11 point concentrations of each compound. Controls are in the following positions: siSEMA3A in wells F23, G23, H23, J23, L23, M23, and N23; column 24 was mock treatment.
2. Cell plating was using the Biotek instrument in geneticin-free media.
3. The plates were gently centrifuged at low speed (pulse-centrifuge to 500g) before incubation.
4. Complete growth media change (DMEM containing 5% fetal bovine serum) was performed using the Biotek platform in a tissue culture hood.
5. Media were removed using the Biotek platform and cells were stained with 5-chloromethylfluorescein diacetate (CellTracker™ Green CMFDA; Invitrogen). The lyophilized CMFDA was dissolved in high-quality dimethyl sulfoxide (DMSO) to a 1 mM stock solution and then diluted to a final working concentration of 1 μM in serum-free medium and prewarmed to 37°C prior to adding to plates.
6. Plates were incubated at 37°C.
7. The dye working solution was replaced with fresh, prewarmed medium with serum.
8. Plates were incubated at 37°C.
9. Media were removed and freshly made 4% paraformaldehyde in PBS was added using the Biotek platform.
10. Plates were incubated at room temperature.
11. The fixation buffer was removed. DAPI was diluted in DMEM (1:1,000 dilutions for 1 μg/mL final concentration) and added to wells.
12. Plates were wrapped in aluminum foil to protect from light and incubated at room temperature.
13. Plates were sealed using an aluminum foil heat sealer (Velocity 11).
14. The imaging channels used were XF93-Hoechst (402 nm), XF93-FITC (488 nm), and XF83-TRITC (558 nm); 0.06 s, 0.005 s, and 0.46 s exposure.
DAPI, 4′,6-diamidino-2-phenylindole; DMEM, Dulbecco-modified Eagle's medium; PBS, phosphate-buffered saline.
Black-walled, clear-bottom plates (384 wells; Corning 3712) were used for all HCS. Lipofectamine RNAiMax (Life Technologies) was used for all siRNA and miRNA transfections at 0.06 μL per well. All siRNA and miRNA reagents (Dharmacon RNAi Technologies) were hydrated in 1×siRNA resuspension buffer and transfected in duplicate at a final concentration of 40 nM for the SMARTpool primary screen, 25 nM for the individual siRNA duplex secondary validation screen, and 25 nM for the miRNA screens. Reagents were complexed with lipid:Opti-MEM for 20 min at room temperature before the addition of 1,200 cells per well in geneticin-free media. Media were changed at 24 h post-transfection and the assay was completed at 72 h post-transfection. For the siRNA and miRNA screens, mock transfection (lipid only, 16 wells) was used as the negative control and siSEMA3A SMARTpool (M-020091-01, 6 wells) was used as a positive control for morphology. siGENOME nontargeting control SMARTpool #1 (catalog number D-001206-13; Dharmacon) was also trialed as a negative control, but variable phenotypic effects were observed that were inconsistent with lipid-only transfection and other protein-coding targets that did not cause a functional effect. We considered it most likely that this control was causing off-target effects in our specific cell line that coupled with the sensitive assay readout was resulting in phenotypic changes, and therefore chose to normalize all data to the lipid-only control. The Dharmacon SMARTpool protein-coding genome (18,120 targets, RefSeq57, catalogue numbers: G-003505, G-003605, G-003705, G-003805, G-004655, G-005005, G-005105, G-005615, G-005625, and G-005635; Dharmacon) and miRNA mimic (1,239 targets, miRBase16, catalogue number C-300879-01; Dharmacon) and inhibitor (1,224 targets, miRBase16, catalog number IH-300707-08; Dharmacon) collections were used for screening. The siRNA and miRNA screens were performed using duplicate plates. The top 400 gene targets, binned as hits based on multiple data integration (see “Integration of siRNA, miRNA, and Kinase Inhibitor Libraries” section), were cherry picked as individual siRNA duplexes into 384-well plates with additional transfection controls (mock transfection, siSEMA3A as well as siCDH22 [catalog number M-013099-00-0005; Dharmacon], which was identified during primary screening as a positive control for vimentin/dsRed reporter intensity) and edges were excluded. Duplexes were transfected at a final concentration of 25 nM each and the procedure was followed as per the primary screen.
At 72 h post-transfection, media were removed using the Biotek 406 and cells were stained with 5-chloromethylfluorescein diacetate (CellTracker Green CMFDA; Life Technologies) at a final concentration of 1 μM in serum-free medium. After 30-min incubation at 37°C, the dye was removed and replaced with fresh, prewarmed serum-containing medium and incubated for 30 min. Cells were then fixed in 25 μL of 4% paraformaldehyde (Sigma-Aldrich) in phosphate-buffered saline (PBS) for 10 min, followed by nuclear staining with 4′,6-diamidino-2-phenylindole (DAPI; 25 μL of 1 μg/mL stock) for 20 min at room temperature. DAPI was replaced with 50 μL PBS, plates were sealed with foil covers, and cells were imaged at room temperature as described below.
The small-molecule kinase inhibitor library consisted of 131 commercially available kinase inhibitors (Supplementary Table S1; SYNthesis Med Chem Pty Ltd). Each compound was dissolved in DMSO and, diluted in culture media, added directly to assay plates before cell dispensing (1,200 cells in 25 μL DMEM per well). Compounds were screened at 11 distinct concentrations ranging from 0.01 to 10 μM in 384-well-plate format. DMSO-only treatment (0.2%) was used as the negative control. Following a 48-h incubation, the experiment was concluded as per the siRNA/miRNA screens.
Image Acquisition and Analysis
A fully automated Cellomics Arrayscan® VT1 high-throughput microscope equipped with Cellomics Bioapplication software (Cellomics; Thermo Fisher) with a 20× objective was used to identify 1,000 cells from 25 fields per well. Images were acquired in three channels: Channel 1 for cytoplasmic CMFDA (XF93-FITC filter), Channel 2 for nuclear DAPI (XF93 Hoechst filter), and Channel 3 for the vimentin/dsRed reporter channel (XF93-TRITC filter). The Target Activation V3 Bioapplication was used for analysis. Cell segmentation occurred in the CMFDA channel followed by identification of nuclei in the DAPI channel and quantitation of vimentin promoter expression in the dsRed channel (Fig. 1B). A responder was defined as having cells whose cell shape and/or vimentin/dsRed reporter intensity level was greater than the 95th percentile of the mock transfected population of cells. The threshold was determined by evaluation of 4 mock transfection reference wells included in the same positions on each independent plate. This calculation is one of the predefined settings in the Cellomics bioapplication and uses the operator-designated reference (here mock wells) to identify the interventions that produce a response beyond two standard deviation away from the mean of the reference population. The outputs recorded were as follows: cell health (SelectedObjectCount, ValidFieldCount, and SelectedObjectCountPerValidField), percentage of responder of cells above the reference-well-defined average object length width ratio (LWR) to measure morphological change (%RESPONDER_ObjectShapeLWRCh1), and percentage of responder of cells above the reference-well-defined average intensity to measure reporter activity (%RESPONDER_TotalIntenCh3 and %RESPONDER_AvgIntenCh3).
Screen metrics reported the Z′ factor for the %RESPONDER_ObjectShapeLWRCh1 readout between the positive (siSEMA3A) and negative (mock) controls. The average, standard deviation, and % coefficient of variation (%CV) were reported for all controls to measure reproducibility. Plate-specific metrics included analysis of replicate correlation (Pearson and Spearman correlation coefficients), whole-screen scatter plots, and normal Q-Q plots. siRNAs/miRNAs with cytotoxic effects were identified by a low cell count (<500 cells in 25 fields) and were removed from further analysis and calculation of the robust z-score. The formula used for robust z-score was
Four hundred siRNA targets were selected for validation via deconvolution of the SMARTpools into their constituent siRNAs and rescreening using the same technical parameters described earlier. The validation screen met all standard quality-control parameters. Given these targets were theoretically hits, the robust z-score strategy for analysis could not be applied and therefore fold change relative to mock was used. Wells that scored cell viability of <0.5-fold change to mock were excluded from further analysis. The threshold cutoff for the LWR mesenchymal (LWRM) bin was defined as 13.5, which was three-fold the average of the LWR mock control value (mean=4.53, standard deviation=0.7). The threshold for the vimentin/dsRed reporter intensity readout was set at 22.16, which represented 20% of the minimum value in the primary 400 hits for vimentin and was calculated based on the intensity values associated with the revised z-score of ≥4 used to take candidates through from the primary screen. Any gene that scored at least 2 of 4 siRNA duplexes recapitulating the SMARTpool phenotype was defined as a high-confidence-validated target.
Data Mining of Hits
Enrichment analysis to identify significant pathways and process networks associated with the gene set of interest was performed using Metacore (
Results
Promoter Reporter
To utilize the vimentin promoter as a mesenchymal reporter, the human vimentin promoter sequence was isolated, a serial deletion was generated, and constructs were assessed for activity by measuring luciferase activity in transiently transfected TSU-Pr1-B1 cells (Supplementary Fig. S1). The construct with the highest reporter activity (V1) was then transferred to a fluorescent reporter construct and stably transfected TSU-Pr1-B1 clones were generated. E-cadherin promoter reporter constructs were assessed using the same strategy, but as they did not generate a strong robust signal in the TSU-Pr1-B1 cell system they were not further developed as a measure for HCS (Supplementary Fig. S2).
SMARTpool Protein-Coding Library Screen
Transfection and HCS assay optimization were established for the TSU-Pr1-B1 cells using the mock transfection together with siSEMA3A as a positive control. In comparison to controls, knockdown of SEMA3A produced a significant increase in morphological change as measured by the LWR (20% responders for experimental siSEMA3A and 17% for siSEMA3A-transfected positive controls compared with 5% for mock transfected cells) without any effect on vimentin reporter intensity (Fig. 1C).
The genome-scale siRNA and miRNA screens were performed in duplicate and individual plate control pairs (mock versus siSEMA3A) were required to meet a Z′ factor of >0.3 and a %CV of <25% in order to be considered for further analysis. All screen plate pairs required a Pearson correlation coefficient of >0.8. When assessed across the entire screen, the %CV for cell number and LWR metrics was well within the required range: %CV cell number was 3% for mock and siSEMA3A and %CV LWR for mock was 17% and for siSEMA3A was 10%. However, there was greater variability in %CV across the screen in vimentin/dsRed reporter intensity with 60% for mock and siSEMA3A. As a result, we considered this marker as a secondary readout after LWR and we applied a more stringent robust z-score cutoff for this parameter.
We observed an overall cell death rate of ∼10% of targets in this screen (defining death as a fold change of <0.5 relative to mock wells). A number of the targets that when knocked down significantly reduced cell viability belonged to overlapping gene ontology categories of mRNA processing (P=7.6×10⁻¹², 48 genes in data of 160), mitosis (P=7.6×10⁻⁶, 38 genes), spindle microtubules (P=7.6×10⁻⁵, 25 genes), regulation of cytoskeleton rearrangement (P=7.6×10⁻⁵, 36 genes), cell cycle G2M (P=4.2×10⁻⁵, 40 genes), and translation initiation (P=1.0×10⁻³, 31 genes). Targets that caused cell death were excluded from the robust z-score analysis to reduce false positives.
For binning and hit identification for the siRNA and miRNA screens, the samples on each plate were normalized to the average mock control wells and the robust z-score was calculated on the normalized samples for both the %RESPONDER_ObjectShapeLWRCh1 and the %RESPONDER_TotalIntenCh3 readouts on a per plate basis (sample-based normalization). The duplicate plates were averaged and a robust z-score was calculated across all the library plates. Samples with disparate values between replicates (>25% difference between the A and B plate values) were excluded from further analysis. Robust z-score cutoffs of ≤−2 or ≥2 were used to identify an initial hit list. Since this assay involves two key parameters, LWR and reporter activity, the binning was designed to capture both double-positive and single-positive hits (Table 2).
Overview of siRNA Screen
Revised z-scores. LWRM and VHM: LWRM z-score ≥3 or VHM z-score ≥4; LWRM z-score ≥5; VHM z-score ≥6.
Assembled from integrated analysis of siRNA, miRNA, and kinase inhibitor library screens.
LC, low cell count; LWRE, length width ratio epithelial; LWRM, length width ratio mesenchymal; NC, no change; VHE, vimentin promoter dsRED reporter activity associated with increased epithelial-like properties; VHM, vimentin promoter dsRED reporter activity associated with increased mesenchymal-like properties.
For LWR, a robust z-score of >2 was assigned as LWRM (i.e., the cells are shifting to a mesenchymal-like phenotype), while a robust z-score of <−2 was assigned LWR epithelial (LWRE) (shifting toward a more epithelial-like phenotype). Likewise for vimentin/dsRed reporter activity, a robust z-score of >2 was assigned as VHM (vimentin promoter dsRED reporter activity associated with increased mesenchymal-like properties) and <−2 assigned as VHE (vimentin promoter dsRED reporter activity associated with increased epithelial-like properties). Applying a robust z-score cutoff of ≥2 there was a 17% hit rate across the primary siRNA SMARTpool screen. The breakdown of hits and representative images are shown in Table 2 and Figure 2.
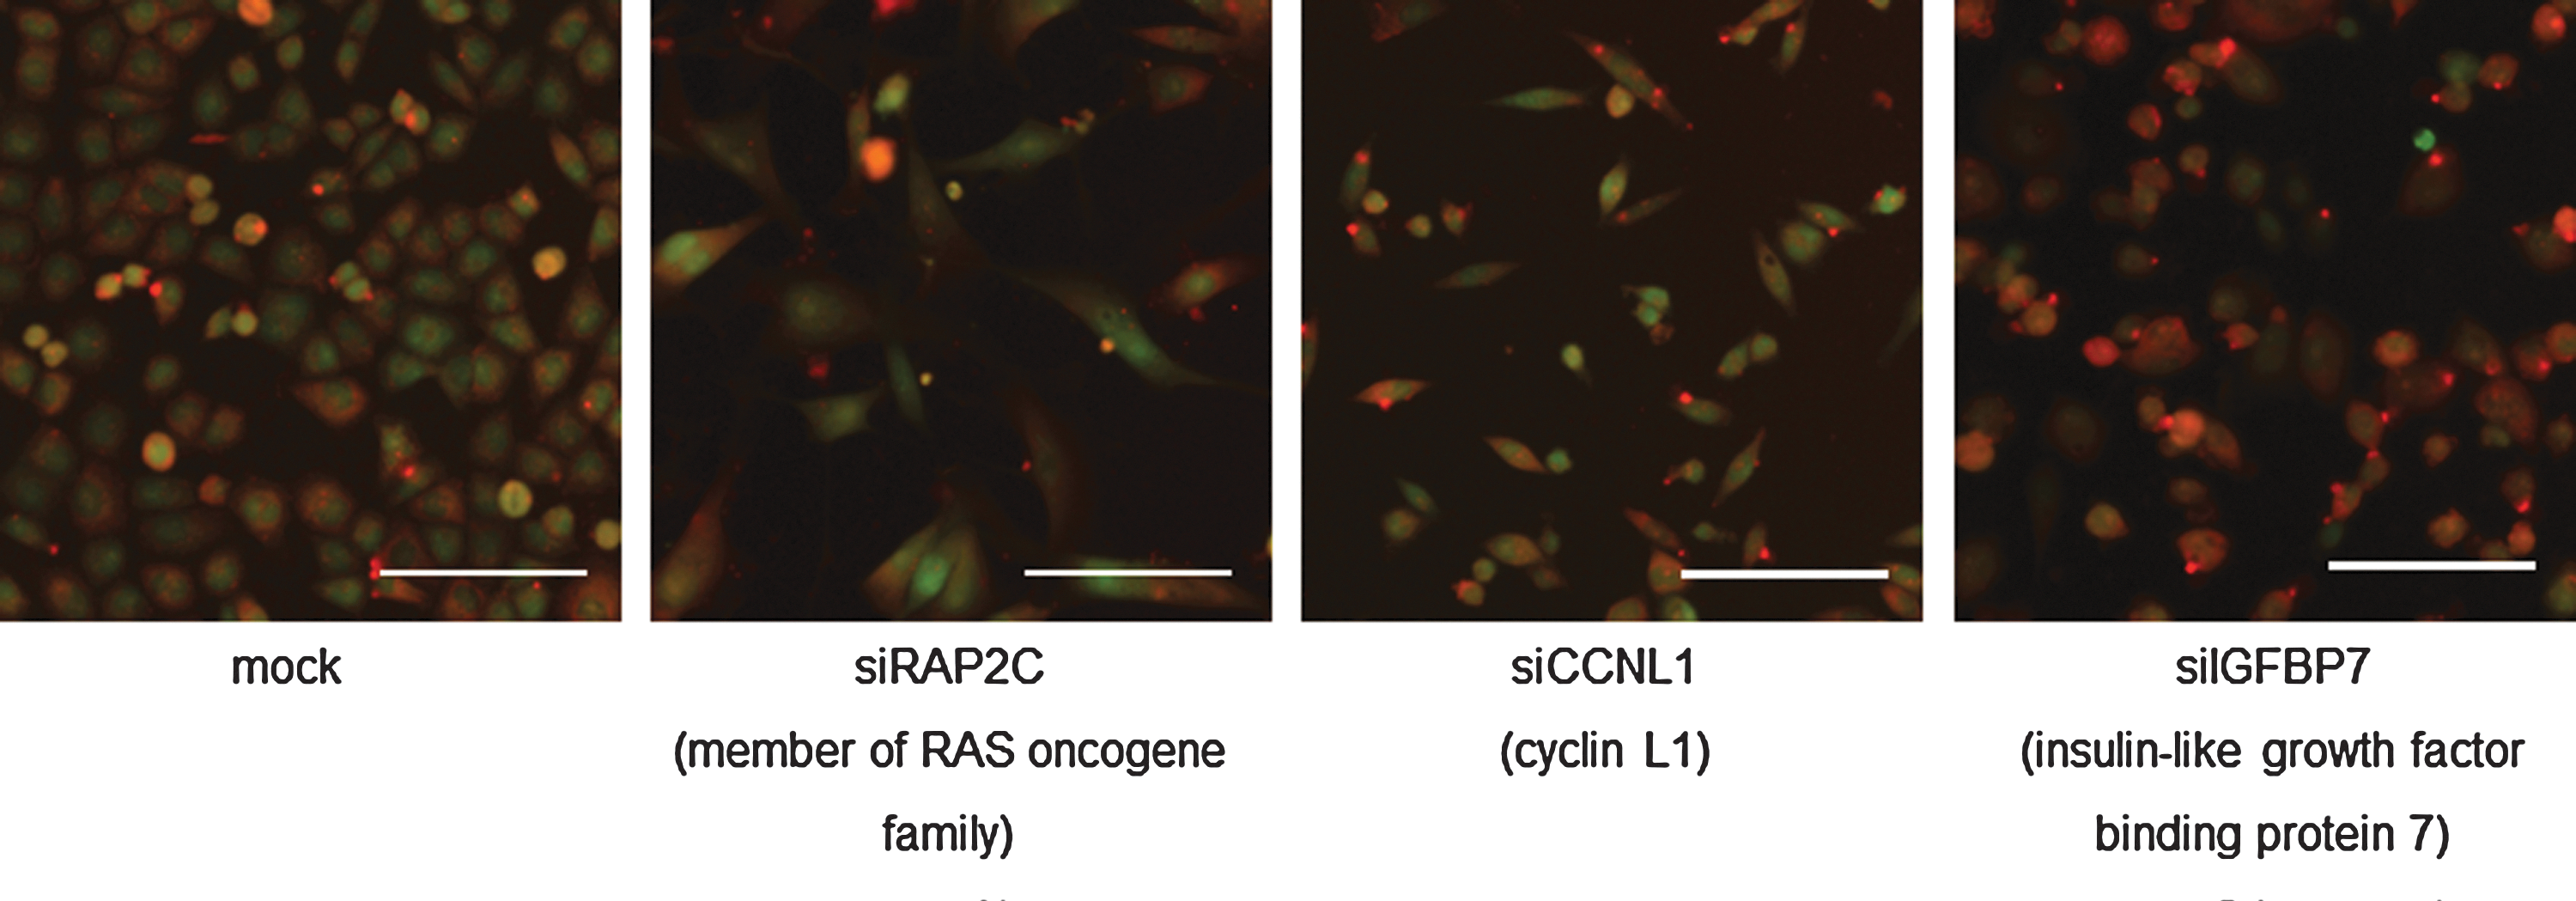
Overview of primary siRNA screen. Representative images from each binning class at 72 h post-transfection. siRAP2C represents the double-positive LWRM/VHM bin with an LWR z-score of 7.03 and vim/dsRed z-score of 2.99. siCCNL1 is classified in the LWRM-only bin with a z-score of 5.32. siIGFBP7 is in the VHM-only bin with a z-score of 6.63. RAP2C, member of RAS oncogene family; CCNL1, cyclin L1; IGFBP7, insulin-like growth factor binding protein 7. Scale bar=100 μM. Images are a merge of CMFDA (green) and dsRED (red) channels. LWRM, length width ratio mesenchymal; VHM, vimentin promoter dsRED reporter activity associated with increased mesenchymal-like properties.
miRNA Library Screens
The miRNA mimic and inhibitor screens (both performed as single-pass screens with no subsequent validation) were performed using the same technical conditions as the siRNA screen. Consistent with the literature 6 and our experience in the Victorian Centre for Functional Genomics (K. Simpson), the mimics were far more bioactive than the inhibitors, with a death rate of 27% compared with 0.44%. There were 22 double-bin hits identified using the miRNA mimic library and 3 from the miRNA inhibitor library. In the miRNA inhibitor screen, a subset of 18 miRNAs were binned as LWRE (having LWR z-score of less than −2), which indicates they are causing the cells to shift toward a more epithelial-like phenotype. These miRNAs did not affect reporter activity compared with mock control. An overview of the miRNA screens and representative images is shown in Table 3 and Figure 3.
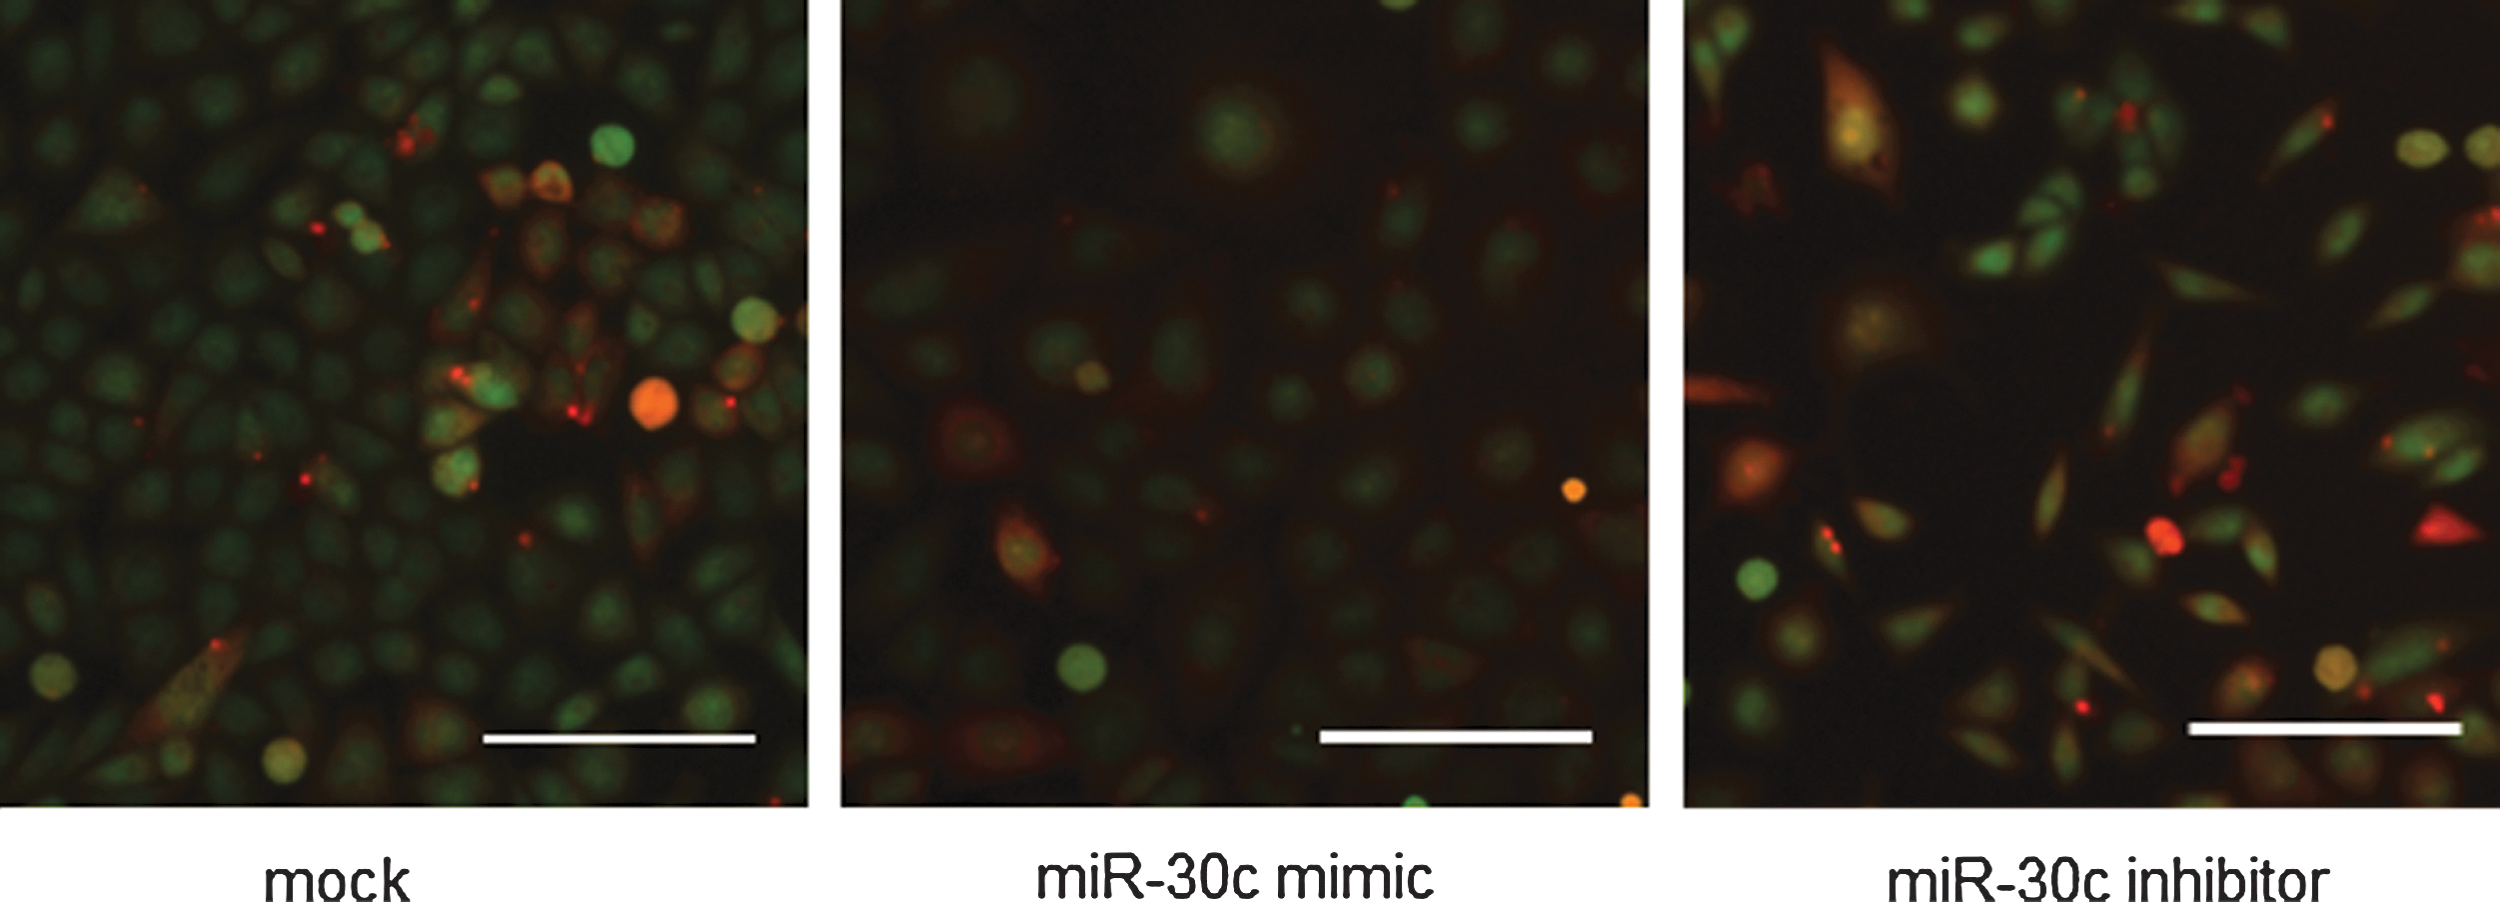
miR screen overview. Representative images of cells treated with miR-30c mimic and miR-30c inhibitor at 72 h post-transfection. miR-30c-inhibitor-treated cells display an elongated phenotype with an LWRM z-score of 4.79 and a VHM z-score of 3.04, while there was no morphological change in miR-30c-mimic-treated cells compared with mock (binned as no change). Scale bar=100 μM. Images are a merge of CMFDA (green) and dsRED (red) channels.
miR Screen Overview
Kinase Inhibitor Library Screen
To assess the effects of kinase inhibitors on EMT characteristics, the LWR and vimentin/dsRed total intensity graph profiles were evaluated against the object count and object per field graphs. Compounds (46) that caused a significant drop in cell count to <500 cells (at any concentration) were excluded from further analysis. Of the 131 compounds, 25 showed significant effects on the assay outputs. The overall outcome of kinase inhibitor screen and representative graph profiles of one of the LWRE hits are shown in Table 4 and Figure 4.
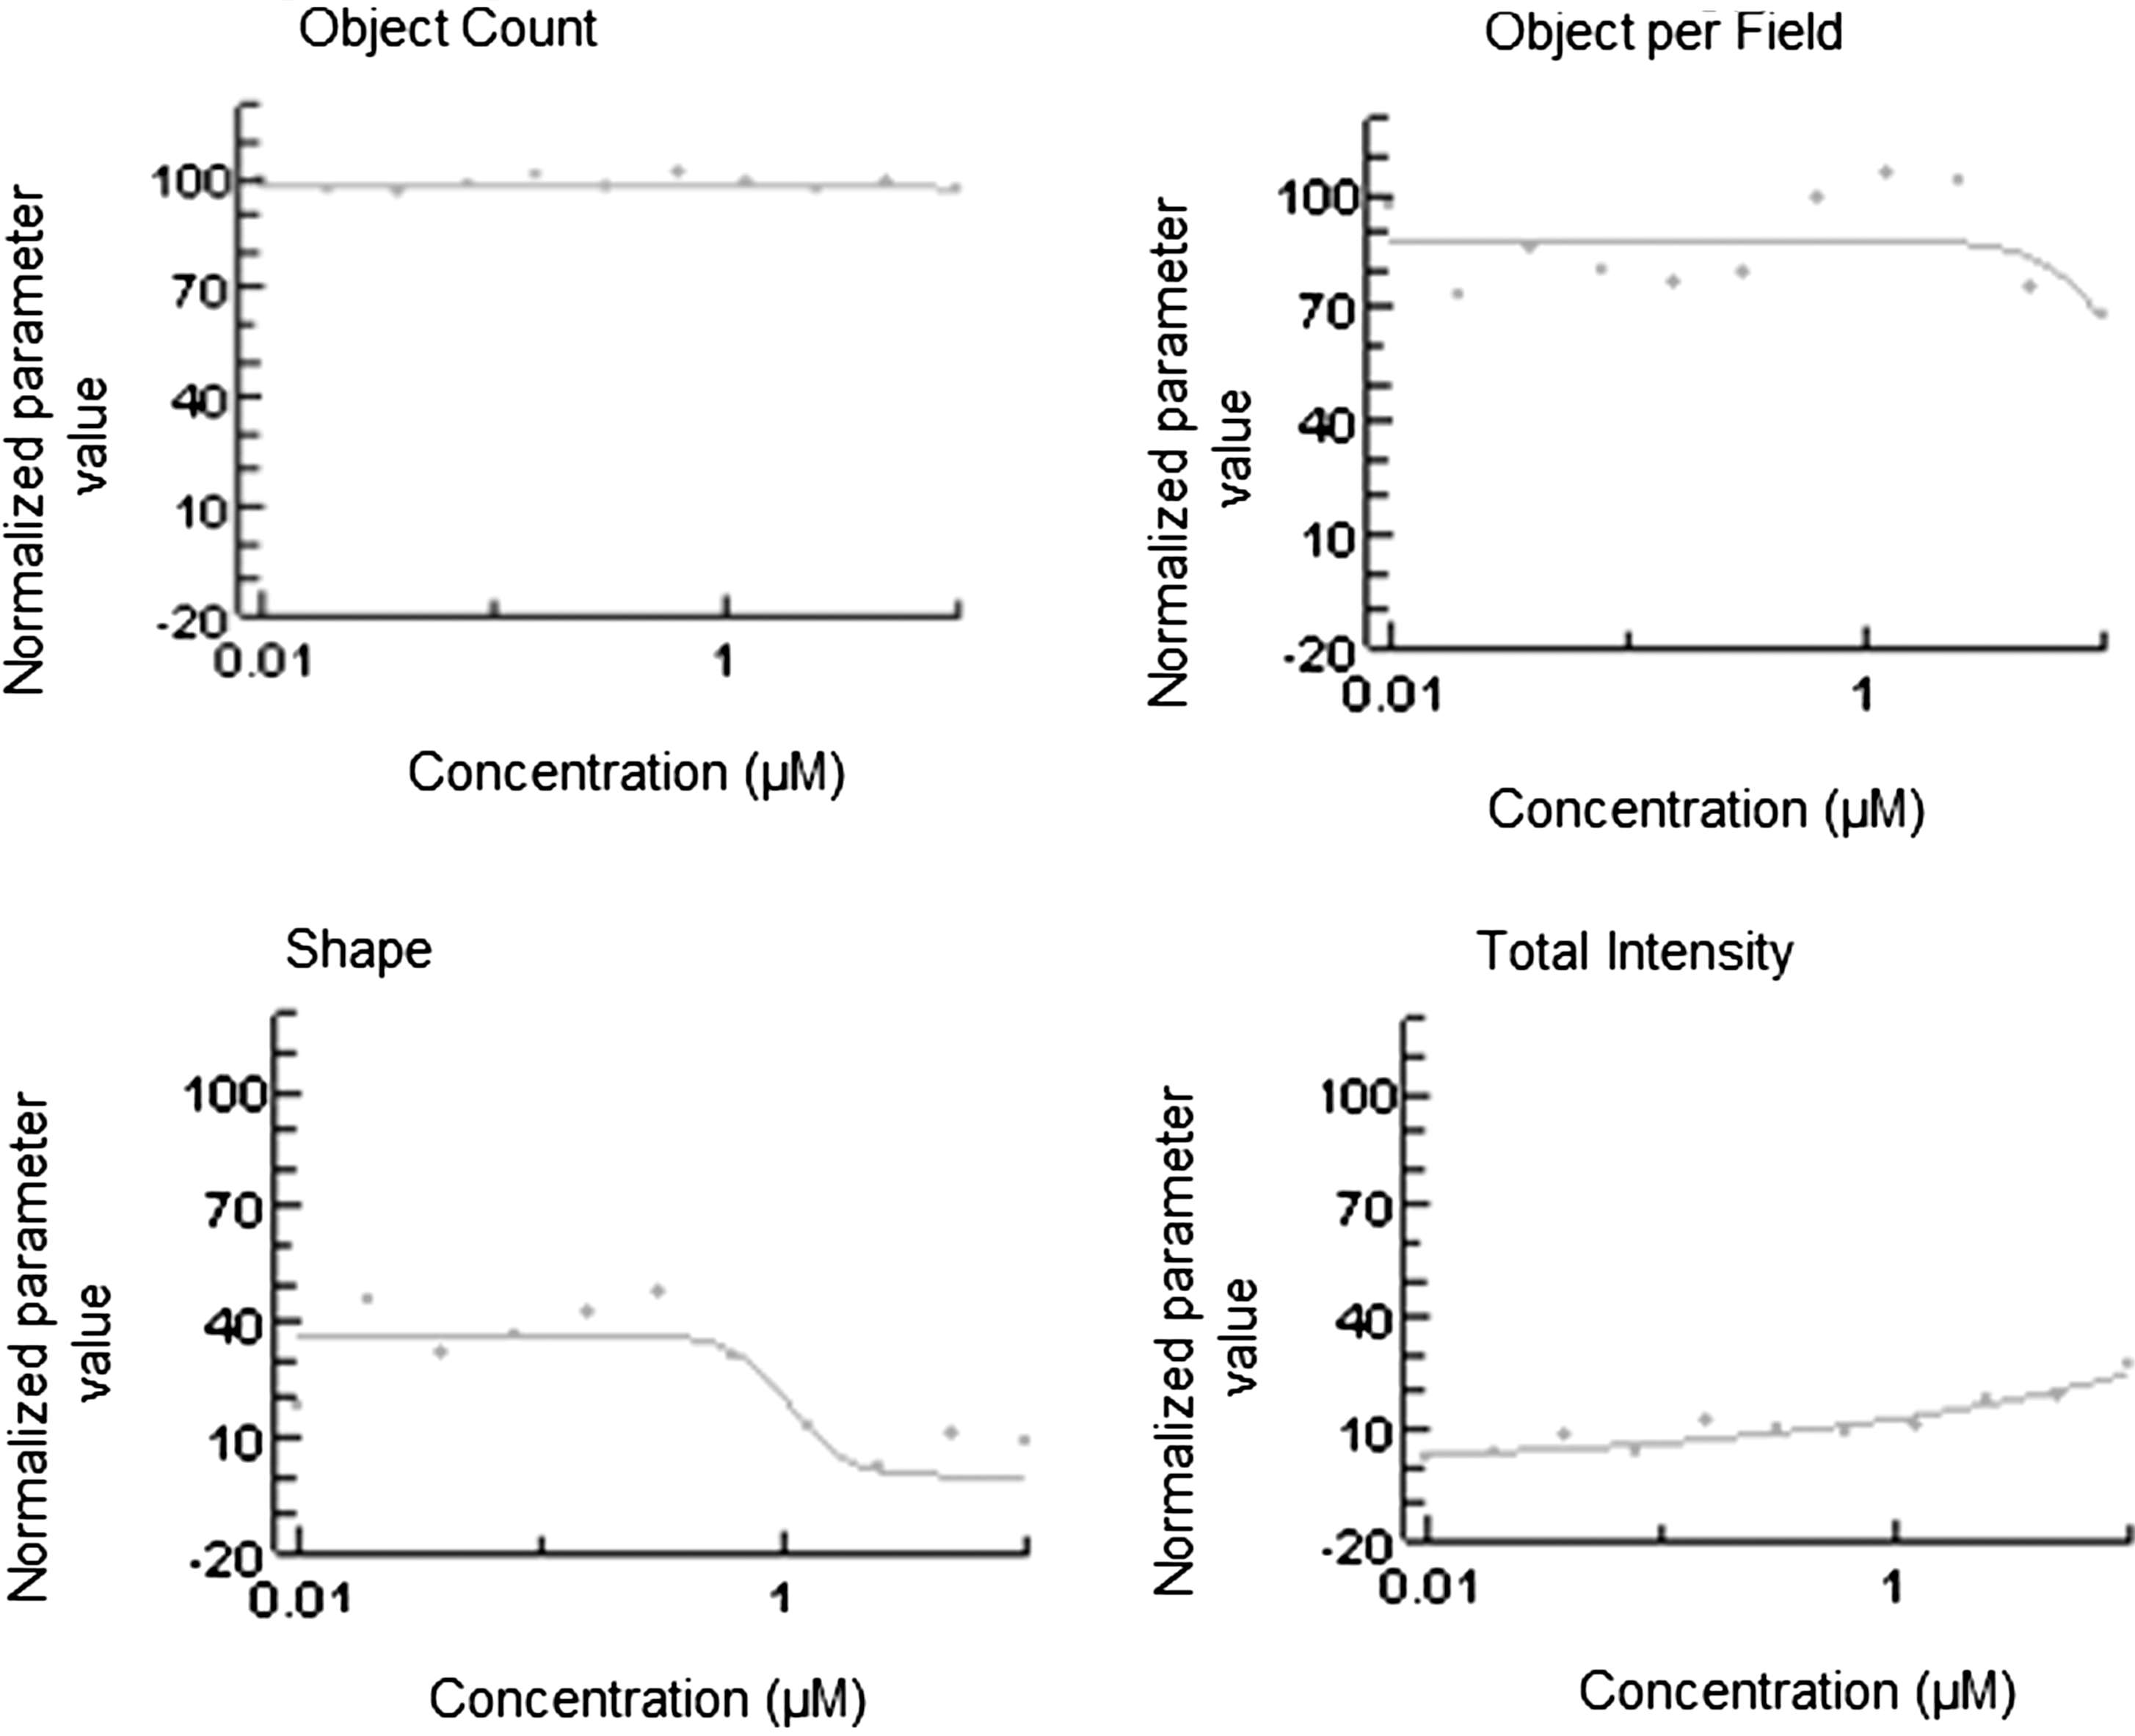
Compound screen overview. The concentration response graph profile of SB59088, a compound that targets B-RAF and one of the compounds that was binned as LWRE. The line represents the dose–response curve. The y-axis represents the normalized values against the specific controls for each parameter: for object count and object count per field, this is relative to DMSO-only treatment wells; for the shape parameter, this is relative to siSEMA3A; and for total intensity of reporter, this is relative to siCDH22. LWRE, length width ratio epithelial.
Compound Screen Overview
Integration of siRNA, miRNA, and Kinase Inhibitor Libraries
The primary hit bins from each screening strategy were integrated to prioritize a list of targets for detailed validation. Due to the large number of hits identified at a z-score of 2 in the siRNA screen, we refined the target list by applying more stringent robust z-score cutoffs. All double-bin hits (LWRM and VHM) with LWRM z-score ≥3 or VHM z-score ≥4 were included. For single-bin hits, a higher z-score cutoff was applied with an LWRM z-score of ≥5 or VHM z-score of ≥6. This resulted in 279 hits.
Putative miRNA target genes of miRNA mimic and inhibitors that produced a z-score of ≤−2 or ≥2 were identified using the miRanda database (August 2010 release;
From the kinase inhibitor screen, the major kinases targeted in the kinase inhibitor screen were compared with kinases identified in the revised siRNA bins described previously. Twenty-five compounds, targeting 15 protein kinases, were identified as hits (Fig. 4A). Of these kinases, 7 scored LWRM or VHM in both the siRNA and kinase inhibitor screens and 8 scored no change (NC) in the siRNA screen but were binned as hits to be included in secondary validation screening due to robust responses in the compound screen.
Secondary Validation Screening
Taking these three screens together and the revised binning strategies, we derived a list of 400 genes to progress to validate via deconvolution of the SMARTpool into its constituent siRNAs. Nine targets were included that scored NC (8) or low count (1) in the siRNAscreen due to the robust effects of compounds targeting these genes in the compound screen. The screen was repeated with this target list and quantitated as described previously. A target was classified as validated if two or more of the four individual siRNAs reproduced an EMT phenotype. The cutoff threshold for an LWRM hit was 13.5 and for the reporter intensity readout was 22.16 as described in the “Materials and Methods” section. Using this statistical cutoff, 42 of the candidate genes (10.5%) were classified as double-bin hits (LWRM/VHM) (Fig. 2). Forty genes (10%) were validated as LWR-only hits and 153 (38%) as VHM-only hits. These included 14 targets that scored 2/4 for both LWRM and VHM, but were not from the same duplex and thus were classified as single-bin hits. Further, five of nine targets that were originally scored as NC in the primary screen but included due to being key mediators of kinase inhibitor activity were scored as VHM (2/4 duplexes). This included two targets that additionally scored 2/4 for LWRM, but as only 1 duplex was in common between the outputs they were classified as single-bin hits. One hundred seventy-nine initial hits failed to validate as they scored ≤1/4 across all bin classes (double bin, LWRM only, and VHM only).
Data Mining of Hits
To gain more information about the signaling and connectivity of the 221 validated targets, we performed enrichment analysis using GO process as the search term and identified cellular component disassembly, protein complex disassembly, and regulation of fibroblast proliferation among the most significant processes (Table 5). There were 11 genes in common between cellular component disassembly and protein complex disassembly.
Gene Ontology Processes
In data: the number of genes in the 221 validated target gene list that appear in the total list in corresponding criteria in GeneGo (Total).
LWRM/VHM double-bin hits, the highest priority bin in the context of this EMT study, comprised 42 genes that were classified as high confidence following validation. These genes were assessed against the Oncomine, publicly available cancer expression profiling database (
Validated genes were also associated with clinical outcomes in other cancer types. For example, 43% (18/42) of validated genes were associated with a clinical outcome in breast cancer datasets. Four genes were among the top 1% of genes with copy number loss associated with poor survival in mucinuous breast carcinoma, 9 while 14 of the validated genes (including 2 genes from the mucinous breast cancer analysis) were included in the top 10% of genes with copy number loss associated with metastatic events and recurrence at 5 and 3 years in invasive breast carcinoma. 10
Discussion
For EMT reporter regulation, we focused on the vimentin/dsRed channel after E-cad/EGFP intensity proved to be too low to give a robust differential reading. It has previously been established that the parental TSU-Pr1 cell line does not express E-cadherin mRNA 11 and that the E-cadherin promoter is inactive in this cell line. 12 Despite TSU-Pr1-B1 cells exhibiting more epithelial characteristics than the parental TSU-Pr1 (morphologically and at the molecular level), 13 this was not sufficient to induce robust levels of E-cadherin expression. Morphological change is another parameter associated with EMT, with elongated fibroblastic shape being associated with mesenchymal phenotype and more cuboidal shape associated with the epithelial state. Thus, a cell shape analysis was included in the screen to create an integrated epithelial/mesenchymal assay.
In this multiparameter assay, siRNA against SEMA3A was used as the positive control for the morphological-change parameter. It was selected following screening of a panel of potential LWR-positive control siRNAs (Supplementary Table S2) during assay development as it demonstrated the highest z-score (and a %CV of 16%) for LWR readout. SEMA3A is an axon repulsion factor and has been shown to reduce the migration and invasive behavior of breast cancer MDA-MB-231 cells 14 and inhibited vimentin expression during reversion of EMT in pancreatic neuroendocrine tumors mice model. 15 Thus, SEMA3A is a negative regulator of EMT.
The primary siRNA screen generated a hit rate of 17% using a robust z-score cutoff of ≥2. This relatively high hit rate was attributed to the broad and complex binning system used in this multiparameter assay. Most primary RNAi screens have a hit rate set at around 2%–3% 16 –18 to enable prioritization of the most robust hits. We used several approaches to refine our hit list, including increasing the z-score cutoff stringency and overlaying miRNA screen target prediction genes and kinases targeted by compounds in a kinase inhibitor screen. Consistent with practice in the facility in which the screen was performed, the top 400 targets proceeded to validation.
The number of verified high-confidence hits in genome-wide screens relies on the chosen statistical stringency and the assay type. 19 Setting our high-confidence validation as those targets for which at least 2 of the 4 individual siRNAs scored in the assay, we had a validation rate of 58.5%. Data mining with other cancer-related expression profiles supports the validity of this assay in identifying genes involved in maintaining epithelial phenotype.
Analysis of validated siRNA gene targets using gene ontology identified fibroblast (mesenchymal cell) proliferation, prostate acinar morphogenesis, and ERK1/2 signaling processes as enriched (Table 5). In the prostate, terminally differentiated epithelia cells can undergo EMT when regeneration is stimulated and such plasticity has been associated with prostatic disease. 20 In addition, ERK1/2 activity has previously been established to regulate EMT in a number of cell types, including prostate. 21 –23
Using the miRNA inhibitor library, we have identified miR-30c. Inhibition of miR-30c scored LWRM (z-score 4.79) and VHM (z-score 3.04) but overexpression scored NC. This is consistent with the established role for miR-30 family members in the regulation of EMT. In human fetal pancreatic epithelial cells, depletion of miR-30 family of miRNAs, including miR-30c, using antagomiRs resulted in the cells transitioning to a mesenchymal phenotype. 24 In human renal cell carcinoma cells, miR-30c directly targeted EMT-promoting transcription factor SLUG (SNAI2) and reduced E-cadherin to maintain an epithelial phenotype. 25 Similarly, miR-30c has been shown to inhibit breast cancer cell chemoresistance (a feature also associated with EMT 26 ) by direct targeting of EMT-promoting actin-binding protein twinfilin. 27 Thus, miR-30c is a key inhibitor of EMT that was detected using our HSC approach.
The screening of the small-molecule kinase inhibitor library served as an adjunct to targeting protein kinases using siRNA. Potent inhibitor of total BRAF SB590885 28 was binned as LWRE based on graph profile (Fig. 4B). In contrast, BRAFV600E-mutant-selective inhibitor PLX4720 29 scored LWRM/VHM based on its graph profile (data not shown). These ambiguous results may be due to the nature of kinase inhibitors, which often have multiple targets and different mechanisms of actions. In thyroid cancer, BRAF has been shown to promote EMT, migration, and invasion and invasion through TGFβ and MEK-ERK signaling. 30 This is consistent with the more epithelial phenotype observed upon inhibiting this kinase in the TSU-Pr1-B1 screen. These cells do not have the BRAFV600E mutation; thus, it is likely that the more mesenchymal phenotype induced by PLX4720 is due to an “off-target” effect despite the reported specificity of this compound.
We present to the metastasis community a robust multiparametric assay incorporating multiple levels of evidence to systematically define regulators of EMT. The screen successfully identified known molecular mediators of this plasticity program and provides an exceptional resource to explore the role of novel pathways. We are currently pursuing leads generated in this screen in additional cell and animal models to define the role of these genes in the regulation of tumor cell plasticity and metastasis.
Footnotes
Acknowledgments
N.A.B.M.S. was supported by a University of Malaya Academic Staff Training Scholarship. The authors acknowledge support from the EMPathy Breast Cancer Network, a National Breast Cancer Foundation (Australia)–funded national collaborative research program, the Victorian Government's Operational Infrastructure Support Program, and the Australian Government Department of Health. The VCFG is funded by the Australian Cancer Research Foundation (ACRF); the Victorian Department of Industry, Innovation and Regional Development (DIIRD); the Australian Phenomics Network (APN) and supported by funding from the Australian Government's Education Investment Fund through the Super Science Initiative; the Australasian Genomics Technologies Association (AGTA); the Brockhoff Foundation; and the Peter MacCallum Cancer Centre Foundation. K.J.S. is on the Society of Biomolecular Imaging and Informatics (SBI2) Board of Directors. The authors thank Daniel Thomas and Yanny Handoko (Victorian Centre for Functional Genomics and Peter MacCallum Cancer Centre) for their expert technical assistance in performing the screen.
Disclosure Statement
The authors do not have any institutional or commercial affiliation that poses a real or perceived conflict of interest with respect to this study.