
Abstract
The popular screening method for urotensin (UT) receptor antagonists is to measure the intracellular calcium concentration with a calcium-sensitive fluorescent dye. This assay format has an inherent limitation on the problem related to the fluorescence interference as it involves fluorescent dyes. In the present study, a label-free assay for the screening of UT receptor antagonists was developed by using dynamic mass redistribution (DMR) assay based on label-free optical biosensor. The addition of urotensin II (UII) stimulated a DMR profile to HEK293 cells stably expressing the human UT receptor (HEK293UT cells) but not on parental cells. The EC50 value of UII in label-free assay was 4.58 nM, which is very similar to that in conventional calcium mobilization assay (4.15 nM). Compared with the calcium mobilization assay for UII (Z′ factor, 0.77), the current label-free assay presented improved Z′ factor (0.81), with a relatively similar S/B ratio (28.0 and 25.6, respectively). The known high-affinity UT receptor antagonists, SB657510, GSK562590, and urantide, exhibited comparable IC50 values but rather less potent in the DMR assay than in calcium mobilization. Our DMR assay was able to present various functional responses, including inverse agonism in SB657510 and GSK1562590 as well as partial agonism in urantide. Moreover, the DMR assay exerted the stable antagonist window upon the minimal agonist stimulus. These results suggest that the label-free cell-based UT receptor assay can be applicable to evaluate the various functional activities of UT receptor-related drug candidates.
Introduction
Urotensin II (UII) is a neuropeptide and endogenous ligand of the G-protein–coupled receptor known as a GPR14 or urotensin (UT) receptor. 1 UII has been generally agreed to be the most potent endogenous vasoconstrictor discovered to date. 2 UII and its receptor, UT receptor, is widely expressed in cardiovascular system. 3 The elevated plasma levels of UII and increased levels of its expression have been demonstrated in numerous disease conditions, including hypertension, atherosclerosis, heart failure, pulmonary hypertension, diabetes, renal failure, and metabolic syndrome. 4,5 Despite this significant therapeutic potential, only few potent UT receptor antagonists have been reported until recently.
As a screening platform for the development of UT receptor antagonists, the calcium mobilization assay has been widely accepted. 6,7 By adding functional parameters to the conventional receptor binding assay, the calcium data appear more physiologically relevant and calcium readouts for the urotensin receptor have been used successfully for a wide variety of purposes. In principle, the calcium mobilization assay works well for both the agonist and antagonist screening. However, it has the risk of introducing artifacts due to the possible interference by fluorescent and colored compounds. In addition, monitoring of changes in the intracellular calcium level has limitations on functional characterizations, such as partial and inverse agonisms. 8 Most recently, there is a growing interest in cell-based functional assays with label-free biosensors. 9 Upon the various label-free technologies, the dynamic mass redistribution (DMR) system has superiority to monitor molecular movements inside cells on receptor activation or deactivation. 10 –12 This superiority is based on the optical biosensor, which can record shifts in wavelength of reflected light in a real time. 13 These real-time kinetic responses arising from a receptor–ligand or compound interactions present positive and/or negative signals relative to the baseline that can be applied to investigate various functional mechanisms. There is a general concern on the DMR assay because of its lack of specificity for cell surface receptor activation. In fact, DMR signal could be affected by a wide variety of signals from cell surface receptors, such as GPCR, tyrosine kinase, or ion channel. However, despite its drawback, the label-free assay has been regarded as one of the useful techniques to evaluate complicated targets and to expand knowledge areas in addition to those from conventional assay systems.
In this article, the development and validation results of the DMR assay for the UT receptor were described, and its performance was compared with the conventional fluorescence calcium mobilization assay.
Materials and Methods
Reagents
Human recombinant UII was purchased from Sigma-Aldrich (St. Louis, MO). As UT receptor selective reference compounds, SB657510 [2-bromo-N-[4-chloro-3-((R)-1-methyl-pyrrolidin-3-yloxy)-phenyl]-4,5-dimethoxybenzenesulfonamide HCl] 14 was obtained from Sigma-Aldrich, and Urantide [L-Aspartyl-L-penicillaminyl-L-phenylalanyl-D-tryptophyl-L-ornithyl-L-tyrosyl-L-cysteinyl-L-valine cyclic disulfide] 15 was purchased from Peptide international, Inc. (Louisville, NY). GSK1562590 [4′-[(1R)-1-[[(6,7-Dichloro-3-oxo-2,3-dihydro-4H-1,4-benzoxazin-4-yl)acetyl](methyl)amino]-2-(pyrrolidin-1-yl)ethyl]biphenyl-3-carboxamide] 16 was synthesized in-house. Dimethyl sulfoxide (DMSO), G418 disulfate salt, and all other reagents were obtained from Sigma-Aldrich. All tissue culture media and reagents were purchased from Lonza (Allendale, NJ). Fibronectin-coated biosensor microplates were obtained from PerkinElmer (Santa Clara, CA).
Cell Culture
HEK293 cells were grown in Dulbecco's modified Eagle's medium supplemented with 10% fetal bovine serum. Cells were cultured at 37°C under a humidified atmosphere containing 5% CO2. To establish a stable cell line with UT receptor, the cDNA of UT receptor (UTR2/GPR14, GenBank accession number NM_018949 except C51T) in pcDNA3.1+ was transfected to HEK293 cell with Lipofectamine 2000 according to the previous report 17 and manufacturer's instructions. Transfected colonies with maximum calcium responses by UII were selected as stable cells for the UT receptor. During the clonal selection process, the concentration of G418 was kept at 200 (g/mL. To obtain reproducible DMR or calcium responses, cells were split every 3 days before they became confluent at a culture condition of DMEM with 10% fetal bovine serum (Gibco BRL, Rockville, MD) and discarded after 2–3 months of continuous growth.
DMR Assays
The DMR assays were performed using the multimode plate reader label-free system (Enspire; PerkinElmer), which is a benchtop plate reader containing Epic label-free technology (Corning Life Sciences, Lowell, MA). One day before performing the DMR assay, HEK293UT cells were seeded onto fibronectin-coated biosensor microplate (Enspire-LFC; PerkinElmer) at a density of 1 × 10⁶ cells/mL with 30 μL of growth medium (30,000 cells/well). Before measuring the DMR signal, cells were washed thrice with assay buffer (Hank's balanced salt solution with 20 mM HEPES and 1% DMSO) and then transferred within the EnSpire reader for 2 h at 25°C. Afterward, a 5 min baseline was established to ensure the cells reached a steady state. As the first protocol for agonist test, urotensin II or compounds in 10 μL of 1% DMSO with assay buffer were added directly to cells and the DMR was monitored for 30 min. In the second protocol for antagonist test, compounds were added and incubated with cells for 30 min. At the end of incubation, 30 nM urotensin II was added at an 80% effective concentration approximately, and DMR responses were continuously monitored for another 30 min to determine the inhibition of agonist-induced DMR response (Table 1). DMR responses were monitored every 1 min over test periods. For profiling, two independent measurements in triplicate were performed.
Dynamic Mass Redistribution Assays
1. Performed in EnSpire-LFC, 384-well fibronectin-coated plates. Day 1: cell seeding (UT receptor transfected-HEK293, 30,000 cells/well), 37°C incubator overnight.
2. Day 2: washing with buffer #2 (1 × HBSS, 20 mM HEPES, 1% DMSO), 25 μL × 3 remove all with aspiration.
3. Add 30 μL of buffer #2.
4. Equilibrate for 2 h in EnSpire (keep temperature constant). While cell plate is equilibrating, prepare compound dilution plates.
5. Baseline measurement.
6. Add 10 μL of compounds (×4). Columns 1–3, buffer #2; columns 4–12, various concentrations of compounds.
7. Quickly reload plate into EnSpire for final read #1(∼30 min).
8. Add 10 μL of urotensin II (×5).
9. Quickly reload plate into EnSpire for final read #2(∼30 min).
10. Analysis respective EC50 or IC50 values.
Calcium Mobilization Assay
Calcium mobilization was measured on the automated fluorometer, FlexStation II as previously described. 18 Before the day of experiment, HEK293UT cells at optimum growth were transferred onto black-sided clear-bottom 96-well plates at a density of 1 × 10⁶ cells/mL with 100 μL of growth medium (100,000 cells/well). After overnight incubation, the homogeneous fluorescence calcium assay dye (FLIPR Calcium 3; Molecular Device, Sunnyvale, CA) in the Hank's balanced salt solution (HBSS) with 20 mM of HEPES and 2.5 mM of probenecid at pH 7.4 was loaded according to the manufacturer's instructions. The plates were then incubated at 37°C for 60 min before being placed in the FlexStation II (MDS Analytical Technologies, Sunnyvale, CA). Fluorescence signals were measured every 1.52 s for the total of 60 s time frame, and 50 μL of 30 nM urotensin II or dye buffer (HBSS with 20 mM of HEPES, pH 7.4) was added to each well in column-wise after 16 s of the equilibration period. Ten microliters of vehicle (0.5% DMSO) or compounds were treated 10 min before the initiation of fluorescence measurements (Table 2). The filter settings were 485 nm for excitation and 525 nm for emission, with cutoff wavelength at 515 nm.
Calcium Mobilization Assay
1. Performed in 96-well clear-bottom plates (Greiner, #655090, coated with poly-l-lysine and laminin). Day 1: cell seeding in DMEM with 10% FBS (UT receptor transfected-HEK293, 100,000 cells/well), 37°C incubator overnight.
2. Day 2: remove the supernatant.
3. Add 190 μL of loading buffer (diluted the Component A with 2.5 mM probenecid in 1 × HBSS/20 mM HEPES) to each well.
4. Incubate cell plate for 30 min at 37°C.
5. Add 10 μL of compounds to each wells. Columns 1–2, 5% DMSO only; columns 3–12, various concentrations of compounds.
6. Incubate cell plate for 30 min at 37°C. Transfer the assay plate to the FlexStation II (using SoftMax Pro) assay plate carriage and run.
7. Baseline measurement. The counter settings were excitation at 485 nm and emission at 525 nm.
8. After 16 s, quickly add 50 μL of urotensin II (×5) by using dispenser in FlexStation II.
9. Read UII-induced calcium signal for 1 min.
10. Analysis respective EC50 or IC50 values.
Statistical Analysis
The DMR or calcium mobilization response was calculated by subtracting the baseline measurement from the peak response intensity for each compound concentration. The EC50 and IC50 values from dose–response experiments were analyzed using the nonlinear curve fitting functions in PRISM version 4.0 (GraphPad Software, Inc., San Diego, CA). The classical equation for sigmoidal dose–response for the nonlinear regression analysis was used. For representations of the quality of assay itself (Z′), Z′ factor was calculated as 1−([3 × SDc+]+[3 × SDc−])/(Meanc+−Meanc−) and the percent inhibition was calculated as ([raw data of compound−Meanc−]/[Meanc+−Meanc−]) × 100. SDc+ and SDc− are denoted for the standard deviations of the positive control signal and negative control signal, respectively. Meanc+ and Meanc− are represented for the means of the positive control signal and negative control signal, respectively.
Results
DMR Characterization of UT Receptor
To characterize DMR responses of UT receptor, the optimum cell density for the DMR assay was evaluated as the first step. The addition of 100 nM UII elicited a positive DMR response and the maximum DMR response was observed at a density of 30,000 cells/well in 384-well plates (Fig. 1A). In DMR agonism assay, the stimulation of UII at various concentrations (0–100 nM) to HEK293UT cells evoked a positive DMR response in a concentration-dependent manner (Fig. 1B), and the wavelength shift of 640 ± 26
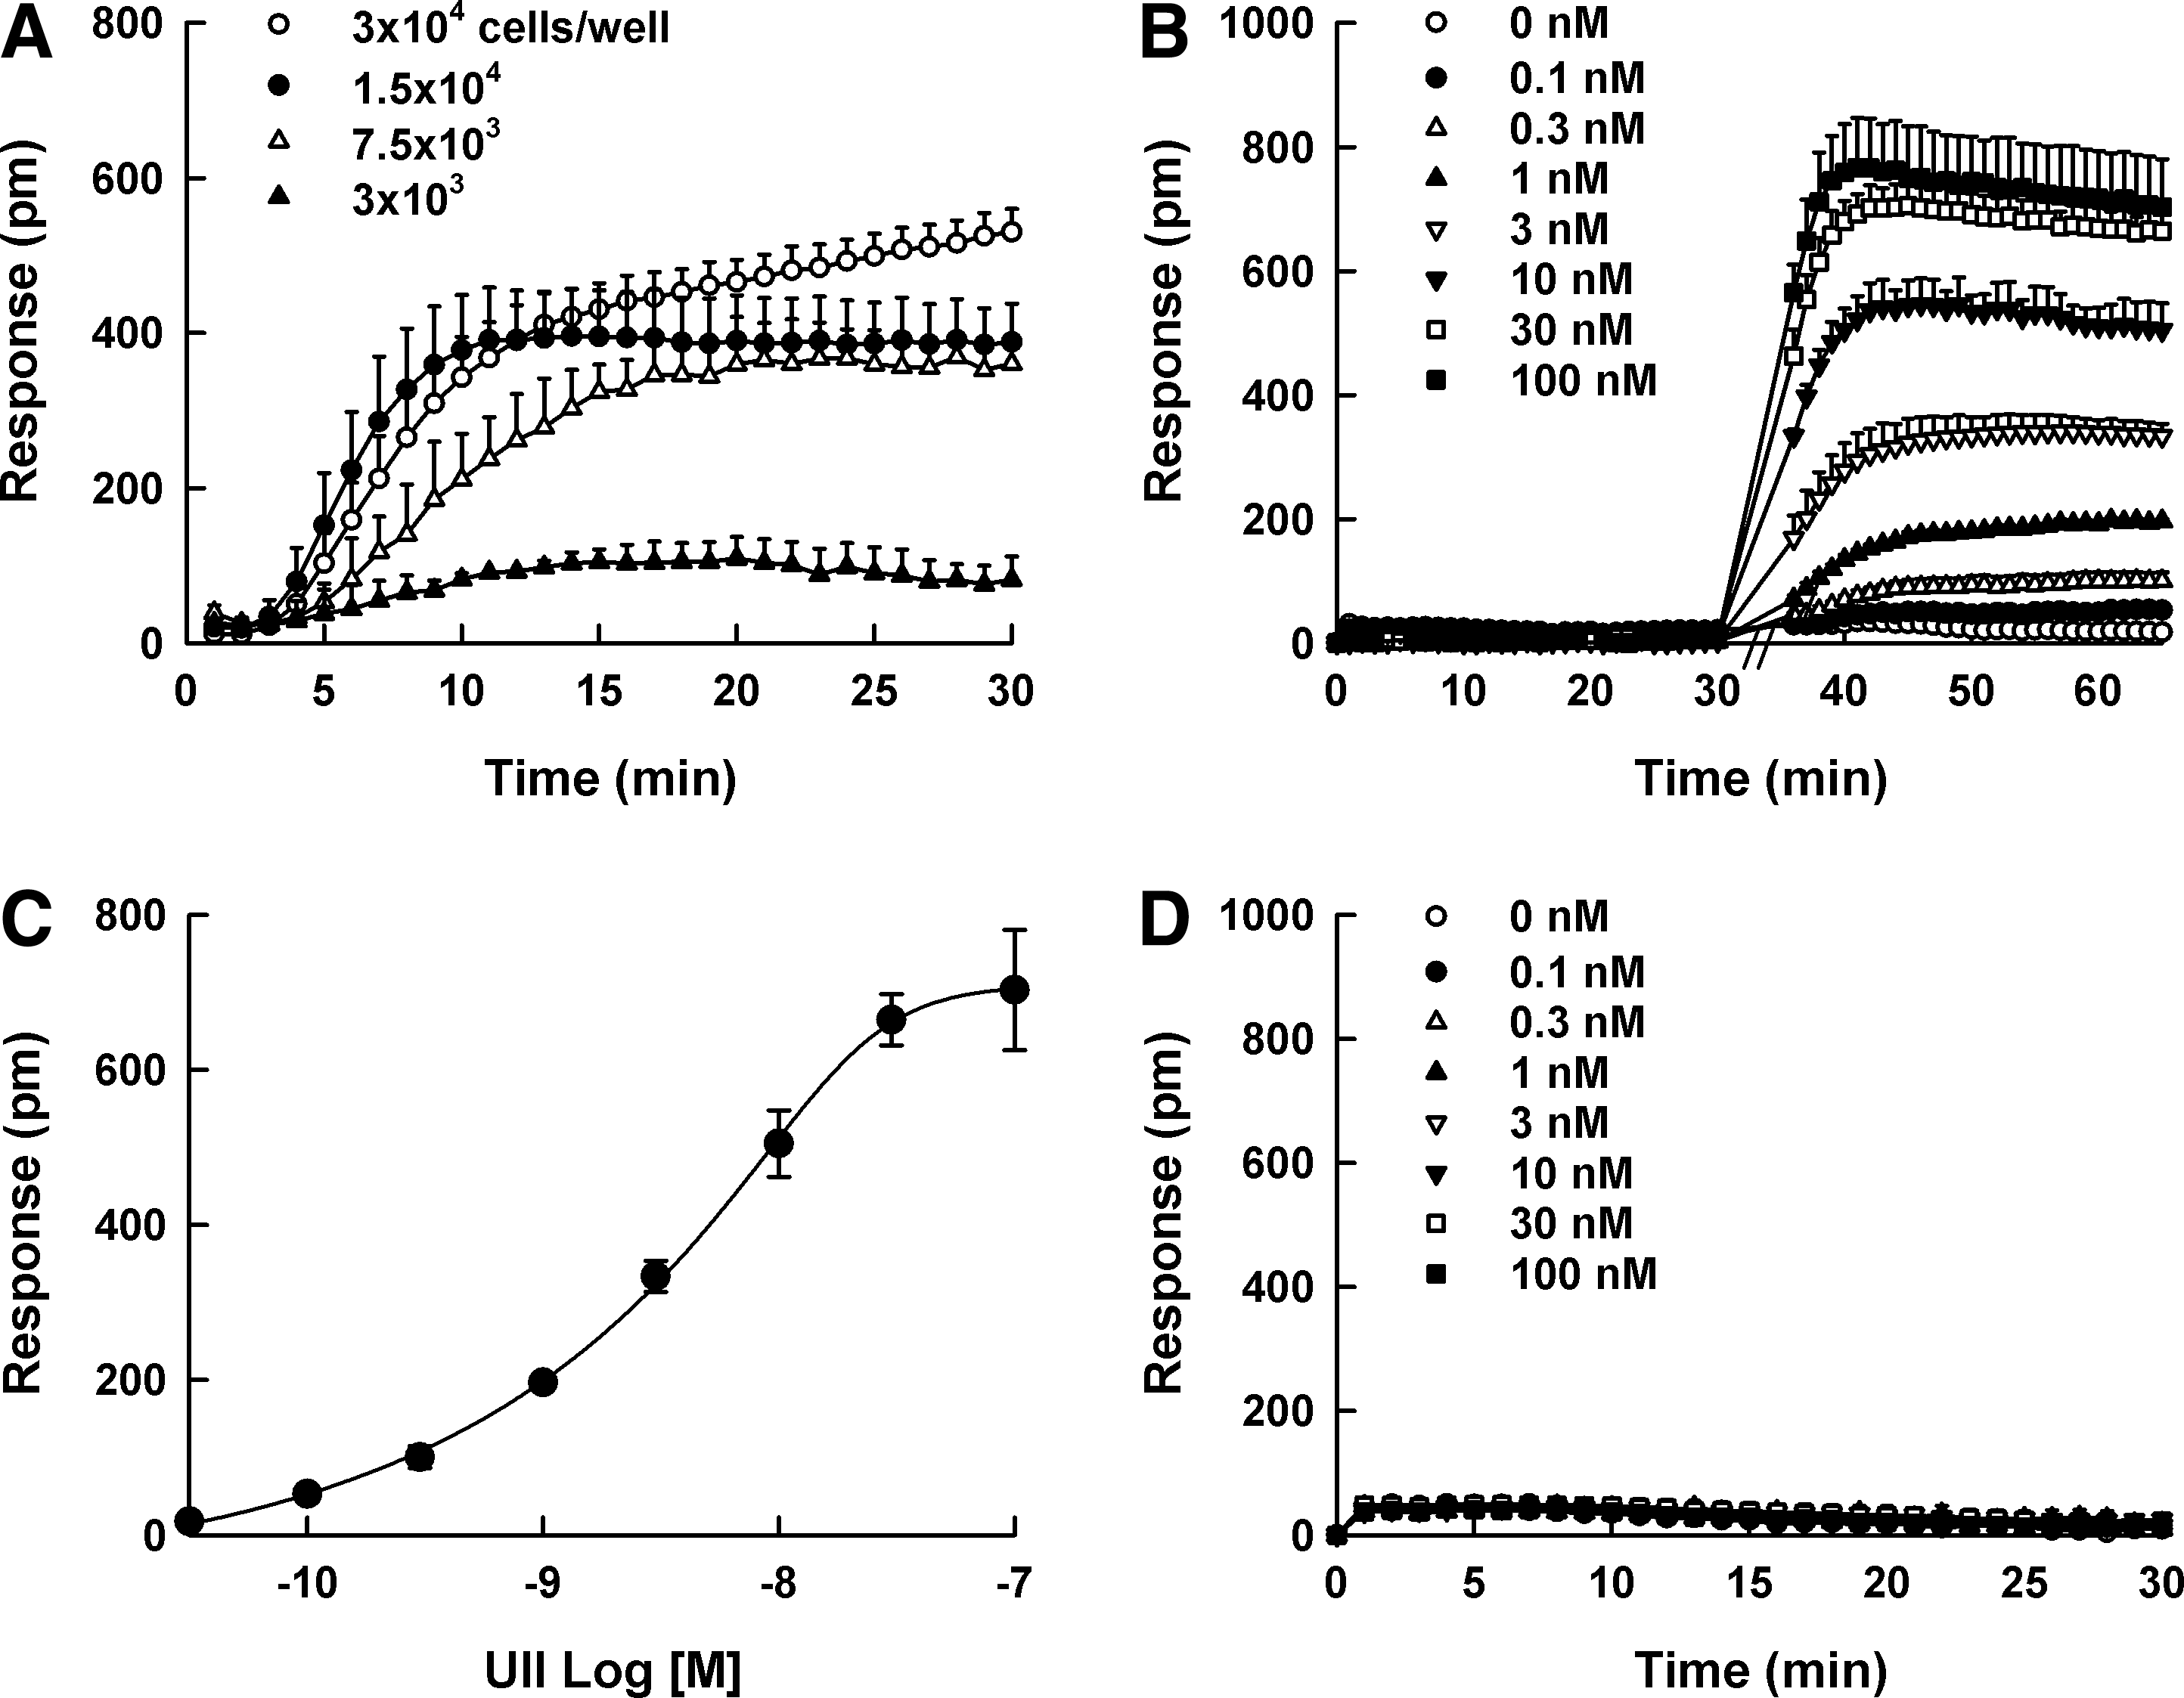
Dynamic mass redistribution (DMR) responses of urotensin II (UII).
Calcium Mobilization Characterization of UT Receptor
Calcium levels were monitored using the automated fluorometer, FlexStation II, and the homogeneous calcium dye, Calcium 3. The maximum calcium signal was observed at a density of 100,000 cells/well in 96-well plates (Fig. 2A), and UII evoked calcium signal in a concentration-dependent manner (Fig. 2B). The calculated EC50 value for UII was 4.15 ± 1.06 nM (Fig. 2C). The calcium response in parental HEK293 cells was not observed (Fig. 2D).
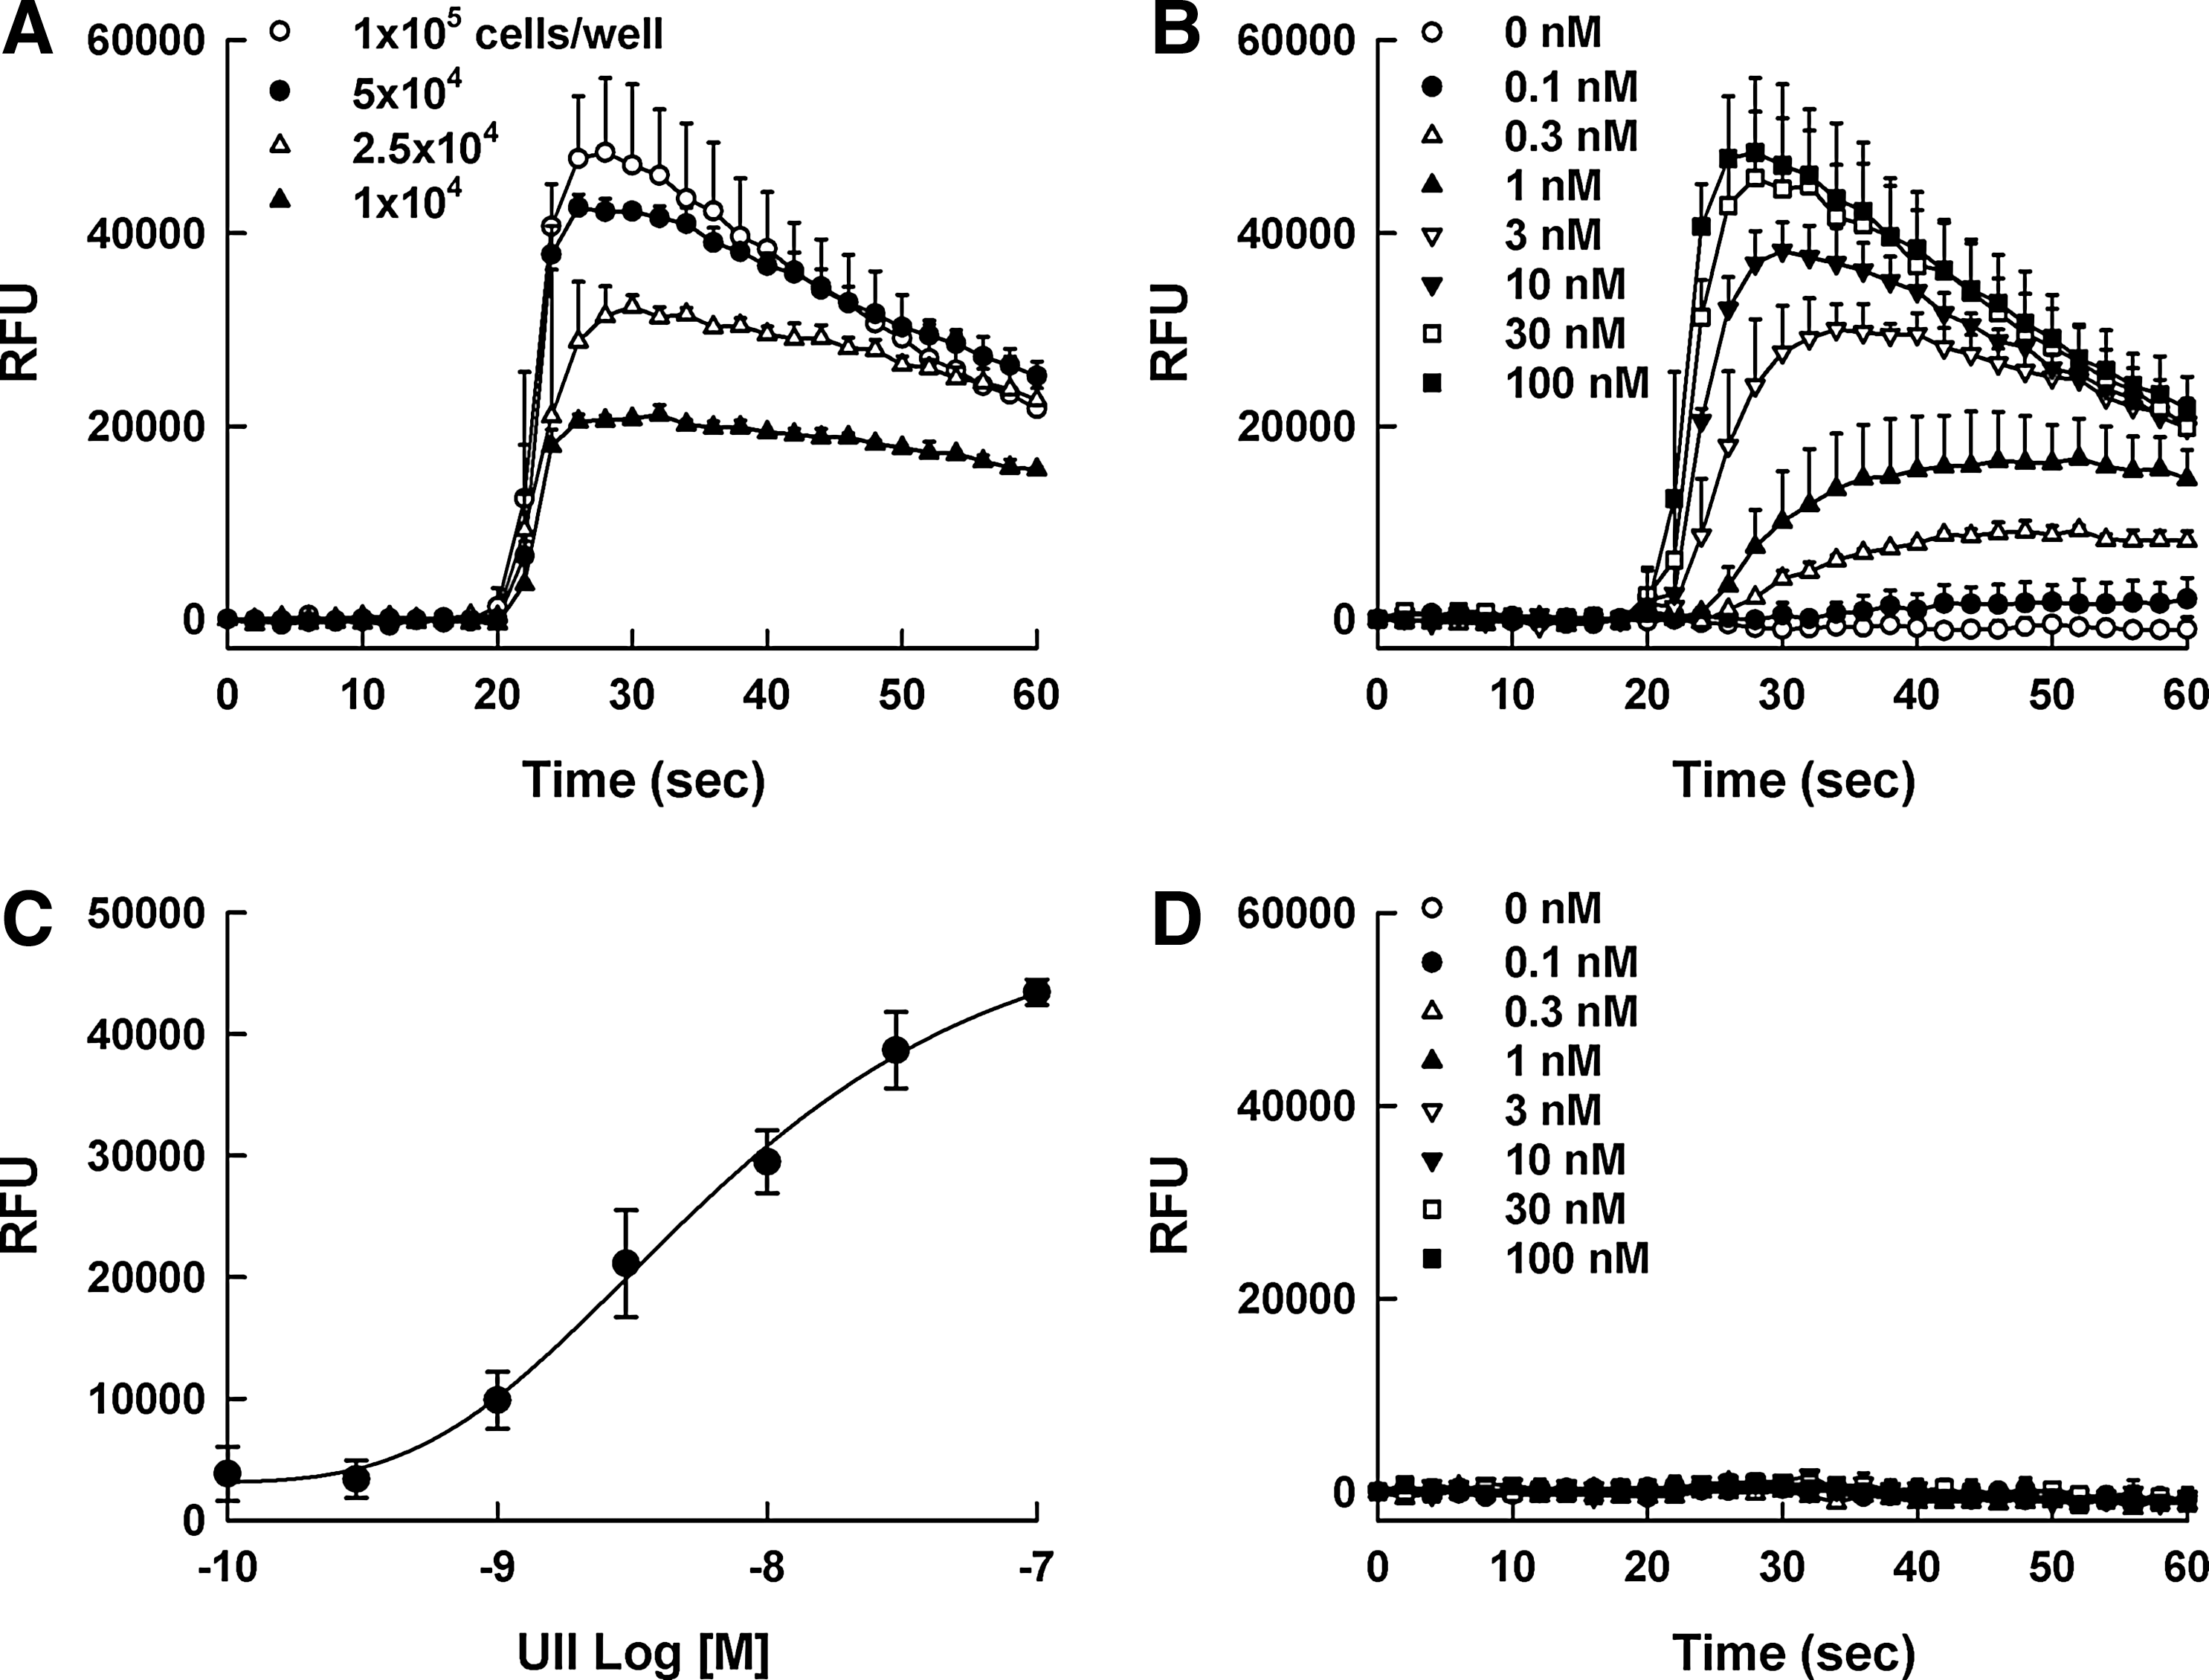
Calcium signal responses of urotensin II (UII).
Comparison of IC50 Values of Known UT Receptor Antagonists
SB657510, GSK1562590, and urantide as the known UT receptor antagonists were used to analyze their concentration-dependent antagonist responses. All the compounds showed a typical concentration-dependent antagonist response. As shown in Figure 3, IC50 values of SB657510, GSK1562590, and urantide in the DMR assay were 1,880 ± 138, 47.4 ± 13.7, and 10.7 ± 1.1 nM, respectively, which were less potent than those from the calcium mobilization assay (528 ± 163, 3.3 ± 0.7, and 8.1 ± 0.36 nM, respectively).
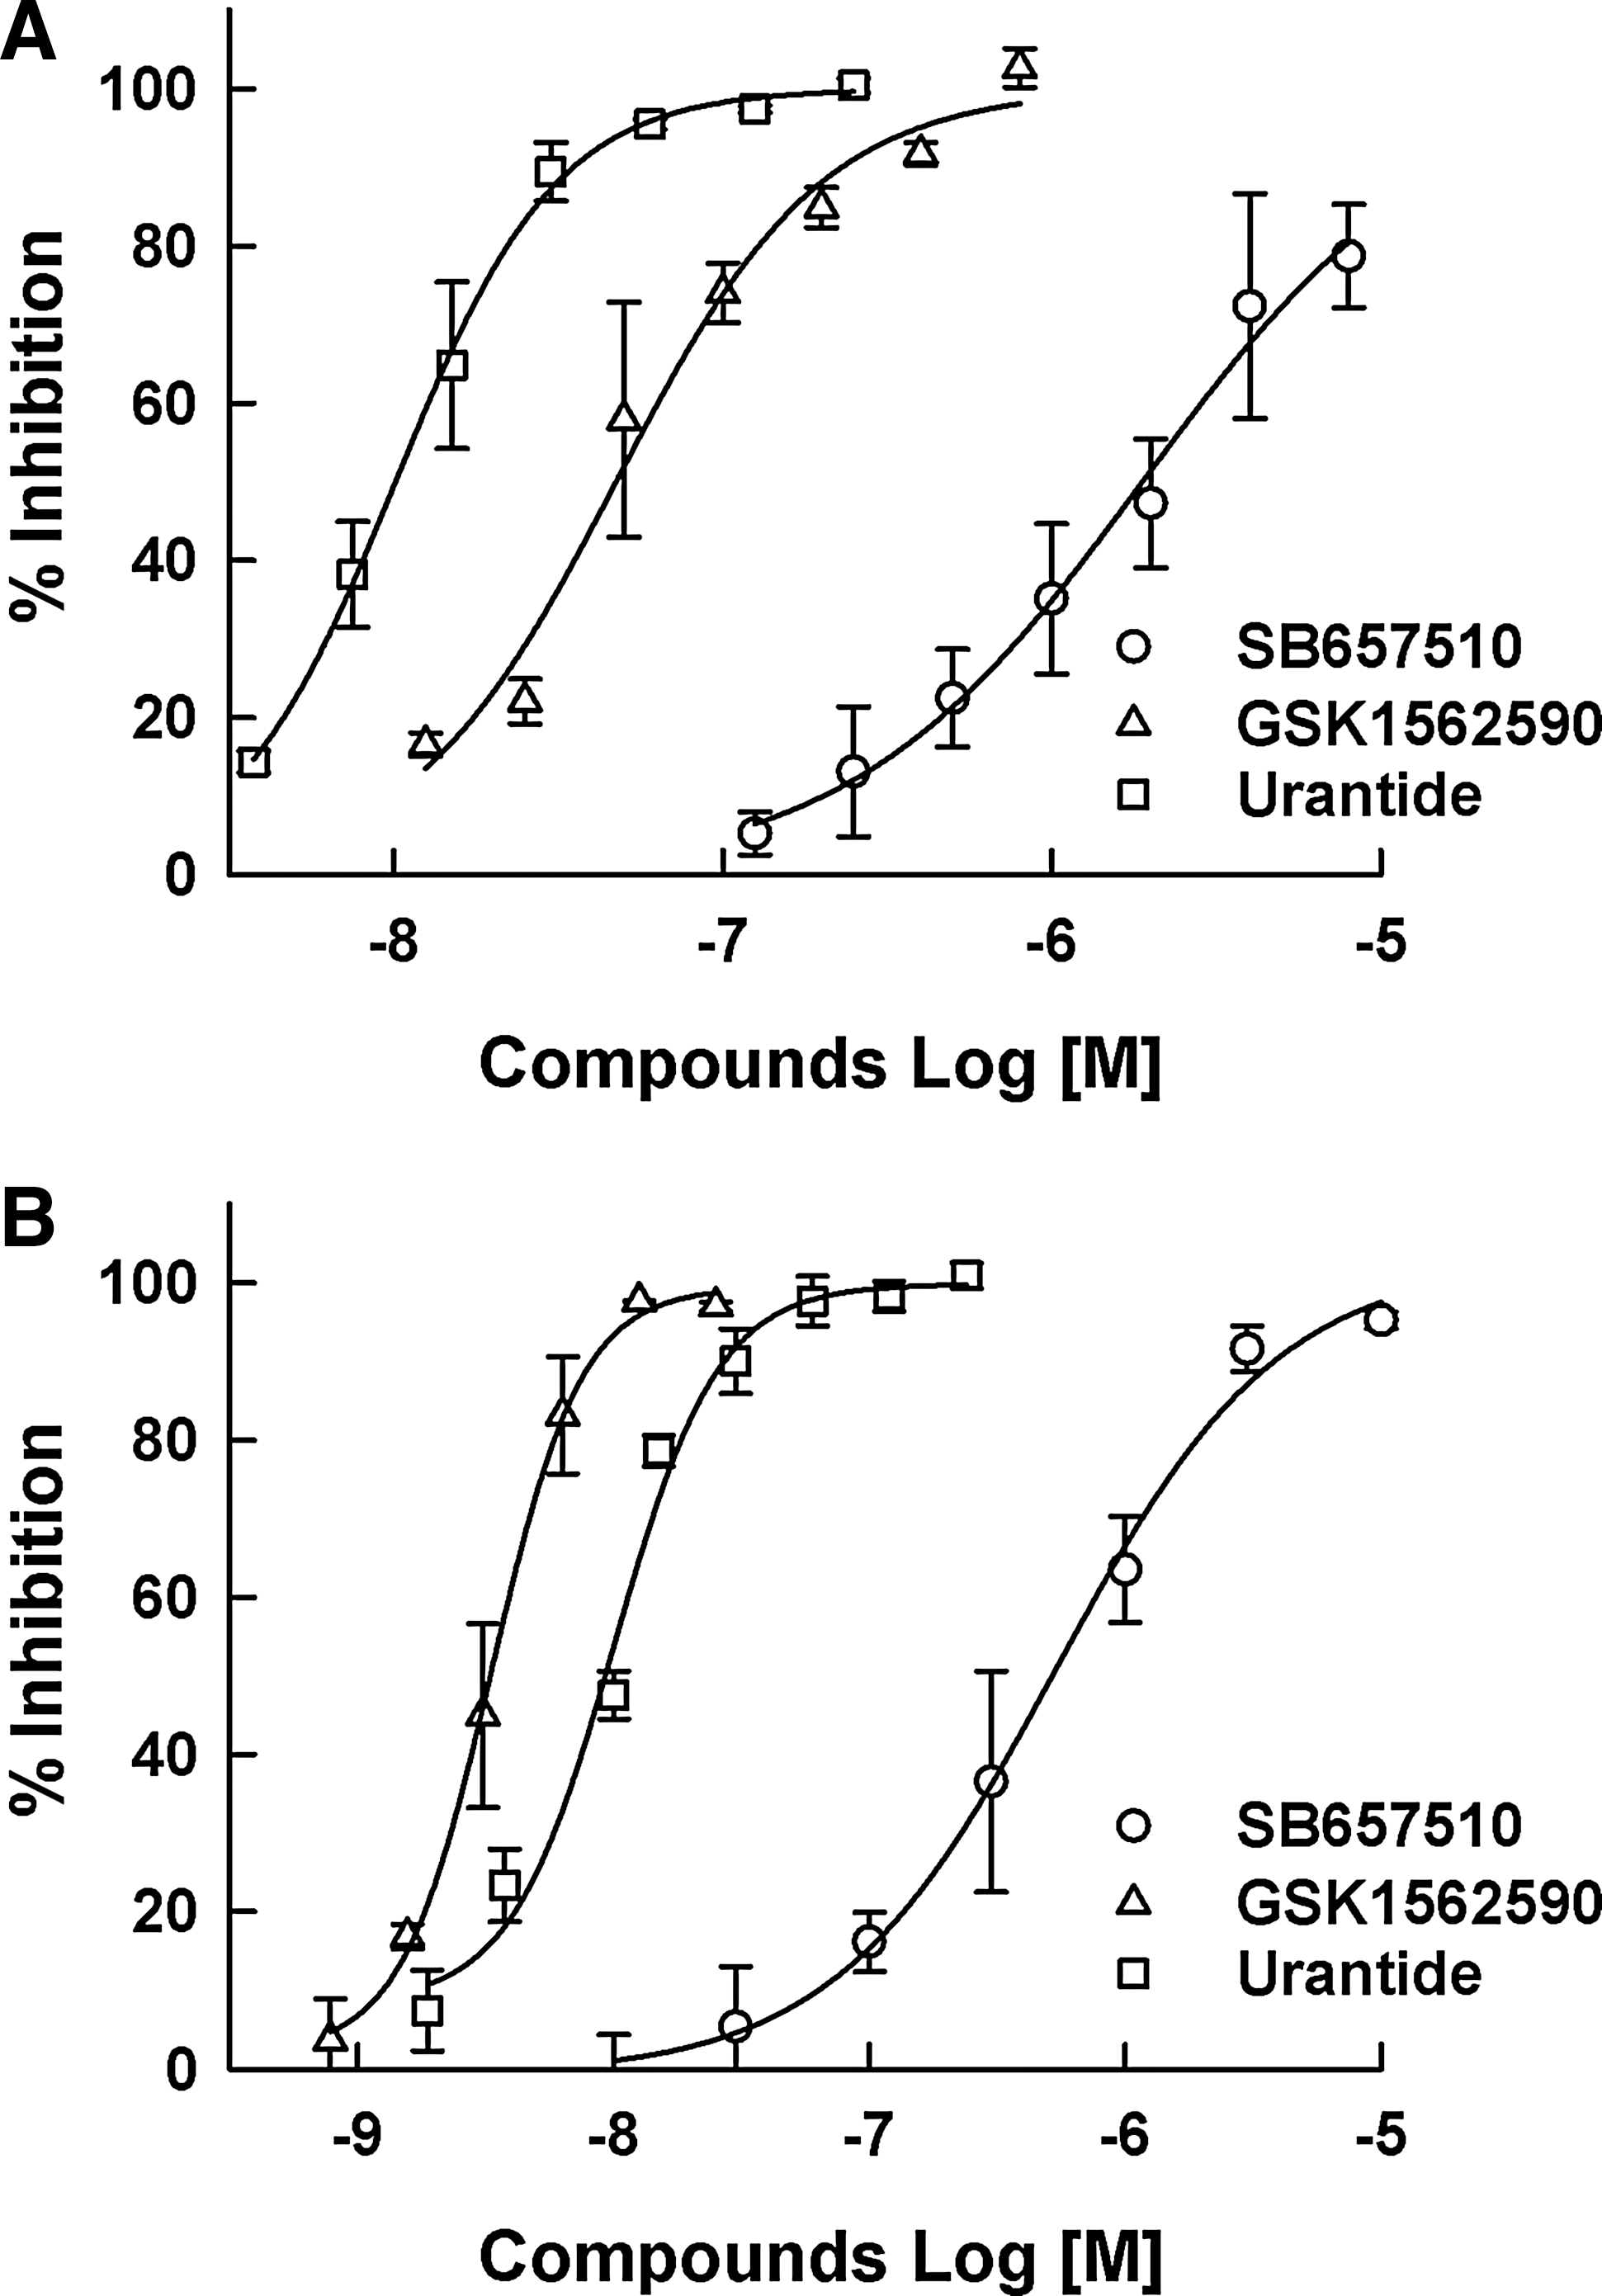
The antagonist responses of (◯) SB657510, (△) GSK1562590, and (□) urantide as reference compounds. Dose–response curves were generated in the
Evaluation of Assay Quality and Validity
The quality of DMR and calcium mobilization assays for the screening of UT receptor antagonists was evaluated by the Z’ factor determination and the distribution of signal-to-background (S/B) data (Fig. 4). DMR signal from stimulation of UII (30 nM UII=537 ±26, buffer control=21 ± 7
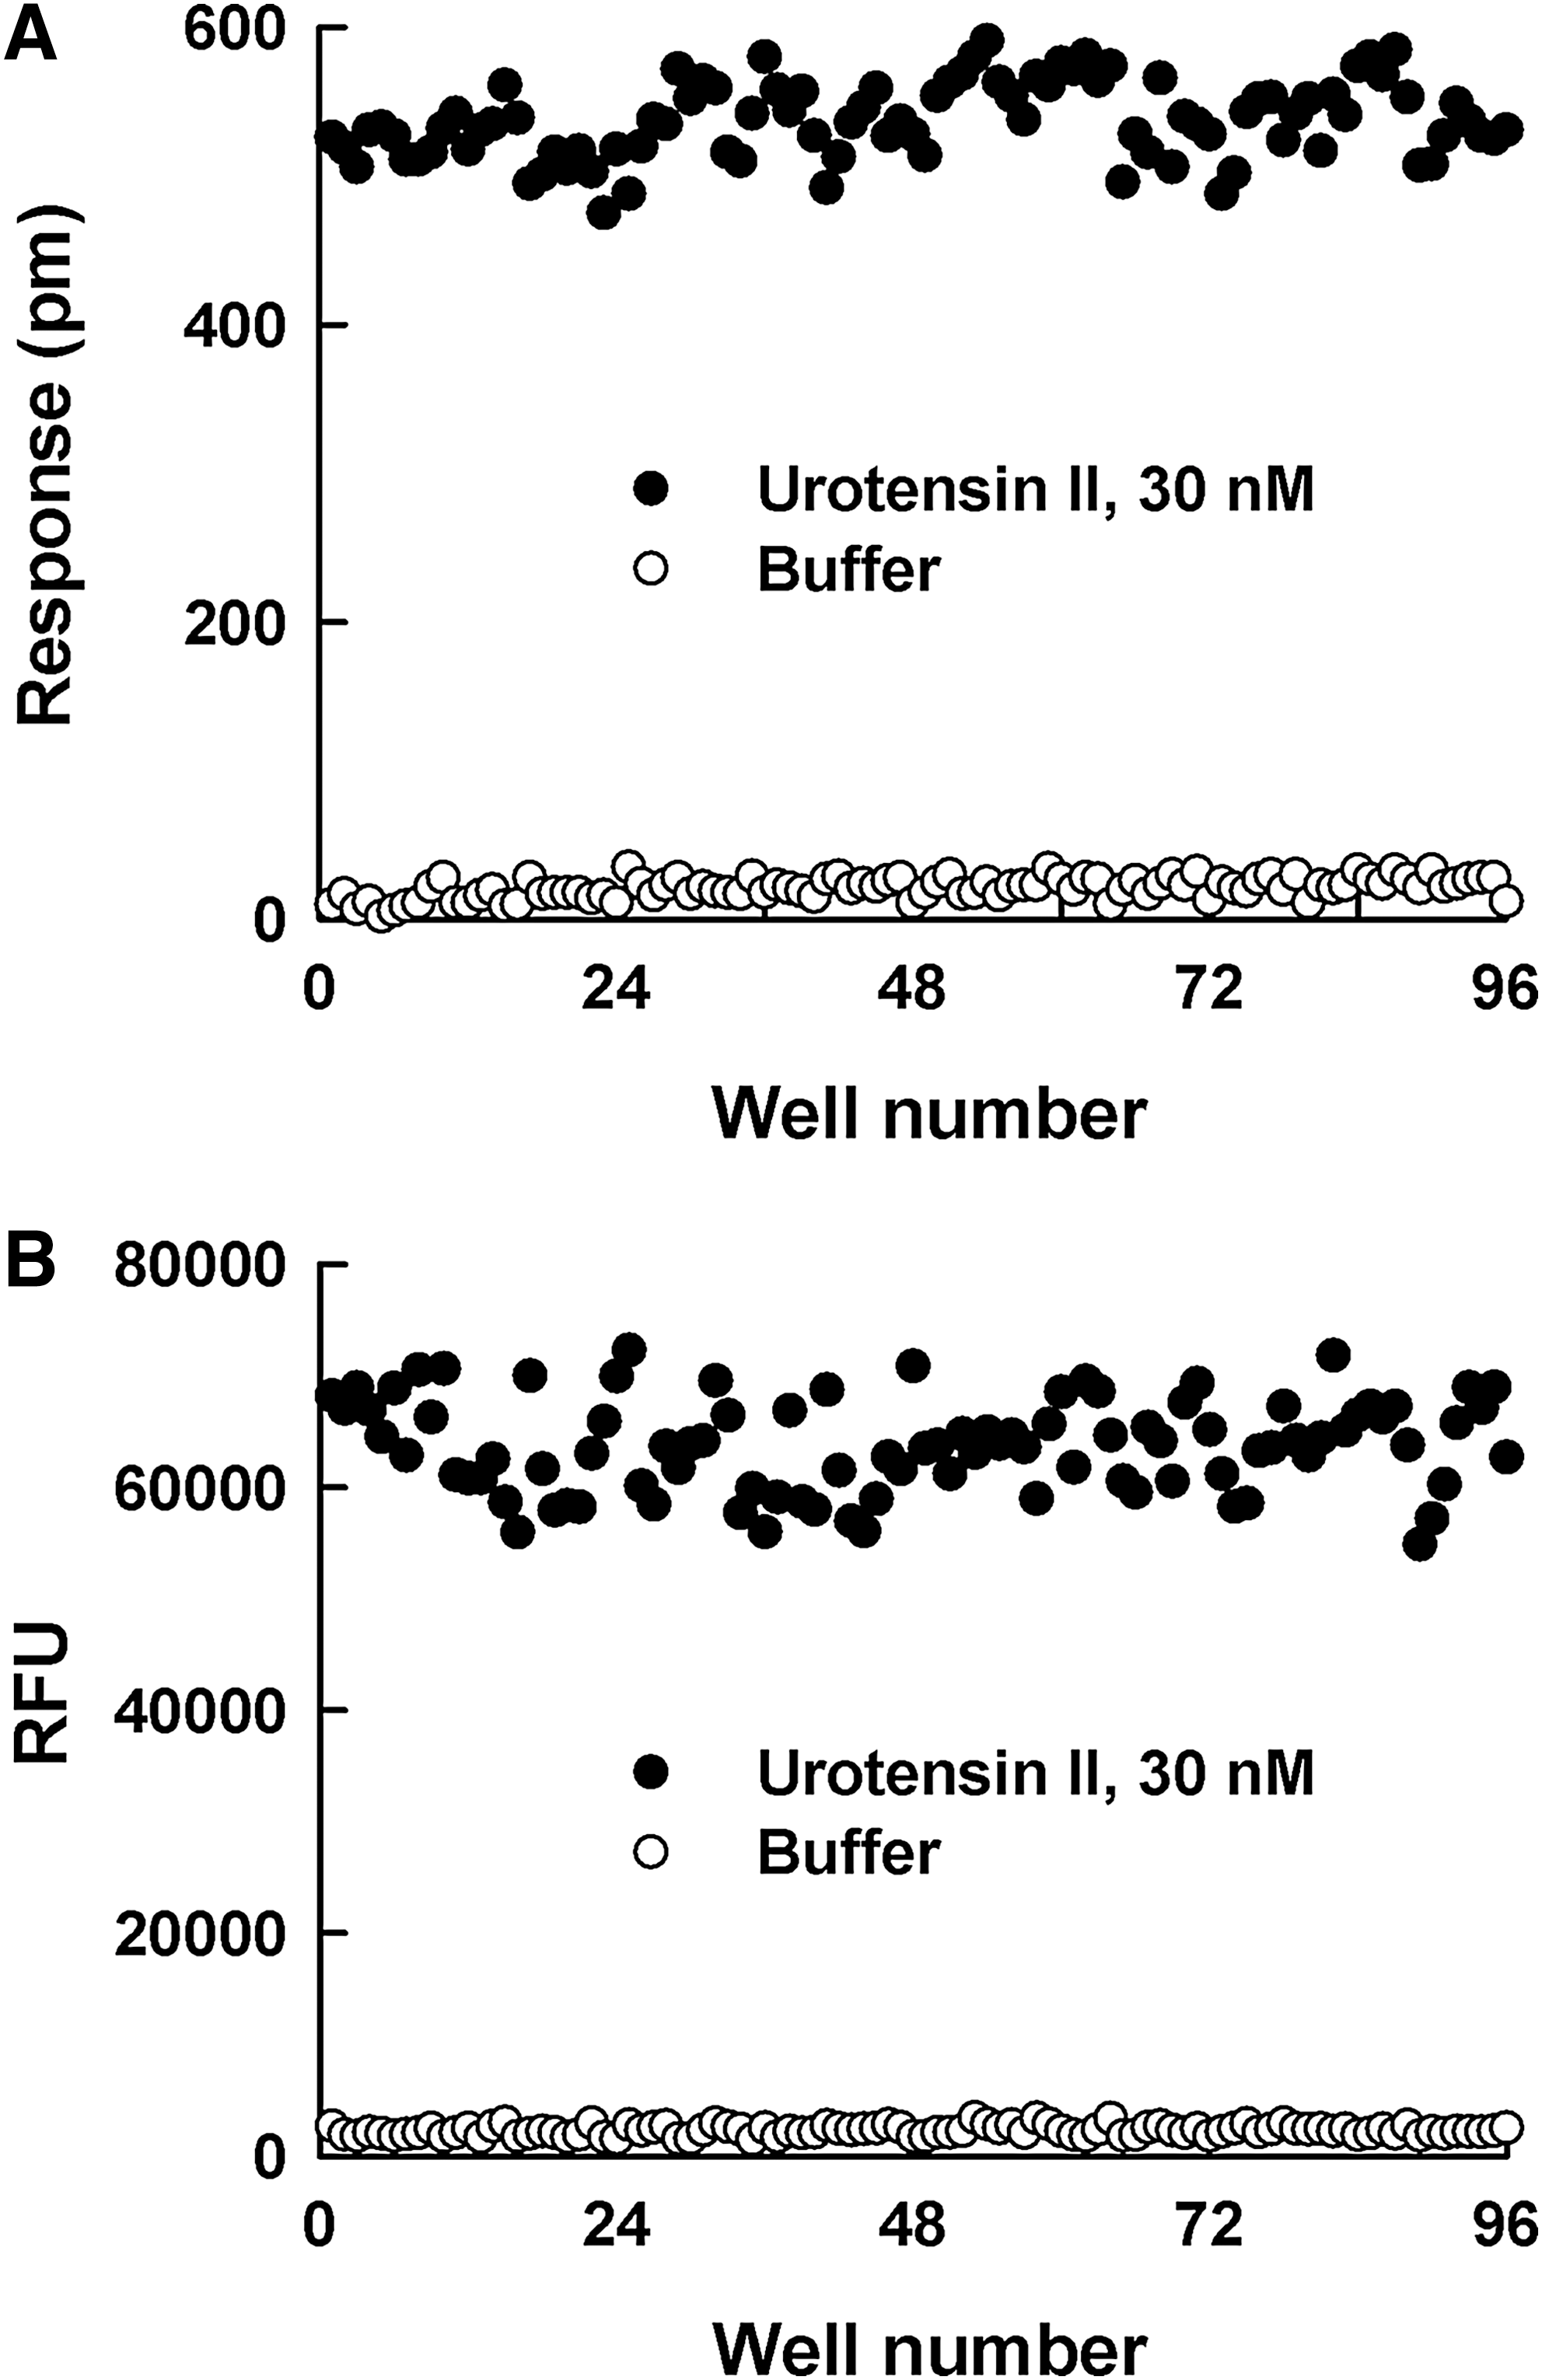
Scatter plot of adding (●) 30 nM urotensin II and (◯) buffer control values from the
DMR Responses Induced by Known UT Receptor Antagonists
SB657510 and GSK1562590, assumed to be antagonists, may behave as inverse agonists presenting negative efficacy in the DMR assay (Fig. 5A, B); however, these effects were not detected in the calcium mobilization assay (Fig. 6A, B). Although SB657510 exhibited negative efficacy in the DMR assay, the window was too shallow to quantitate the EC50 value of SB657510. GSK1562590 exerted stronger negative efficacy than SB657510 with EC50 value of 34.9 ± 14.9 nM. In case of urantide, it behaved as a partial agonist resulting in positive efficacy in the DMR assay. As shown in Figure 5C, the treatment of urantide in UT receptor-expressing cells evoked concentration-dependent DMR increase with EC50 value of 9.6 ± 3.3 nM. However, in the calcium mobilization assay, the agonist response by urantide was too low to determine the dose response (Fig. 6C).
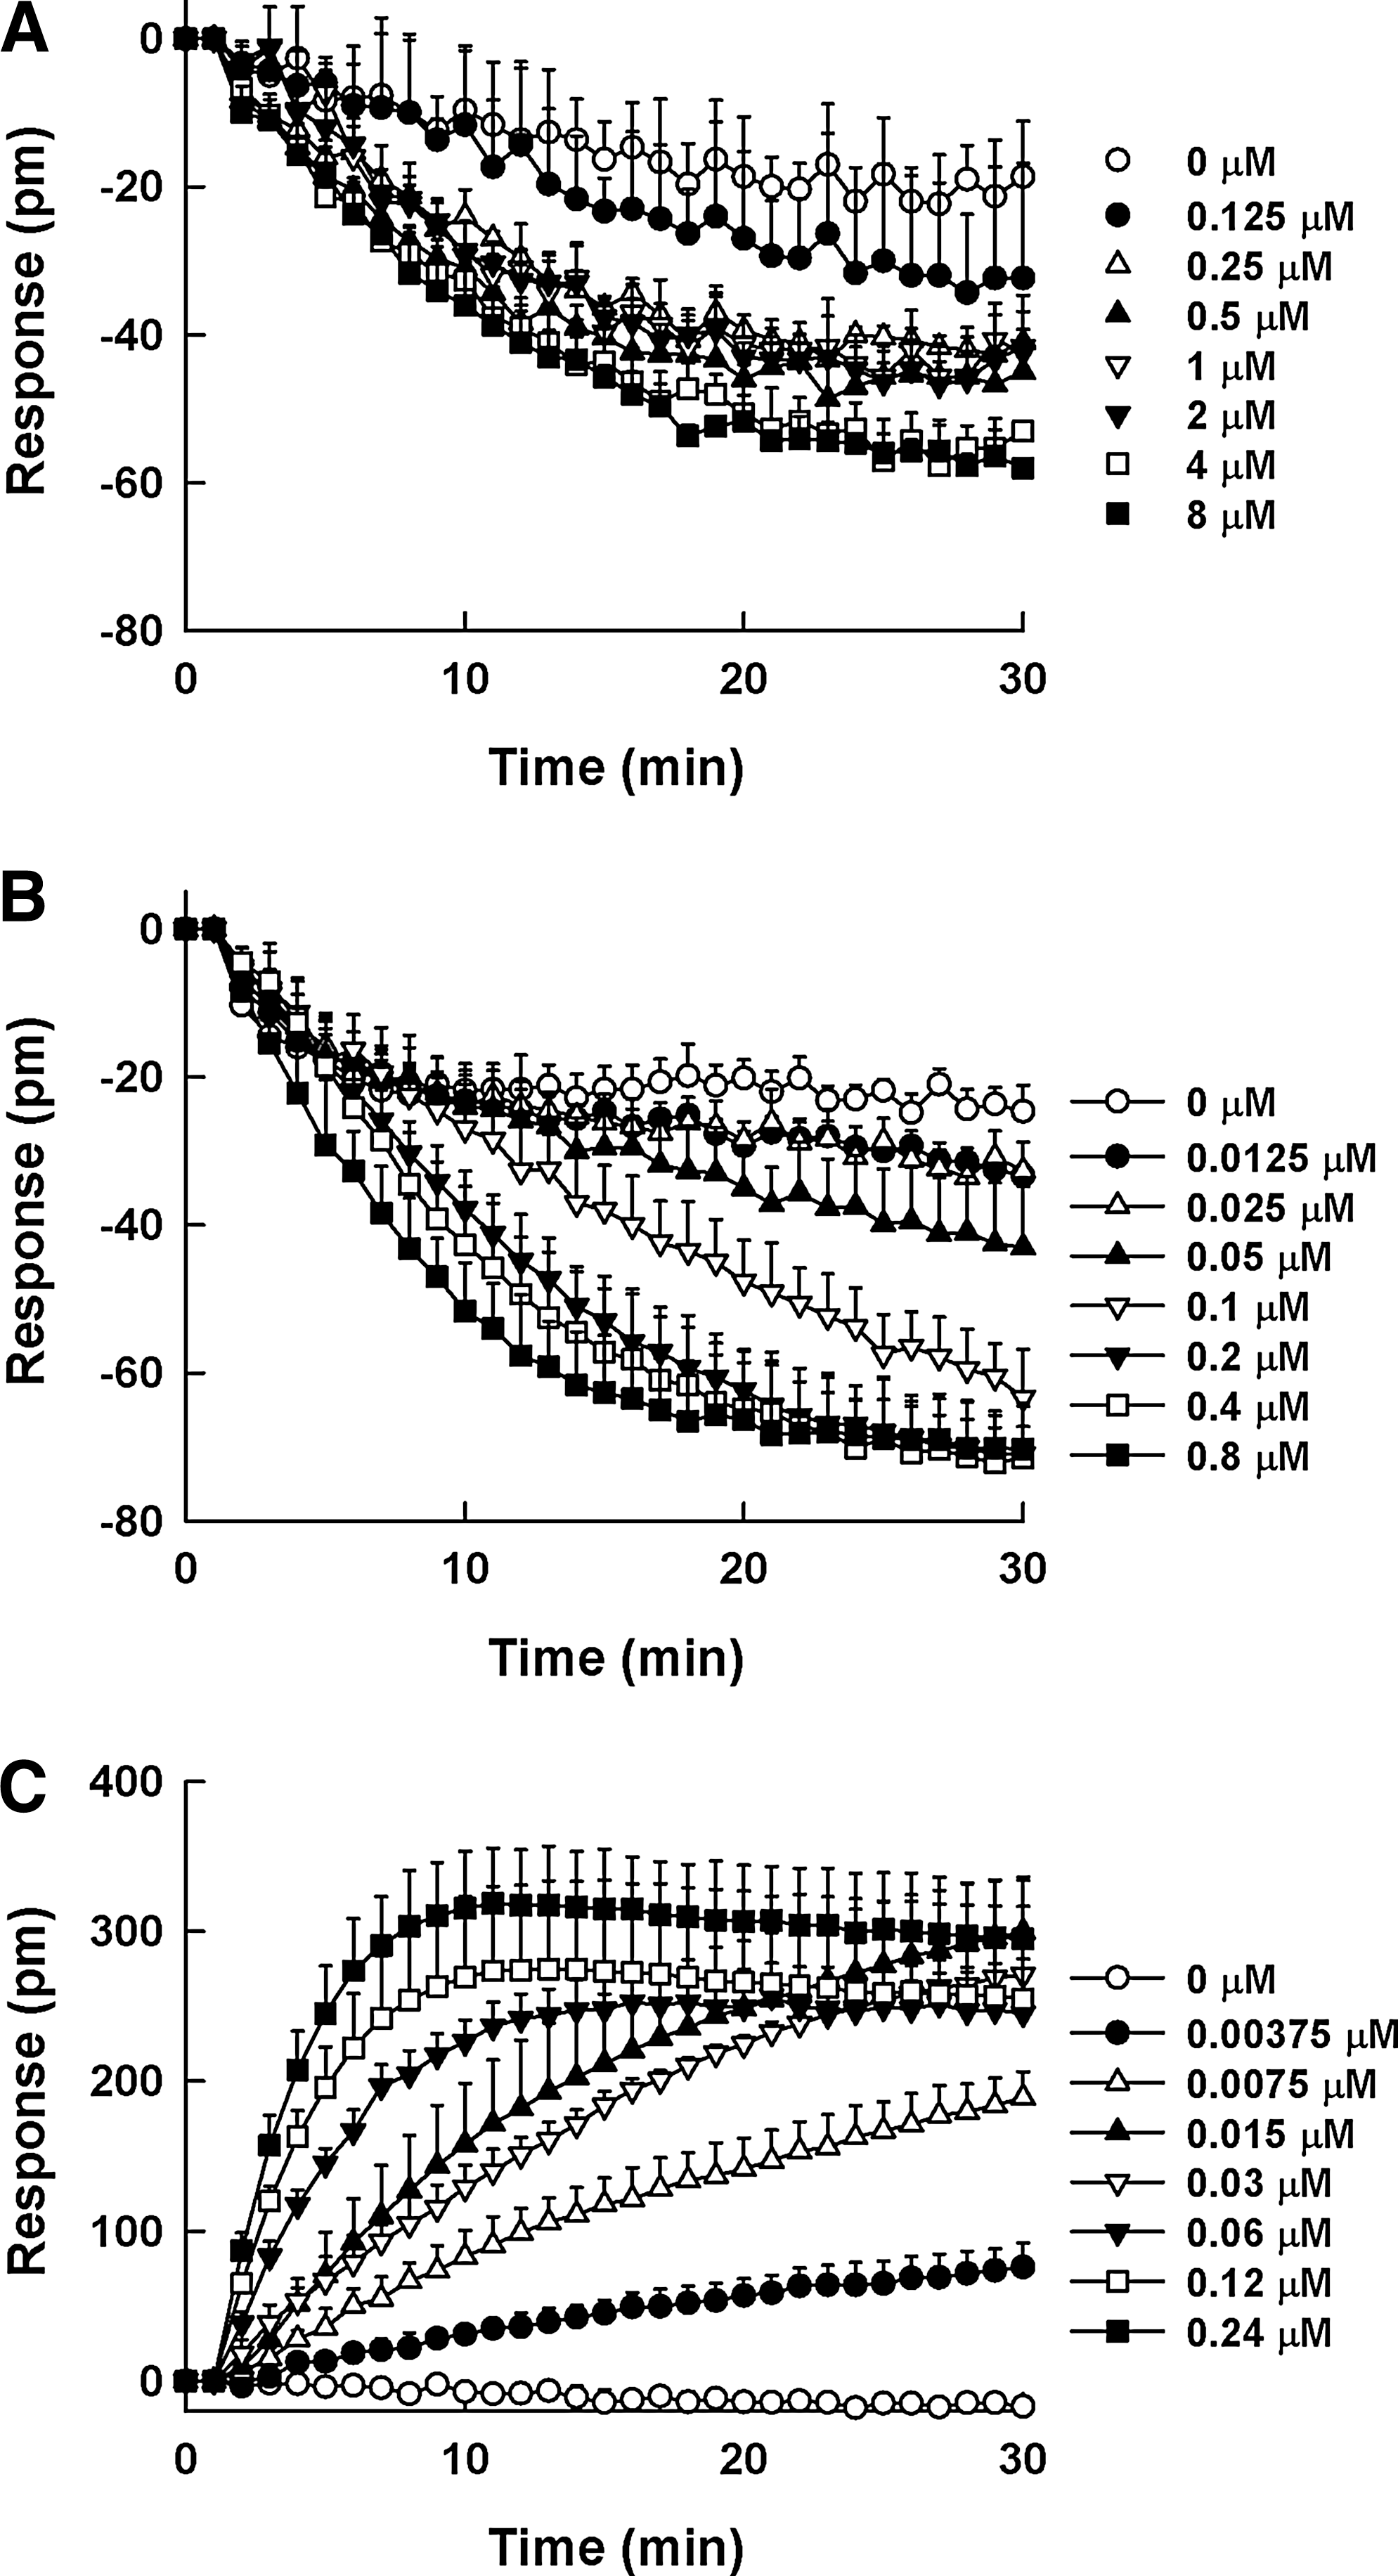
Dynamic mass redistribution (DMR) profiles of SB657510
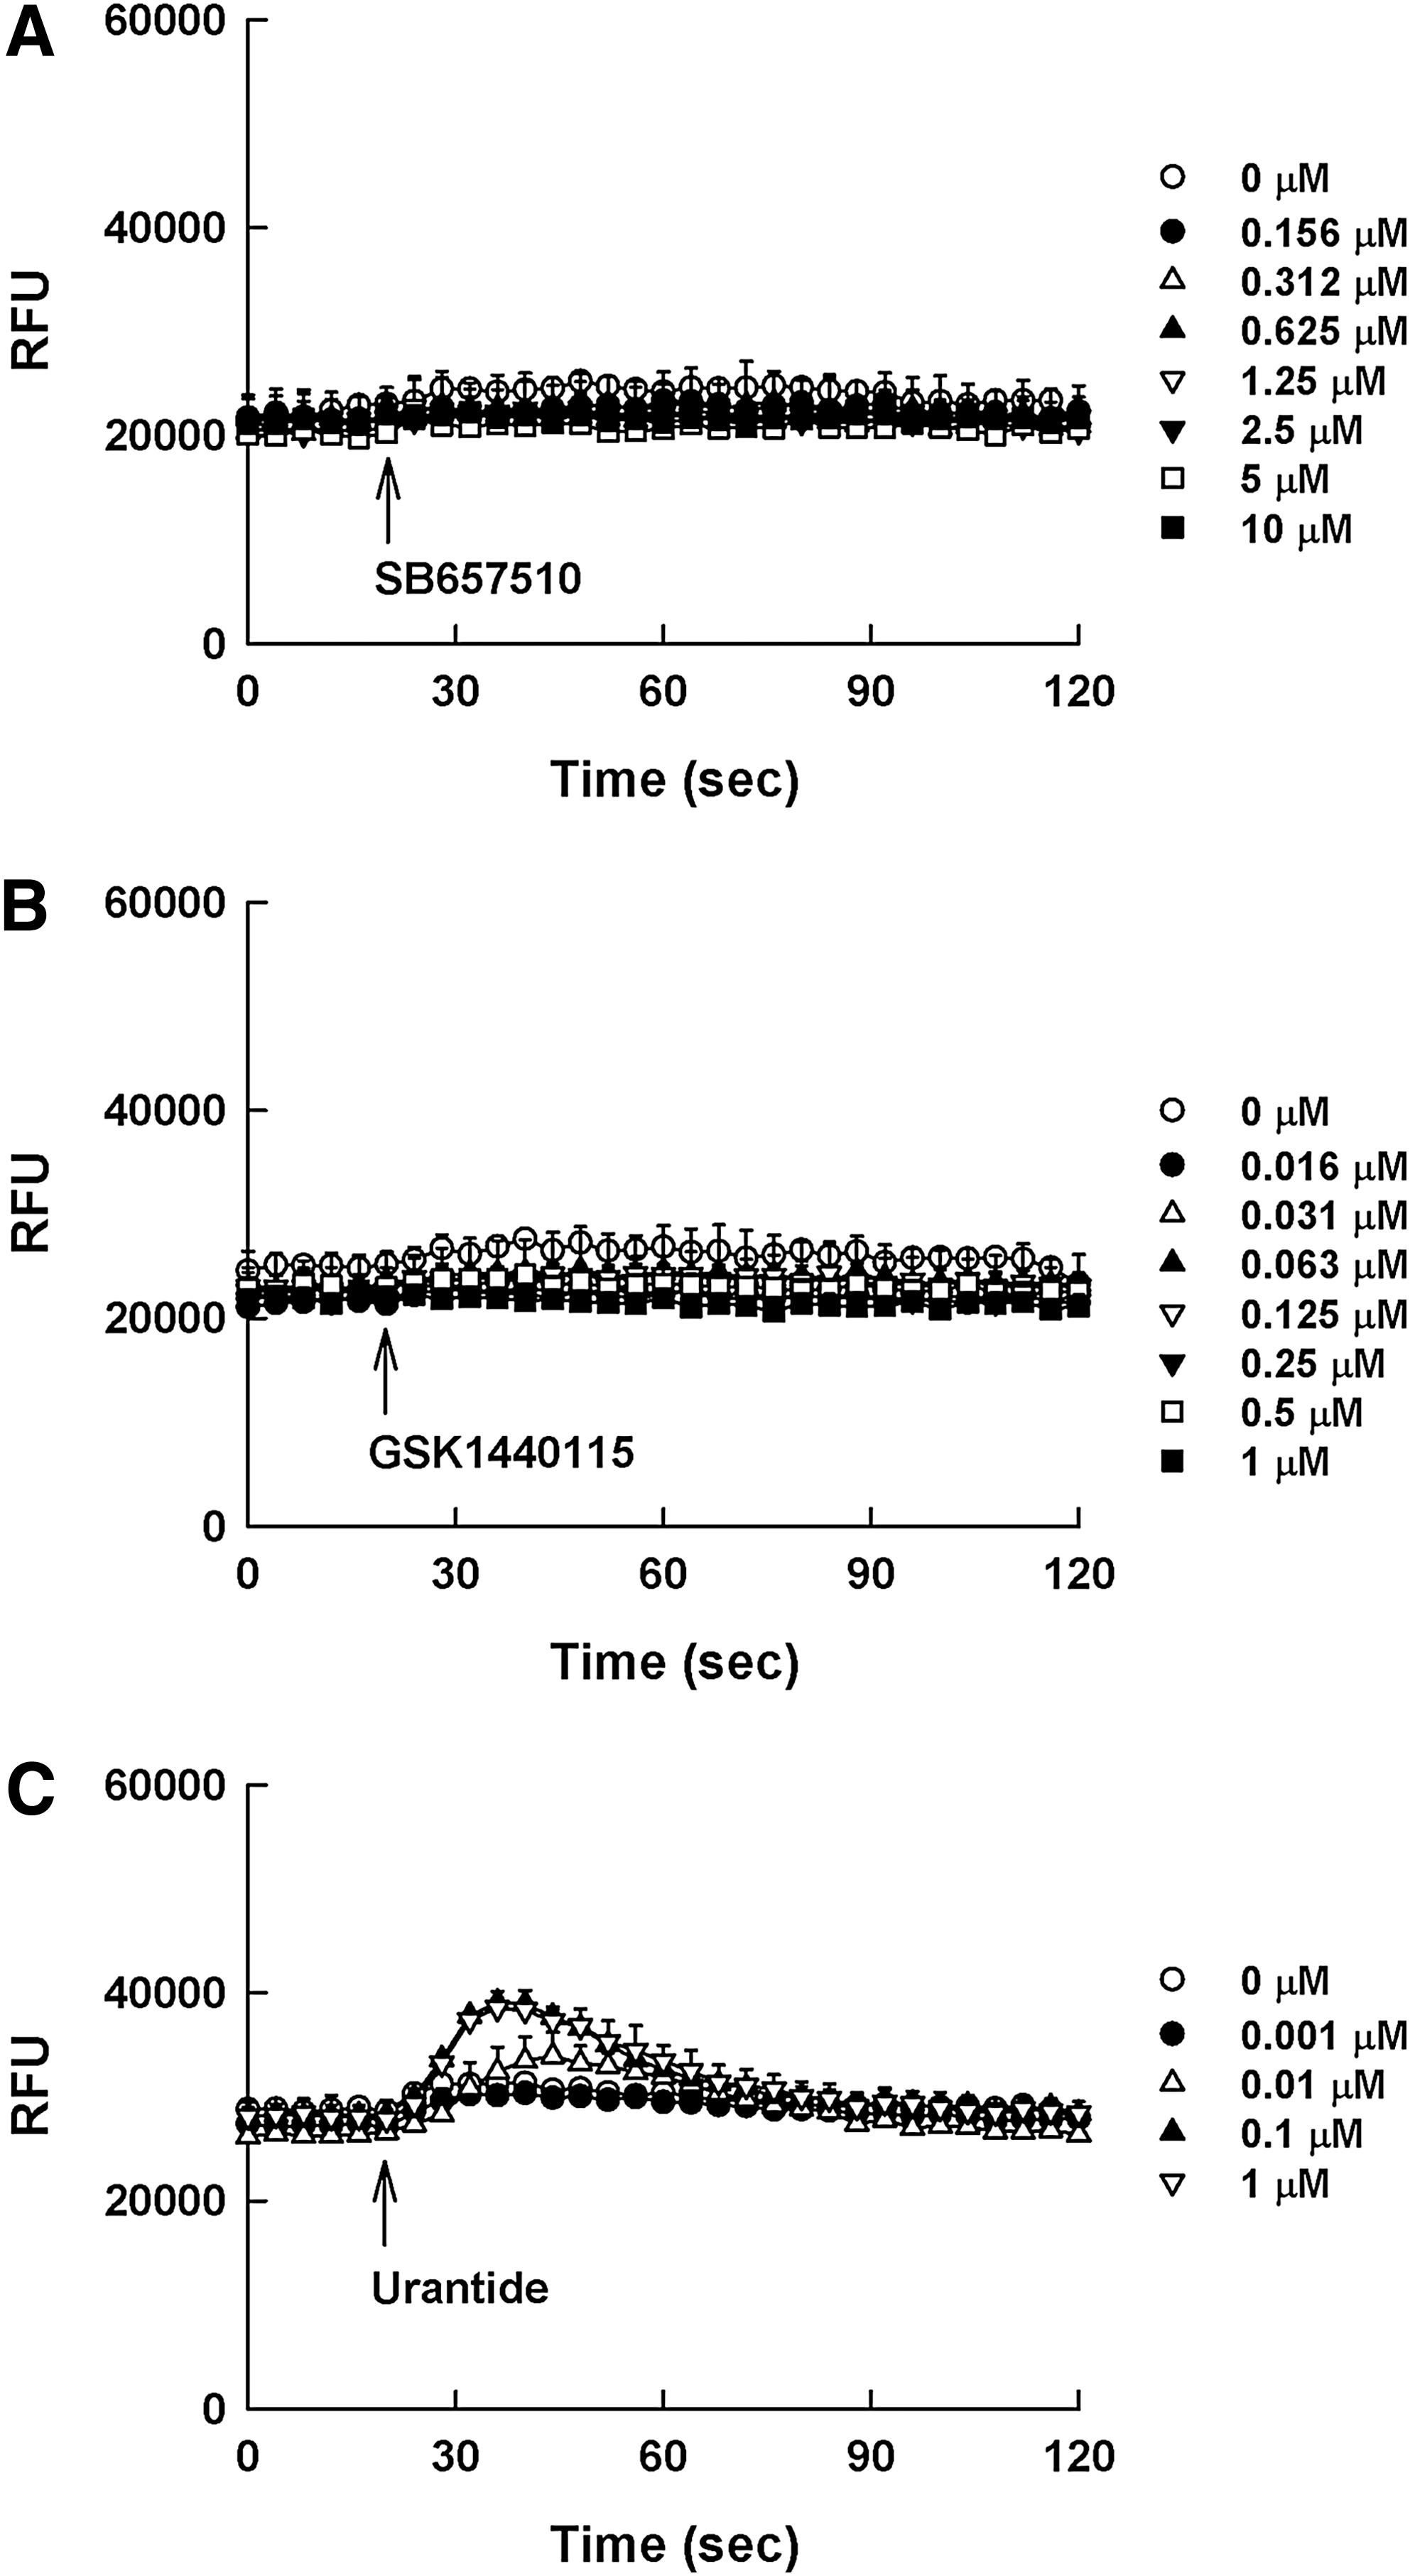
Calcium profiles of SB657510
In addition, as shown in Figure 7, the IC50 values for GSK1562590 (47.5 ± 7.0, 50.2 ± 11.2, and 47.4 ± 13.7 nM at 0.3, 3, and 30 nM of UII, respectively) in the DMR assay were almost same whether the challenge stimulus came from around EC20 to EC80 of UII (0.3–30 nM). On the other hand, the antagonistic calcium response of GSK1562590 was measurable only at 30 nM UII (3.3 ± 0.7 nM).
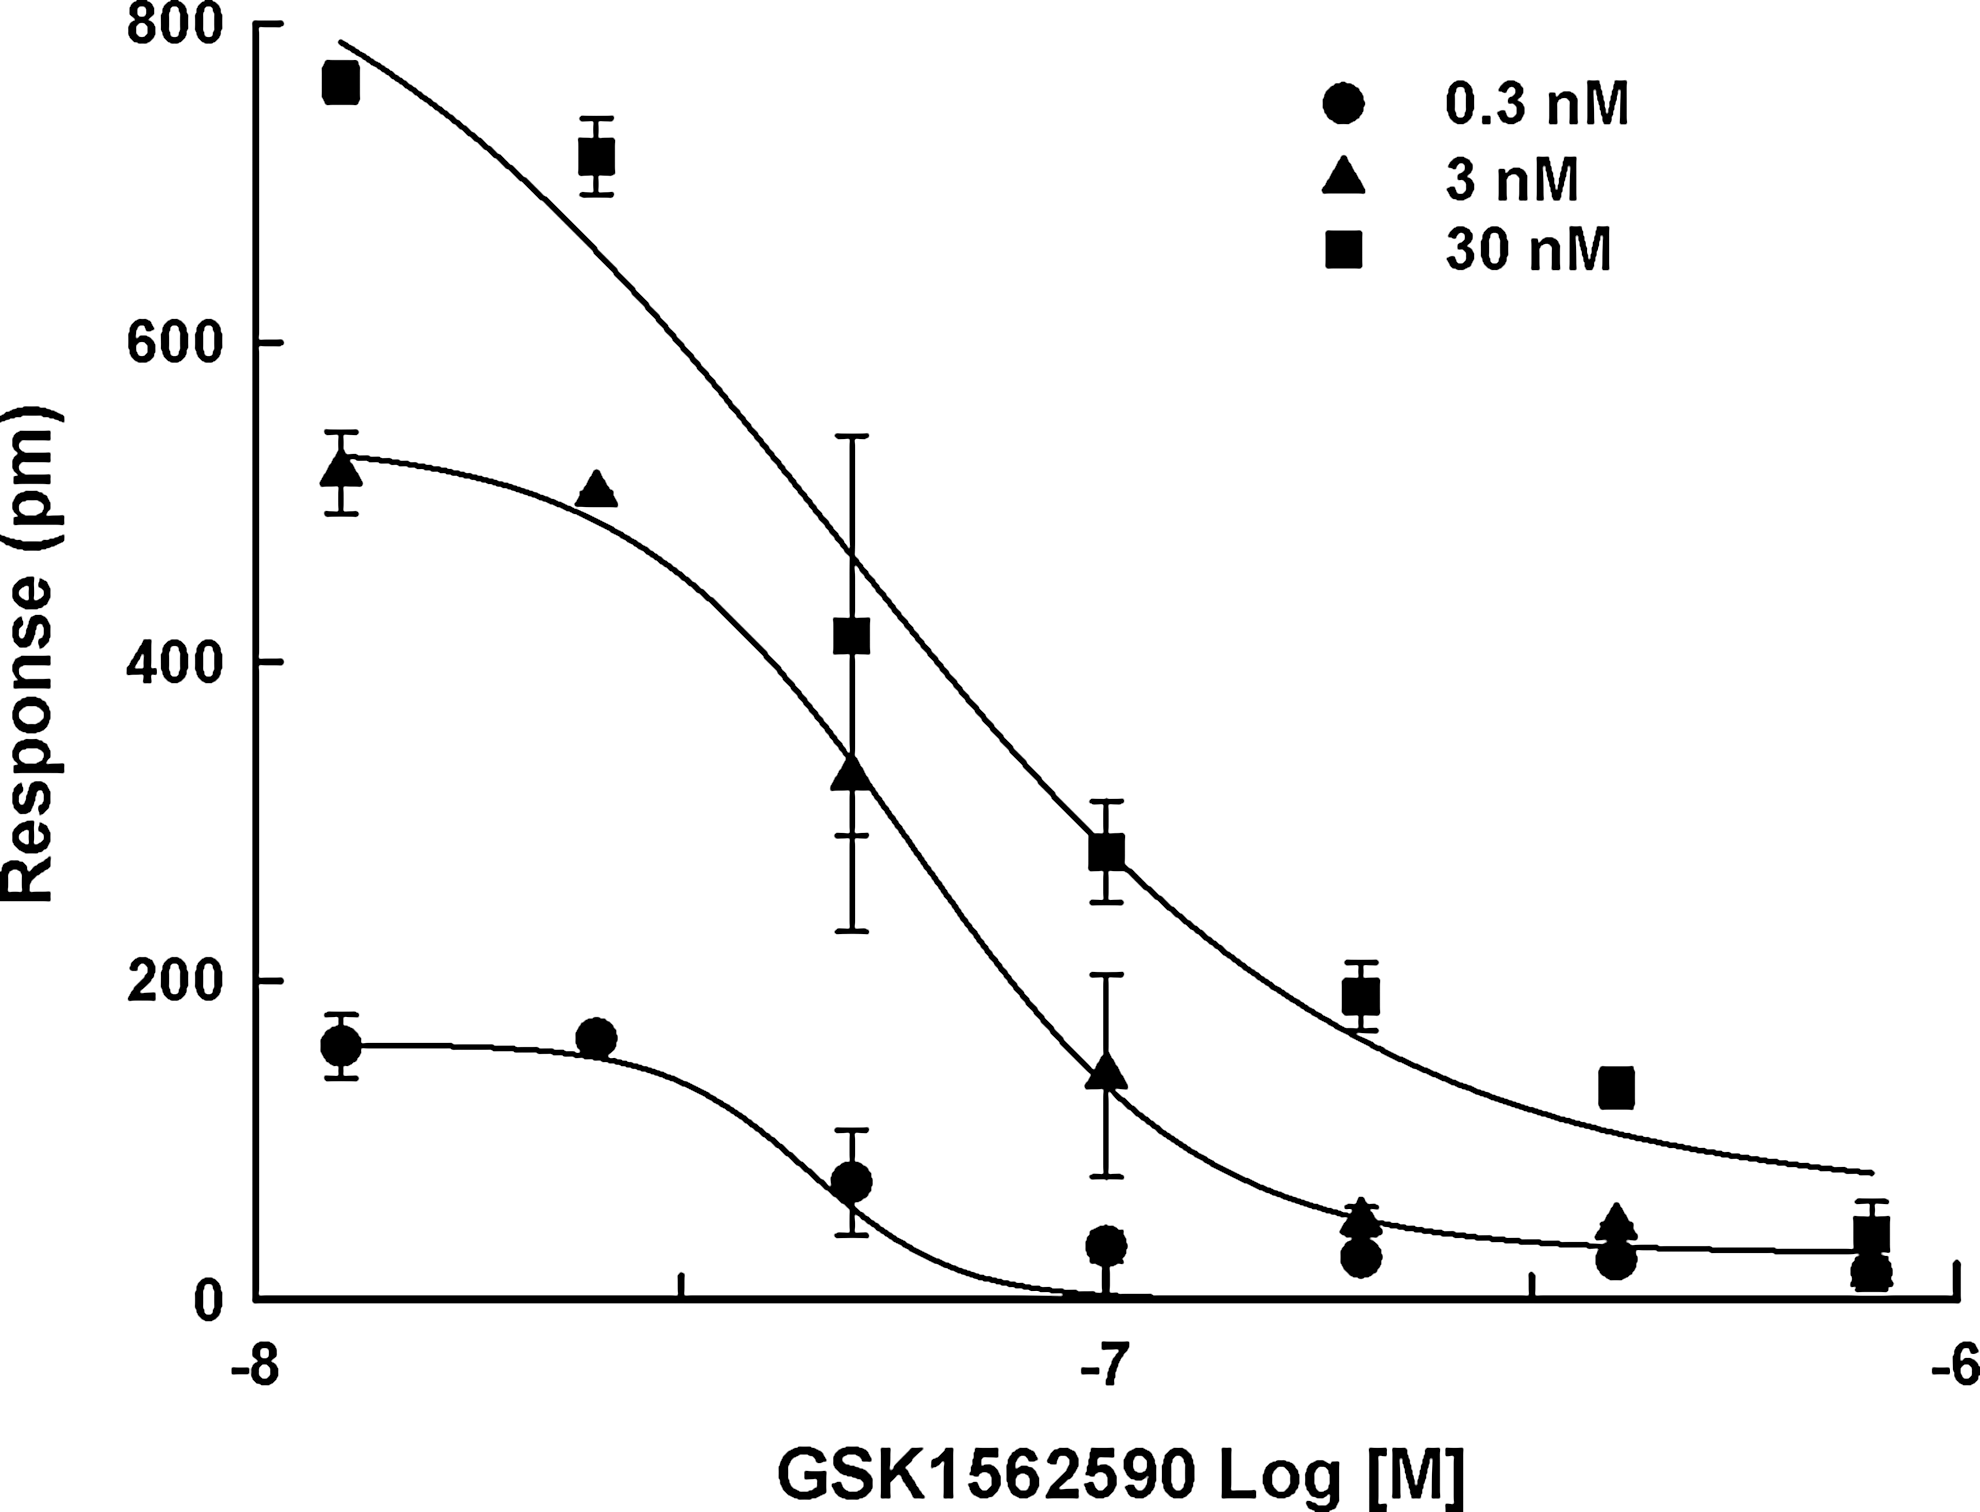
The antagonistic response of GSK1562590 at (●) 0.3, (▲) 3, and (■) 30 nM of UII. The concentration range (0.3–30 nM) is around EC20 to EC80 of UII. Data were expressed as the mean±SD of triplicate wells (n=3).
Discussion
In the present study, we demonstrated the development and validation of the DMR assay and its application for the functional analysis of UT receptor antagonists. In addition, these experimental results from DMR technology were compared with the conventional calcium mobilization assay. Our work has been started by evaluating the optimum cell density for the DMR assay and calcium mobilization assay. The addition of 100 nM UII elicited a positive DMR response, and the maximum DMR response was observed at a density of 30,000 cells/well of HEK293UT cells in 384-well plates. The maximum calcium signal was also observed at 100,000 cells/well in 96-well plates. The optimum cell density was almost similar in both assays in terms of cell number versus working volume. In comparison of agonism performance between the DMR and calcium mobilization assays, the stimulation of UII at various concentrations (0–100 nM) to HEK293UT cells evoked positive responses in both the DMR and calcium assays in a concentration-dependent manner. The calculated EC50 value (4.58) for UII in the DMR assay was very similar with that in the calcium mobilization assay (4.15 nM). Interestingly, the DMR and calcium responses were absent in parental HEK293 cells.
In antagonism study to validate the DMR and calcium mobilization assays with reference compounds, the known UT receptor antagonists, such as SB657510, GSK1562590, and urantide, presented a typical concentration-dependent antagonist response. The IC50 values of SB657510, GSK1562590, and urantide in the DMR assay were 1,880, 47.4, and 10.7 nM, respectively, which were less potent than those in the calcium mobilization assay (528, 3.3 and 8.1 nM, respectively). The possible explanation of these differences may be in part due to selectivity of compounds as well as the measurements of an overall cellular response in the DMR assay rather than the target-mediated event along defined signaling pathway in the calcium mobilization assay. Indeed, some DMR studies has reported similar differences compared with other assays. 19
The quality of DMR and calcium mobilization assays for UT receptor was evaluated by the Z′ factor determination and the distribution of signal-to-background (S/B) data. The S/B ratio provides an indication of separation of positive and negative control data that can be used to estimate the quality of an assay. The Z′ factor analysis is also a standard approach to evaluate the quality of assay for its potential use as a screening tool involving a large number of comparisons. 20 Generally, the Z′ factor greater than 0.5 was accepted as a qualified assay system for the HTS campaign. The DMR signal evoked by UII presented similar separation with calcium mobilization. The calculated S/B ratios of the DMR and calcium mobilization assay were 25.6 and 28.0, respectively. The Z′ factor for the DMR assay was calculated as 0.81, representing similar signal stability with the calcium mobilization assay (Z′ factor: 0.77). These results suggest that the DMR assay can achieve the desired sensitivity and reproducibility that can be adapted for cell-based functional assay. When comparing the two assays, DMR assay versus calcium mobilization assay, the DMR assay needs a significant cost for optical biosensor microplates, whereas the calcium mobilization assay needs various reagents, including fluorometric plates and the homogeneous calcium assay dye.
In inverse and partial agonism studies with reference compounds, SB657510 and GSK1562590 may behave as inverse agonists presenting negative efficacy in the DMR assay, whereas these negative effects were not detected in the calcium mobilization assay. In HEK293UT cells, treatment of SB657510 and GSK1562590 concentration dependently reduced the DMR response below the basal level. This result suggests that therapeutic actions of SB657510 and GSK1562590 may involve not only receptor blockade but also the decrease of spontaneous UT receptor population or activity. Recent study suggests that as many as 85% of tested antagonists behave as inverse agonist. 21 The ability to differentiate the antagonist and/or inverse agonist properties is very important since this may help to guide a decision on the therapeutic administration. 19 Although the possible physiological role of the inverse agonist is not evident in vivo, this type of new possibility has a significant meaning as there is pressing requests for the additional in vitro research tools to fill the gap between in vivo and in vitro.
Urantide, known as an antagonist, 15 behaved as a partial agonist resulting in positive efficacy in the DMR assay. The treatment of urantide in UT receptor-expressing cells evoked concentration-dependent DMR increase with EC50 value of 9.6 nM. This result in the DMR assay suggests that therapeutic actions of urantide may involve not only receptor blockade against UII but also the partial increase of spontaneous UT receptor potential. However, in the calcium mobilization assay, the agonist response by urantide was too low to determine the agonist dose response. The normal S/B ratio for the UT receptor calcium assay was 28, but the S/B ratio in agonist response by urantide was less than 2.
In addition, an EC80 of agonist is typically used for antagonist screening in the calcium mobilization assay because it provides the necessary signal window for detecting inhibitory responses. 22 However, as long as the signal window is robust, lower agonist treatment for the antagonist screening could be beneficial. In the DMR assay, the IC50 values for GSK1562590 (47.5, 50.2, and 47.4 nM at 0.3, 3, and 30 nM of UII, respectively) were almost same whether the challenge stimulus came from various concentrations of UII. This concentration range (0.3–30 nM) is around EC20 to EC80 of UII. These results suggest that the DMR assay could have a greater sensitivity over the calcium mobilization assay for detecting antagonists regardless of the degree of agonist stimulus.
The DMR technology is an emerging tool in the research field of receptor biology as well as drug pharmacology. In this study, two different cell-based functional assays, such as DMR and calcium mobilization assay, were compared for performances to measure the functional activity of UT receptor antagonists. The DMR assay offers an integrated, quantitative, and dynamic representation of UT receptor activation. Moreover, this assay can allow us to characterize compound functions, such as agonist, antagonist, partial, and inverse agonists with its superior sensitivity. However, the calcium mobilization assay addressed classical agonist and antagonist functions in a cost-effective platform. Therefore, this DMR assay can be a strong addition for those conventional methods in the fields of receptor studies applicable to evaluate the functional activity of drug candidates for UT receptor.
Footnotes
Acknowledgments
This study was supported by a grant of the Technology Innovation Program (10038744) of Korea Evaluation Institute of Industrial Technology (KEIT) funded by MOTIE and by a grant of the Korea Healthcare Technology R&D Project (A100096), MOHW, Republic of Korea.
Disclosure Statement
No competing financial interests exist.