
Abstract
The intermediate-conductance Ca2+-activated K+ channel KCa3.1 (also known as KCNN4, IK1, or the Gárdos channel) plays an important role in the activation of T and B cells, mast cells, macrophages, and microglia by regulating membrane potential, cellular volume, and calcium signaling. KCa3.1 is further involved in the proliferation of dedifferentiated vascular smooth muscle cells and fibroblast and endothelium-derived hyperpolarization responses in the vascular endothelium. Accordingly, KCa3.1 inhibitors are therapeutically interesting as immunosuppressants and for the treatment of a wide range of fibroproliferative disorders, whereas KCa3.1 activators constitute a potential new class of endothelial function preserving antihypertensives. Here, we report the development of QPatch assays for both KCa3.1 inhibitors and activators. During assay optimization, the Ca2+ sensitivity of KCa3.1 was studied using varying intracellular Ca2+ concentrations. A free Ca2+ concentration of 1 μM was chosen to optimally test inhibitors. To identify activators, which generally act as positive gating modulators, a lower Ca2+ concentration (∼200 nM) was used. The QPatch results were benchmarked against manual patch-clamp electrophysiology by determining the potency of several commonly used KCa3.1 inhibitors (TRAM-34, NS6180, ChTX) and activators (EBIO, riluzole, SKA-31). Collectively, our results demonstrate that the QPatch provides a comparable but much faster approach to study compound interactions with KCa3.1 channels in a robust and reliable assay.
Introduction
The intermediate-conductance Ca2+-activated K+ potassium channel KCa3.1 is widely expressed throughout the body and found in cells of the hematopoietic system (i.e., erythrocytes, platelets, T cells, B cells, mast cells, monocytes/macrophages, microglia), epithelial tissues in the lung and gastrointestinal tracts, as well as in vascular endothelial cells, fibroblasts, and proliferating neointimal vascular smooth muscle cells. 1 –6 Similar to the related small-conductance KCa2 channels (SK), KCa3.1 channels have fewer charges in their S4 segment than voltage-gated potassium channels and do not respond to changes in membrane voltage. 1 The channels instead are activated by Ca2+ binding to calmodulin, 7,8 which functions as their β-subunit and induces Ca2+-dependent channel opening with reported Ca2+ EC50 values for KCa3.1 ranging from 95 to 350 nM. 9 KCa3.1 channels are accordingly able to hyperpolarize the membrane toward the K+ equilibrium potential in response to increases in intracellular Ca2+ and often modulate Ca2+ influx during cellular activation and proliferation by sustaining Ca2+ entry through Ca2+-release activated Ca2+ (CRAC) or transient receptor potential channels (see reviews by Cahalan and Chandy 10 and Wulff and Castle 11 ). For example, in T lymphocytes, the expression of KCa3.1 channels is known to be upregulated following activation. Genetic deletion as well as pharmacological channel inhibition reduce T-cell Ca2+ signaling and inhibit IL-2 production and T-cell proliferation. 12,13 KCa3.1 is similarly involved in the activation and proliferation of B cells, fibroblasts, and dedifferentiated vascular smooth muscle cells, making KCa3.1 blockers attractive potential drugs for restenosis, asthma, and immunosuppression. 5,14 –18 Based on the role of KCa3.1 in erythrocyte volume regulation and intestinal fluid and electrolyte secretion, 6,19 KCa3.1 blockers have also been suggested for the treatment of sickle cell anemia and diarrhea in humans and farm animals. 20,21
In vascular endothelium, KCa3.1 is expressed together with the small-conductance KCa2.3 channel, and both channels are involved in generating endothelium-derived hyperpolarization (EDH), which then spreads to the underlying vascular smooth muscle cell layer, closes voltage-gated calcium channels, and finally produces relaxation and vasodilation. 22 –25 While mice deficient in KCa3.1 and/or KCa2.3 exhibit impaired EDH responses and an increased mean arterial blood pressure, 26 KCa3.1 activators have been shown to lower blood pressure in normotensive and hypertensive mice as well as in dogs, suggesting that KCa3.1 activators could potentially constitute novel antihypertensives. 27 –29
Taken together, KCa3.1 is an attractive and, based on the fact that groups in both the pharmaceutical industry and academia have identified potent and selective KCa3.1 blockers, highly druggable target (see reviews by Wulff and colleagues 11,30 ). However, the existing compounds have multiple issues, such as short remaining patent-lives, low oral availability, and lack of brain penetration, which would be desirable to target microglial KCa3.1 channels in stroke and Alzheimer's disease. 31 –33 There is, therefore, a need for assays to identify KCa3.1 modulators with different pharmacophores. Scientists at NeuroSearch A/S in Denmark recently described a 384-well high-throughput Tl+-influx assay capable of screening a 200,000 compound library in approximately 6 weeks. 34 Here, we report the development of a QPatch-based electrophysiology assay, which is suitable for secondary screening and produces concentration–response curves for both KCa3.1 blockers and activators comparable to manual electrophysiology.
Materials and Methods
KCa3.1 Cell Line
HEK293 cells stably expressing hKCa3.1 were obtained from Khaled Houamed (University of Chicago, IL) in 2002 and have been maintained in the Wulff laboratory at the University of California since then. The cells were cultured in Dulbecco's modified Eagle's medium (DMEM, 25 mM glucose) supplemented with 10% fetal bovine serum, 2 mM L-glutamine, 1 mM Na+ pyruvate, 100 units/mL penicillin, 100 μg/mL streptomycin, and 1 μg/mL puromycin to maintain selection pressure. Cells were maintained at 37°C in a 5% CO2 atmosphere and typically passaged when they were 70%–80% confluent.
Cell Preparation
On the day of the experiment, cells grown in T175 tissue culture flasks to ∼70% confluency were rinsed once in 15 mL of sterile phosphate-buffered saline containing 0.02% EDTA, and lifted with 2 mL of TrypLE™ Express (Gibco [Life Technologies]) for ∼2 min. When cells were rounded but not detached, cells were dislodged from culture flask surface by gentle tapping. Cells were washed and suspended in 10–12 mL DMEM and centrifuged at 125 g for 5 min at room temperature. The supernantant was removed and cells resuspended in 2 mL of external solution. A portion of the cells (1 mL) were then placed into the Qfuge tube and resuspended in 150–200 μL extracellular solution after one additional spin on the QPatch. The remaining cells were refrigerated and sometimes used for running a second QPlate.
Test Compounds and Assay Plates
Charybdotoxin was obtained from Bachem Biosciences and prepared as a 100 μM stock solution in full DMEM with 10% serum. TRAM-34 and SKA-31 were synthesized in the Wulff laboratory as previously described. 27,35 NS6180 was synthesized at NeuroSearch A/S as described. 36 Riluzole and 1-ethylbenzimidazolin-2-one (EBIO) were purchased from Sigma. All small molecules were dissolved in dimethyl sulfoxide (DMSO) at concentrations of 1 or 10 mM. Compound solutions were prepared immediately before use on the QPatch by dilution of DMSO stock in external solution. DMSO concentrations ranged from 0.01% to 0.1%. The only exception was EBIO, for which concentrations of up to 1% were necessary to test 25, 75, and 100 μM. (We previously determined that KCa3.1 currents are not affected by 1% of DMSO. 27 ) Charybdotoxin was diluted with external solution containing 0.1% of serum. Glass vial inserts (Sophion Biosciences) were filled with 350–400 μL of compound solution and placed into the glass insert base plate for use in the QPatch assay.
Electrophysiology
Whole-cell patch-clamp experiments were carried out on a QPatch-16 automated electrophysiology platform (Sophion Biosciences) using disposable 16-channel planar patch chip plates (QPlates; patch hole diameter ∼1 μm, resistance 2.00±0.02 MΩ). Cell positioning and sealing parameters were set as follows: positioning pressure −70 mbar, resistance increase for success 750%, minimum seal resistance 0.1 GΩ, holding potential −80 mV, holding pressure −20 mbar. To avoid rejection of cells with large KCa3.1 currents, the minimum seal resistance for whole-cell requirement was lowered to 0.001 GΩ. Access was obtained with the following sequence: (1) suction pulses in 29 mbar increments from −250 mbar to −453 mbar; (2) a suction ramp of an amplitude of −450 mbar; (3) −400 mV voltage zaps of 1 ms duration (10×). Following establishment of the whole-cell configuration, cells were held at −80 mV and KCa3.1 currents elicited by a voltage protocol that held at −80 mV for 20 ms, stepped to −120 mV for 20 ms, ramped from −120 to +40 mV in 200 ms, and then stepped back to −120 mV for 20 ms. This pulse protocol was applied every 10 s. The external solution was Na+-Ringer's and contained (in mM): 160 NaCl, 10 HEPES, 4.5 KCl, 1 MgCl2, 2 CaCl2 (pH 7.2, 310 mOsm). The internal solution contained (in mM): 120 KCl, 10 HEPES, 1.75 MgCl2, 1 Na2ATP, 10 EGTA and different amounts of CaCl2 (4.6 for 150 nM; 5.4 for 200 nM and 8.6 for 1 μM) to achieve different concentrations of free Ca2+ (pH 7.4, 300 mOsm). Free Ca2+ concentrations were calculated using the 7/3/2009 online version of MaxChelator (
Data Analysis
Current slopes (in amperes per second) were measured using the Sophion QPatch software and exported to Microsoft Excel and Origin 7.0 (OriginLab Corp.) for analysis. Each current slope is the average of three measurements taken at the end of the respective liquid period (marked by double lines in the figures). Increases or decreases of slopes between −85 and −65 mV were used to calculate KCa3.1 inhibition or activation. Data fitting to the Hill equation to obtain EC50 and IC50 values was performed with Origin 7.0. Data are expressed as mean±SD. For activator testing, each cell served as its own maximal control and the increases in current slope were normalized to the effect obtained with a saturating activator concentration applied during the last two liquid periods before the final washout.
Results
KCa3.1 Assay Establishment
We first established the assay conditions using HEK293 cells stably transfected with human KCa3.1. Since KCa3.1 is voltage-independent, our group and many others typically record KCa3.1 currents with linear voltage ramps from −120 mV to +40 mV and sufficient free Ca2+ in the intracellular solution to activate these Ca2+/calmodulin-gated channels. With physiological K+ concentrations in the extracellular solution, KCa3.1 reverses close to the K+ equilibrium potential, typically between −90 and −80 mV depending on the exact composition of the solutions and the presence or absence of contaminating chloride background currents in the respective cell line. When manually recording KCa3.1 currents with the EPC10 amplifier, we never leak subtract since KCa3.1 produces sizable inward currents, which can reach amplitudes of several nA at −120 mV when fully activated by Ca2+ or a positive gating modulator. Seal quality during the experiment is accordingly judged not based on the membrane resistance in MΩ (which becomes inaccurate with large inward currents at negative potentials) but based on the position of the reversal potential. Any movement of the reversal potential to more positive values than −80 mV is taken as an indication of the cell getting leaky. We kept these observations in mind for adaptation to automated electrophysiology and set the minimum seal resistance for sealing to 0.1 GΩ but lowered the minimum seal resistance requirement during the ongoing whole-cell experiment to 0.001 GΩ to prevent the software from automatically terminating cells with large KCa3.1 currents due to activator action or high Ca2+ concentrations. The success rate of QPatch recording for KCa3.1 varied significantly in our hands, from 90% seal and 70% completion rate to occasional near complete failure. Since we kept the more easily controllable factors, such as cell density, internal and external solution composition, pH, and osmolarity constant, we attribute these failures, which also routinely occur for manual KCa channel patching in our hands, primarily to the fact that sealing and recording with internal solutions containing elevated concentrations of free intracellular Ca2+ requires the cells to be in absolute “prime” conditions. In contrast, success rates for KF containing internals were much more consistent in our hands and hardly showed any daily variation (data not shown).
As expected, current amplitudes varied depending on the amount of free Ca2+ in the internal solution (Fig. 1). With 150 nM of free Ca2+, only small KCa3.1 currents were detectable, which exhibited maximal amplitudes of 300±198 pA at +40 mV within 100±106 s after break-in (n=20). With slightly higher free Ca2+ concentrations of 200 nM or 250 nM more sizable KCa currents developed in keeping with the steep Ca2+-concentration–response curve of KCa3.1 (4.456±4.554 nA, time to Imax=98.5±65 s, n=20), which typically stabilized after 3–8 min and 1–3 saline additions (Fig. 1C, D). With a higher intracellular-free Ca2+ concentration of 1 μM, KCa3.1 currents developed rapidly (time to Imax 21±35 s, n=20), reached average amplitudes of 14.056±7.723 nA at +40 mV, and stabilized after just a few pulses in most cells (Fig. 1B).
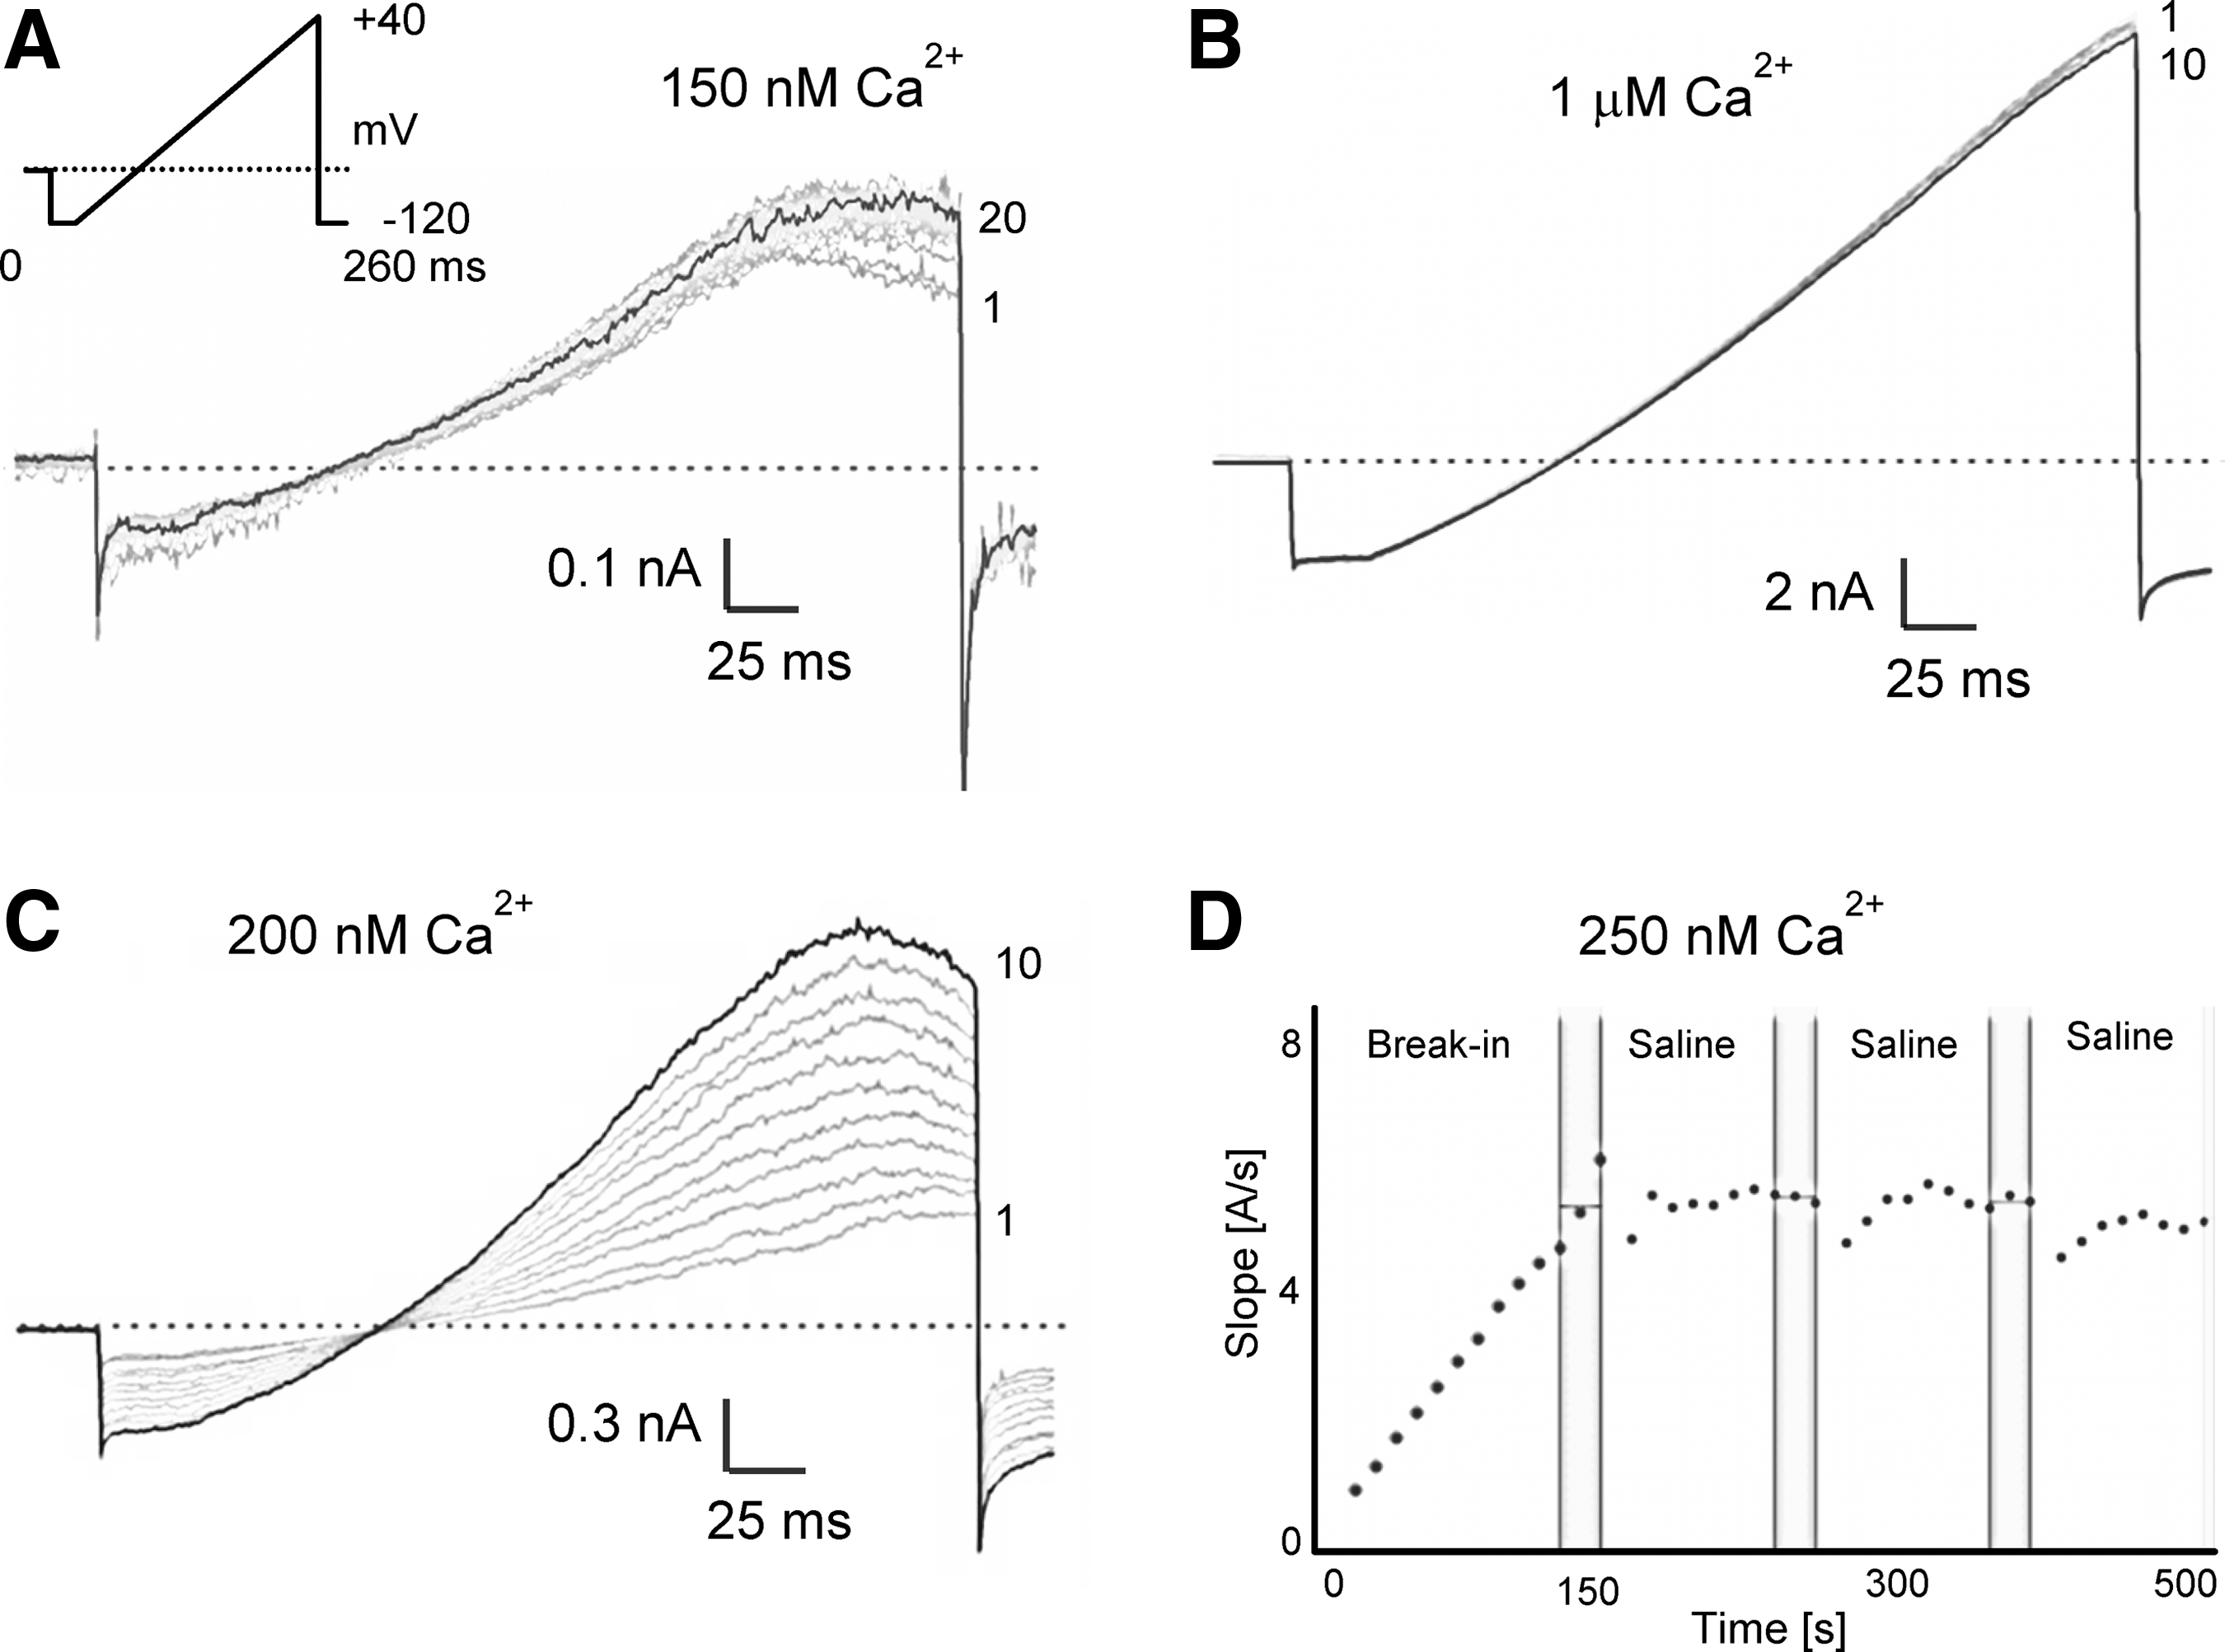
KCa3.1 current amplitudes depend on the amount of free Ca2+ in the internal solution.
According to these different current kinetics and amplitudes, we developed different application protocols for blocker and activator testing. Based on our more than 10 years of manual patch-clamp experience with high intracellular Ca2+ concentrations when testing KCa3.1 blockers on transfected human embryonic kidney (HEK) or COS cells or characterizing KCa3.1 in primary cells, 5,12,14,27,33,35 we decided to design a relatively short application protocol for KCa3.1 blockers since cells rarely withstand 1 μM of free Ca2+ for more than 20–30 min. However, based on the attractively large assay window that control currents activated by 1 μM of Ca2+ produce even in the single hole mode in our assay, we decided against using lower Ca2+ concentrations for blocker testing. Initial break-in was followed by a short stabilization, one saline addition and then three cumulative additions of increasing concentrations of KCa3.1 blockers and then two saline additions for washout (Table 1).
Application Protocol for KCa3.1 Blocker Testing on the QPatch
The VP protocol consisted of 260-ms voltage ramps applied every 10 s.
The volume of the recording chamber on the QPatch is ∼1 μL.
KCa3.1, intermediate-conductance Ca2+-activated K+ channel;
For KCa3.1 activator testing, we picked 250 nM of free intracellular Ca2+ to allow these positive gating modulators, which increase the apparent Ca2+ sensitivity of KCa channels by stabilizing the interaction between calmodulin and the channel, 38 a sufficiently large signal window. However, since KCa3.1 takes some time to turn on with lower calcium concentrations and we often observe when patching manually that mechanically disturbing the cell with repeated perfusions helps with obtaining full access and presumably with Ca2+ diffusion through the cell, we designed a longer application protocol than for the blockers. Three saline perfusions were followed by two additions of a low concentration of activator, two saline washes, two or three consecutive additions of higher activator concentrations (including a concentration producing maximal activation), and three additions of saline for washout (Table 2). This long protocol was chosen to achieve the following three objectives. (1) The control current is really fully developed and has stabilized. Calcium in the intracellular solution promotes resealing and lower concentrations in the range of 200–500 nM free Ca2+ typically require sometime to really diffuse through the cell. When manually patching KCa3.1, we have therefore often observed highly variable control currents that increased as access to the cell improved. (2) The effect of the activator is “real” and not just an increase in access or a reduction in Ca2+ perfusion barriers as a consequence of the mechanical disturbance from the perfusion. We therefore included two saline washes after the first activator concentration and three saline washes at the end of the experiment. (3) The absolute current increases measured as fold-increases for KCa3.1 activators are highly dependent on the exact free intracellular Ca2+ concentration because of KCa3.1's steep Ca2+ dependence. When patching manually, we therefore previously found that it is necessary to average data from many cells for fitting EC50s. As an alternative, we here developed a protocol in which each cell has its own maximum control at the highest activator concentration. This is of course only possible with previously characterized compounds known to be “full agonists.” For compounds from a chemically new series working with fold-increases or bench-marking against a saturating concentration of EBIO or SKA-31 would be more appropriate.
Application Protocol for KCa3.1 Activator Testing on the QPatch
The VP protocol consisted of 260-ms voltage ramps applied every 10 s.
The volume of the recording chamber on the QPatch is ∼1 μL.
Sometimes a fourth concentration of activator was used and the number of VP runs per liquid period reduced to 5 or 7 in the later parts of the protocol.
Evaluation of Assay Performance for KCa3.1 Blockers and Activators
To compare the QPatch assay to manual electrophysiology, we decided to obtain concentration–response curves for several widely used KCa3.1 modulators and selected three blockers and three activators for which we had previously determined IC50 and EC50 values manually. As exemplary blockers, we chose the scorpion toxin peptide charybdotoxin (ChTX) and the small molecules TRAM-3435 and NS6180. 39 Similar to clotrimazole and senicapoc (ICA-17043), 40,41 TRAM-34 is a “classic” triarylmethane-type KCa3.1 blocker, whereas NS6180 is a recently described benzothiazinone (Fig. 2). Both TRAM-34 and NS6180 are potent, with reported IC50 values in the range of 11–25 nM, 35,39 lipophilic and highly plasma protein-bound. The two compounds accordingly seemed good choices for exploring if our assay exhibits any of the right-shifting effect on the concentration–response curves often observed for “sticky” lipophilic compounds in automated assays. As activators (Fig. 2), we selected the “classic” KCa-activator 1-EBIO, the neuroprotectant riluzole and the more potent riluzole derivative SKA-31, which was developed in our laboratory as a more selective KCa3.1/KCa2 channel activator. 27
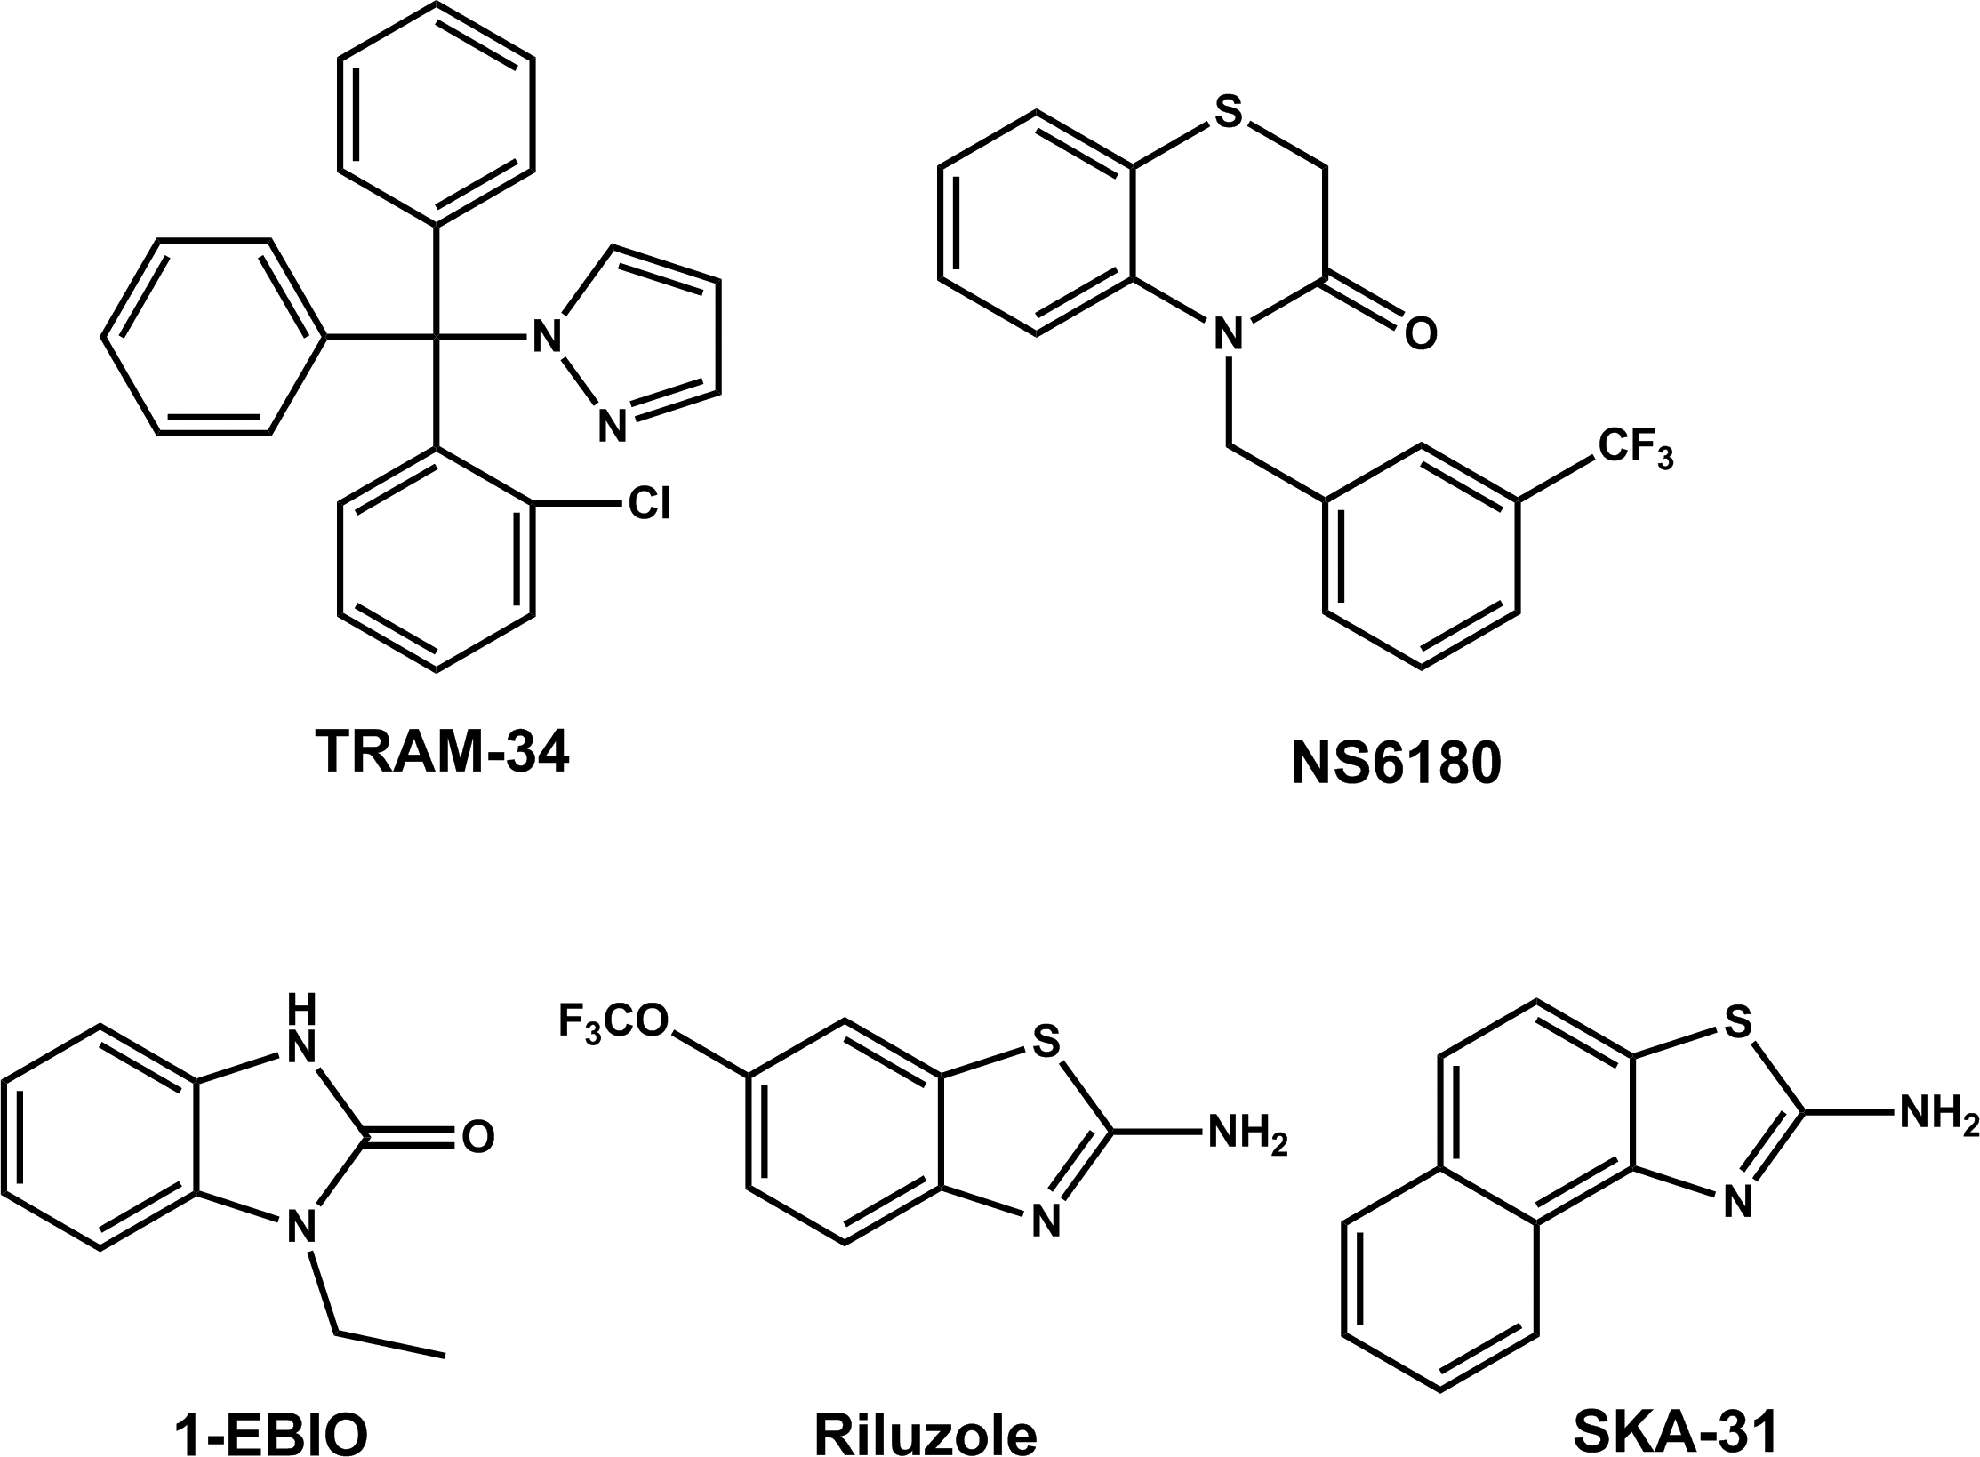
Chemical structures of small molecule KCa3.1 blockers and activators. TRAM-34, 5-[(2-chlorophenyl)(diphenyl)methyl]-1H-pyrazole; NS6180, 4-{[3-(trifluoromethyl)phenyl]methyl}-2H-1,4-benzothiazin-3(4H)-one; SKA-31, naphtho[1,2-d]thiazol-2-ylamine; EBIO, 1-ethylbenzimidazolin-2-one.
As shown in Figure 3, KCa3.1 currents typically stabilized soon after break-in or after saline application when using 1 μM of free internal calcium (see Fig. 3C for an example of a cell where saline perfusion establishes full access). Subsequent applications of increasing concentrations of charybdotoxin (Fig. 3A), TRAM-34 (Fig. 3B), or NS6180 (Fig. 3C) resulted in a rapid and concentration-dependent block of current. Although charybdotoxin could be partially washed out with two saline applications (Fig. 3A), current inhibition by high concentrations of TRAM-34 and NS6180 could not be reversed despite the fact that each saline application of 15 μL theoretically exchanges the bath volume of ∼1 μL about 15 times. Sigmoidal concentration–response curve fitting rendered IC50 values of 1.1±0.2 nM for charybdotoxin, 27.2±0.6 nM for TRAM-34, and 20.9±1.7 nM for NS6180 (Fig. 4).
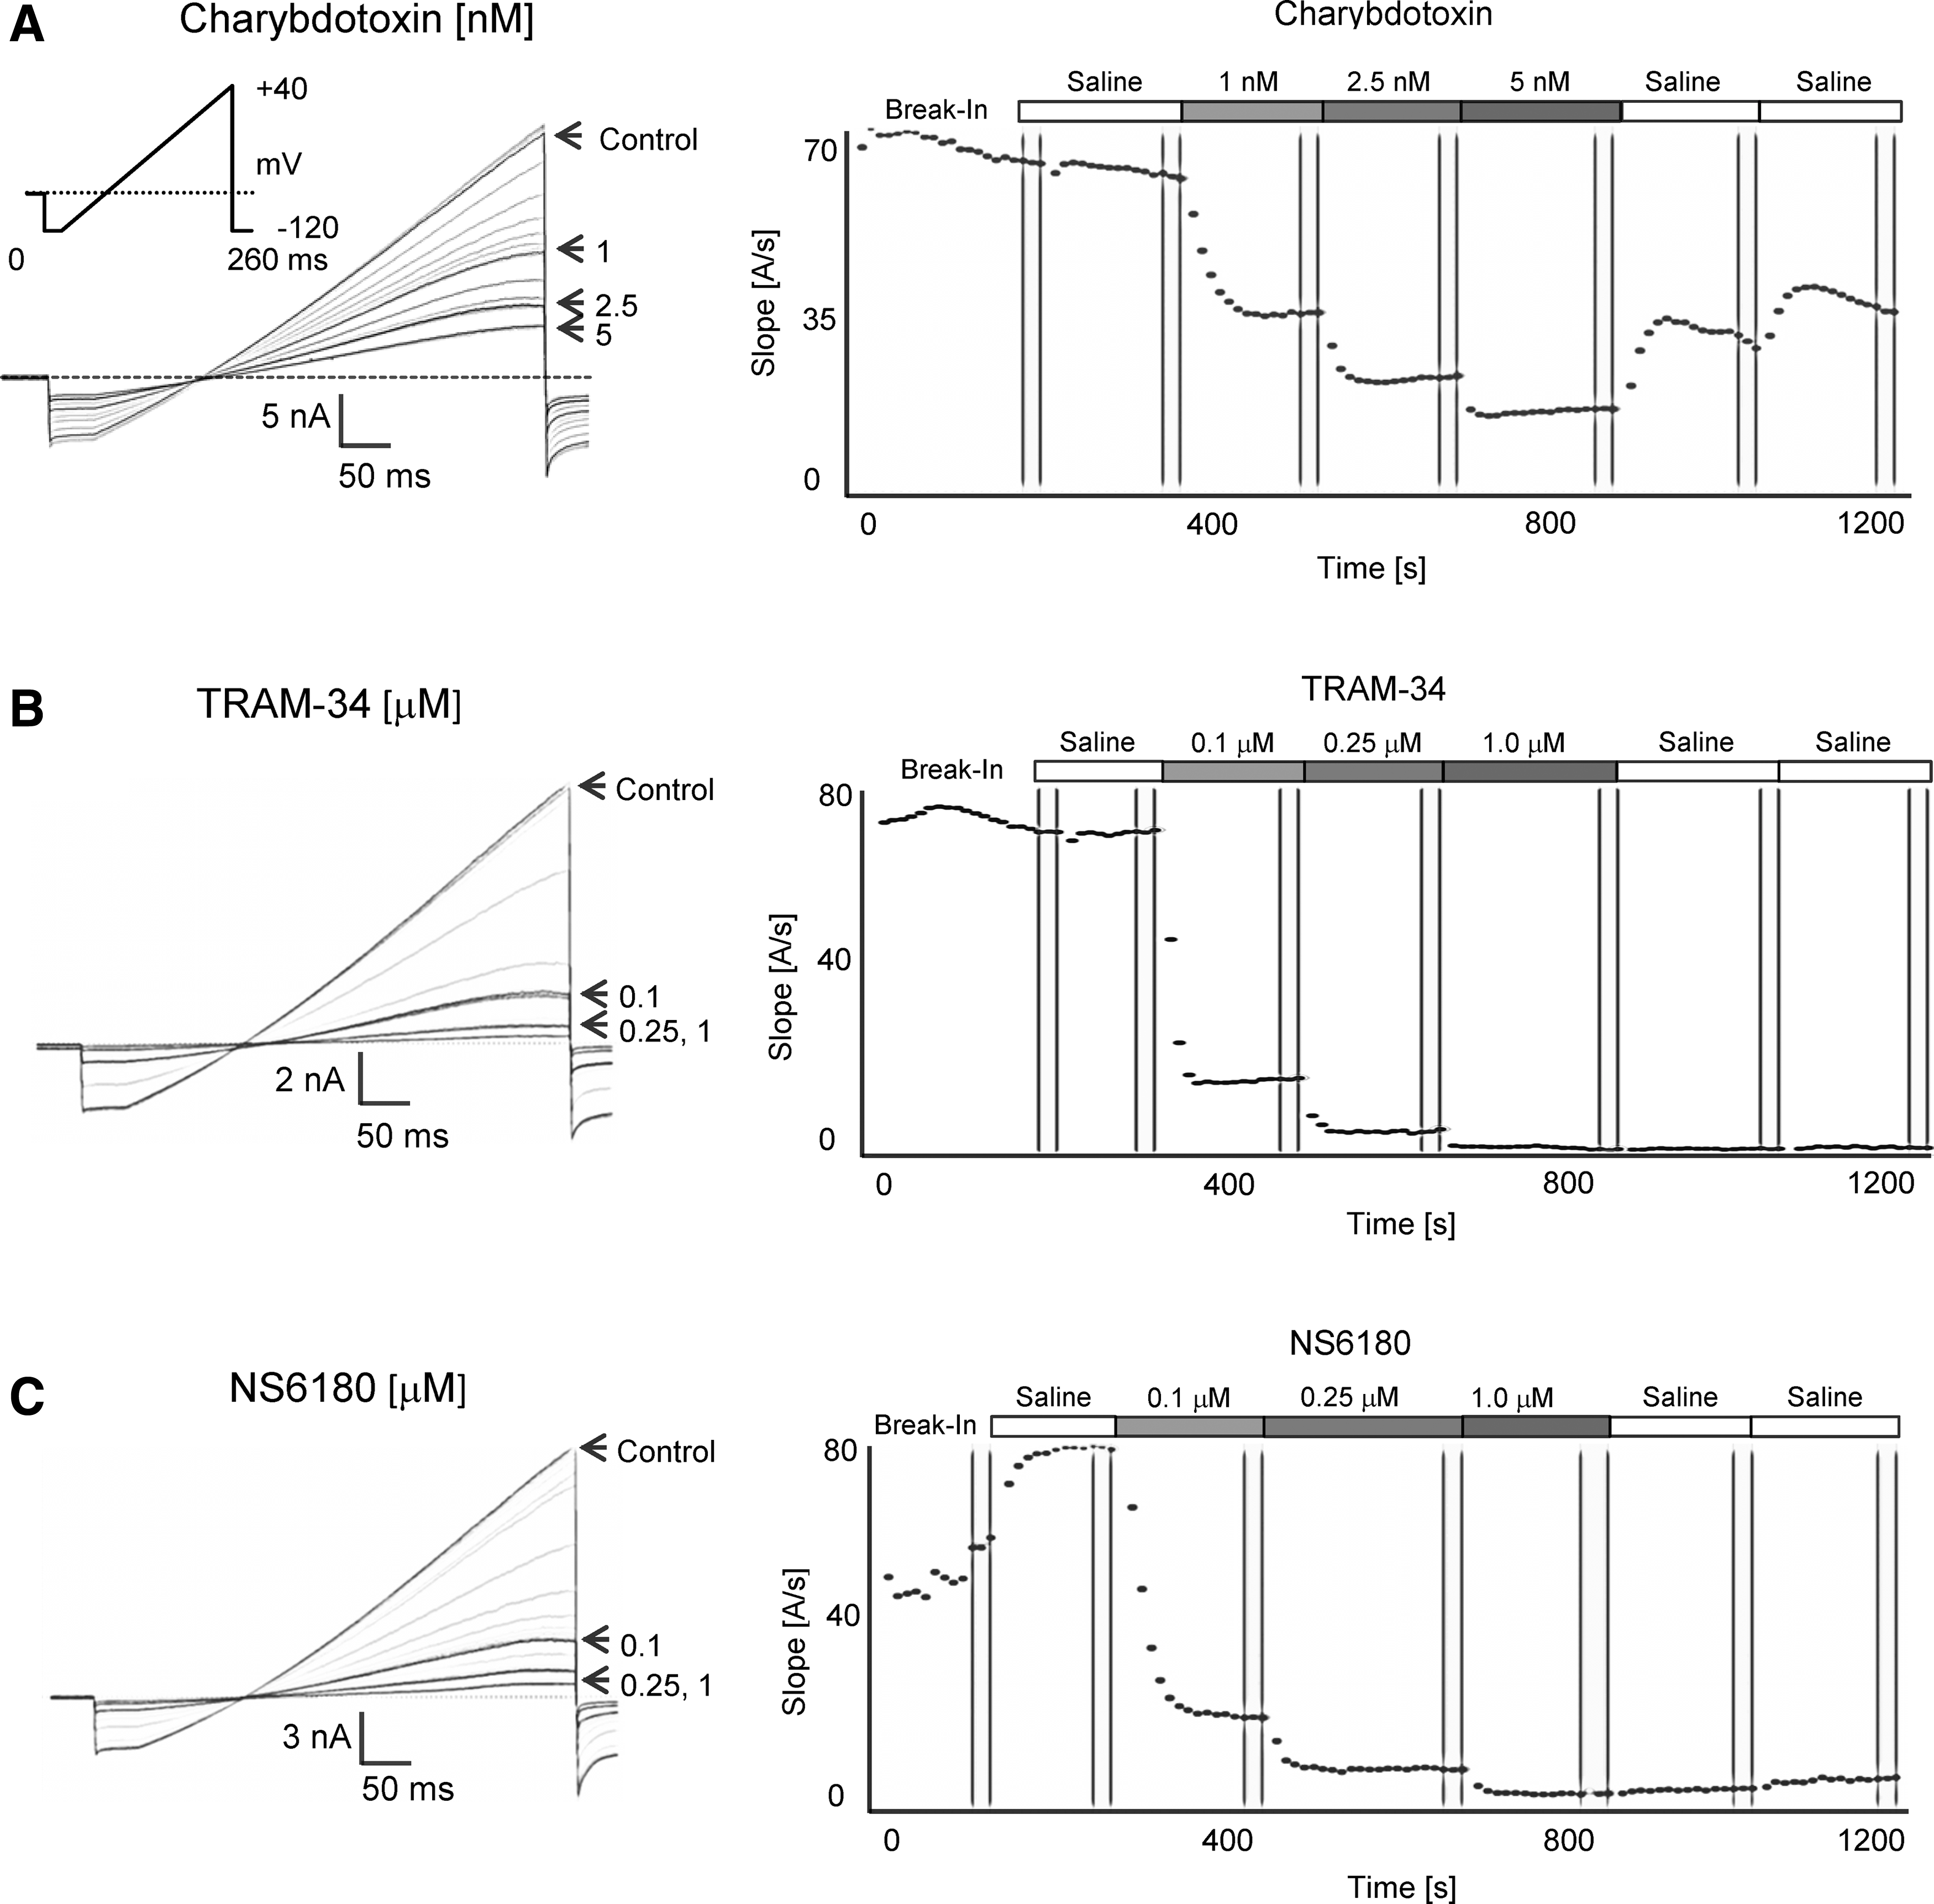
KCa3.1 blocker testing with 1 μM of free Ca2+ in the internal solution.
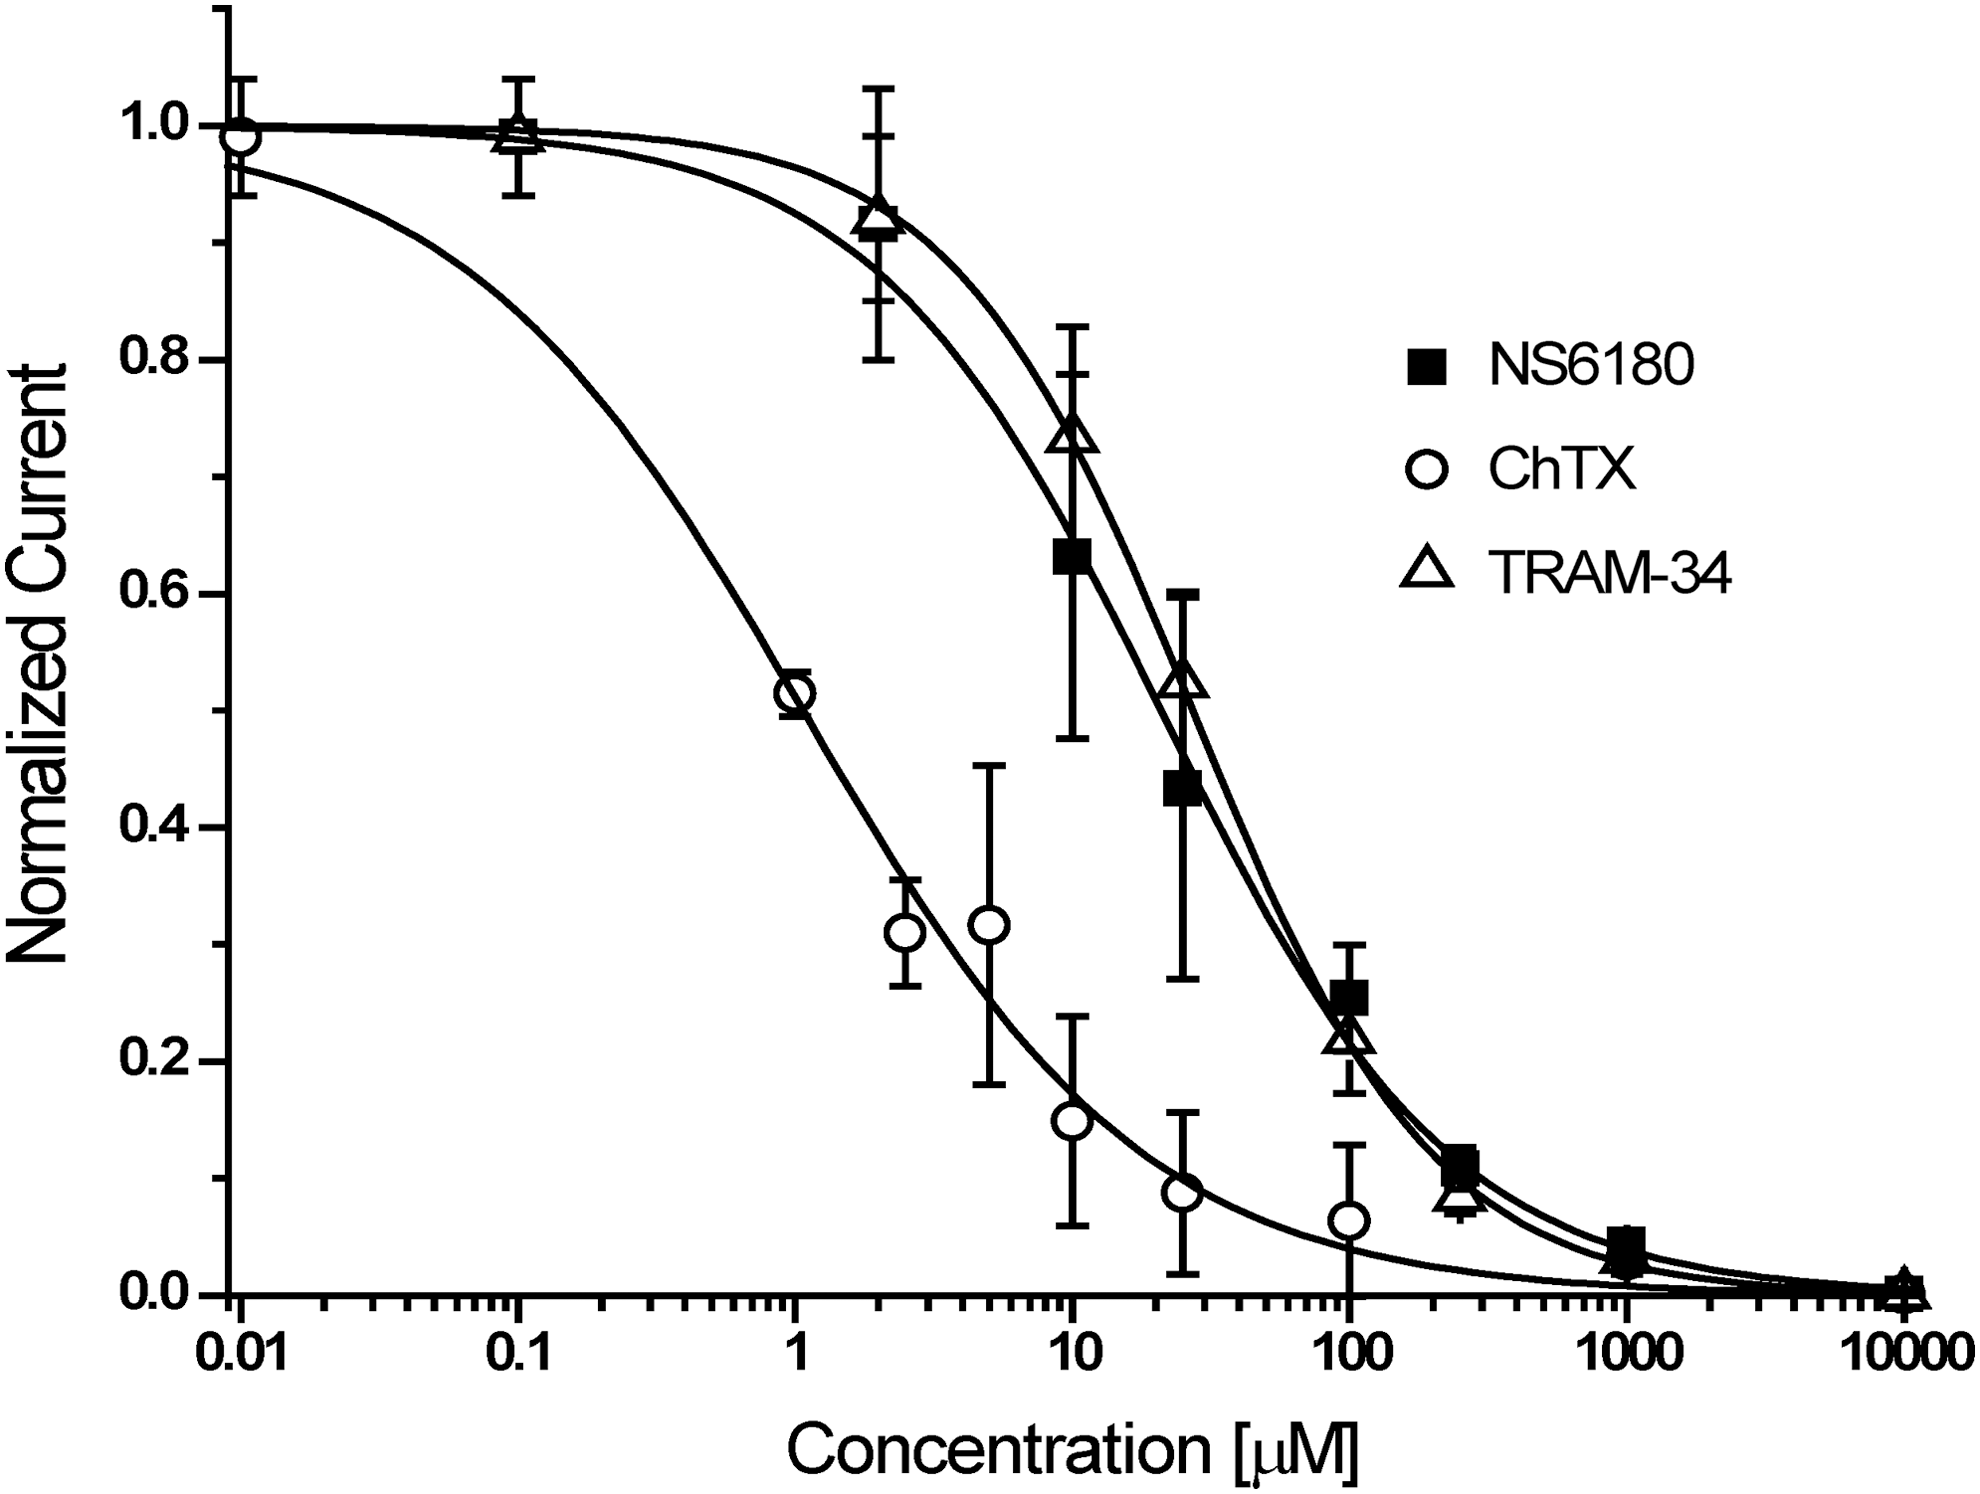
Concentration–response curves for KCa3.1 blockers. Plots are normalized current slopes measured between −85 and −65 mV versus compound concentration. ChTX: IC50=1.1±0.2 nM, n H=0.7 (n=3 per concentration point); TRAM-34: IC50=27.2±0.6 nM, n H=1.0 (n=5 per concentration point); NS6180: IC50=20.9±1.7 nM, n H=0.83 (n=5 per concentration point). Data are given as mean±SD.
For KCa3.1 activator testing, the longer application protocol shown in Table 2 was used. Following stabilization of the current during three saline applications, the same activator concentration was typically applied twice and a washout was included after the first compound application (Fig. 5). Activator effects became visible shortly after application and reversed completely on washout even after two or three cumulative additions of increasing concentrations. As described above, a saturating concentration of activator was used last to obtain a “full effect” value for normalization purposes. The fastest washout was observed for EBIO, the most soluble and least potent of the tested activators (see Fig. 5C washout out 100 μM EBIO). Sigmoidal concentration–response curve fitting rendered Hill coefficients close to 2 and EC50 values of 226±31 nM for SKA-31, 1.2±0.4 μM for riluzole, and 9.6±2.0 μM for EBIO (Fig. 6).
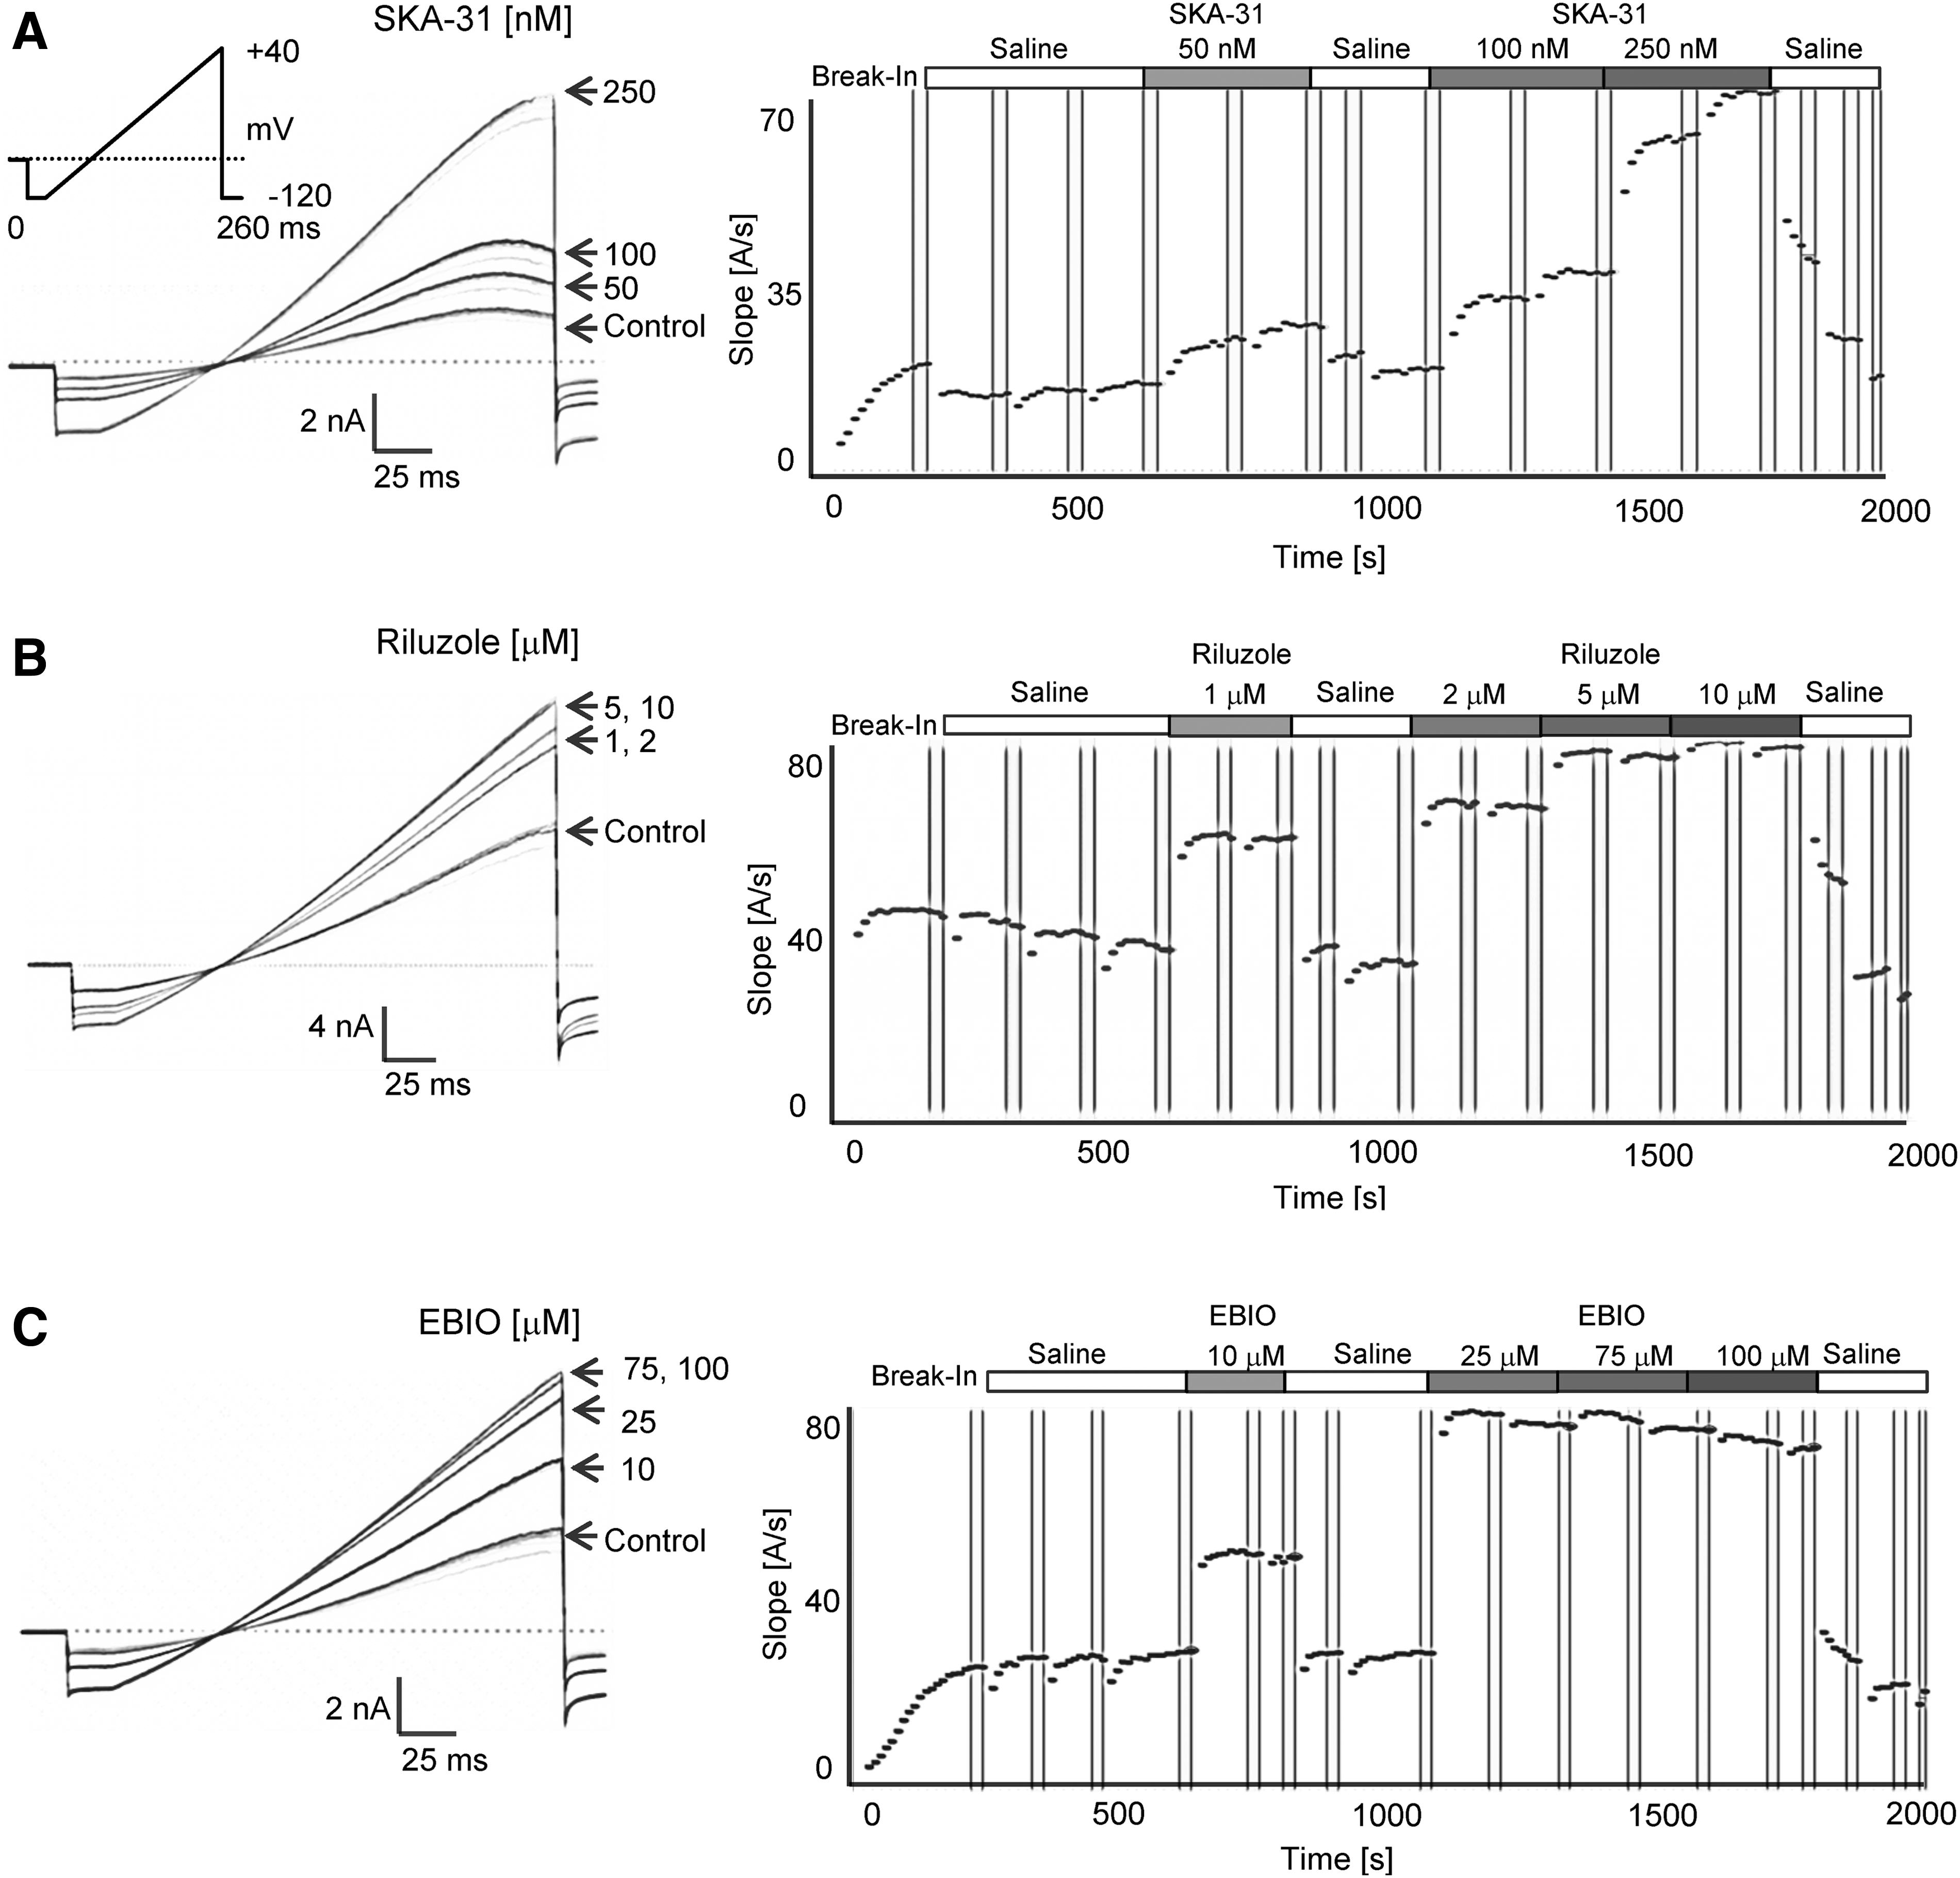
KCa3.1 activator testing with 250 nM of free Ca2+ and 1 mM ATP in the internal solution.
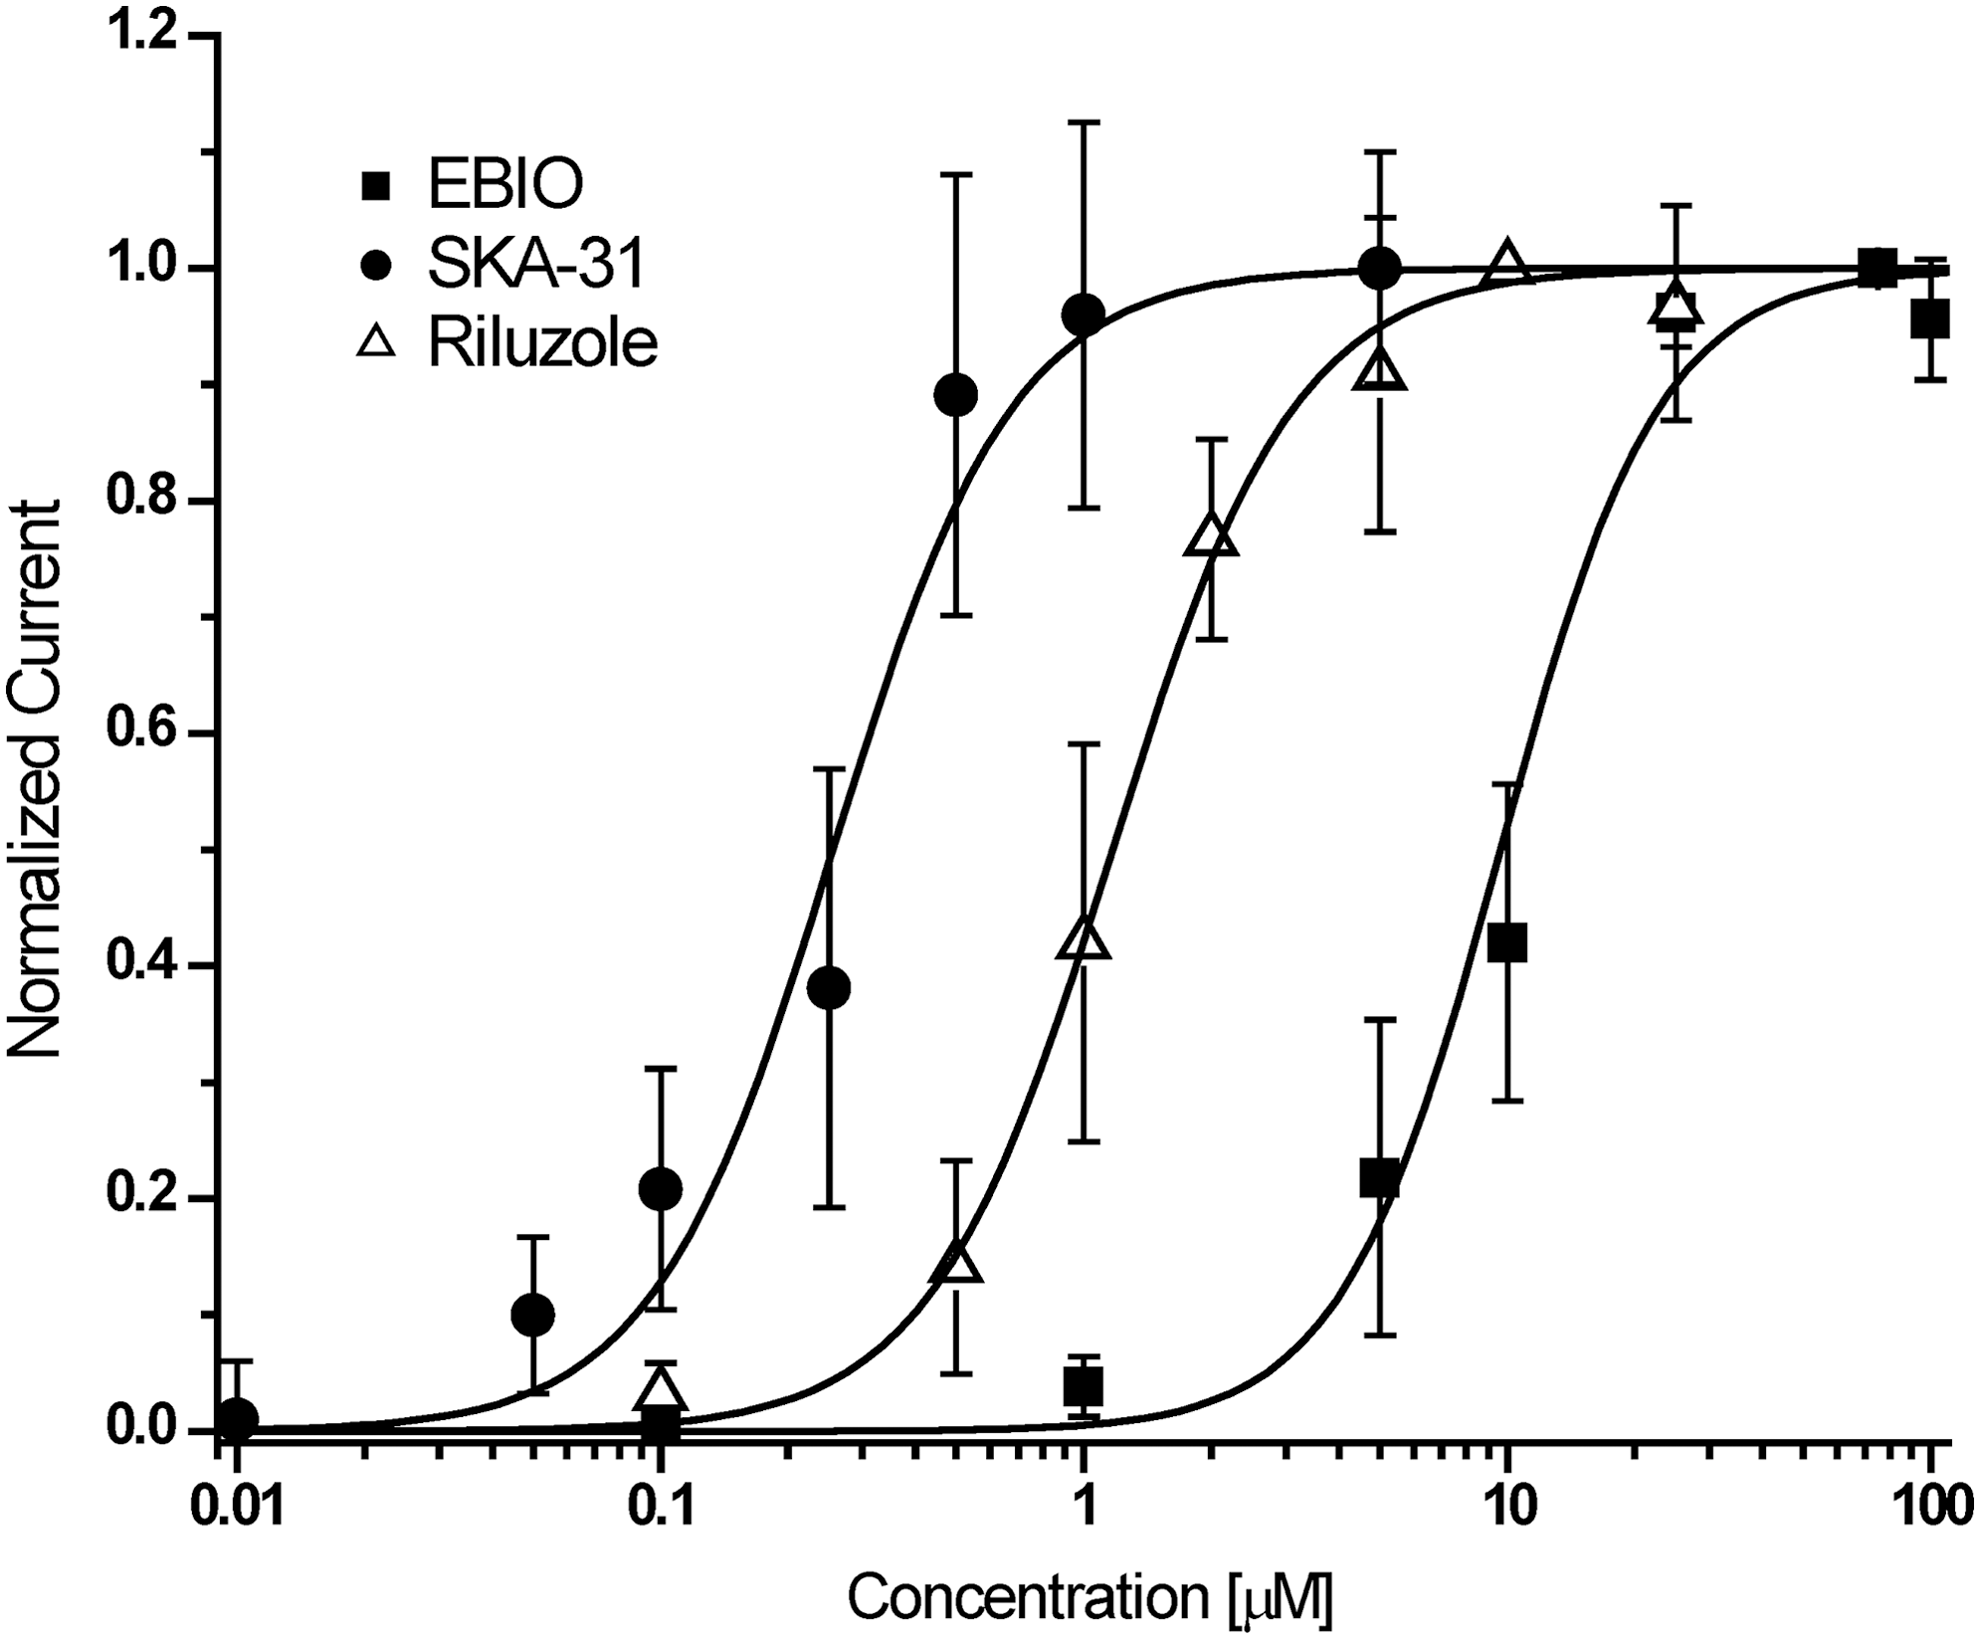
Concentration–response curves for KCa3.1 activators. Plots are normalized current slopes measured between −85 and −65 mV versus compound concentration. SKA-31: EC50=226±31 nM, n H=2.1, (n=6 per concentration point); riluzole: EC50=1.2±0.4 μM, n H=2.0 (n=5 per concentration point); EBIO: EC50=9.6±2.0 μM, n H=1.9 (n=6 per concentration point). Data are given as mean±SD.
Discussion
Using the QPatch-16 system, we developed a medium-throughput automated electrophysiology assay for secondary testing of KCa3.1 blockers and activators. In contrast to the many publications describing high-content automated electrophysiology assays for secondary screening and mechanism of action studies of voltage-gated potassium, sodium, and calcium channels, there are currently very few reports of such assays for voltage-independent calcium-activated potassium channels. In fact, the only comparable assays we are aware of are a study from Korsgaard et al. at NeuroSearch A/S describing the use of the QPatch for high-content screening on Nav, Kv11.1 (hERG) and small-conductance KCa2.3 channels 42 and an advertisement for a KCa3.1 assay using CHO cells and 10 μM of free internal Ca2+ on the Chantest website. Other previously reported assays for KCa3.1 or the related small-conductance KCa2 channels have used either Rb+ efflux analyzed by atomic absorption spectroscopy 43 or Tl+ influx triggered by a Ca2+ ionophore. 34,44,45 There further is one report of using the 384-well IonWorks platform in the multi-hole population patch-clamp mode for screening of KCa3.1 and KCa2.3 activators. 46 Although very useful for high throughput screening, these assays only allow for a limited number of solution exchanges and tend to show right-shifts in the potency of lipophilic compounds, like TRAM-34, compared to manual electrophysiology.
The automated assay described here produced high-quality KCa3.1 electrophysiology data comparable to manual whole-cell patch-clamp. For the KCa3.1 blockers, charybdotoxin (1.1±0.2 nM), TRAM-34 (27.2±0.6 nM) and NS6180 (20.9±1.7 nM), our assay rendered IC50 values similar to the ones previously reported for these compounds in manual patch-clamp (Table 3). The peptide toxin charybdotoxin had been found to block native KCa3.1 currents in T cells or transiently expressed human or mouse KCa3.1 in COS or HEK cells with IC50 values ranging from 2.5 to 5 nM in manual recordings, 12,47,48 while previously reported IC50 values for the small molecules TRAM-34 and NS6180 ranged from 20 to 25 nM or 8 to 20 nM, respectively. 35,36 While the two lipophilic small molecules were slightly less potent than in manual electrophysiology, charybdotoxin was slightly more potent. The latter observation can likely be explained by the fact that we used a new batch of lyophilized charybdotoxin that was only reconstituted 1 h before the assay and then used immediately for preparing the assay plate. We also would like to point out here, that all our assays were performed in glass inserts with freshly prepared compound dilutions and that assay plates were typically used within 1 h of preparation. This practice probably contributed to the tight correlation between manual and automated electrophysiology we observed on the QPatch. For the notoriously sticky TRAM-34 population, patch-clamp on the IonWorks Quattro 46 or Tl+ flux 34 had reported 15–35 times higher IC50 values in the range of 300–700 nM. NS6180 had also been found to have a lower IC50 in Tl+ flux 34 (80 nM vs. 8–20 nM in electrophysiology), but the difference was not as striking as with the triarylmethane TRAM-34.
Comparison of the Half-Maximal Inhibitory and Effective Concentrations Obtained on the QPatch and by Manual Electrophysiology
TRAM-34, 5-[(2-chlorophenyl)(diphenyl)methyl]-1H-pyrazole; NS6180, 4-{[3-(trifluoromethyl)phenyl]methyl}-2H-1,4-benzothiazin-3(4H)-one; SKA-31, naphtho[1,2-d]thiazol-2-ylamine; EBIO, 1-ethylbenzimidazolin-2-one.
Similar to the KCa3.1 blocker testing, the QPatch assay also rendered potencies for KCa3.1 activators that were in good agreement with previously reported EC50 values from manual electrophysiology. With the exception of the KCa2.1 selective GW542573x, which seems to have some direct channel opening properties independent of Ca2+, 49 most known KCa activators act as positive gating modulators by increasing the apparent Ca2+ sensitivity of channel activation 44,50 –52 and require intracellular Ca2+ levels to be at least slightly above resting Ca2+ levels to exert their effects. In keeping with this requirement, we found that internal Ca2+ concentrations in the range of 50–150 nM were too low and resulted in very high assay variability (data not shown). Cells either did not exhibit any perceivable control currents making it impossible to judge whether the activators were ineffective or the cells simply had no current. Or, if they exhibited perceivable control currents, activators elicited very varied responses and the same compound concentration could sometimes increase currents between 5- and 80-fold. This observation is in line with the high variability reported for KCa3.1 activators on the IonWorks in the single-hole mode. 46 Since the IonWorks uses the amphotericin-perforation method, intracellular free Ca2+ concentrations in the assay reported by John et al. could not be controlled and were estimated to be in the range of 100 nM or lower despite 2 mM of unbuffered Ca2+ in the internal solution. 46 This low intracellular Ca2+ resulted in a variability that was too high for dose–response curve fitting in the single-hole mode and could only be overcome by switching to the multi-hole mode and averaging the signal from up to 64 cells. In our case, we decided to use 250 nM of intracellular free Ca2+ and 1 mM of ATP to obtain sufficiently large and reliable control currents. Using these conditions, the QPatch assay reproduced the Hill coefficient of 2 generally reported for KCa2/3 channel activators 27,42,44,51,52 and rendered EC50 values for SKA-31 (226 nM), riluzole (1.2 μM), and EBIO (10 μM), which are close to the values previously reported for KCa3.1 by manual whole-cell patch-clamp with 250 nM of free Ca2+ in the pipette solution (SKA-31: 260±40 nM; riluzole: 1.9±0.3 μM; EBIO: ∼20 μM). 27,30 ATP was added to prevent KCa3.1 run-down. However, we found that an ATP concentration of 4 mM, the amount usually used on the QPatch when recording hERG (Kv11.1), is too high and elicited KCa3.1 currents with amplitudes of 10–20 nA at +40 mV even when used in combination with just 250 nM of free internal Ca2+. This effect, which does not occur with KCa2.3 channels (data not shown) and therefore is not due to an alteration of the free Ca2+ concentration by the ATP addition, is most likely caused by an increase in KCa3.1 channel open probability following phosphorylation. 53,54 KCa3.1 activity is known to be increased by protein kinase A 55 and nucleoside diphoshate kinase B (NDPK-B) 56 and inhibited by the histidine phosphatase PHPT1. 57 NDPK-B and PHPT1 directly phosphorylate/dephosphorylate KCa3.1 on histidine 358 in the C-terminus making KCa3.1 one of the rare examples of a histidine kinase/phosphatase regulated protein in mammals. Similar to the calmodulin-mediated Ca2+ activation of KCa3.1, ATP-mediated KCa3.1 activation seems to have a very high degree of cooperativity with a steep concentration–response curve in the whole-cell mode where kinases and phosphatases are likely to be present, and we therefore settled on 1 mM of ATP as a compromise between having control currents that are too large to leave activators a sufficient assay window and having some ATP present to prevent current rundown.
In summary, we present a QPatch-based electrophysiology assay, which produces concentration–response curves for both KCa3.1 blockers and activators comparable to manual electrophysiology. The assay is therefore suitable for secondary screening and if used with varying intracellular Ca2+ concentrations should also be useful for mechanism of action studies. The ability of the QPatch to obtain whole-cell access and to effectively dialyze the cell with internal solution allows KCa currents to develop with time courses comparable to manual whole-cell experiments. We here used the assay for KCa3.1 modulator testing but would like to suggest that the assay can also be applied to the related small-conductance KCa2 channels (KCa2.1, KCa2.3, and KCa2.3) as well as to sodium-activated K+ channels (KCa4.1 and KCa4.2) after altering the composition of the internal solution. The assay should also be transferable to the higher throughput QPatch48 without any major adjustments.
Footnotes
Acknowledgments
This work was supported by the CounterACT Program, National Institutes of Health Office of the Director (NIH OD), and the National Institute of Neurological Disorders and Stroke (NINDS), Grant Numbers U54NS079202 and R21NS072585. B.M.B. was supported by a training grant (T32-GM008799 from NIH-NIGMS). The contents of this publication are solely the responsibility of the authors and do not necessarily represent the official views of the NIGMS or NIH.
Disclosure Statement
W.Y. and L.D.L. are full-time employees of Sophion Bioscience.