
Abstract
The electron transport chain (ETC) couples electron transfer between donors and acceptors with proton transport across the inner mitochondrial membrane. The resulting electrochemical proton gradient is used to generate chemical energy in the form of adenosine triphosphate (ATP). Proton transfer is based on the activity of complex I–V proteins in the ETC. The overall electrical activity of these proteins can be measured by proton transfer using Solid Supported Membrane technology. We tested the activity of complexes I, III, and V in a combined assay, called oxidative phosphorylation assay (oxphos assay), by activating each complex with the corresponding substrate. The oxphos assay was used to test in-house substances from different projects and several drugs currently available on the market that have reported effects on mitochondrial functions. The resulting data were compared to the influence of the respective compounds on mitochondria as determined by oxygen consumption and to data generated with an ATP depletion assay. The comparison shows that the oxidative phosphorylation assay provides both a rapid approach for detecting interaction of compounds with respiratory chain proteins and information on their mode of interaction. Therefore, the oxphos assay is a useful tool to support structure activity relationship studies by allowing early identification of mitotoxicity and for analyzing the outcome of phenotypic screens that are susceptible to the generation of mitotoxicity-related artifacts.
Introduction
During oxidative phosphorylation, electrons are transferred from electron donors to electron acceptors in redox reactions. Under aerobic conditions, proteins of the electron transport chain (ETC) located in the IM reduce oxygen to water through a series of steps along the ETC that employ nicotinamide adenine dinucleotide (NADH) and FADH2 derived from the tricarboxylic acid cycle and glycolysis. The ETC complexes effectively pass protons across the IM where they accumulate in the intermembrane space to create a pH gradient across the IM that contributes to an overall electrochemical gradient. This gradient is used by the mitochondrial F0F1 ATPase (ATP synthase) as a source of energy to drive the synthesis of ATP from adenosine diphosphate (ADP) and phosphate. This sequence of chemical steps is known as oxidative phosphorylation. 2 There is a link between mitochondrial ATP synthesis and cellular ATP demand by a feedback mechanism that controls ATP synthesis induced by mitochondrial respiration. After the seminal proposal by Peter Mitchell (chemo-osmotic theory), it was demonstrated that the mitochondrial electrochemical proton gradient, generated as electrons passed down the respiratory chain, is the primary source for cellular ATP synthesis. Mitchell's theory predicted that any proton leak not coupled with ATP synthesis would promote uncoupling of respiration and thermogenesis. 3 Uncouplers can be broadly defined as chemical agents that selectively prevent utilization of chemical energy derived from respiratory electron transport for net phosphorylation of ADP to ATP. 4
Besides acting as uncouplers, ETC inhibitors can also cause mitotoxicity. These substances bind to one or more of the respiratory chain components and block their ability to switch between redox states. This inhibition results in the accumulation of reduced forms before the actual inhibition, and oxidized forms of ETC components downstream of the inhibition. The electrochemical gradient, which allocates the energy for the phosphorylation of ADP to ATP, thus cannot be formed and no ADP phosphorylation is possible. Moreover, increased production of reactive oxygen species occurs upon inhibition of the respiratory complexes I, III, IV, and V. 5
There are several methods for measuring cellular energy metabolism. One possibility is to measure the oxygen concentration in a suspension of isolated mitochondria in solution. The uncoupling activity or potency of inhibition can be determined as stimulation of mitochondrial respiration in the presence of substrates, such as glutamate/malate, by monitoring the respiration rate with a Clark-type oxygen microelectrode. 6 The amount of consumed oxygen after compound incubation is then compared to an untreated control. The addition of an uncoupling reagent results in an increase and decrease in oxygen consumption in the absence and presence of ADP, respectively. Oxygen consumption by cells from mitochondria-rich tissue, for example, cardiomyocytes, or cultured cells can also be monitored using an oxygen-sensitive dye, wherein the oxygen concentration is usually determined as an endpoint measurement. 7,8
The methods described above use either whole cells or isolated mitochondria. A recent publication described a method based on the direct measurement of ETC complexes isolated from porcine heart IM that are immobilized on a solid supported membrane (SSM) and used for direct electrical activity measurements of respiratory chain protein activity. The authors introduced individual test methods for respiratory chain complexes I–V and the adenosine nucleotide translocase in native IM. 9 In addition, Preissl et al. developed a screening-compatible assay for complex I/complex III in 96-well microtiter plates. 10
In this study, we developed a 96-well-based assay for analysis of respiratory chain complex I/complex III (NADH dehydrogenase/cytochrome bc1 complex) and complex V (F0F1-ATPase) activities within one assay step. This assay can be used to identify mitotoxic compounds during drug development. The assay allows inhibitors of complex I/complex III, complex V, and uncouplers to be differentiated, which can be used to support structure activity relationships (SAR) and to optimize compounds without mitotoxicity. This assay will be a helpful tool to analyze screening outcomes, especially from phenotypic screens.
The assay is based on the measurement of electrical currents generated by charge transport through membrane transporters and electron transport proteins. Membrane fragments isolated from pig heart IM are immobilized on a biosensor and a rapid exchange of buffers containing protein complex substrates, in this case NADH and ADP, leads to proton flux and electron movement across the IM through respiratory chain complexes during oxidative phosphorylation (Fig. 1).
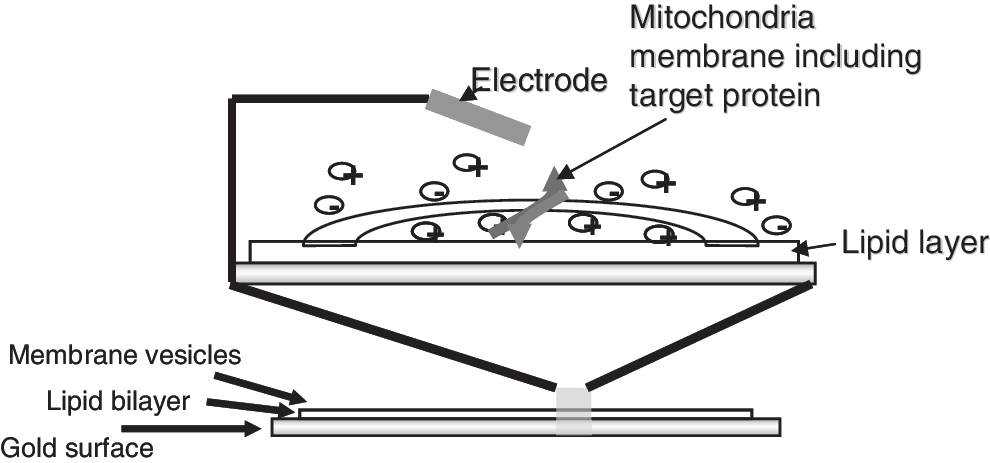
Solid supported membrane (SSM) technology: The net charge transport across immobilized membranes results in a detectable current between the gold electrode of the sensor and an external electrode. Membrane fragments are immobilized on the sensor and the reference electrode is placed into the liquid above the sensor.
Within oxidative phosphorylation, four complexes of the IM (complex I: NADH-ubiquinone oxidoreductase, complex III: ubiquinol:ferricytochrome-c oxidoreductase, complex IV: cytochrome c oxidase and complex V: F0F1 ATP synthase) link the oxidation of NADH to ADP phosphorylation, resulting in ATP production (Fig. 2). Complexes I–IV are measured in one assay step. Complex I couples the NADH oxidation to the translocation of four protons across the mitochondrial membrane and the reduction of ubiquinone to ubiquinol, which is the substrate of complex III. Complex III transfers the electrons from ubiquinol to cytochrome c and pumps four further protons across the membrane (Fig. 3). 11
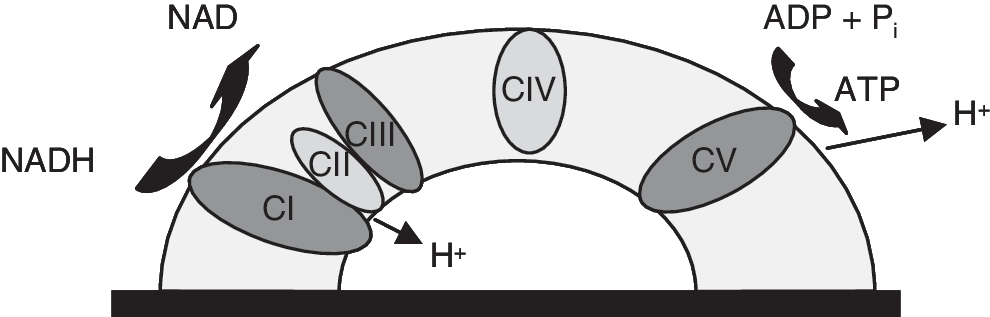
Scheme of the induced proton transfer. The complexes in dark gray are measured in our assay setup. The direction of proton movement (toward the sensor or away from the sensor) forces the direction of the current. Movement toward the sensors affects positive current, and movement away from the sensor affects negative current. In total, up to 10 protons can be transferred across the membrane and a net positive charge is translocated toward the SSM electrode, leading to a positive current. The proton motive force generated by complex I and complex III is used for adenosine triphosphate (ATP) synthesis by complex V. The phosphorylation of adenosine diphosphate (ADP) with Pi leads to the formation of ATP and the shift of 2.7 protons across the membrane away from the SSM electrode, which leads to a negative current. Thus, the activity of three different protein complexes is measured in one well within one assay step.
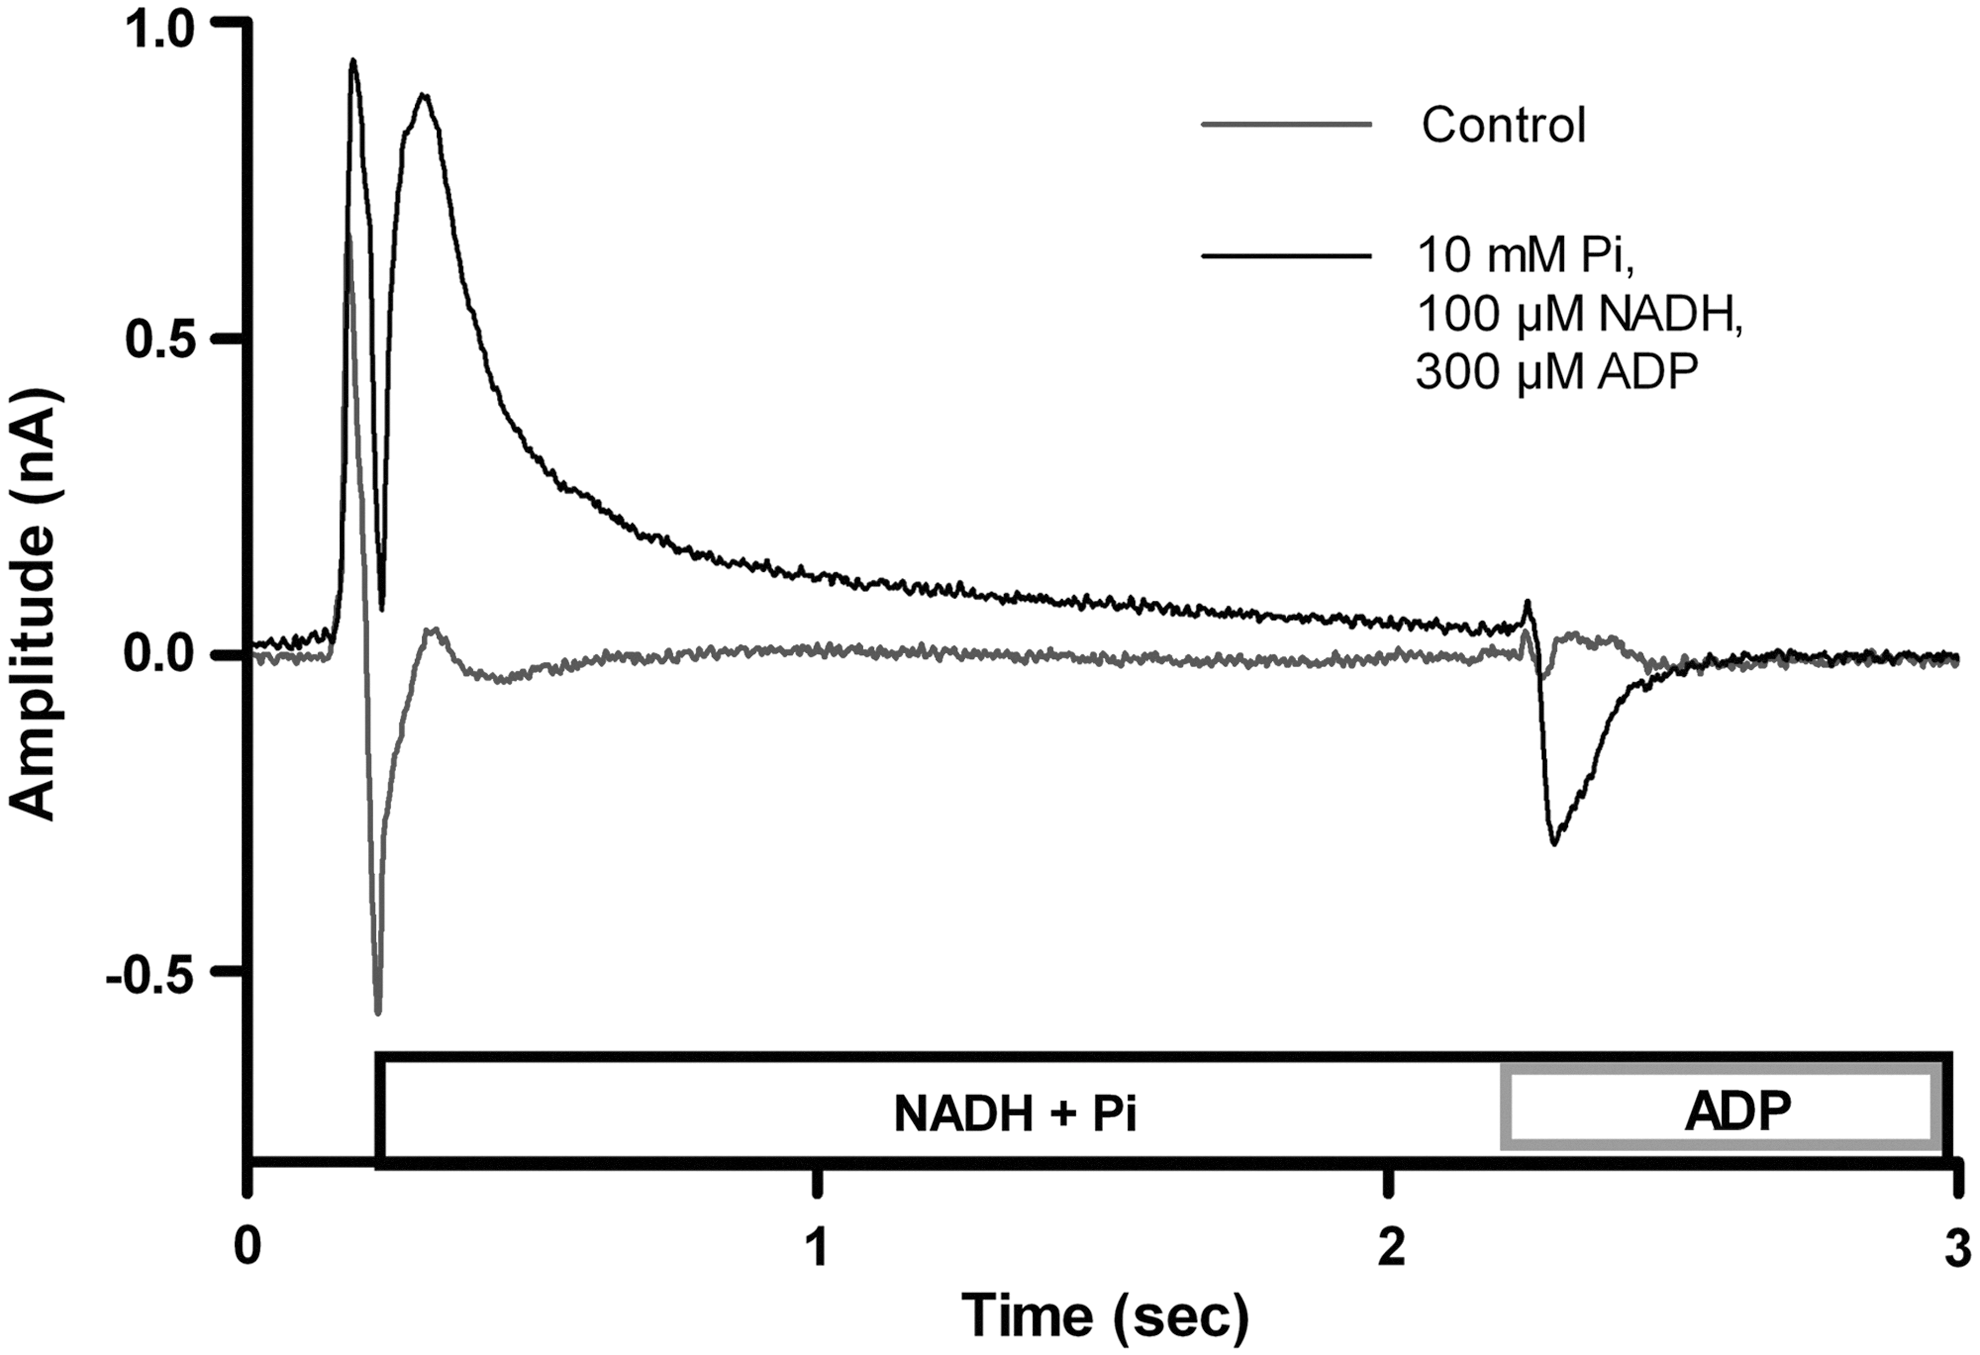
The current after activation with nicotinamide adenine dinucleotide (NADH) and activation with ADP and Pi. Activation with NADH results in a positive current, and activation with ADP results in a negative current. When no substrate is added, no current is measured.
This assay allows inhibition of individual protein complexes to be discriminated and detection of decoupling compounds that dissipate the proton gradient across the IM that is used as a driving force for the ATP synthase. After incubation with a decoupling reagent, the current trace exhibits a typical form, therefore allowing discrimination between decoupling and inhibition. Decoupling perforates the membrane and allows proton transfer through the membrane, which results in a nonspecific positive current. Activation of complex I/complex III with NADH causes proton transfer toward the sensor and affects a specific positive current. ADP-driven complex V activation moves protons away from the sensor and produces a specific negative current. If one of the complexes is inhibited, then proton transfer is also inhibited, resulting in a flat line current trace.
Materials and Methods
All measurements were carried out on a SURFE2R™ Workstation 500 (Scientific Devices Heidelberg, Heidelberg, Germany) and the corresponding 96-well sensor plates (Scientific Devices Heidelberg) were used.
SSM Sensor Preparation
Mitochondria were isolated from porcine heart tissue. Isolation of mitochondria and IMs were prepared as described earlier. 9 The protein concentration of each complex in the membrane preparation could not be determined. Aliquots of isolated membranes were stored at −80°C until use. The biosensors were prepared using 96-well sensor plates from Scientific Devices Heidelberg. The sensors were first covered with 50 μL alkane thiol (Sensor Prep A1) and incubated for 10 min at room temperature (RT), before rinsing with MilliQ water and drying for 10 min. Lipid solution (1.5 μL, Sensor Prep B1; Scientific Devices Heidelberg) was added to the sensor with subsequent addition of 50 μL incubation buffer to avoid evaporation, followed by incubation for 10 min at RT. Incubation buffer (110 μL) was then added to a 12 μM membrane preparation and the samples were sonicated four times using an ultrasonic processor (Hielscher UP50H equipped with an MS1 tip, Dr. Hielscher Ultrasonics GmbH, Germany) at 30% amplitude. Five microliters of membrane solution were dispensed to each sensor surface and the sensors were centrifuged for 1 h at 1400 g at 8°C. Before measurement, the sensors were sealed with foil and incubated for 1 h at RT in the dark.
Preparation of Rat Liver Mitochondria and Oxygraph Measurements
Mitochondria were prepared from rat liver according to the method of Johnson and Lardy and diluted in 250 mM sucrose, 1 mM Na-EDTA, and 2 mM Tris HCl, pH 7.4 immediately before measurement initiation. 12 Mitochondrial oxygen consumption measurements were performed using an Oxygraph-2k (Oroboros, Innsbruck, Austria), equipped with two chambers (chamber volume 2 mL) and a thermostat-controlled heating/cooling device set to 25°C. Oxygen electrode calibration was carried out as recommended by the manufacturer and the recorded traces were analyzed with the supporting program DatLab4. Rat liver mitochondria were added to a final protein concentration of 0.4–1.6 mg/mL in a buffer composed of 10 mM Tris-HCl, 10 mM potassium phosphate, 65 mM sucrose, 10 mM MgSO4, and 2 mM Na-EDTA, pH 7.0. “State 4” respiration (limitation of ADP) was initiated by addition of 5.6 mM sodium glutamate and 4.8 mM sodium malate. Substances were added stepwise to a final concentration of 46 μM. If uncoupling activity was observed, then U50 values representing the substance concentration required for half-maximal uncoupling were determined according to Brandt et al. 6
Buffer Composition and Solution Exchange Protocol
Before measurement, incubation buffer (30 mM HEPES pH 7.2, N-methyl-D-glucamine [NMG], 140 mM potassium gluconate, 10 mM MgCl2, 10 mM sodium phosphate [NaPi], 200 μM tris(2-carboxyethyl)phosphine [TCEP], and 5 μM bongkrekic acid [BKA]) was added to the sensors. BKA is used to block the adenine nucleotide translocase (ANT) in the IM, 9 which reduces ANT interference with synthase signaling upon ADP addition. BKA is a light sensitive substance and BKA-containing buffers and treated samples should therefore be stored in the dark. Buffers can be stored at −20°C. The fluidic system is rinsed with a washing solution of 50% ethanol in water after addition of compound solution to avoid contamination. The solution exchange process consists of fast exchange between equilibration buffer, charging buffer, and activation buffer. One liter of equilibration buffer can be prepared as follows: 30 mM HEPES pH 7.2, NMG, 140 mM potassium gluconate, 10 mM MgCl2, and 10 mM NaPi (mix Na2HPO4 and NaH2PO4 to adjust the pH to 7.2). Charging buffer consists of 30 mM HEPES pH 7.2, NMG, 140 mM potassium gluconate, 10 mM MgCl2, 10 mM NaPi, and 100 μM NADH (take 400 mL equilibration buffer and add 400 μL 100 mM NADH stock solution). Activating buffer consists of 30 mM HEPES pH 7.2, NMG, 140 mM potassium gluconate, 10 mM MgCl2, 10 mM NaPi, 100 μM NADH, 300 μM ADP (take 200 mL charging buffer and add 200 μL 300 mM ADP stock solution). Charging and activation buffer should be freshly prepared every 4 h. Buffer additives are prepared as stock solutions and mixed immediately before use. Stock solutions can be stored at −20°C. NaPi must be stored at 4°C. All chemicals were purchased from Sigma-Aldrich, except for TCEP, which was obtained from Calbiochem.
To determine complex I (NADH dehydrogenase), complex III (cytochrome bc1 complex), and complex V (F0F1-ATPase) activity, membrane proteins were consecutively treated with equilibration, charging, and activation buffers. One electrical current response can be measured upon replacing the equilibration buffer with charging buffer (containing NADH), whereupon NADH is converted to NAD+ and four protons are simultaneously transferred toward the sensor. This results in a positive peak current and builds up an electrochemical gradient across the membrane. Thereafter, replacement of the solution with activation buffer (containing ADP) triggers ATP production and proton transfer from the vesicle to the solution. Subsequent replacement of solutions in the reverse order returns the ion gradients and the membrane vesicles to their initial state. The assay setup is performed as follows: One premeasurement using only equilibration buffer detects the baseline. Three premeasurements precede the exchange of equilibration buffer to charging buffer, and then exchange to activation buffer for formation of the electrochemical gradient. Five reference measurements (100% signal) are then obtained and finally one measurement that includes the given compound (% inhibition) is acquired. After the measurement in the presence of the compound, the sensor is not used for further measurements.
The following settings were used for the measurements of complex I/complex III and complex V activity. Three buffer reservoirs of the SURFE2R Workstation were filled with activating, charging, or equilibration buffers. Inhibitors were provided in deep-well microtiter plates. The assay protocol is summarized in Table 1. The following parameters were set on the controlling software of the SURFE2R Workstation: Continuous flow activation protocol—speed, 200 μL/s; T1, 2 s; T2, 1 s; Ttot, 4 s; dT1, 50 ms; dT2, −15 ms; sample rate, 1,000; z activation. −5; Data analysis—reference peak: electrical current after addition of NADH or ADP; compound peak: electrical current after addition of NADH or ADP including inhibitor.
Sample Assay Protocol for Sensor Preparation
1. Assay-ready sensor plates are prepared by formation of the membrane vesicles on gold sensors and incubation with equilibration buffer.
2. Measurement without activators is needed to detect the baseline.
3. Measurements with activators for formation of the electrochemical gradient.
4. Detection of current without inhibitor.
5. Detection of current with inhibitor.
Only currents with inhibition larger than 40% were defined as having a significant effect in the assay. To test the screening outcomes for mitotoxicity, only one concentration for each compound is sufficient. In our experience 10 μM, which is analogous to the screening concentration used in most assays, is a suitable concentration.
Results
Inhibition of Standard Compounds
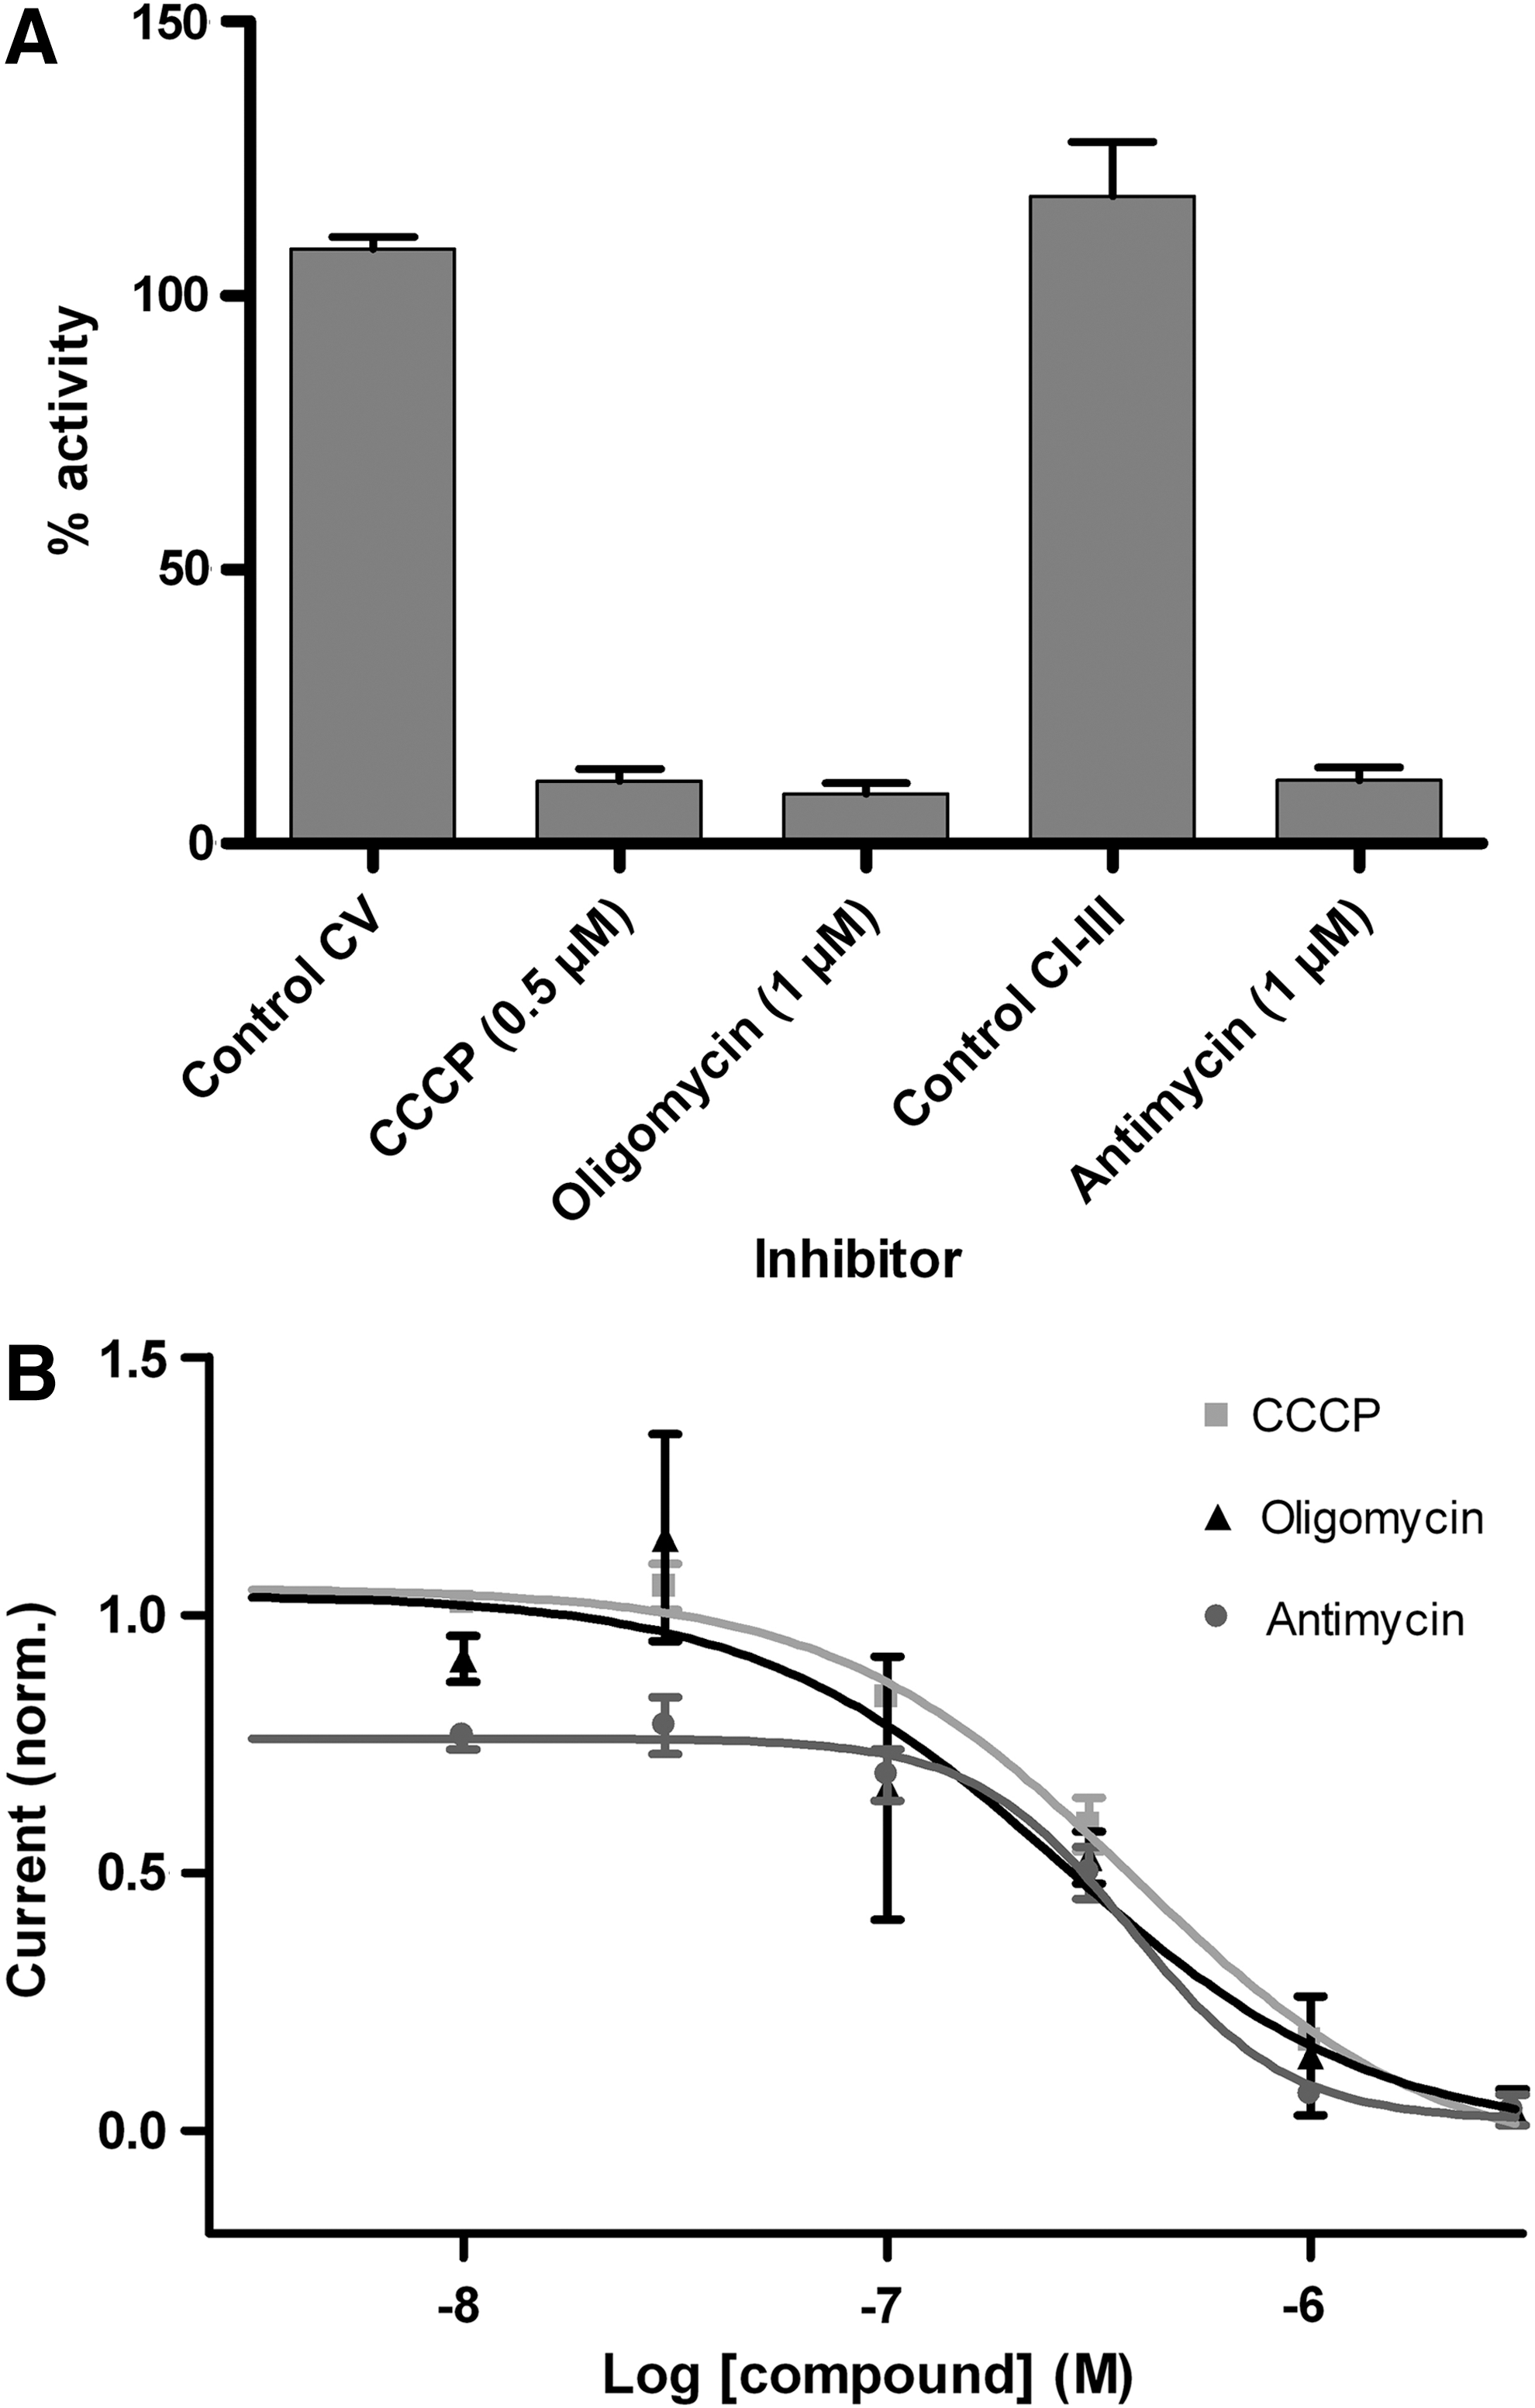
Specific inhibitors are available for all respiratory chain complexes. To validate this assay, we selected oligomycin and antimycin as specific inhibitors for complex V and III, respectively, and carbonylcyanide-m-chlorophenyl hydrazone (CCCP) as a decoupling agent (Fig. 4). CCCP at 0.5 μM and oligomycin and antimycin at 1 μM gave a total block. (Fig. 5A). The dose-dependent inhibition was also measured (IC50 CCCP: 38 nM, IC50 oligomycin: 100 nM, IC50 antimycin: 156 nM, Fig. 5B).
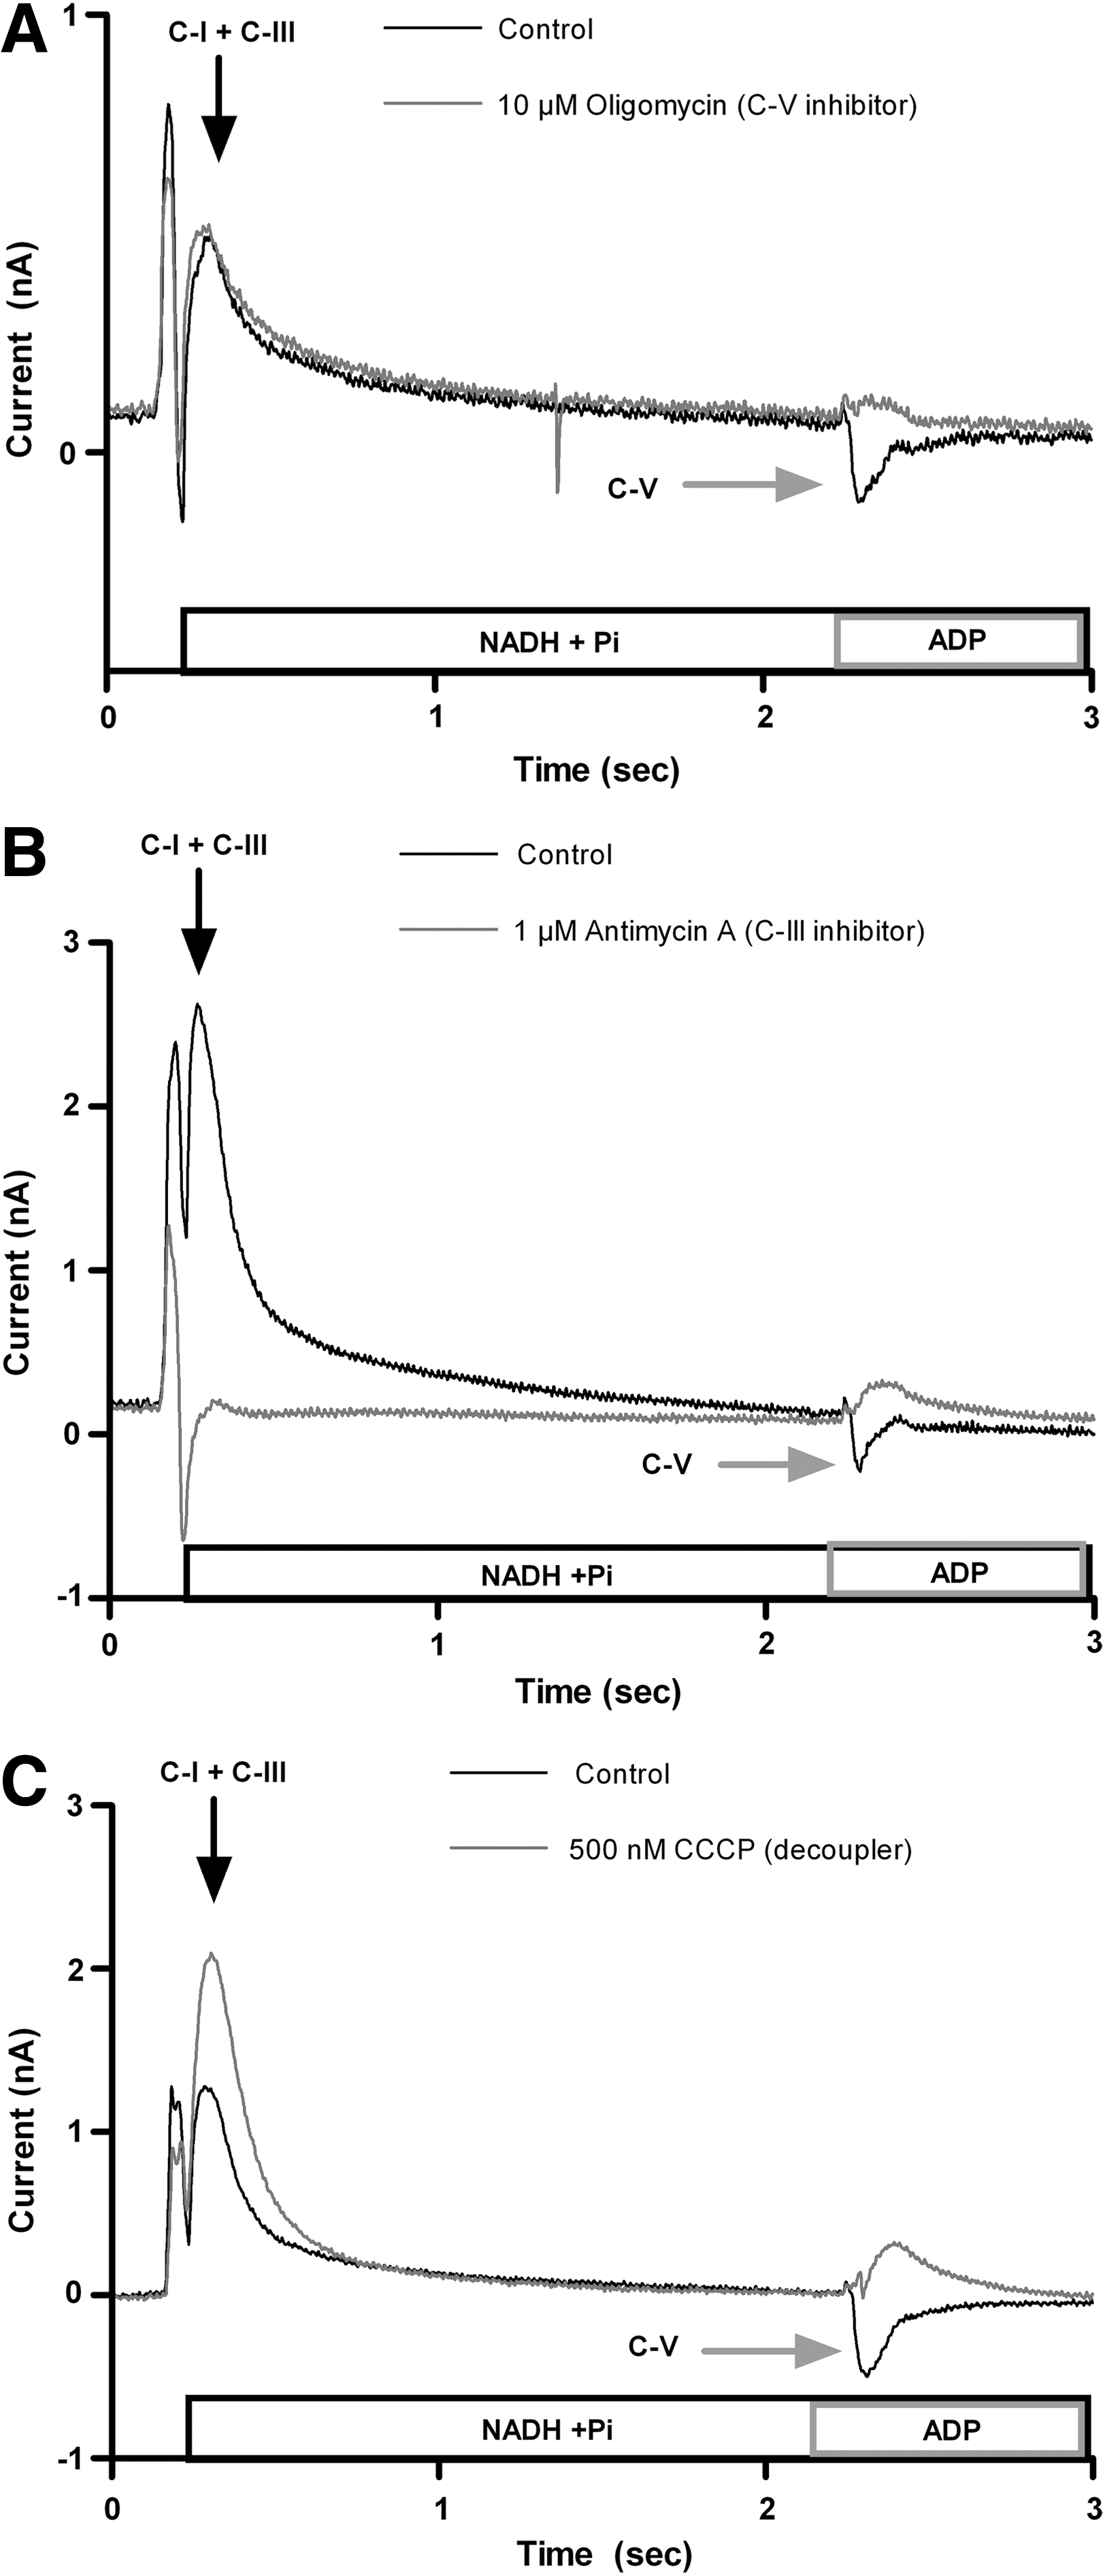
Current in the presence of known inhibitors or decoupling reagents.
Comparison Between Oxphos Assay and Uncoupling Activity Tested on Rat Liver Mitochondria
Ten in-house substances with known effects on the respiratory chain were tested. The uncoupling activity was determined as the stimulation of state 4 respiration on glutamate/malate of coupled rat liver mitochondria. Respiration in the presence of substances was compared to an untreated control. 6 Mitochondria were isolated from rat liver, resuspended in medium containing the substrates of respiratory chain enzymes and phosphate, and measurements with an oxygen-sensitive electrode were obtained immediately after resuspension. The addition of ADP results in oxygen consumption when ADP is converted to ATP, and in the presence of decoupling reagents, the oxygen uptake increases without ADP addition. Inhibitors of oxidative phosphorylation enzymes cause a decrease of oxygen consumption with increasing concentration. To compare the uncoupling efficacy, the concentrations for half-maximal uncoupling (U50) and a half-maximal inhibition (IC50) were determined. The compounds (marked A1-A10) were dissolved in Dimethyl sulfoxide (DMSO) with 46 μM as the highest concentration tested. All data were compared to a blank control containing DMSO only. Table 2 shows the comparison of data obtained within uncoupling activity tested on rat liver mitochondria measurements and those achieved with the oxphos assay.
Comparison of Data Acquired by Uncoupling Activity Tested on Rat Liver Mitochondria Measurements and Oxphos Assay
U50 and IC50 values are derived from a single dose–response determination. % inhibition values are reported as mean±SD (n=3). CI-III and CV indicate the mode of interaction; see
Substance A1–A10: Ten in-house substances with known effects on the respiratory chain were selected from different screening projects and tested.
NA, not active, no measurable effect at 46 μm, the top concentration tested; ND, not determined; oxphos, oxidative phosphorylation.
Comparison of Results from an ATP Depletion Assay and Oxidative Phosphorylation Assay from In-House Screening Data
Thirty-five substances tested using the ATP depletion assay CellTiter-Glo® Luminescent cell viability assay (Promega Corporation Madison, WI) were also evaluated by the oxphos assay. The ATP depletion assay determines the number of viable cells in culture based on quantification of the amount of ATP present, which indicates the presence of metabolically-active cells. 13,14 Seven of the tested substances showed no inhibition in the oxphos assay and were not active in the ATP depletion assay. Eight compounds were not active in the ATP depletion assay, but showed significant inhibition in the oxphos assay. Of these eight compounds, one produced inhibition of complex I/complex III currents and decoupling while the other seven showed only inhibition of complex I/complex III currents. Twenty substances were active in the ATP depletion assay and the oxphos assay. Of these, 12 showed only inhibition of complex I/complex III currents and the other eight were also decoupling reagents. Table 3 shows the comparison of data obtained the ATP depletion assay and those achieved with the oxphos assay.
Comparison of Results from Adenosine Triphosphate (ATP) Depletion Assay and Oxphos Assay
IC50 values are derived from a single dose–response determination. % inhibition values are reported as mean±SD (n=3).
Substance B1–B34: Thirty-four in-house substances were tested in a screening project in which an ATP depletion assay was used as secondary assay.
See
NA, not active, which means no measurable effect at the top concentration tested (50 μM).
Assay Validation Using Marketed Drugs
Some drugs currently on the market have known mitochondrial liabilities. 15 To validate the oxphos assay, 17 of these substances were tested in our assay at a concentration of 10 μM. Those drugs that showed no effect at 10 μM were then tested at higher concentrations. The selected pharmaceutical agents were described as inhibitors of the individual ETC components. Table 4 show a summary of results.
Testing of Marketed Drugs
% inhibition values are reported as mean±SD (n=3). CI-III and CV indicate the mode of interaction; see
As representatives for complex I inhibition, we chose capsaicin, 1-methyl-4-phenyl-1,2,3,6-tetrahydropyridine (MPTP), butformin, and metformin. Capsaicin is the active component in chili peppers and is used pharmaceutically to increase blood flow. In a previous study, capsaicin was tested on isolated enzymes where the electron transfer from NADH to NAD+ was measured by absorbance and was shown to act as a competitive inhibitor of complex I with an IC50 of 48 μM. 16 Further, in isolated mitochondria, an IC50 of 20–30 μM was reported. 17 In the oxphos assay, we measured 67% inhibition of complex I at a capsaicin concentration of 50 μM. MPTP is also known to inhibit complex I activity, and MPTP likely exerts effects through its metabolite MPP+ (1-methyl-4-phenylpyridinium), which binds to specific sites on complex I. 18 MPTP had no effect in the oxphos assay at 10 μM and at 50 μM. The influence of its metabolite MPP+ was not tested.
Butformin and metformin are antidiabetic drugs. Butformin was withdrawn from the market in 1978 because it promoted lactic acidosis. 19 Metformin mainly inhibits hepatic glucose release, gluconeogenesis, and β-oxidation of fatty acids. Metformin inhibits respiration when incubated with isolated mitochondria or isolated complex I protein in a time- and dose-dependent manner. Six hour incubation was needed to measure a K0.5 of 79 mM. 20 In the oxphos assay, neither butformin nor metformin showed a significant inhibition at 10 or 50 μM. Inhibition was not expected in μM concentrations and after 5 min of incubation.
Oxalacetate and malonate are known as competitive inhibitors of complex II and have inhibitory constants (Ki) of 18 and 15 μM, respectively. 21 Both compounds showed no effect in the oxphos assay at 10 μM and at 50 μM, because the direct influence of complex II is not measured in the described assay setup.
Antimycin is an antibiotic that binds complex III and blocks electron transport from the heme bH center to ubiquinone. 22 Antimycin at 1 μM completely inhibited the complex I/complex III related signal with an IC50 of 156 nM. Acetaminophen is an analgesic and antipyretic that is safe in therapeutic doses, but accidental acetaminophen overdoses represent the most common cause of induced liver failure in the United States. 23 This toxicity depends on bioactivation by cytochrome P450 to N-acetyl-p-benzoquinone imine (NAPQI), and accumulation of this metabolite beyond the capacity of glutathione detoxification system tests of NADH-linked respiration showed an IC50 of 1.8 and 0.12 mM for acetaminophen and NAPQI, respectively. 23 In the oxphos assay, acetaminophen had no influence at a concentration of 10 and 50 μM, while at 100 μM, an inhibition of 52% of complex I/complex III was detectable.
The cephalosporin derivative cephaloridine and tamoxifen were used as complex IV inhibitors. Cephaloridine is an antibiotic that can induce nephrotoxicity and cause acute renal failure in humans and animals. 15 Cephalosporin was shown to inhibit Cytochrome c oxidase (complex IV) in mitochondria. The activities of NADH-cytochrome c reductase and succinate dehydrogenase in mitochondria and NADPH-cytochrome P450 reductase, NADH-cytochrome b5 reductase, and 7-ethoxycoumarin O-deethylase in microsomes of treated cells were not affected by cephaloridine. In that study, the cells were cultured to confluence and then treated with cephaloridine at concentrations of 0.5 and 1 mM for 1–24 h. 24 In the oxphos assay, cephaloridine had no effect at 10 μM. At 50 μM, complex V was inhibited by 52%, and at 100 μM no inhibition was seen.
Tamoxifen is widely used for treating breast cancer, and while it shows some potential health benefits, this drug is also known to cause cytotoxic side effects. Enzymatic assays and spectroscopic studies indicate that tamoxifen inhibits electron transfer in the respiratory chain at the level of complex III and, to a lesser extent, at complex IV. Tamoxifen also showed some uncoupling effects. At 45 μM tamoxifen, the mitochondria became totally uncoupled; complex III was inhibited by 85% and complex IV by 50%. 25 The oxphos assay showed no inhibition of complex III at 10 and 50 μM tamoxifen, but decoupling was observed at 50 μM.
Compounds that influence ATP production can be either inhibitors of complex V, such as oligomycin, or substances that uncouple oxidative phosphorylation, such as tropolone, diclofenac, diflunisal, propofol, tolcapone, and entacapone. Nonsteroidal anti-inflammatory drugs (NSAIDs) require a weak acid (carboxyl) to inhibit cyclooxygenase through binding to the arachidonate binding site. Unfortunately, this acid group and their lipid soluble nature also allow NSAIDs to interact with the enterocyte IM phospholipids, where they act as a protonophore, thereby depleting ATP and causing cytotoxicity. 15 Diclofenac and diflunisal were tested as representative NSAIDs in the oxphos assay. Measurements of cellular energy depletion showed that 500 μM diclofenac resulted in an almost complete loss of ATP. 26 Diclofenac had no effect in the oxphos assay at 10 μM, and at a concentration of 50 μM, complex V was inhibited by 54%. At 100 μM diclofenac, decoupling was measured, but no influence on complex I/complex III occurred. Diflunisal is described as a more potent uncoupler than diclofenac 22 and showed decoupling in the oxidative phosphorylation assay at 10 μM, but had no influence on complex I/complex III. Propofol is an intravenous anesthetic used for general anesthesia that is believed to affect mitochondrial energy metabolism. In a previous study, propofol decreased the mitochondrial transmembrane potential when added at 75 μM to a mitochondrial suspension, but ATP synthesis was not decreased. Inhibition was observed when the concentration was increased to 100 μM. 27 In the oxphos assay, propofol produced no inhibition at 10 μM and at 50 μM, complex V was inhibited by 61%; at 100 μM, propofol decoupling occurred. Tropolone is an antiviral, antifungal, and antitumor drug that was shown to be toxic to rat hepatocytes at 1 mM. 27 In the oxphos assay, no significant effect of tropolone was seen up to 100 μM, and higher concentrations were not tested.
The final set of marketed drugs that was tested in the oxphos assay encompassed medications that have been withdrawn from the market due to mitochondrial liabilities. Benzbromarone, a potent uricosuric drug, was launched in the 1970s and was thought to have few associated serious adverse reactions. In 2003, the drug was withdrawn after reports of serious hepatotoxicity, although it is still marketed in several countries. 28 In the oxphos assay, decoupling was measured at 10 μM benzbromarone, while at the same concentration there was no effect on complex I/complex III. The antidiabetic drug troglitazone was withdrawn in 2000 due to rare liver toxicity. 29 In the oxidative phosphorylation assay a strong inhibition of complex I/complex III and decoupling was observed with 10 μM troglitazone.
Tolcapone inhibits the enzyme catechol-O-methyltransferase (COMT) and was withdrawn from the market due to rare instances of severe liver injuries, although the drug was subsequently approved for treatment of Parkinson's disease in 1997. 30 In 1998, entacapone, a less potent inhibitor of COMT with fewer side effects was approved. Tolcapone is described as a decoupling reagent, while entacapone is not. 31 These results were confirmed by the oxphos assay, where tolcapone shows strong decoupling at 10 μM, while entacapone had no such effect at 10 and 50 μM. All drugs were tested in the ATP depletion assay and showed no cytotoxicity at up to 30 μM.
Statistical Analysis and Initial In Silico Models
Based on the data obtained for inhibition of either complex I and III or complex V, we selected 106 compounds from different in-house screening campaigns, which were consistently tested at a concentration of 10 μM, for further statistical analysis. Twenty-eight of these compounds (26%) exhibited an inhibition <40% at 10 μM concentration for both endpoints (complex I/complex III and complex V), which we defined as having “no significant effect” on respiratory chain complexes for purposes of the following discussion. Interestingly, this finding correlated with the compound lipophilicity, computed using MoKa™ and expressed as logP. 32,33 The logP for this dataset ranges from −2 to 7.5. In particular, 11 of 13 very polar compounds (logP from −2 to 1.99) showed no significant effect (85%), which could be partially attributed to low membrane permeability. For the group of 34 molecules with logP from 2 to 3.99, only four (11%) showed no significant effect. This trend is qualitatively similar for the group of 54 compounds with a logP ranging from 4 to 5.99, where only nine molecules (17%) had no significant effect. For five very lipophilic molecules with logP >6, this observation was reversed again with four molecules (80%) having no significant effect, which might be partially related to low membrane permeability due to accumulation in lipophilic membranes. Hence, these 106 compounds can be classified using logP as a measure of lipophilicity, which then results in 19 outliers and a correct classification of 82%. Individual relationships of logP on the y-axis are plotted in both graphs in Figure 6 versus inhibition of complex I/complex III (left) or complex V (right). The same analysis using logD7.4 computed using MoKa qualitatively agrees with this observation (20 outliers and 81% correct classification).
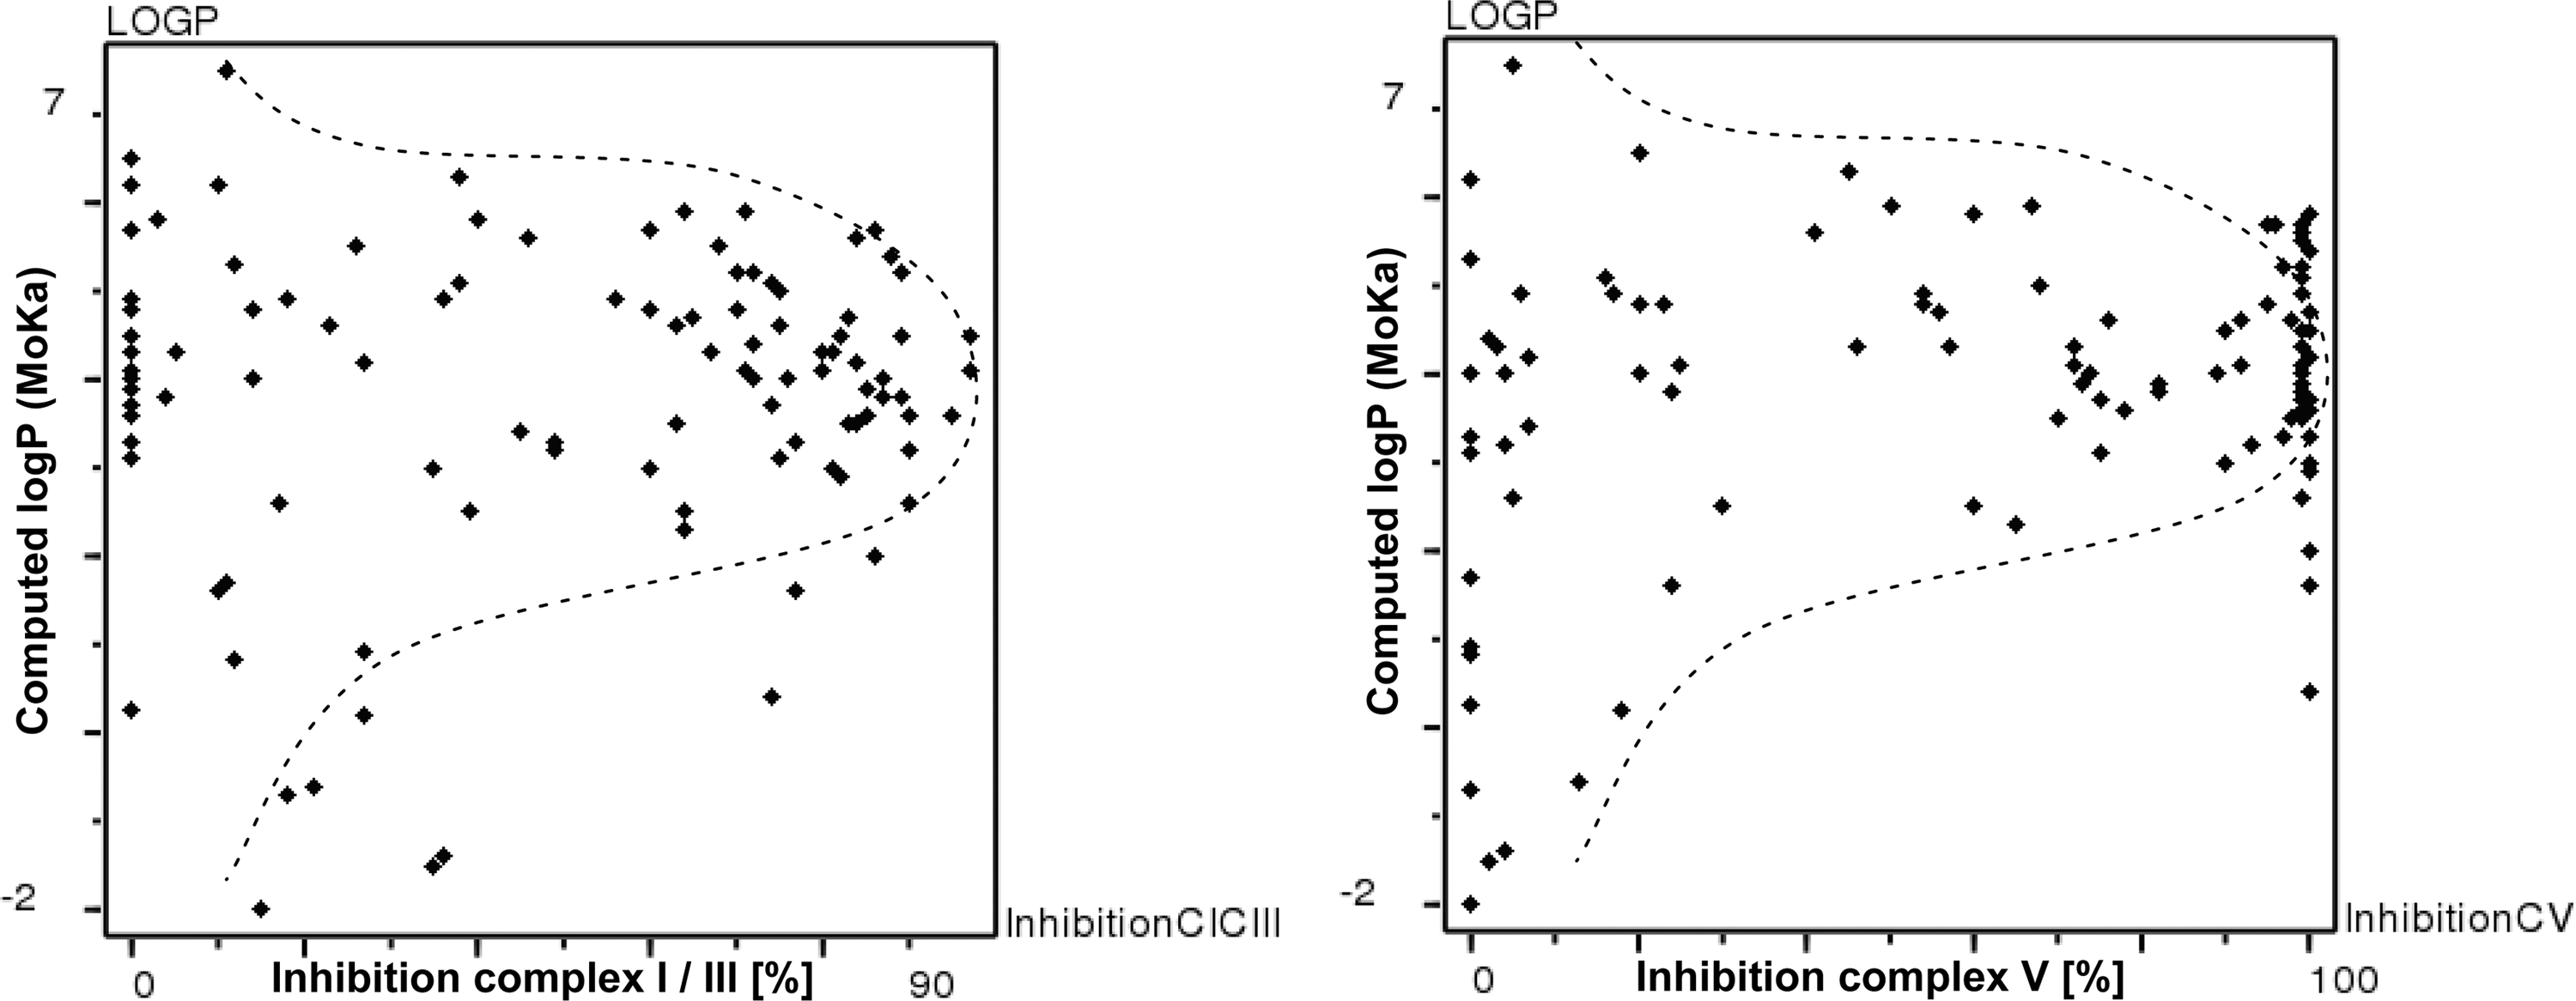
Relationship of computed logP (MoKa) to experimental inhibition of complex I/complex III (left) or complex V (right).
We then developed quantitative SAR (QSAR) models for both assay endpoints. As a dependent variable, we selected the numerical percent inhibition of complex I and III and complex V at a 10 μM test concentration for consistency.
QSAR models relate numerical properties (descriptors) computed from the molecular structure to experimental activity data. A wide range of 2D- and 3D-molecular descriptors can be explored to describe physicochemical and molecular properties of the investigated molecules. In the present study, we employed a total of 610 descriptors for physicochemical and molecular representation of the investigated compounds. In particular, we calculated 185 MOE™ descriptors, 109 Crippen keys, 191 CATS 2D-pharmacophore descriptors, and 128 VolSurf+™ descriptors using our in-house descriptor calculation software package. 34 –40 All molecular structures were treated as neutral. Counterions were removed prior to descriptor calculations. The program CORINA™ was used to generate 3D structures. 41
For the second step, namely the correlation of computed descriptors with biological inhibition data, we applied the partial least square (PLS) statistical approach (PLS projection onto latent structures), as implemented in Sybyl×1.3. 42 –45 To assess the statistical significance of the resulting PLS models, cross-validation 46,47 using “leave-10%-out” and “leave-one-out” as implemented in partial least square algorithm (SAMPLS) 47 was performed. 46 –49
For both endpoints, initial models were obtained that incorporated all computed descriptors. We then refined these models based on selecting and exploring relevant descriptors from initial models with high PLS coefficients (i.e., important descriptors) in multiple cross-validated analyses. The success of the variable selection was monitored by regression coefficients, namely by q 2 (cross-validated correlation coefficient from leave-10%-out analyses) and r2 (noncross-validated correlation coefficient). This approach resulted in the development of statistically significant PLS models with a reduced number of relevant descriptors in the final model. The final PLS model for inhibition of complex I/complex III for 106 compounds is based on 64 descriptors with a q 2 of 0.568 for three PLS components (leave-10%-out), 0.595 (leave-one-out), and an r2 value of 0.797. The corresponding PLS model for inhibition of complex V is based on 65 descriptors with a q 2 of 0.545 for three PLS components (leave-10%-out), 0.543 (leave-one-out), and an r2 value of 0.730. Plots of experimental versus predicted inhibition in the oxphos assay are shown in Figure 7 for complex I/complex III (left) and complex V (right). Both resulting models after variable selection were of acceptable statistical quality and thus subjected to further analysis and chemical interpretation.
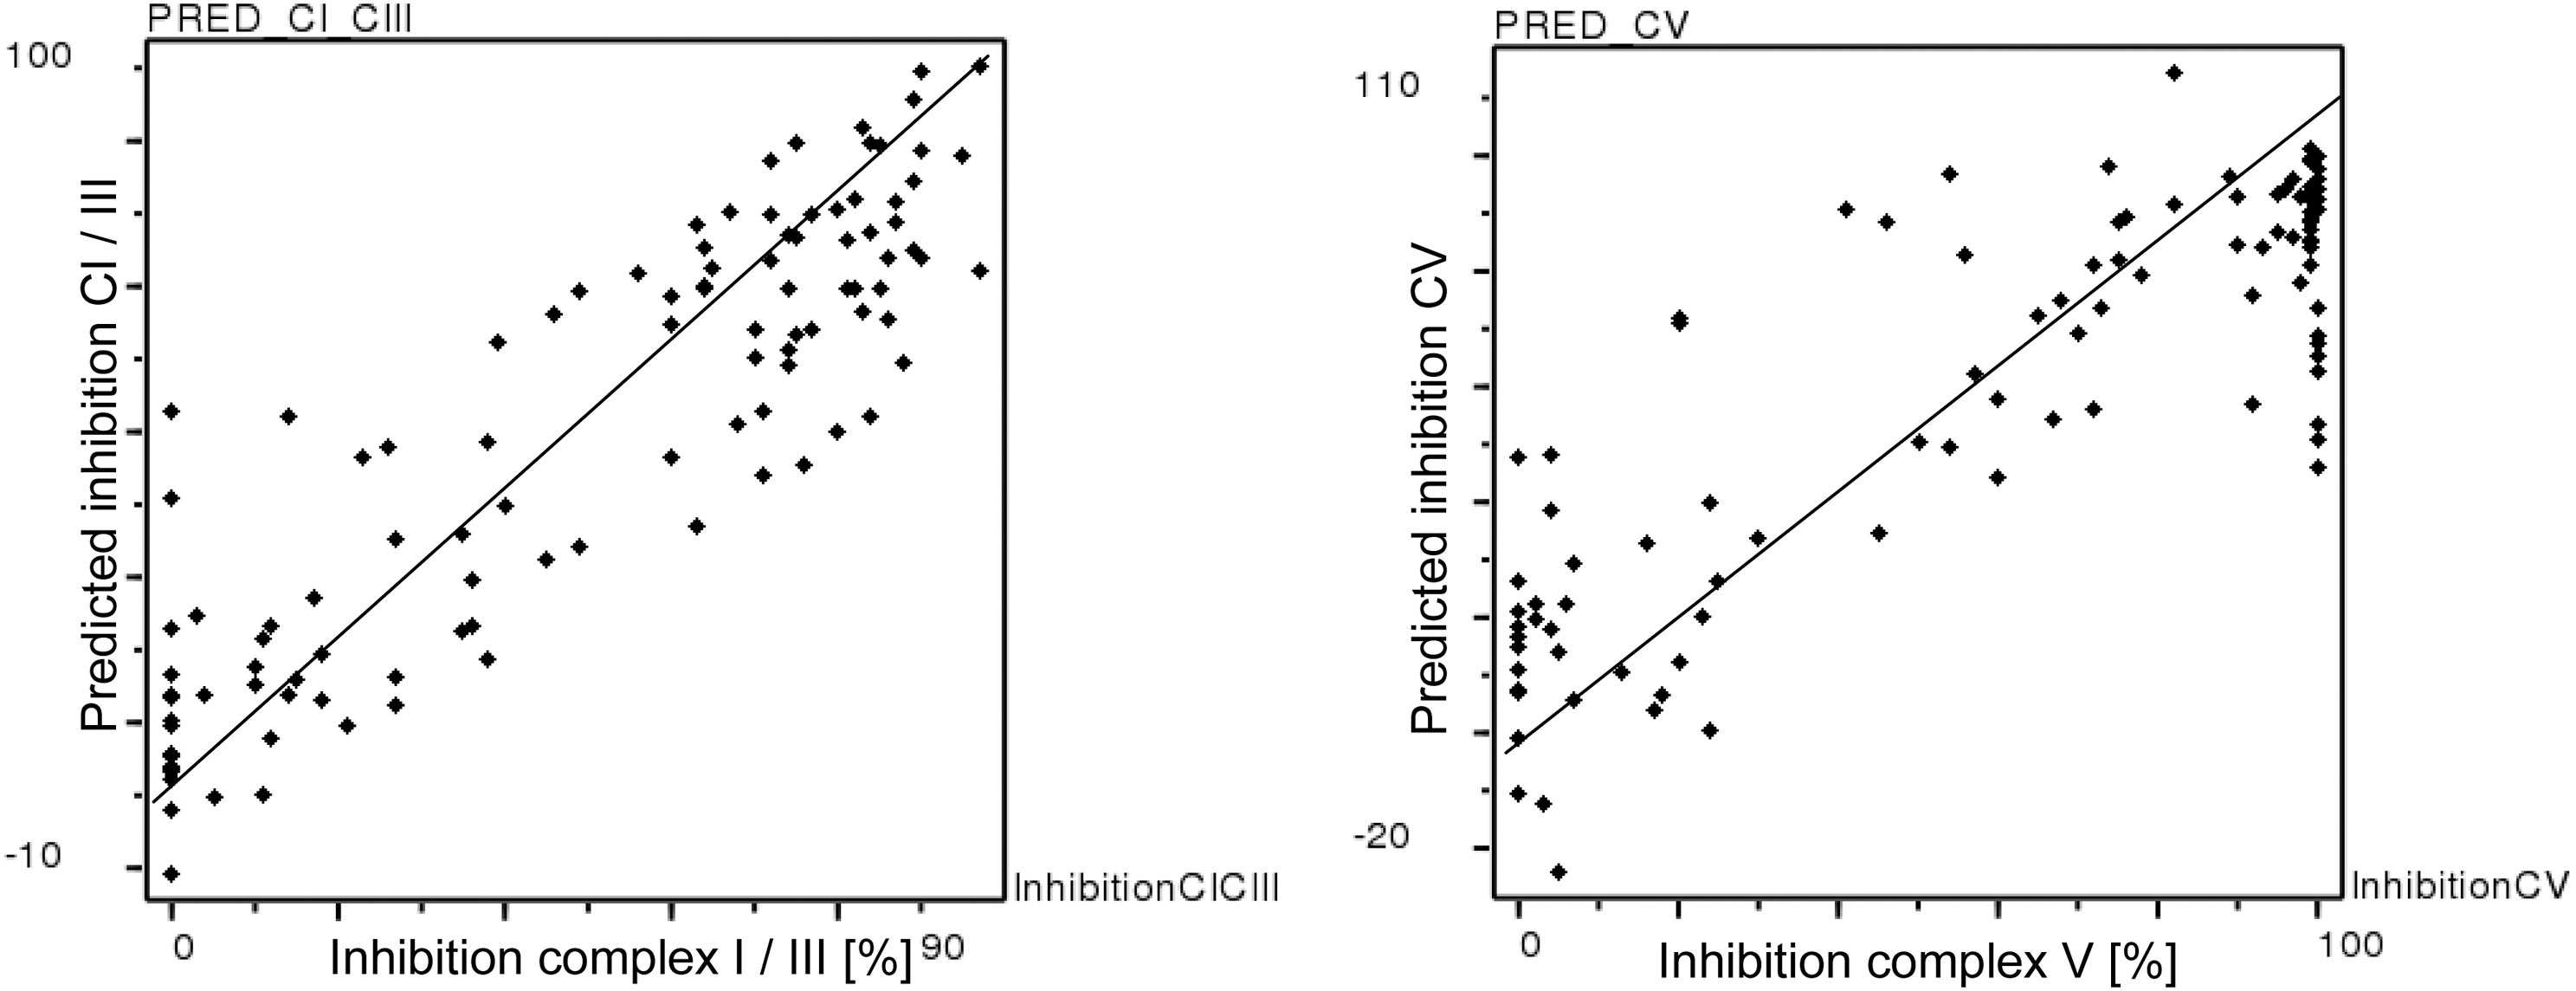
Experimental versus predicted inhibition in the oxphos assay at 10 μM inhibitor concentration for complex I/complex III (left) and complex V (right). Predictions were obtained from partial least square models with variable selection for both assay endpoints.
For further validation of the models, cross-validated analyses were run using SAMPLS or two and five cross-validation groups with random selection of group members and a maximum of three PLS components. These PLS analyses were averaged over 100 runs to assess the statistical stability of the final QSAR models. For the PLS model for inhibition of complex I/complex III, a mean (±SD) cross-validated r2 of 0.499±0.049 for two cross-validation groups and 0.545±0.033 for five cross-validation groups was obtained. Both values supported the finding of a stable statistical model, either when 50% or 20% of the dataset are excluded from the model building for two and five cross-validation groups, respectively. A clear and stable trend to predict molecules not included during the training of the PLS model was observed, as indicated by those cross-validated correlation coefficients with values of ∼0.5 or higher. For the complex V inhibition model, the PLS model again supported the finding of a significant model. Here, a mean cross-validated r2 of 0.495±0.048 and 0.537±0.021 for two and five cross-validation groups, respectively, was obtained.
Further, all affinities for both models with the final number of variables were randomized 100 times, subjected to PLS, and the mean r2 was then calculated. 50 For a dataset with randomized biological activities, no significant model can be realistically expected. Hence, such a repeated randomization is useful for estimating the likelihood of chance correlation upon deriving a final model. For the PLS model for inhibition of complex I/complex III and complex V, a mean r2 of −0.172±0.098 and −0.121±0.090, respectively, resulted. Collectively, these statistical validation data support the finding of two stable and significant PLS models covering the chemical space of this dataset of testing in the oxphos assay.
Chemical Interpretation of In Silico Models
The chemical interpretation of both in silico models suggests that descriptors capturing lipophilicity and charge distribution are correlated to the observed activity. The most important descriptors for PLS models for inhibition of complex I/complex III or complex V are summarized in Tables 5 and 6. From the analysis of the model for inhibition of complex I/complex III based on 64 descriptors, 13 are of particular interest, as they exhibit a normalized fraction of contribution >0.02. These support our understanding of the structural and physicochemical reasons for the observed activities. The descriptors are summarized in Table 5 together with the coefficient sign in the final model indicating a positive or negative contribution, the coefficient value, and the normalized fraction of contributions to the model. In addition, the physicochemical meaning of a particular descriptor is indicated. Figure 6 shows the relationship of computed logP (MoKa) to experimental inhibition. Figure 7 the experimental versus predicted inhibition in the oxphos assay at 10 μM inhibitor concentration.
Relevant Descriptors from the Analysis of Partial Least Square (PLS) Coefficients from the Model of Complex I/Complex III Inhibition with 64 Descriptors
Relevant Descriptors from the Analysis of PLS Coefficients from the Model of Complex V Inhibition with 65 Descriptors
For insights into model interpretation, the NSAID diflunisal was first analyzed in greater detail (Fig. 8). Diflunisal inhibits complex I/complex III and complex V from corresponding assays at 10 μM concentration (complex I/complex III 74%, complex V 100% inhibition). The systematic comparison of descriptors to computed values for diflunisal reveals significant differences linked to activity in the oxphos assay. The following section discusses selected descriptors, while the final model incorporates all 64 descriptors for predictions. The molecular operating environment (MOE) physicochemical descriptor GCUT_SLOGP_2 (GCUT descriptor from eigenvalues of distance adjacency matrix with logP diagonal elements) shows a mean value of 0.1612 with an SD of 0.0722 for all 106 compounds of the dataset studied. The computed value of 0.2402 for diflunisal significantly differs by more than one standard deviation from this mean distribution and thus is positively linked to biological activity. Increasing this specific lipophilic descriptor in new compounds might thus result in higher inhibition of complex I/complex III. A similar observation is made for the MOE-derived physicochemical descriptor PEOE_VSA_4 (sum of surface area for atoms with negative PEOE charge) with a mean value of 8.6836±10.6844. Here a significantly larger value of 23.8173 for diflunisal is again linked to biological activity. The MOE physicochemical descriptor SLOGP_VSA4 (MOE sum of surface area for atoms with slightly lipophilic logP contribution) shows a mean value of 15.4486±13.8526 for the entire dataset, while the value for diflunisal is significantly larger at 27.0478, thus again positively contributing to the observed complex I/complex III inhibition. Finally, the CATS descriptor DL3 (topological distance between donor and lipophilic center) is also in agreement with the general PLS model interpretation. Here, a mean value of 0.0554±0.0614 was observed, while this structural feature is not present in diflunisal. As this feature negatively contributes to the overall prediction of activity, this is again in good agreement with the model. Hence, some relevant descriptors related to lipophilicity, topological pharmacophore features, and charge distribution can be extracted from the chemical interpretation of diflunisal. These descriptors are useful for explaining the observed activity for this molecule.
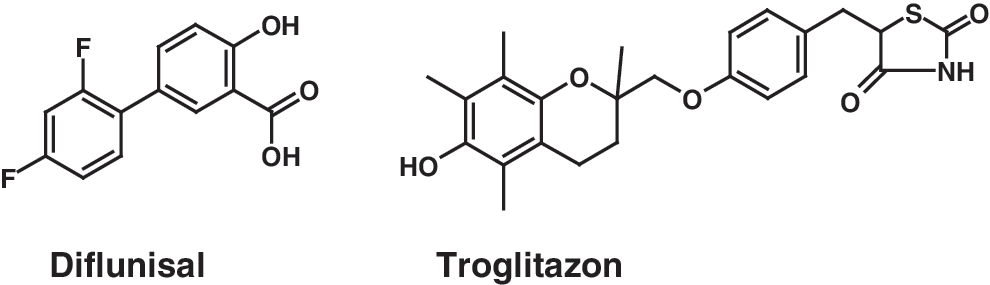
Structure of diflunisal and troglitazon.
As a second example, the PPARα and PPARγ activator antidiabetic drug troglitazone was selected (Fig. 8). This compound shows no effect on complexes I/III, but inhibits complex V at a concentration of 10 μM (complex I/complex III 3% and complex V 100% inhibition). This experimental observation for complex I/complex III versus complex V inhibition clearly suggests different physicochemical origins for both effects. The most important descriptors for the model of complex V inhibition are summarized in Table 6. The following discussion focuses on descriptors relevant for explaining complex V activity, while in the final PLS model, all 65 descriptors influence activity predictions. The MOE physicochemical descriptor Q_RPC_M (relative negative partial charge: the smallest negative atomic partial charge divided by the sum of the negative atomic partial charges) shows a mean value of 0.1581±0.0457 for the entire dataset, while the value for troglitazone is 0.1076. As this descriptor is negatively correlated with activity, this significant negative deviation suggests a link to the observed experimental activity.
The MOE physicochemical descriptor SMR_VSA4 (sum of surface area for atoms with contribution to molar refractivity) is also in agreement with the PLS model interpretation. Here, a mean value of 11.8964±14.7786 was observed for the entire dataset. As this descriptor is found to be negatively correlated with activity in the complex V model, this is in very good agreement with the lack of this feature in troglitazone. The CATS descriptor AA9, indicating two acceptors separated by a large number of bonds, also agrees with the PLS model interpretation. Here, a mean value of 0.0111±0.0215 is significantly lower than the value of 0.0323 computed for troglitazone. This feature positively correlates with complex V activity, thus indicating a link to the observed experimental activity. Finally, the VolSurf+ derived descriptor L4LGS (solubility profiling coefficients indicating the shape of the pH-dependent solubility profile) shows a mean value of −0.0540±0.2270 for the entire dataset, while the significantly lower value of −0.3363 for troglitazone is in good agreement with the negative correlation of this feature in the final model.
This chemical interpretation for troglitazone again highlights important descriptors related to lipophilicity/solubility, topological pharmacophore features, and charge distribution. Those descriptors are among the most important ones that are correlated with the observed activity of troglitazone in the complex V assay, while all 65 selected descriptors contribute again to the final activity prediction. In summary, both PLS models for complex I/complex III and complex V inhibition are characterized by important features related to similar physicochemical effects in molecules. A comparison of descriptor value distributions with individual compounds thus reveals some potential causes for the activities in either one of the in silico models, and allows for an understanding of structural features that influence both effects.
Discussion
This study describes the development of an assay that is a suitable tool for analyzing compounds that may interfere with the mitochondrial respiratory chain. Direct measurement of IM protein activity ensures that no influence from other cellular oxidative pathways is assessed. The electrophysiological measurement of respiratory chain complexes in membrane vesicles is a highly specific assay, because no other cellular components that might utilize NAD/H or ADP/ATP are present in the assay setup. The current is measured immediately after complex activation and no labeling or enhancement of the signal is necessary. Therefore, the assay is robust with respect to artifacts that might cause false positive signals. The seal between the sensor and membrane is tight, so no ion flux occurs without activation. The buffer composition is kept to a minimum. DMSO concentrations larger than 1% or buffer detergents that might perforate the membrane and lead to nonspecific signals should be avoided for this assay. The assay is fully automated and allows 24 sensors per working day, which is a significantly higher throughput than conventional methods used to analyze the respiratory chain complexes.
The assay was validated using the antibiotic antimycin, a known complex III inhibitor, oligomycin, a known complex V inhibitor, and CCCP, a known uncoupling reagent. The IC50 of antimycin is 156 nM in the oxphos assay and in the literature is noted as 22 nM. 51 Here, the compound is tested in an assay that detects the enzyme activity by absorbance. With the same assay technology, the IC50 for oligomycin was determined to be 8 nM, while in the oxphos assay it was 100 nM. For both antibiotics, the IC50 is significantly higher in the oxphos assay. This difference could be due to the relatively short incubation time of 5 min at RT used in the oxphos assay, while the other assay has a 2 h incubation at RT. The uncoupling reagent CCCP was found to be 11 nM in an assay similar to the oxphos assay. 9 In the oxphos assay, the CCCP IC50 was 38 nM. Again, the IC50 is larger in the oxphos assay, but not as high as in comparison to the absorbance assay. Once more, there are shorter incubation times in our oxphos assay, as opposed to 15 min at RT, and multiple applications of a given compound concentration can occur on the same sensor. 9 Further, in previous studies all increasing concentrations of a given compound were tested on one sensor, while our oxidative phosphorylation assay uses a new sensor for every concentration. This difference could also explain the larger IC50 in the oxphos assay.
Assays for the oxphos complexes have been previously described in the literature. A primary advantage of the assay described here is that frequent isolation of mitochondria is not necessary. Membrane preparations can be stored at −80°C for up to 12 months without loss of activity. Further, our assay allows direct measurement of complex activity without interference from other enzymes that make use of NAD/H or ADP/ATP. The consumption of material is relatively low with 12 μL of membrane solution sufficient for 24 sensors, and the microtiterplate format of the sensors and compound dilution in the plates further reduces solution volume. Although the direct measurement of the respiratory chain is an advantage, the fact that the absence of other enzymes that consume NAD/H or ADP/ATP could lead to false positive results should be considered when comparing this assay to others that are cell-based or use complete mitochondria. In the oxphos assay, only the inhibition of the respiratory chain is measured, and other mitochondrial pathways are excluded. Our oxphos assay does not allow for the detection of toxic drug metabolites because it does not use viable cells. Compared to assays that use isolated enzymes, it should be noted that the concentration of each complex in the membrane preparation used for the oxphos assay cannot be determined. As such, different protein concentrations can lead to different currents. Therefore, several measurements without compound must be made to determine the current without inhibitor (100%) before the current in presence of inhibitor is measured (% inhibition).
The results we obtained with our assay are comparable to oxyograph measurements, but the measurement time and material consumption is reduced and discrimination between inhibition of complex I/complex III and complex V is possible. Several compounds were found to be inactive in the ATP depletion assay but were active in the oxphos assay. This could indicate that the oxphos assay is more sensitive or that these compounds are not transported into the mitochondria and therefore did not register as active in a cellular assay, even though they do inhibit respiratory chain complexes. The data obtained with marketed drugs that have known mitotoxic liabilities, such as tolcapone, had detectable activities at the common screening concentration of 10 μM, while compounds like acetaminophen showed a significant effect only at 100 μM, which is significantly larger than the screening concentration and the concentration in vivo. Therefore, for those compounds, mitotoxicity is not an issue in drug development. Unexpectedly, inhibitors of complex IV had an influence in the oxphos assay. The activity of complex IV can be measured with SSM technology. 9 In our assay setup, proton transfer is not induced by the external addition of cytochrome c. Nevertheless, there is an effect on complex V activity at a concentration of 50 μM for the antibiotic cephaloridine. Since all proteins in the ETC are connected, it is not surprising that complex IV inhibitors reduce the signal of complex V. It is likely that the membrane preparation also includes cellular cytochrome c. At 100 μM of cephaloridine, no significant inhibition was seen. This could be due to solubility issues. Cephaloridine might precipitate at higher concentrations and therefore no major inhibition was seen. Another conspicuity compared with literature concerning marketed drugs was seen for the anticancer agent tamoxifen, which was previously shown to inhibit complex III and to a lesser extent than complex IV. We tested tamoxifen at 10 and 50 μM, which had no effect and strong decoupling activity, respectively. As such, tamoxifen might act as a decoupling agent in addition to inhibiting complex III and complex IV.
The analysis revealed a correlation with the lipophilicity of the compounds tested and allowed for the development of two stable and significant PLS models that cover the chemical space of the data obtained with the oxphos assay.
Footnotes
Acknowledgments
We gratefully acknowledge: Prof. Dr. Ulrich Brandt (University of Frankfurt) for supporting the respiration measurements with liver mitochondria; Dr. Ziyu Li (Sanofi) and Dr. Jörg Czech (Sanofi) for providing data from the ATP depletion assay; and Martina Hardt (Sanofi) and Ilka Siebels (Universitätsklinikum Frankfurt) for their technical assistance.
Author Disclosure Statement
No competing financial interests exist.