
Abstract
Accurately identifying patients with pulmonary hypertension (PH) using noninvasive methods is challenging, and right heart catheterization (RHC) is the gold standard. Magnetic resonance imaging (MRI) has been proposed as an alternative to echocardiography and RHC in the assessment of cardiac function and pulmonary hemodynamics in patients with suspected PH. The aim of this study was to assess whether machine learning using computational modeling techniques and image-based metrics of PH can improve the diagnostic accuracy of MRI in PH. Seventy-two patients with suspected PH attending a referral center underwent RHC and MRI within 48 hours. Fifty-seven patients were diagnosed with PH, and 15 had no PH. A number of functional and structural cardiac and cardiovascular markers derived from 2 mathematical models and also solely from MRI of the main pulmonary artery and heart were integrated into a classification algorithm to investigate the diagnostic utility of the combination of the individual markers. A physiological marker based on the quantification of wave reflection in the pulmonary artery was shown to perform best individually, but optimal diagnostic performance was found by the combination of several image-based markers. Classifier results, validated using leave-one-out cross validation, demonstrated that combining computation-derived metrics reflecting hemodynamic changes in the pulmonary vasculature with measurement of right ventricular morphology and function, in a decision support algorithm, provides a method to noninvasively diagnose PH with high accuracy (92%). The high diagnostic accuracy of these MRI-based model parameters may reduce the need for RHC in patients with suspected PH.
Pulmonary hypertension (PH) is defined at right heart catheterization (RHC) as a mean pulmonary arterial pressure (mPAP) of ≥25 mmHg. 1 Although RHC is currently the gold standard for confirming the diagnosis of PH and assessing response to treatment, it is an invasive procedure. In specialist centers, severe complications following RHC are low but not negligible. 2 Consequently, there is a growing interest in noninvasive, alternative methods to diagnose PH and assess response to therapy, using nonionizing, image-based metrics. Magnetic resonance imaging (MRI) is considered the gold standard for the assessment of right ventricular (RV) anatomy and function, 3 providing high resolution and better accuracy than echocardiography, with a high degree of reproducibility of quantitative metrics of ventricular morphology and function. 4 Diagnostic metrics, based on direct quantification of the cardiopulmonary anatomy and blood flow from MRI measurements, have been proposed and show promising results.5–12 However, in addition to structural and morphological modifications of the heart and pulmonary arteries, PH also changes physiological and hemodynamic parameters, including increased pulmonary vascular resistance and decreased total vascular compliance.13–15 Computational models can bring additional insight into the hemodynamic behavior of the pulmonary vascular system. Windkessel models 16 have been implemented by several groups13,17,18 to characterize pulmonary circulation and vessels in terms of resistance and compliance and the changes between healthy and PH subjects. The presence of PH modifies these Windkessel parameters, and quantitative characterization can be provided by measurement of the energy in the reflected waves in the pulmonary artery as a percentage of the total wave energy.19,20 While showing potential for PH assessment, the results reported in these articles were based on invasive catheter measurements. We have recently shown 21 that MRI measurements made in the main pulmonary artery (MPA), together with the interpretation provided by 2 such models, can provide a quantitative diagnostic characterization of PH. The first model is a 3-element Windkessel circuit (RcCRd); the capacitor C represents the compliance of the system, and Rc and Rd are proximal and distal resistors. The second is a one-dimensional (1D) model of an elastic tube that is able to separate forward-traveling and reflected waves, measured in the MPA. These models were evaluated in a pilot study of normotensive individuals and patients with PH, diagnosed and stratified according to RHC measurements of mPAP and pulmonary vascular resistance (PVR), and we showed that the zero-dimensional (0D) and 1D proposed diagnosis indices can be used as differentiation criteria in PH.
Our research hypothesis is that by combining already available and developed noninvasive, MRI-based cardiopulmonary and computational metrics into a machine learning classification algorithm, we can improve the noninvasive diagnostic accuracy of MRI in PH. The aim of this article is to test whether additional sensitivity and specificity can be achieved by combining several MRI-derived metrics of cardiopulmonary function and form into a decision-making algorithm for PH diagnosis. To achieve the proposed aim, 3 main objectives have been defined: (1) to test the individual accuracy of several MRI-based PH metrics, (2) to identify the best combination of metrics that will improve the machine learning–based classifier's diagnostic accuracy, and (3) to evaluate the performance of the best model and discuss the results in the context of the analyzed cohort.
METHODS
Patients
Seventy-two consecutive patients undergoing investigation for suspected PH who underwent RHC and MRI examination within 48 hours were identified from the Sheffield Pulmonary Vascular Disease Unit, a National PH referral center. The patients were referred from other centers to the Sheffield Unit on the basis of clinical features and a local noninvasive assessment that usually included echocardiography. The exclusion criteria were MRI incompatibility, claustrophobia, and pregnancy.
The 72-patient cohort was divided into 2 groups—no PH and PH—on the basis of a threshold of 25 mmHg, measured at RHC. 22 PH was diagnosed in 15 patients, with 11 patients having an mPAP between 22 and 24 mmHg, referred to in the literature 23 as borderline PH. Fifty-seven patients received the PH diagnostic. For patients in whom PH was diagnosed, the distribution within the PH subgroups was as follows: group 1, pulmonary arterial hypertension (PAH; n = 21), with 13 idiopathic PAH, 4 PAH in association with connective tissue diseases, 2 PAH in association with congenital heart disease, 1 PAH related to drug use, and 1 portopulmonary hypertension; group 2, PH owing to left heart disease (n = 11); group 3, PH associated with respiratory disease (n = 8); group 4, chronic thromboembolic PH (n = 16); and group 5, PH unclear/multifactorial (sarcoidosis; n = 1). Ethics approval was obtained (North Sheffield Ethics Committee) for analysis of routinely performed investigations, and written consent was not required.
RHC
RHC was undertaken using a balloon-tipped 7.5-Fr thermodilution catheter (Becton-Dickinson). PH was defined as having an mPAP of ≥25 mmHg at rest. Cardiac output was measured using the thermodilution technique. PVR was calculated as follows: PVR (Wood units) = (mPAP – pulmonary capillary wedge pressure)/cardiac output.
MRI acquisition
All the patients underwent MRI in the supine position on a 1.5-tesla whole-body scanner (GE HDx, GE Healthcare, Milwaukee) using an 8-channel cardiac coil. Two-dimensional (2D) phase contrast images of the MPA were acquired to quantify the flow Q(t) through the artery. Although the magnitude of images of the phase contrast sequence can be used to segment the MPA area, the main drawback of this approach is that extraction of accurate area during the diastolic period—when there is low flow in the pulmonary artery and therefore low signal—is difficult because the vessel contour is not well defined. A balanced steady state free precession (bSSFP) cine anatomical sequence with better vessel/blood delineation was used to quantify the area A(t) during the entire cardiac cycle. The 2 sequences measuring blood flow and distension were spatially and temporally synchronized, using the same imaging dimensions with retrospective cardiac gating, which generated the same number of cardiac images per heartbeat. The images were acquired during breath hold, with a slice perpendicular to the pulmonary trunk at approximately 2 cm from the pulmonary valve.
Four-chamber and short-axis cine cardiac images were also acquired, using a retrospective cardiac gated multislice bSSFP sequence. The imaging parameters for all the sequences are detailed in the appendix, available online.
Derivation of diagnostic metrics
On the basis of the acquired MRI images of the MPA and heart, 3 sets of metrics were derived.
Twenty image data sets were selected at random from the 72 cases and segmented by 2 operators. Operator A performed the analysis twice within 1 week to assess the intraoperator variability, and operator B segmented the same data independently to assess the interoperator variability.
The parameters in the Windkessel model that best reproduced the measured relationship between the flow Q(t) and pressure p(t) (which was derived from the PA radius) 21 were determined. For the 1D model, the pressure wave was decomposed into its forward-and backward-traveling components, and the power of each component was computed. We previously showed 21 that the percentage of reflection in healthy systems is considerably lower than in diseased systems, and this phenomenon was quantified by the ratio of the backward wave power to the total wave power (Wb/Wtot).
Decision tree classifier
Ten noninvasive PH metrics of cardiopulmonary vascular function were computed or measured: (1) distal resistance Rd, (2) characteristic resistance Rc, (3) total compliance C, (4) ratio of backward to total pressure wave power Wb/Wtot, (5) relative area change, (6) RV end-diastolic volume index, (7) RV ejection fraction, (8) ventricular mass index, (9) systolic septal angle, and (10) RV mass index. A random forest classification algorithm 25 in MATLAB (R2014a; MathWorks) was used to assign a diagnosis of PH or no PH for each subject. Machine learning algorithms such as this—including neural networks, support vector machines, classification, and regression trees—are frequently used in the artificial intelligence domain and are increasingly applied to medical applications.26–29 The random forest classification method is a supervised learning algorithm that requires 2 sets of variables: a training set, where the classification is known, and a validation set, in which the classification is determined by the algorithm. Although a validation set would be ideal to test the classifier's performance, the often scarce clinical data require most efficient usage. Tools such as k-fold cross validation (CV), leave-one-out cross validation (LOOCV), 30 and bootstrap were proposed 31 for estimating the classifier's prediction error when there are insufficient data. The LOOCV scheme maximizes the data usage and is almost unbiased. The reduced bias comes, however, at the expense of a larger variation, which affects the prediction error. On a larger sample size, the k-fold CV better balances the bias-variance trade-off than LOOCV and bootstrap, having a misclassification error closer to the expected prediction error. On the other hand, although on reduced sample size the bootstrap scheme has a smaller variance than LOOCV (because of its randomness), it has a larger bias. Therefore, the choice of method very much depends on the desired application. The random forest has an inherent lower bias and variance. Randomness is added in each tree for both data and variable selection. As a consequence of the small sample size and the nature of the selected classier, an LOOCV scheme was employed here for testing the misclassification error.
In order to test the diagnostic power added by coupling computation- and image-derived metrics, first the individual parameter accuracy was tested. The improvement in the algorithm accuracy was then tested by the sequential addition of image-derived parameters to the computational model indices. It is recognized that several of the proposed measures are not truly independent since they are describing aspects of the same phenomena; nevertheless, each contributes to the overall strength of the diagnostic process.
Receiver operator characteristic (ROC) curves were drawn for each parameter, and the area under the curve (AUC) was computed. For each parameter, the sensitivity, specificity, and misclassification error were computed in a data-driven manner; 32 the threshold value that maximized the Youden index was chosen. 33 The parameters with AUC > 0.8 were selected for inclusion in the classification algorithm. The workflow employed for the noninvasive diagnosis method is displayed in Figure 1.
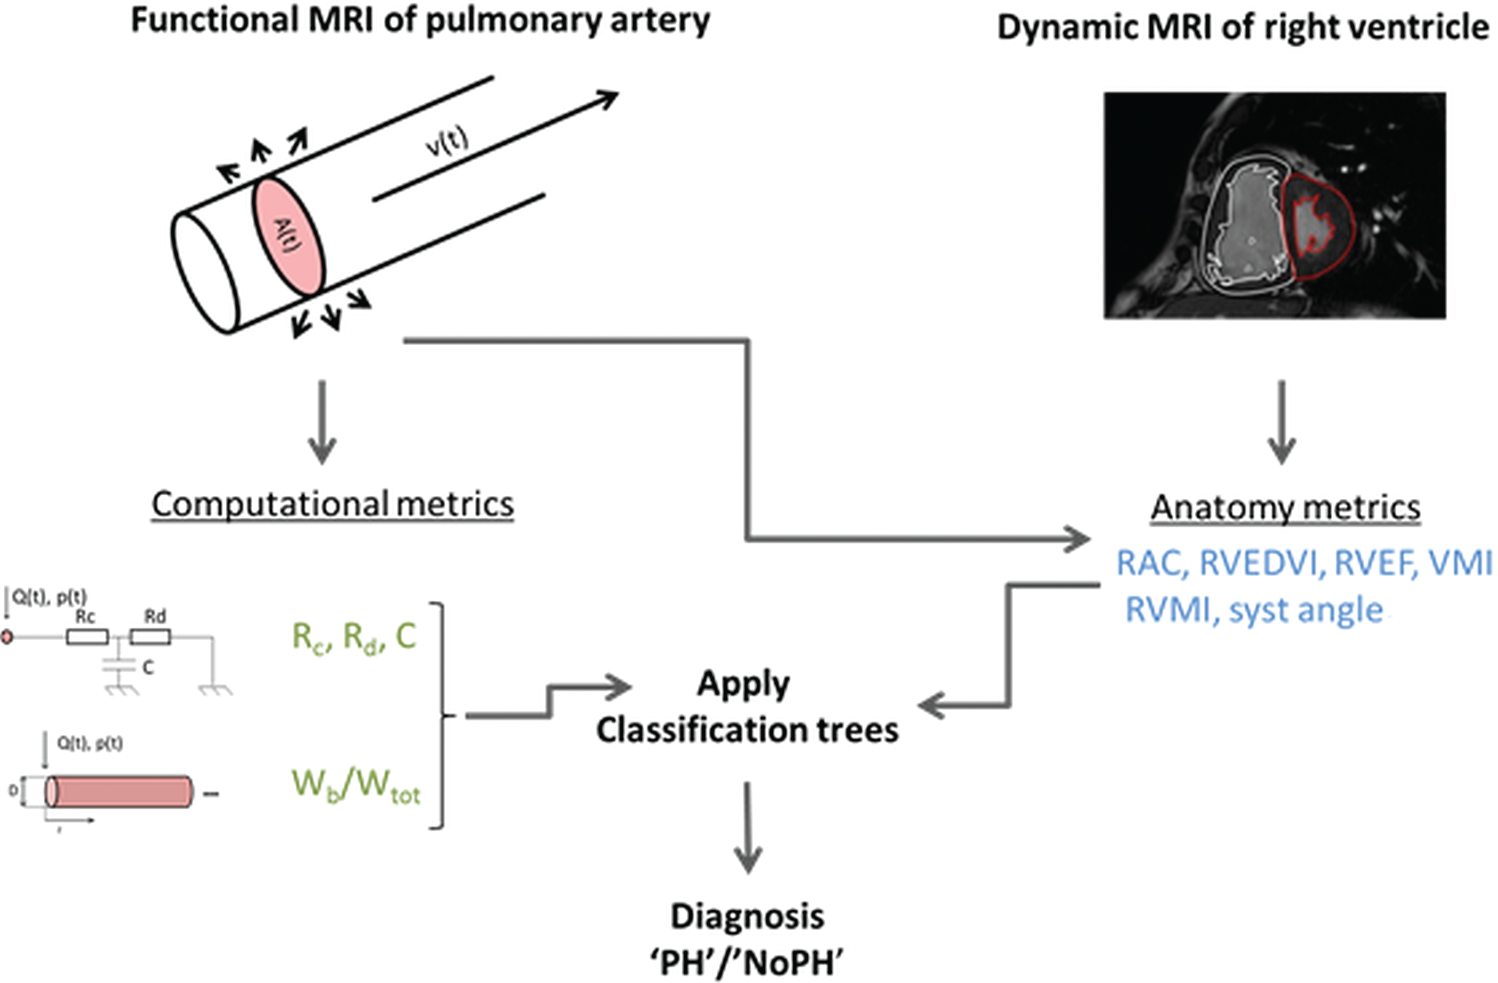
Descriptive diagram of the noninvasive pulmonary workflow. From synchronized flow (phase contrast) and anatomy (balanced steady state free precession) images of the main pulmonary artery (MPA) over the cardiac cycle, the area A(t) and flow Q(t) were derived. A zero-dimensional model (Windkessel) and a one-dimensional model were solved, using the latter as input, and computational metrics were computed: Rc: characteristic resistance; Rd: distal resistance; C: total pulmonary compliance; Wb/Wtot: contribution of the backward reflected wave to the total pressure wave. The anatomy metrics were calculated from main pulmonary artery and cardiac images alone: RAC: relative area change; RVEDVI: right ventricle end-diastolic volume index; RVEF: right ventricle ejection fraction; VMI: ventricular mass index; RVMI: right ventricle mass index; syst angle: systolic angle. A random forest classification algorithm was applied, including all the metrics as well as their in-turn addition, and a no–pulmonary hypertension (PH)/PH diagnosis was attributed to each subject.
Statistics
IBM SPSS 20 (SPSS, Chicago) was used for the statistical analysis and MATLAB (R2014a; MathWorks) and GraphPad Prism 6.0 (San Diego, CA) for data presentation. To evaluate the statistical differences between samples, all the variables were tested first for normality within each group by visual inspection of the histogram, confirmed by the Shapiro-Wilk test. The normality test was found to be significant (P < 0.05) for all the parameters in at least 1 of the groups, and the statistical significance between the 2 independent groups was tested using a nonparametric Mann-Whitney test. The results of the test were considered statistically significant for P < 0.05 and are displayed in Table 1, together with the median, interquartile range, mean, and standard deviation from the mean.
Patients demographics, right heart catheterization (RHC) data, and mathematical model–image-derived parameters
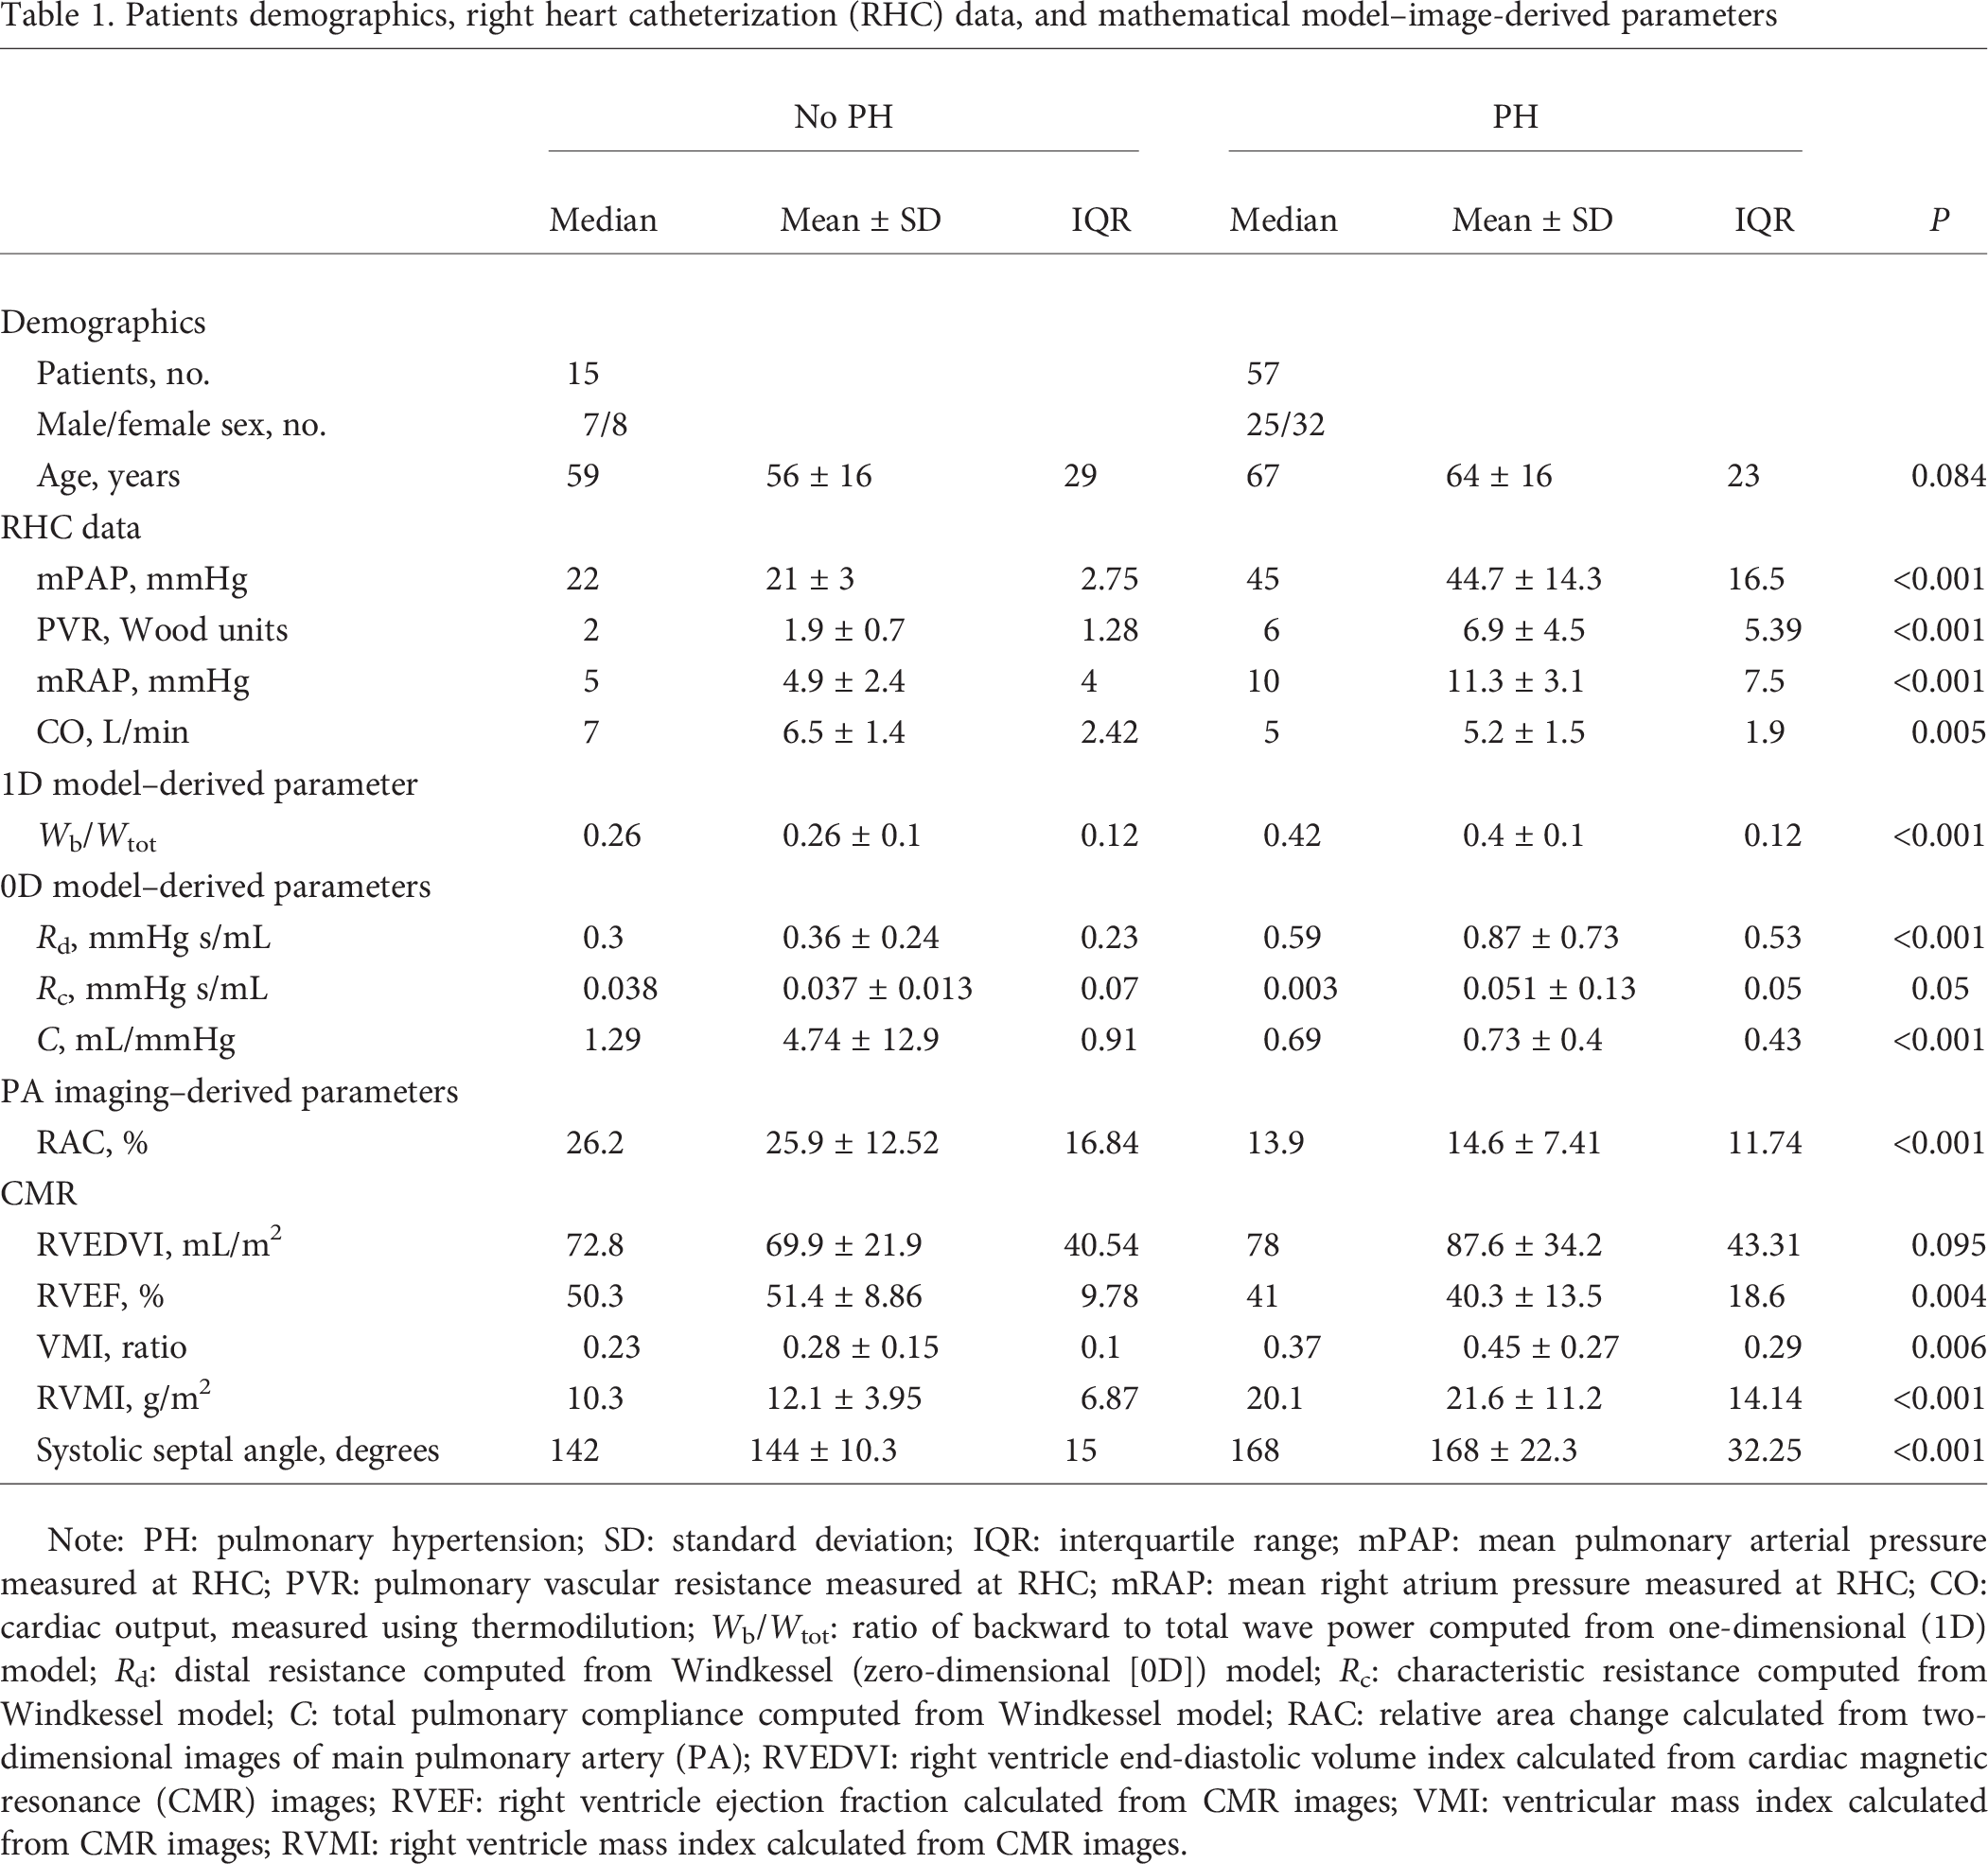
Note: PH: pulmonary hypertension; SD: standard deviation; IQR: interquartile range; mPAP: mean pulmonary arterial pressure measured at RHC; PVR: pulmonary vascular resistance measured at RHC; mRAP: mean right atrium pressure measured at RHC; CO: cardiac output, measured using thermodilution; Wb/Wtot: ratio of backward to total wave power computed from one-dimensional (1D) model; Rd: distal resistance computed from Windkessel (zero-dimensional [0D]) model; Rc: characteristic resistance computed from Windkessel model; C: total pulmonary compliance computed from Windkessel model; RAC: relative area change calculated from two-dimensional images of main pulmonary artery (PA); RVEDVI: right ventricle end-diastolic volume index calculated from cardiac magnetic resonance (CMR) images; RVEF: right ventricle ejection fraction calculated from CMR images; VMI: ventricular mass index calculated from CMR images; RVMI: right ventricle mass index calculated from CMR images.
The accuracy of the proposed diagnostic metrics was evaluated using the AUC of the ROC curve, sensitivity specificity, and misclassification error. The inter- and intraoperator variabilities for the metrics that depend on the MPA segmentation (Wb/Wtot, Rd, C, and relative area change) were tested for consistency and absolute agreement, using intraclass correlation coefficients with a 2-way mixed model and Bland-Altman analysis (for Bland-Altman graphs, bias, and limits of agreement, see the appendix).
RESULTS
Patient characteristics
Of 75 patients, 3 had MRIs that were not of sufficient quality to allow detailed analysis, leaving 72 patients in the final study cohort. The patient demographics, RHC measurements, and image-derived parameters are presented in Table 1. Statistical significance (P < 0.05) was found between the no-PH and PH groups for all image-derived parameters, with the exception of RV end-diastolic volume index (P = 0.095) and Rc (P = 0.05).
Computational models
Figure 2 illustrates the decomposition of the pressure waves for a no-PH and a PH patient into their backward- and forward-traveling components. On average, the power of the backward wave contributed 26% to the total wave power in the no-PH group and 40% in the PH group.
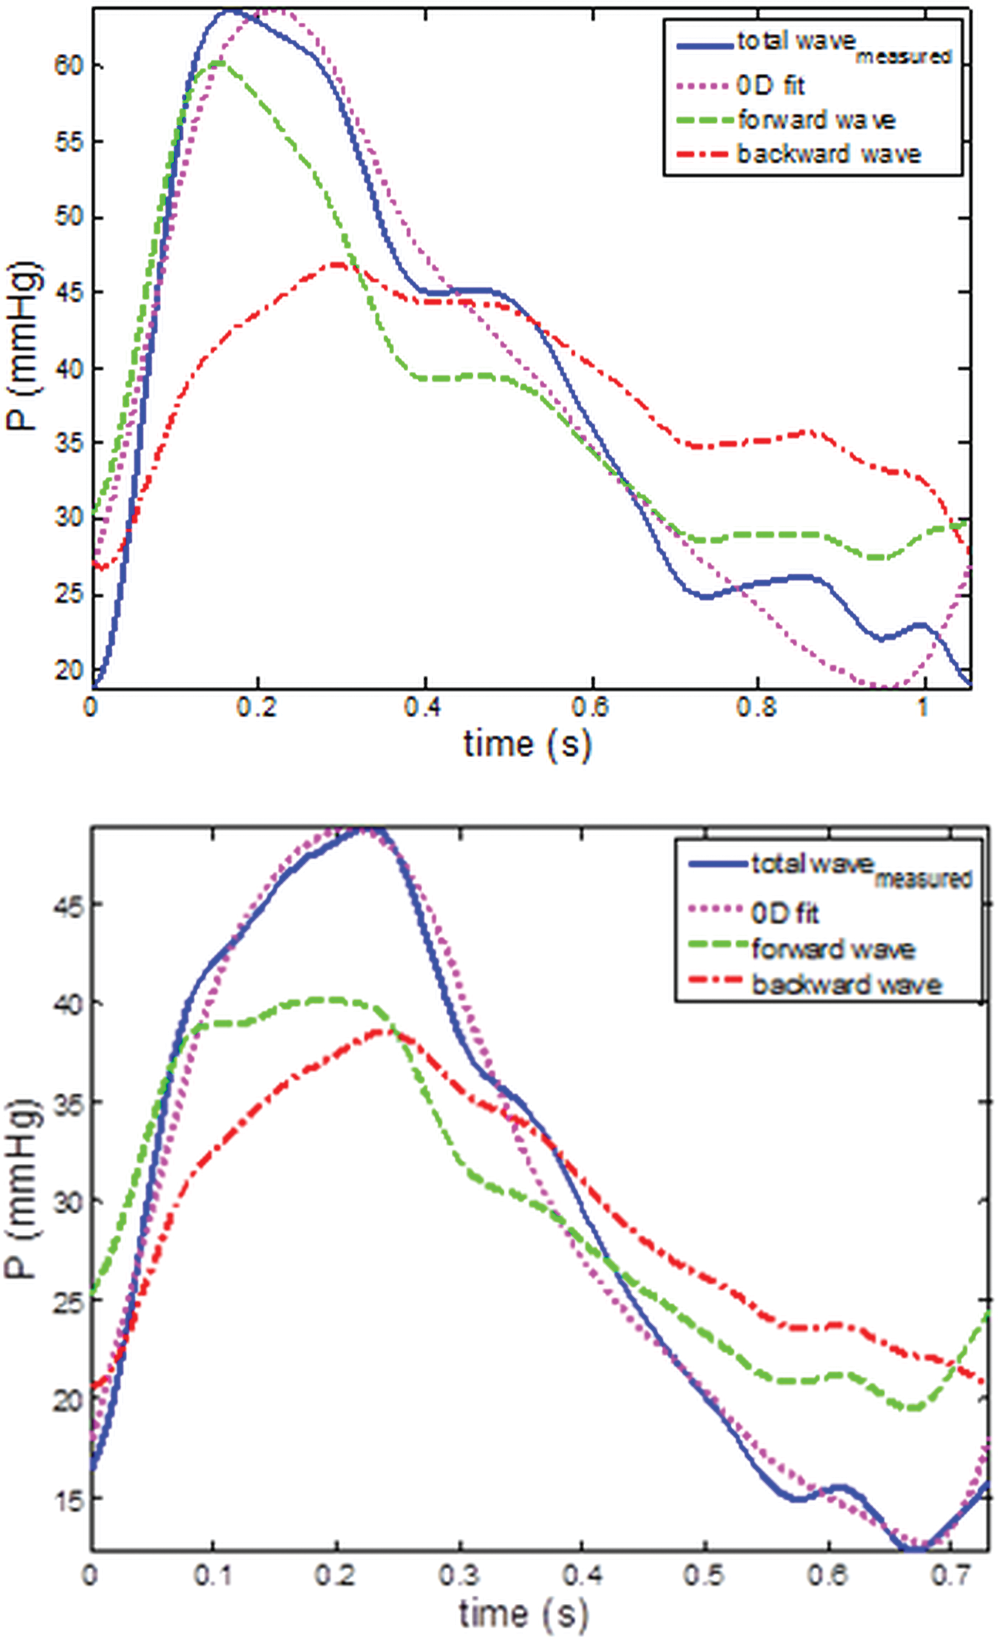
Total (blue lines) pressure wave decomposition into forward (green lines) and backward (red lines) components for a no–pulmonary hypertension (PH; top) and a PH patient (bottom), obtained from applying the one-dimensional model. Total fitted pressure wave returned by the zero-dimensional (0D) model (magenta lines) for the same patients. The proportion of the backward wave component to the total wave is higher for the PH patient than for the no-PH patient. Good fit (root mean square = 0.08 and 0.04) is returned by the 0D model in both examples.
In most of the cases (85%), the optimization algorithm returned parameters that produced a good fit to the data (see, e.g., Fig. 2, with normalized root mean square errors in the range of 0.03–0.15). However, there were a few cases for which the fit was poorer, with root mean square error up to 0.35. While Rd was less influenced by the higher root mean square, Rc and C showed a greater degree of variability. In particular, the mean value of C for the no-PH group was strongly affected by 1 outlier. Elimination of the outlier brought the mean value for the group to 1.4 ± 0.7, with a confidence interval (CI) of 0.98–1.84.
Operator variability
The intra- and interoperator variability was performed twice by operator A and once by operator B. The 2 measurements of operator A were compared independently with the results for operator B. Overall, the values of MPA area-dependent metrics showed high reproducibility, evaluated using intraclass correlation coefficients. Relative area change and Wb/Wtot are the parameters with the tighter limits of agreement for both intra- and interoperator tests. Detailed results on intraclass correlation coefficients and Bland-Altman analysis are included in the appendix.
Data-driven individual accuracies
Individual accuracies—quantified in terms of AUC, misclassification error, sensitivity, and specificity for each of the proposed diagnostic parameters—are displayed in Table 2. The ratio of the wave power, Wb/Wtot, showed the highest individual AUC, whereas the RV end-diastolic volume index and the characteristic resistance Rc performed the worst. The poor performance of the latter 2 metrics was also indicated by the significance test.
Noninvasive metrics' individual accuracies evaluated for a cutoff value corresponding to maximum Youden index
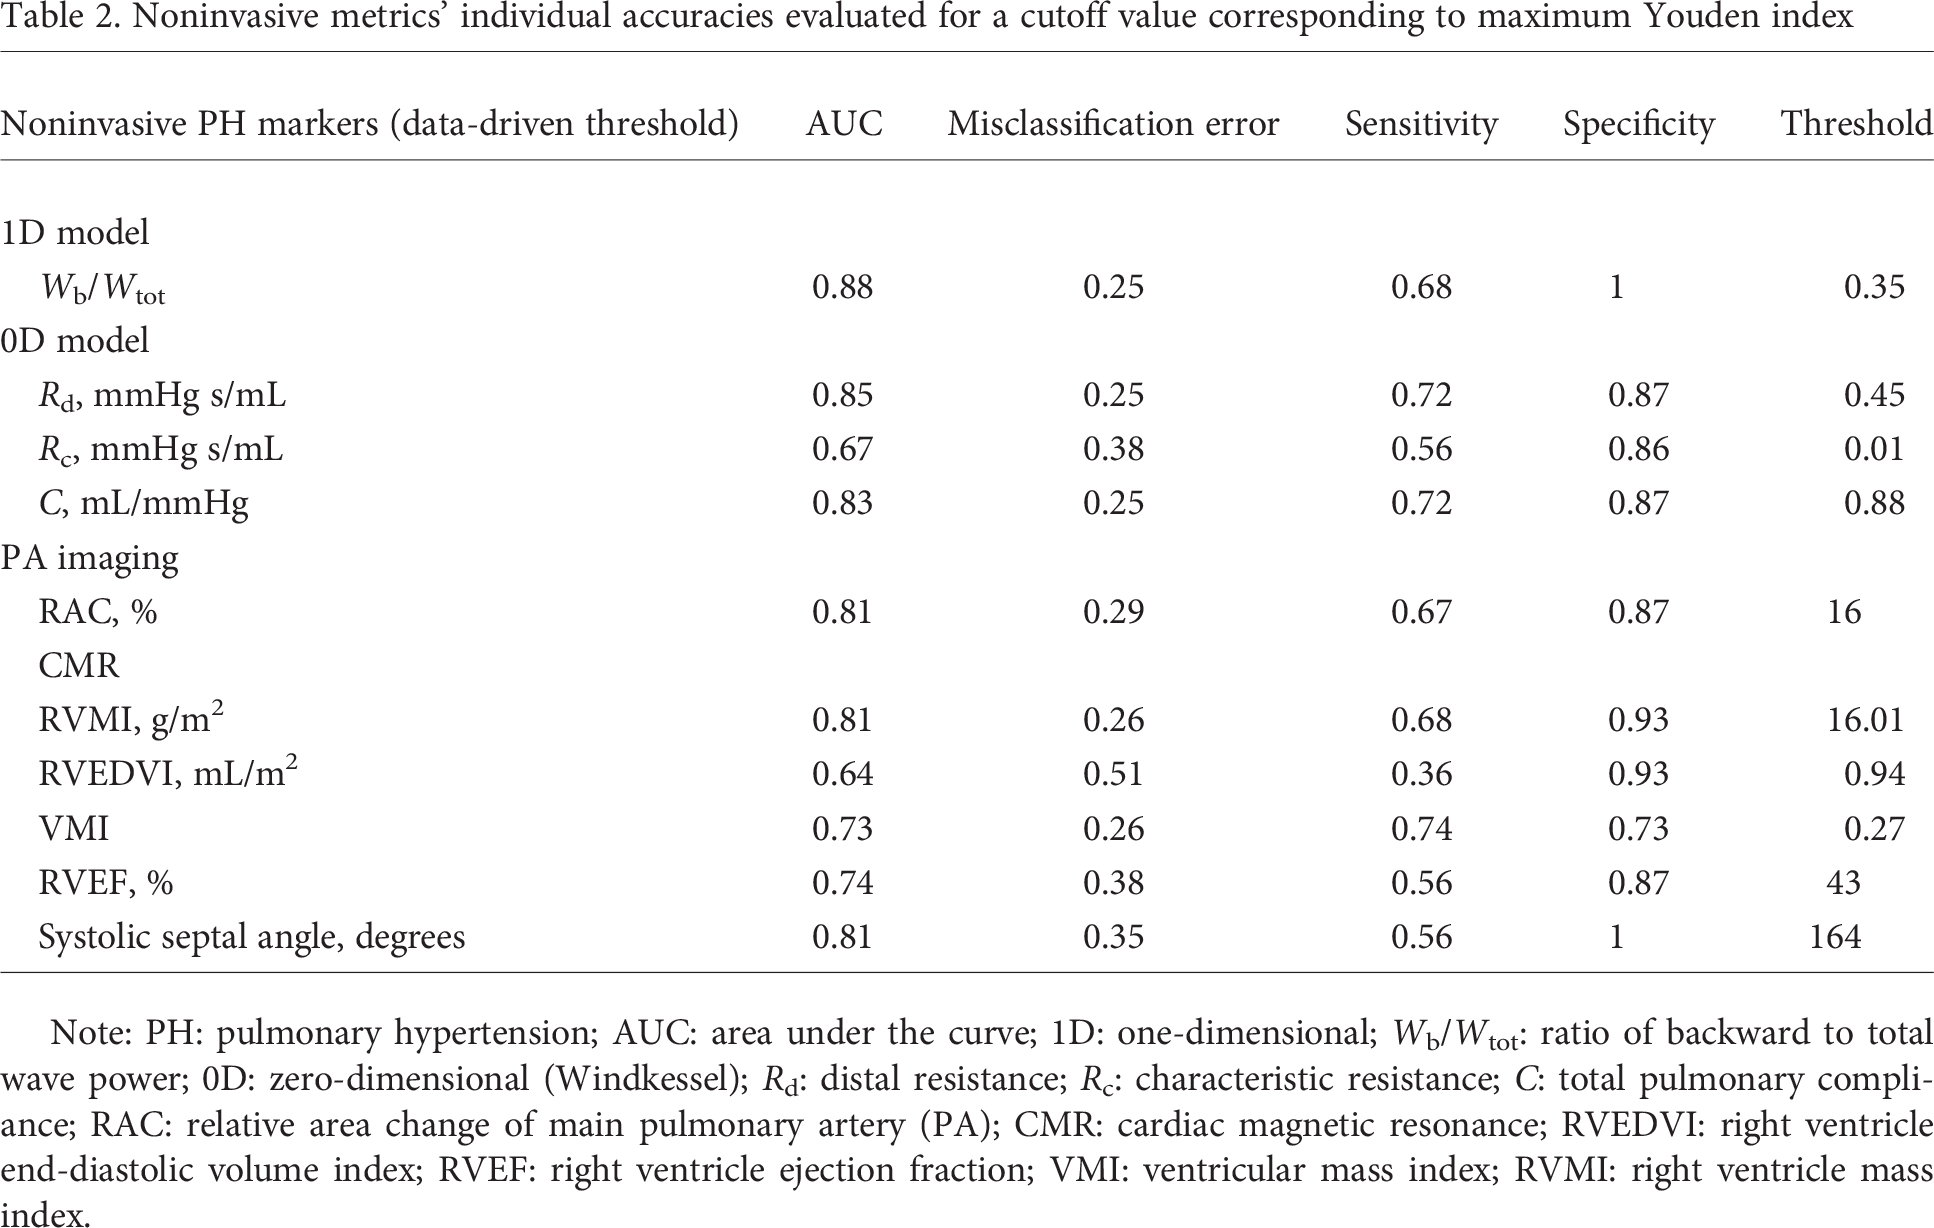
Note: PH: pulmonary hypertension; AUC: area under the curve; 1D: one-dimensional; Wb/Wtot: ratio of backward to total wave power; 0D: zero-dimensional (Windkessel); Rd: distal resistance; Rc: characteristic resistance; C: total pulmonary compliance; RAC: relative area change of main pulmonary artery (PA); CMR: cardiac magnetic resonance; RVEDVI: right ventricle end-diastolic volume index; RVEF: right ventricle ejection fraction; VMI: ventricular mass index; RVMI: right ventricle mass index.
On the basis of the chosen criterion (Youden index maximization) to find the optimal threshold value that maximizes sensitivity and specificity, the best accuracy was returned by the relative area change parameter, which at a threshold of 16% correctly classified 79% of cases. With a threshold value of 0.35, the ratio of the wave power correctly classified all the no-PH cases (100% specificity) and 68% of the PH cases, with a misclassification error of 25%.
The parameters with an AUC higher than 0.8 were selected for inclusion in the decision-making algorithm to test the additional diagnostic power resulting from the combination of physiological and anatomical metrics. The results of Table 2 are confirmed graphically by the ROC curves, illustrated in Figure 3 (top) for the metrics selected for the classification model.
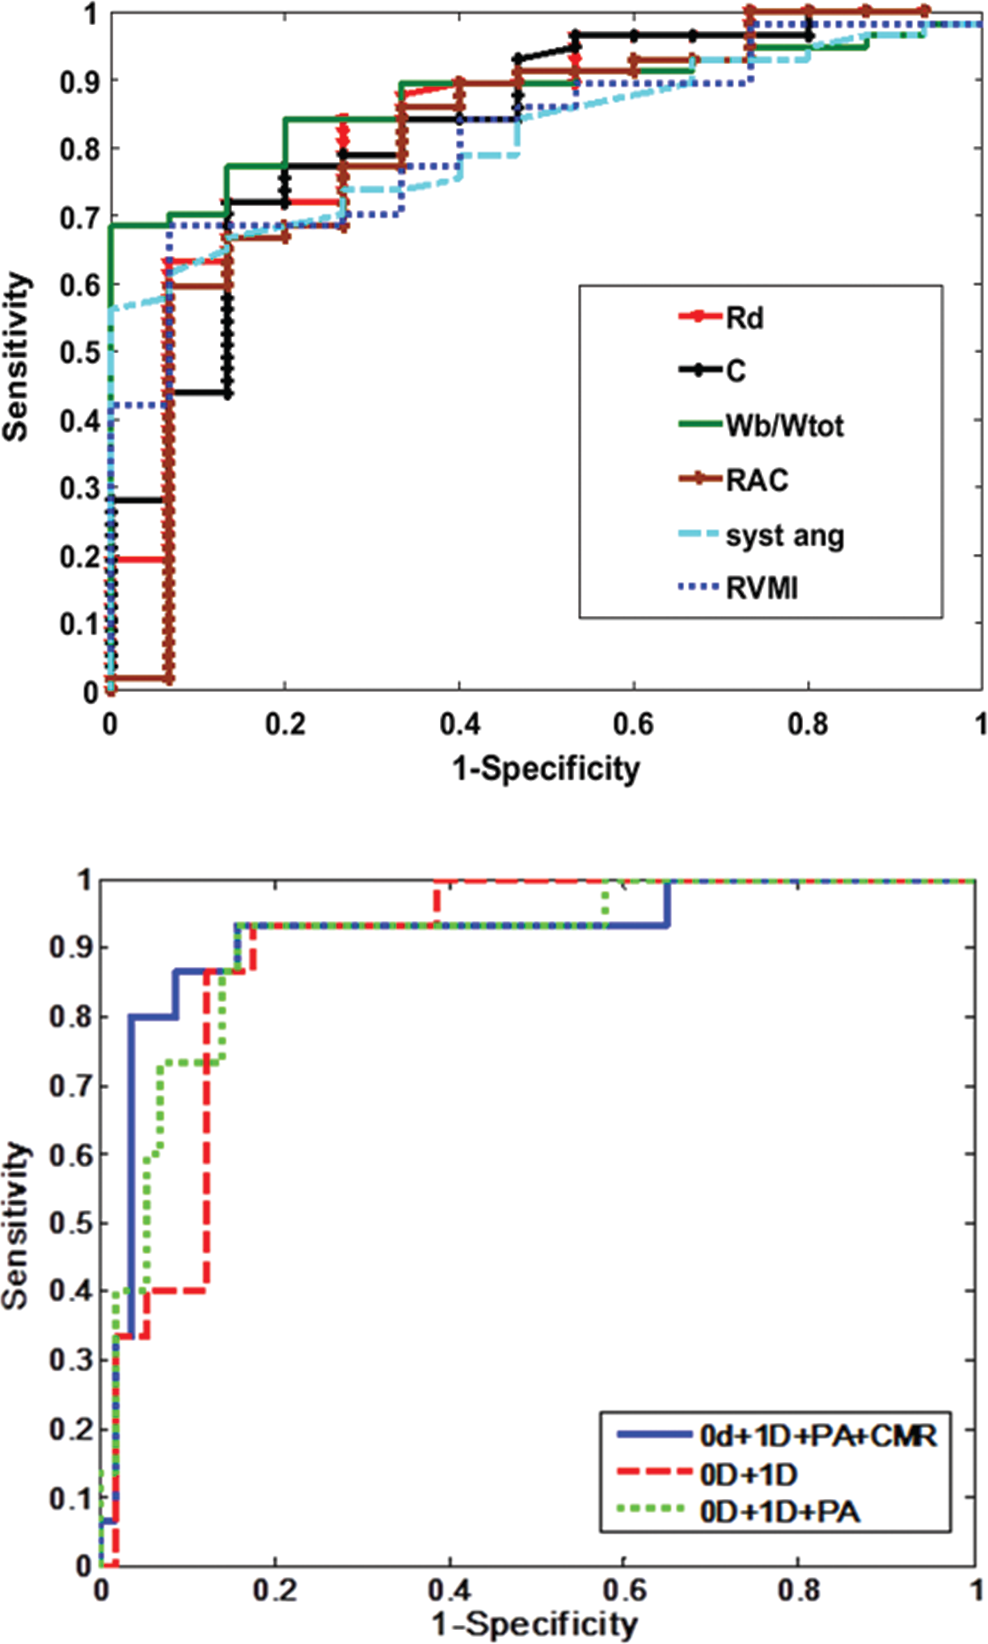
Top, receiver operator characteristic (ROC) curves corresponding to the parameters with area under the curve (AUC) > 0.8. Bottom, ROC curves for the random forest classification models. Top, 6 out of the 10 proposed computational and anatomy metrics had AUC > 0.8. Zero-dimensional (0D): Rd: distal resistance (red line), AUC = 0.85; C: pulmonary vascular compliance (black line), AUC = 0.83. One-dimensional (1D): Wb/Wtot: ratio of backward to total wave power (green line), AUC = 0.88; RAC: main pulmonary artery (PA) relative area change (brown line), AUC = 0.81; CMR: cardiac magnetic resonance imaging; syst ang: systolic septal angle (light blue line), AUC = 0.81; RVMI: right ventricle mass index (dark blue line), AUC = 0.81. Bottom, in-turn addition of the metrics improved the AUC. 0D and 1D metrics (red line), AUC = 0.89; 0D, 1D, and PA (green line), AUC = 0.9; all 6 parameters, 0D, 1D, PA, and CMR (blue line), AUC = 0.91.
The results of the random forest classification algorithm, validated using the LOOCV method, are displayed numerically in Table 3 and graphically in the ROC curves in Figure 3 (bottom). Combining the 0D model parameters (Rd and C) with the 1D model parameter (Wb/Wtot) correctly classified 79% of subjects with an AUC of 0.89. Sensitivity, specificity, and classification accuracy improved considerably when the anatomical parameters were added to the classification model. The addition of relative area change reduced the misclassification error to 13%, increasing both sensitivity and specificity. Combining all of the noninvasive PH metrics correctly classified 66 out of 72 patients (92%), with a high sensitivity of 97% (95% CI: 87.89%–99.57%) and a good specificity of 73% (95% CI: 44.90%–92.21%). The corresponding positive and negative predicted values are 93.22% (95% CI: 83.54%–98.12%) and 84.62% (95% CI: 54.55%–98.08%), respectively. Figure 4 displays all the individual patients against their mPAP measured at RHC, following the classification performed by our best model.
Classification accuracies for the coupled pulmonary hypertension metrics models
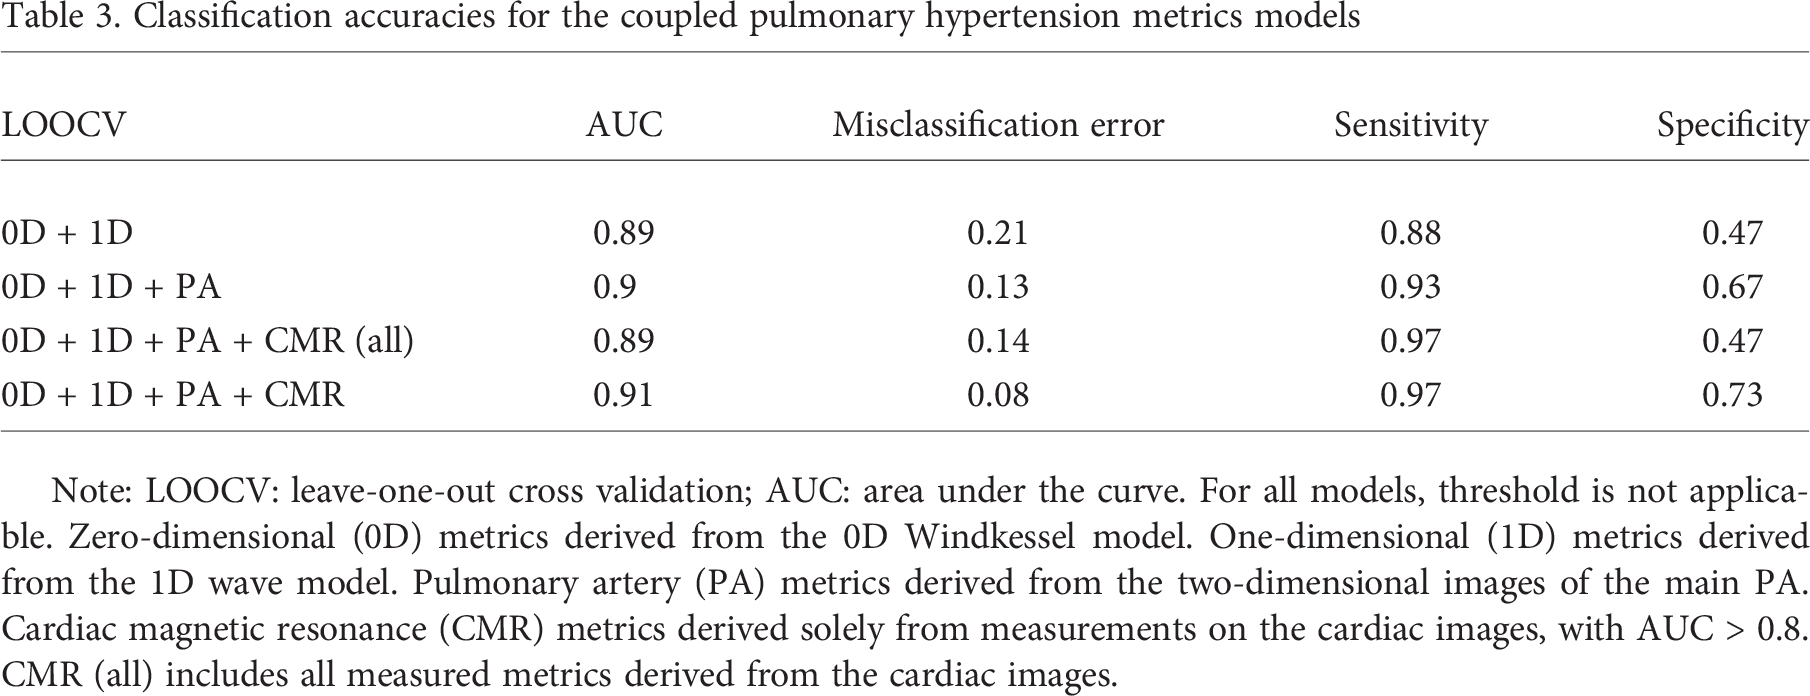
Note: LOOCV: leave-one-out cross validation; AUC: area under the curve. For all models, threshold is not applicable. Zero-dimensional (0D) metrics derived from the 0D Windkessel model. One-dimensional (1D) metrics derived from the 1D wave model. Pulmonary artery (PA) metrics derived from the two-dimensional images of the main PA. Cardiac magnetic resonance (CMR) metrics derived solely from measurements on the cardiac images, with AUC > 0.8. CMR (all) includes all measured metrics derived from the cardiac images.
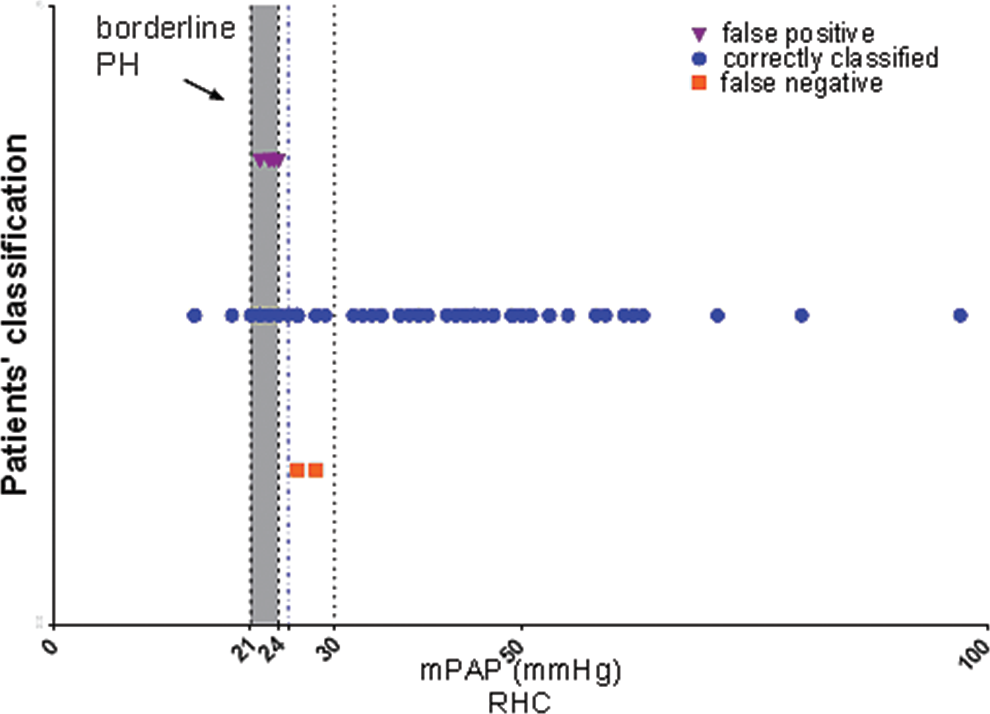
Patients' classification returned by our best model, leave-one-out cross validation. Six out of the 72 patients were misclassified by the model: 2 false negative (squares), where patients had a mean pulmonary arterial pressure (mPAP) of >25 mmHg and were identified by the model as not having pulmonary hypertension (PH), and 4 false positive (triangles), where patients had an mPAP of <25 mmHg and had been identified by the model as having PH. The mPAPs of all misclassified patients were close to the 25-mmHg threshold.
DISCUSSION
We have demonstrated with MRI that combining computation-derived metrics—which reflect hemodynamic changes in the pulmonary vasculature—with additional MRI measures of RV morphology and function into a decision support algorithm provides a method to noninvasively diagnose PH with high accuracy (92%), without the need for RHC. Moreover, none of the patients misclassified as not having PH received a diagnosis of PAH.
The noninvasive computation-derived parameters Wb/Wtot, Rd, and C had the highest individual AUC, confirming the diagnostic potential showed by these metrics in our previous work. 21 More importantly, combining these computation-derived metrics with measurement of RV morphology and function into a decision support algorithm provides a method to noninvasively distinguish between no-PH and PH patients with high accuracy (92%).
All 3 computational metrics included in the decision process had the same misclassification error (0.25), when a threshold that maximizes the Youden index was chosen. The parameter Wb/Wtot performed better than the 0D parameters in terms of inter- and intraoperator variability, limits of agreement, CIs, and SD.
While in principle a 0D (Windkessel family) model presents a simple overall characterization of the pulmonary vascular system, the determination of the parameters represents more of a challenge. The optimization process applied to estimate Rd, Rc, and C returned a good fit in most of the cases, but there were situations when the performance was poorer (root mean square: 0.2–0.3). These outliers degrade the overall performance of these measures. Nevertheless, the combination of 1D- and 0D-derived metrics using the random forest classification algorithm improves the AUC and classification accuracy by 4%.
Pulmonary arterial relative area change also showed relatively good individual performance as a single diagnostic measure. Maximum sensitivity and specificity, according to our data-driven criteria, were obtained at a threshold of 16%. The same threshold, using measurements performed in the right pulmonary artery, has been suggested as a mortality predictor, 9 whereas other authors5,6 indicated 15% and 24%, respectively, as diagnosis thresholds for relative area change, on the basis of measurements in the MPA.
Previous studies7,8,34,35 using quantitative MRI-derived parameters have shown promise in the assessment of PH. However, our results showed poorer performance for the RV end-diastolic volume index and ventricular mass index as markers of PH. This might be explained by the challenging nature of our cohort: 30% of subjects had an mPAP close to the borderline threshold of 25 mmHg. RV remodeling occurs secondary to changes in the pulmonary vasculature, suggesting that for the borderline cases, the RV image-derived parameters might have less diagnostic power for mild elevation of pulmonary artery pressure than measurements reflecting more subtle changes in vascular pathophysiology. In particular, remodeling in the distal pulmonary vasculature or any system disturbance leading to an impedance mismatch will lead to higher wave reflections, 21 which are detected by the 0D-1D computational models.
The decision to include metrics with high diagnostic value in the classification algorithm defined by AUC was confirmed by the final results. An improvement in the classification accuracy was demonstrated as more diagnostic metrics were added (from using just 0D + 1D to then adding the MPA and cardiac MRI metrics), suggesting that the more the model knows about the features defining a certain individual, the more confident the final classification will be. However, not just the quantity but also the quality of the input data is important: the use of metrics preselected for significance (AUC > 0.8) produced 5% better accuracy than the use of all of the proposed metrics.
For all the proposed combinations of metrics, the random forest model performed better than the individual parameters in terms of misclassification error and AUC. The best classification model, which combined the most comprehensive set of preselected diagnostic metrics, had an AUC of 0.91, high sensitivity (97%), and fair specificity (73%). The model incorrectly classified 6 out of 72 patients: no PH (false negative) was diagnosed in 2 PH subjects (mPAP ≥ 25 mmHg), and PH (false positive) was diagnosed in 4 no-PH subjects (mPAP < 25 mmHg). As discussed above, several of the patients were close to the diagnosis threshold, using the gold standard RHC, and we investigated whether those who were classified incorrectly by our algorithm were close to the threshold. Table 4 shows the misclassified patients' demographics and hemodynamics. One of the false negatives had an mPAP of 28 mmHg, and the other had an mPAP of 26 mmHg; both were very close to the PH threshold, and both had normal PVRs of 1.3 and 2.7 Wood units, respectively. Both of the PH patients misclassified by the model as not having the condition were in group 3 PH (PH owing to lung disease/hypoxia), and neither of them had underlying PAH. All 4 of the false-positive subjects had mPAPs between 22 and 24 mmHg and PVRs ranging from 2.04 to 2.7 Wood units, with diagnoses of mixed aortic valve disease, chronic thromboembolic disease, sinus venous atrial septal defect with partial anomalous venous drainage, and partial anomalous pulmonary venous drainage. Previous research has found the mPAP of healthy volunteers to be 14 ± 3.3 mmHg, and patients with an mPAP between 21 and 24 mmHg are considered borderline PH. 23 Thus, the final result is that all of the 6 cases that were misclassified were in the region of clinical uncertainty. Machine learning algorithms are well documented in the literature, and clinical applications were previously proposed.26–29 We have shown that a high-accuracy noninvasive PH diagnosis can be achieved by maximizing the use of MRI, by integrating already developed noninvasive PH metrics—derived by the means of different MRI measurements and computational models—into random forest classifiers.
Misclassified patients' demographics and hemodynamics
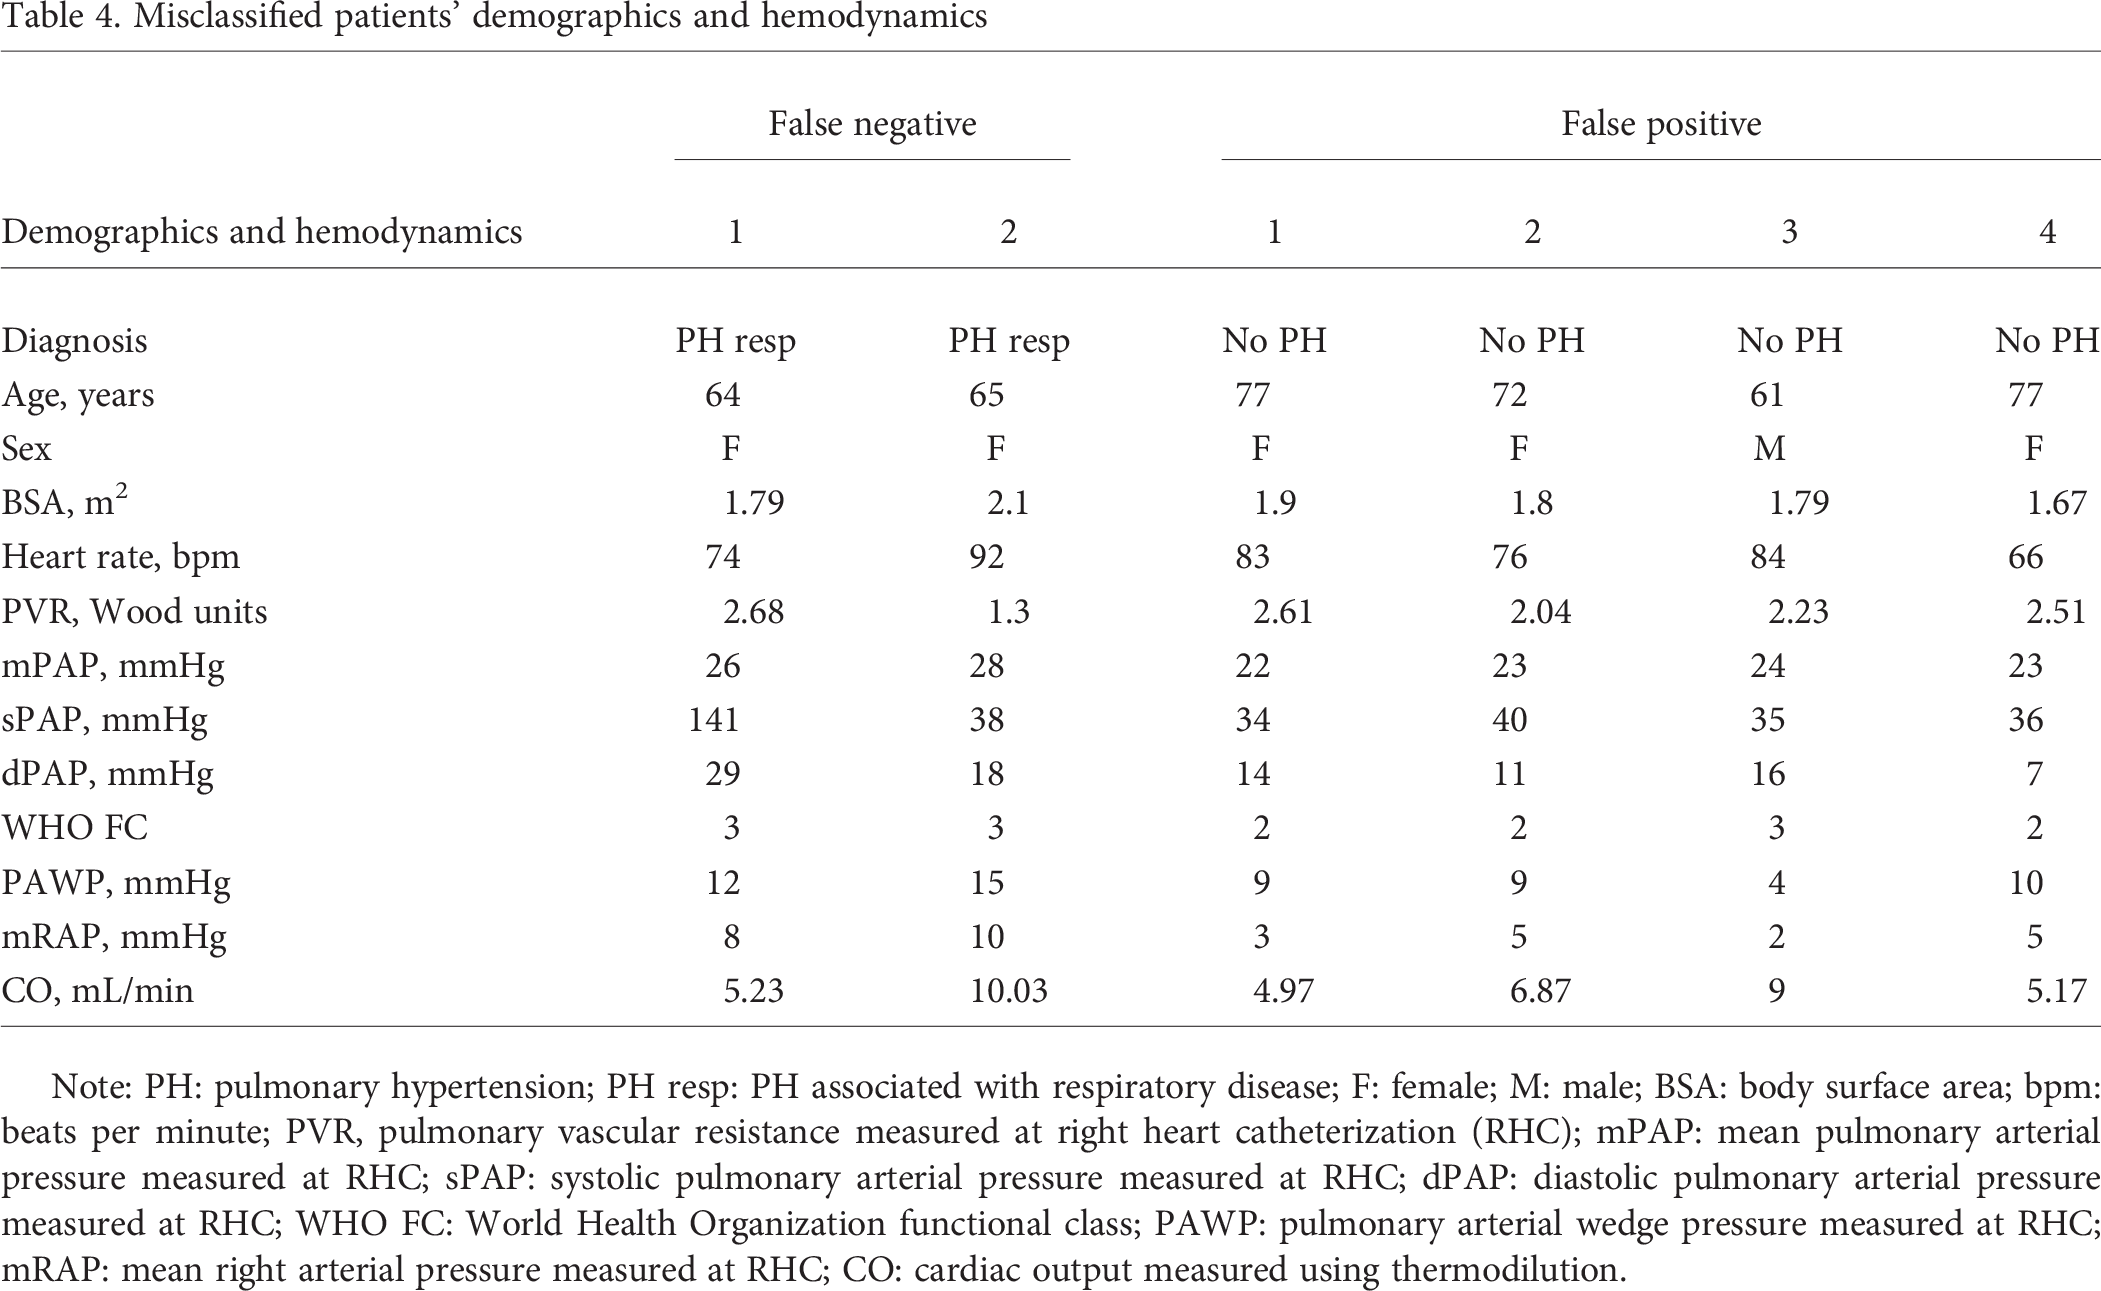
Note: PH: pulmonary hypertension; PH resp: PH associated with respiratory disease; F: female; M: male; BSA: body surface area; bpm: beats per minute; PVR, pulmonary vascular resistance measured at right heart catheterization (RHC); mPAP: mean pulmonary arterial pressure measured at RHC; sPAP: systolic pulmonary arterial pressure measured at RHC; dPAP: diastolic pulmonary arterial pressure measured at RHC; WHO FC: World Health Organization functional class; PAWP: pulmonary arterial wedge pressure measured at RHC; mRAP: mean right arterial pressure measured at RHC; CO: cardiac output measured using thermodilution.
Limitations
The main limitations of this single-center, retrospective study are the relatively small sample size of the analyzed cohort and the imbalance between the low- and high-risk individuals, although it is representative of patients referred to a PH referral center, where such techniques could be employed to avoid cardiac catheterization. Further work to prospectively validate the results of this study in other centers would be desirable.
Conclusions
Our findings confirm the potential of wave reflection quantification from functional MRI of the pulmonary artery and RV in the assessment of PH. The ratio of the backward to total wave power, Wb/Wtot, is an effective stand-alone marker and also has high importance in the combined classification model.
Combining computational metrics with the ones derived directly from MRI offered a strong PH classifier, on the basis of MRI input measurements only. The PH classification model accurately classified 92% of the patients, with a misclassification error of 8%, justified by the difficult borderline cases. The high diagnostic accuracy of this approach may reduce the need for RHC in patients with suspected PH.
Footnotes
ACKNOWLEDGMENTS
The authors acknowledge the technical support of Akshay Kumar (University of Sheffield) in the image segmentation process.