
Abstract
Abnormal serotonergic function has long been postulated to contribute to the pathological processes of schizophrenia [1] and bipolar disorder [2]. What remains to be identified are the mechanisms by which changes in serotonergic function can induce the symptoms of such serious psychiatric disorders. Importantly, the capacity to investigate such mechanisms is growing with increasing knowledge of what constitutes serotonin-regulated pathways. Of particular interest are data linking the activity of serotonin-mediated pathways to the regulation of cell proliferation and death [3]. Critical to serotonergic control of cell proliferation or death is the protein S100β, a protein that is released by astrocytes under the regulation of serotonin via the serotonin 1A receptor [4], which at high levels stimulates apoptotic processes but at low levels increases cell survival [5]. Clearly, a derangement in S100β levels because of altered serotonergic function in the CNS of subjects with schizophrenia and bipolar disorder could lead to some of the symptoms associated with the disorders.
The hypothesis that changes in S100β may have a role in the pathologies of schizophrenia, and bipolar disorder has gained support from studies using peripheral tissue. The most relevant of these studies, in relation to CNS function, is the reported increase in S100β in the CSF from medication-free subjects with schizophrenia [6]. In addition, three studies have reported increased levels of S100β in the blood from medication-free subjects with schizophrenia [7–9]. One of these studies has showed that levels of blood S100β remained high up to 24 weeks after the commencement of treatment with antipsychotic drugs and that blood levels of S100β directly related to levels of negative symptomatology [9]. Another study reported that blood S100β was not altered in non-medicated subjects with schizophrenia, was significantly high in subjects with schizophrenia that had been treated with antipsychotic drugs for 3 weeks and that blood S100 β was higher in subjects with deficit compared with nondeficit forms of the disorder [10]. Finally, a single study reported low levels of S100β in blood from subjects with schizophrenia, independent of clinical variables or treatment status [11]. These results, plus the data showing that a S100β gene haplotype is associated with schizophrenia [12], strengthens the hypothesis that S100β may be involved in the pathology of schizophrenia. Data are less plentiful with regards to mood disorders but levels of blood S100β have been reported to be increased in bipolar disorder [13] and during mania [14], supporting the need for further study of this protein in bipolar disorder.
Studies using peripheral tissue can inform on possible biochemical abnormalities in psychiatric disorders that extend beyond the CNS, but it is critical that data obtained from peripheral studies are validated by CNS studies. Thus, to begin such validation, we have measured cortical S100β in tissue obtained post-mortem from subjectswith schizophrenia and bipolar disorder. Furthermore, to determine if changes in S100β were associated with generalized changes in astrocytic markers, we also measured levels of glial acidic fibrillary protein (GFAP), another neuroglia-derived protein [15], in the same tissue sample. Finally, we decided to determine if changes in levels of S100β with diagnosis might be associated with diagnostic-specific changes in levels of the pro-apoptotic protein p53 [16] or the anti-apoptotic protein Bcl-2 [17]. Studies were carried out in cortical regions as there is a significant body of data to suggested abnormal cortical functioning is present in schizophrenia [18] and bipolar disorder [19].
Method
Tissue collection
Human
Approval for this study was obtained from the Ethics Committee of the Victorian Institute of Forensic Medicine and the North Western Mental Health Program Behavioural and Psychiatric Research and Ethics Committee. After gaining approval, left CNS hemispheres were obtained at autopsy from 8 subjects with a preliminary diagnosis of bipolar 1 disorder (BPD1), who were psychotic prior to death, 20 subjects with a preliminary diagnosis of schizophrenia and 20 subjects with no history of psychiatric illness (controls). The cases were closely matched for age and sex.
Once tissue was collected, an extensive case history review was done using the Diagnostic Instrument for Brain Studies [20]. Following the case history review, a consensus diagnosis was made according to DSM-IV criteria [21], duration of illness (DOI—the interval between the first hospital admission to time of death) was calculated and the last recorded psychotropic drug doses were converted to suitable drug dose equivalents [22] (Table 1). Where deathwaswitnessed, the post-mortem interval (PMI) was the time between death and autopsy. In cases where the death was not witnessed, the PMI was taken as being half of the interval between the individual last being seen alive and being found dead. Cases were only accepted where less than 5 hours elapsed between the subject last being seen alive and being found dead. For all samples, the tissue was stored frozen at −70?C within 30 min of autopsy. The agonal status of the brain tissue was assessed by measuring the pH of the tissue [23].
Demographic, pharmacological and tissue collection data relating to the subjects with schizophrenia, bipolar 1 disorder and control subjects from whom tissue was collected for the study of glial and apoptotic markers
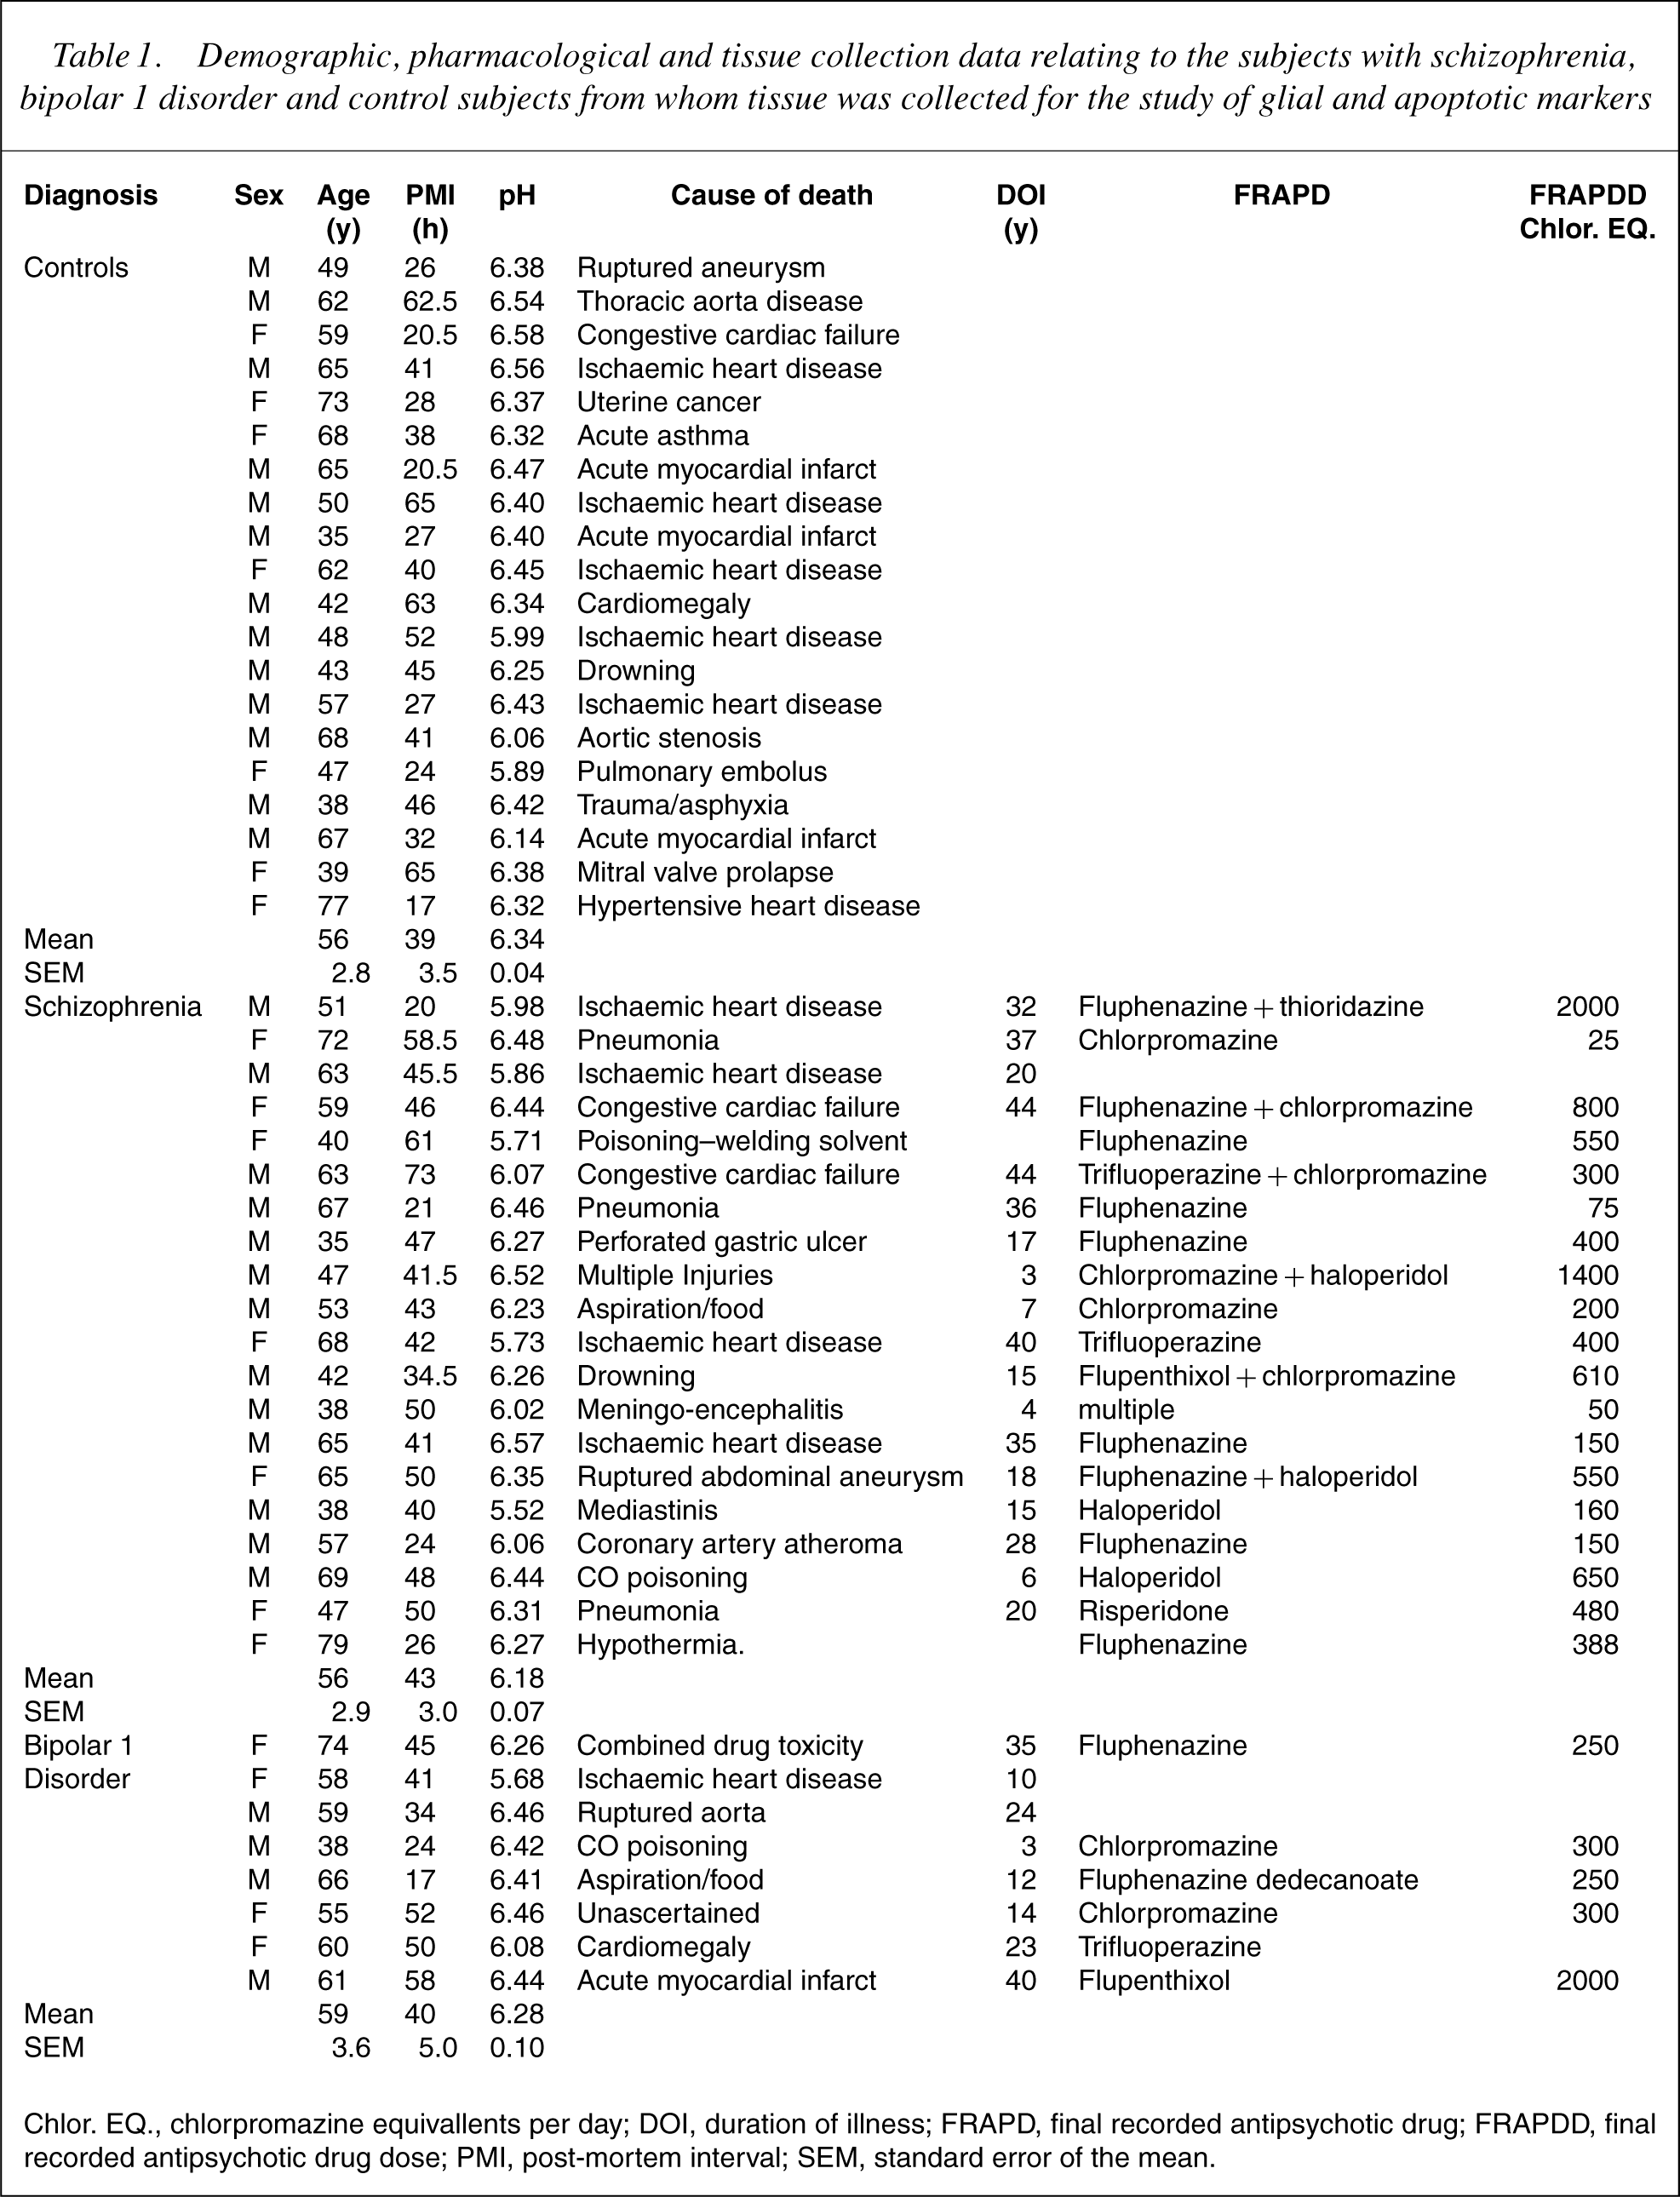
Chlor. EQ., chlorpromazine equivallents per day; DOI, duration of illness; FRAPD, final recorded antipsychotic drug; FRAPDD, final recorded antipsychotic drug dose; PMI, post-mortem interval; SEM, standard error of the mean.
Cortical regions were delineated according to Brodmann's criteria, thus Brodmann's Area (BA) 9 was taken as the lateral surface of the frontal lobe and includes the middle frontal gyrus superior to the inferior frontal sulcus; BA 10 by the most rostral portions of the superior frontal gyrus and middle frontal gyrus, bounded ventrally by the superior rostral sulcus; BA 46 as the lateral surface of the frontal lobe and includes approximately the middle third of the middle frontal gyrus and the most rostral portion of the inferior frontal gyrus and BA 40 by the lateral surface of the parietal lobe, including primarily the supramarginal gyrus surrounding the posterior segment of the lateral fissure.
Rat
After obtaining consent from the University of Melbourne Animal Experimental Ethics Committee, all drug administration procedures and experimental protocols were performed at The Mental Health Research Institute in accordance to the Australian Code of Practice for the Care and Use of Animals for Scientific Purposes (1990) set out by the National Health and Medical Research Council. Six-week-old Sprague– Dawley rats (100–150 g; n=10 per group) were treated for 1 month with either vehicle or haloperidol (0.1 mg/kg/day) in drinking water or chow that contained or did not (vehicle) contain lithium (1.8 g/kg chow: blood level of lithium at end of treatment=0.78 mmol/L). The animals were kept on a 12-hour light cycle with free access to food and water. The brains were then removed; frontal cortex was dissected and frozen in isopentane on dry ice, and stored at −70?C until required.
Protein studies (western blot analysis)
Human and rat tissue were homogenized into 10 mM Tris (pH 7.4), containing 1% sodium dodecylsulphate (SDS) and 1 mM fresh sodium orthovanadate (5% w/v) on ice, using a hand-held teflon homogenizer. The protein concentrations in the resulting homogenates were determined using the Bio-Rad DC modified Lowry protein assay adapted for the microplate. Following the determination of levels of protein in each homogenate, the homogenates were diluted in 0.5 M Tris–HCl (pH 6.8) containing 20% glycerol, 10% SDS, 10% β-mercaptoethanol and 0.05% bromophenol blue (reducing buffer) so that 20 μg protein was loaded into each well of a stacking gel (4% polyacrylamide) prior to proteins' being separated using polyacrylamide gel electrophoresis (empirically determined per cent running gel) at a constant voltage of 150 V. Separated proteins were then transferred to nitrocellulose membranes overnight in Towbin transfer buffer (25 mM Tris (pH 8.3) containing 192 mM glycine and 20% methanol) [24] at a constant current of 40 mA. All membranes were stained with 0.2% Ponceau S Red in 3% trichloroacetic acid to verify effective transfer of proteins to nitrocellulose membrane. While human tissue was probed for all proteins of interest, rat tissue was only probed for S100β, the primary protein of interest in this study.
All antibodies used in this study, although being directed against human proteins, show cross-reactivity with the rat protein homologues. As stated, the conditions under which nitrocellulose membranes were probed for S100β, GFAP, Bcl-2 and p53 were empirically determined. Thus, nitrocellulose membranes were either blocked for an hour at room temperature (RT), in 5% non-fat milk powder (NFMP) in 0.1% Tween-20 in Tris-buffered saline (TTBS) (GFAP, p53 and Bcl-2) or 5% NFMP in TTBS and 2% heat-inactivated rabbit serum (S100β). The nitrocellulose membranes were then incubated with antihuman S100 β (dilution=1:100), GFAP (1:10000), p53 (1:500) or Bcl-2 (1:1000) antibody for 2 hours at RT. Following washing, all nitrocellulose was incubated with a secondary antibody (against the appropriate primary antibody species: S100β =rabbit antigoat IgG 1:2000; others goat antirabbit IgG 1: 2000) conjugated to horseradish peroxidase for an hour at room temperature. Visualization of the antigenic reaction was by enhanced chemiluminescence (ECL) technique using either Pierce Supersignal__ West Pico chemiluminescent substrate (GFAP and S100β) or Amersham ECLTM enhanced chemiluminescent substrate (Bcl-2 and p53). For GFAP and S100β, the chemiluminescent bands were imaged using a Kodak 440CF, and the sum intensity of the antigenic bands determined using Kodak 1D software. For Bcl-2 and p53, the membranes were exposed to Amersham-ECLTM Hyperfilm, which was developed in Kodak D-19 X-ray developer and fixed with Hypam X-ray fixer. The resulting image on the X-ray film was captured and then analysed using Kodak 1D software.
To control for inter-blot variation, an internal control (IC) membrane preparation was run on two gels to establish both intra- and interblot variation for the measurement of each protein. This sample was subsequently run (in duplicate) on every gel. Gels were exposed so that the sum intensity of the IC fell within the range established by the mean±2 SD of the initial measurements. Subsequently, the results from all subjects were standardized by expressing them as a ratio of IC.
mRNA studies (real-time PCR)
For real-time PCR, total RNA was extracted from the BA 9 obtained from all subjects with schizophrenia, BPD1 as well as control subjects using Trizol reagent (Invitrogen Life Technologies). The RNA was then reverse-transcribed to give first strand cDNA; the cDNA from each subject was diluted 1 in 20 prior to PCR amplification. Owing to lack of tissue, analysis of mRNA for S100β was carried out on cDNA prepared from 18 controls, 18 subjects with schizophrenia and 8 subjects with BPD1.
Real-time PCR was performed using a LightCycler thermal instrument (Roche Diagnostics GmbH, Mannheim, Germany). Reactions were performed in 20 μL volumes, with 0.5 μM primers and an optimised MgCl2 concentration (2–5 mM). Nucleotides, Taq DNA polymerase and bufferwere included in the LightCyclerDNAMaster SYBR Green I mix (Roche Diagnostics GmbH, Mannheim, Germany). A typical run consisted of a denaturation step at 95?C (10 min) followed by 40 cycles; 95?C for 0 second, 55–64?C (primer-dependent) annealing for 5 seconds and 72?Cextension for 8 seconds. Detection of the fluorescence was carried out either at the end of the extension period or after an additional 3-second step at 2?C below the product melting temperature. To confirm amplification specificity, the PCR products from each primer pair were subjected to melting curve analysis as well as agarose gel electrophoresis and sequence verification. The quantification data were analysed with the LightCycler software. Gene amplification levels were normalized against cyclophilin. A cyclophilin standard curve using serial 10-fold dilutions ranging from 10 ng to 0.001 pg was generated by amplification of a 206-bp cyclophilin fragment, against a template cyclophilin that was prepared by excision from a gel, purification and sequencing.
Statistics
For the data relating to human tissue, D'Agostino and Pearson omnibus test was used to determine whether the data were normally distributed. Where data were shown to be normally distributed one-way ANOVAs, with diagnosis as the variable, followed by either a post-hoc Newman–Keuls Compare All Pairs of Columns (demographic data) or Dunnett's Multiple Comparison Test (experimental data) were used to identify significant variation between diagnoses. Where data were not normally distributed, ANOVA was assessed with the Kruskal–Wallis test with post-hoc Dunn's test comparing all columns. Relationships between experimental parameters and potential confounding factors (PMI, age, brain pH, chlorpromazine equivalents and DOI) were analysed using Pearson single product moment correlations calculated using an assumed straight line fit. Where significant correlations with a confounding factor were identified, further analyses were carried out usingANCOVAs.ANCOVAs were calculated usingMinitab__ (Minitab Release 13.1, Minitab Inc. State College, PA, USA). All other analyses were carried out using GraphPad Prism Version 4.0 for Windows (GraphPad Software Inc., San Diego, CA, USA).
Results
Age, PMI and brain pH were normally distributed for all cohorts and there were no significant variation in mean age (F=0.20, df=2, 45, p=0.82), PMI (F=0.40, df=2, 45, p=0.67) or brain pH (F=1.95, df=2, 45, p=0.15) across diagnoses (Table 1).
Protein studies: human
Despite varying multiple parameters to enhance detection, levels of p53 were below the detection limit of the western blot analysis in most subjects in all regions. While the lack of quantifiable data on p53 was significant, as this showed that the expression of this protein is low in the human cortex, this meant that statistical analysis was not feasible. With the exception of GFAP, which gave bands at 31 and 34 kDa, all antibodies gave a single antigenic band at the expected molecular weight.
Unlike the demographic data, not all experimental data were normally distributed. Therefore, a Kruskal–Wallis Test with post-hoc Dunn's test comparing all columns was used to identify significant variations across diagnoses. These analyses showed a significant variation in levels of S100β with diagnosis inBA9 (p <0.0005) and BA40 (p <0.02) but not BA 10 (p=0.34) or BA 46 (p=0.15) (Fig. 1). The variation within diagnosis in BA 9 was due to a significant decrease in levels of S100β in tissue from subjects with BPD1 (mean±SEM: 0.63±0.07 ratio IC) compared with levels in tissue from subjects with schizophrenia (1.10±0.07 ratio IC; p <0.001) and controls (1.03±0.05 ratio IC; p <0.05). Variation in BA 40 was due to a significant increase in levels of S100β in tissue from subjects with BPD1 (1.94±0.10 ratio IC) compared with controls (1.47±0.11 ratio IC; p <0.05) but not subjects with schizophrenia (1.71±0.1 ratio IC). Levels of S100β in BA 40 from subjects with schizophrenia did not differ significantly from those in control subjects.
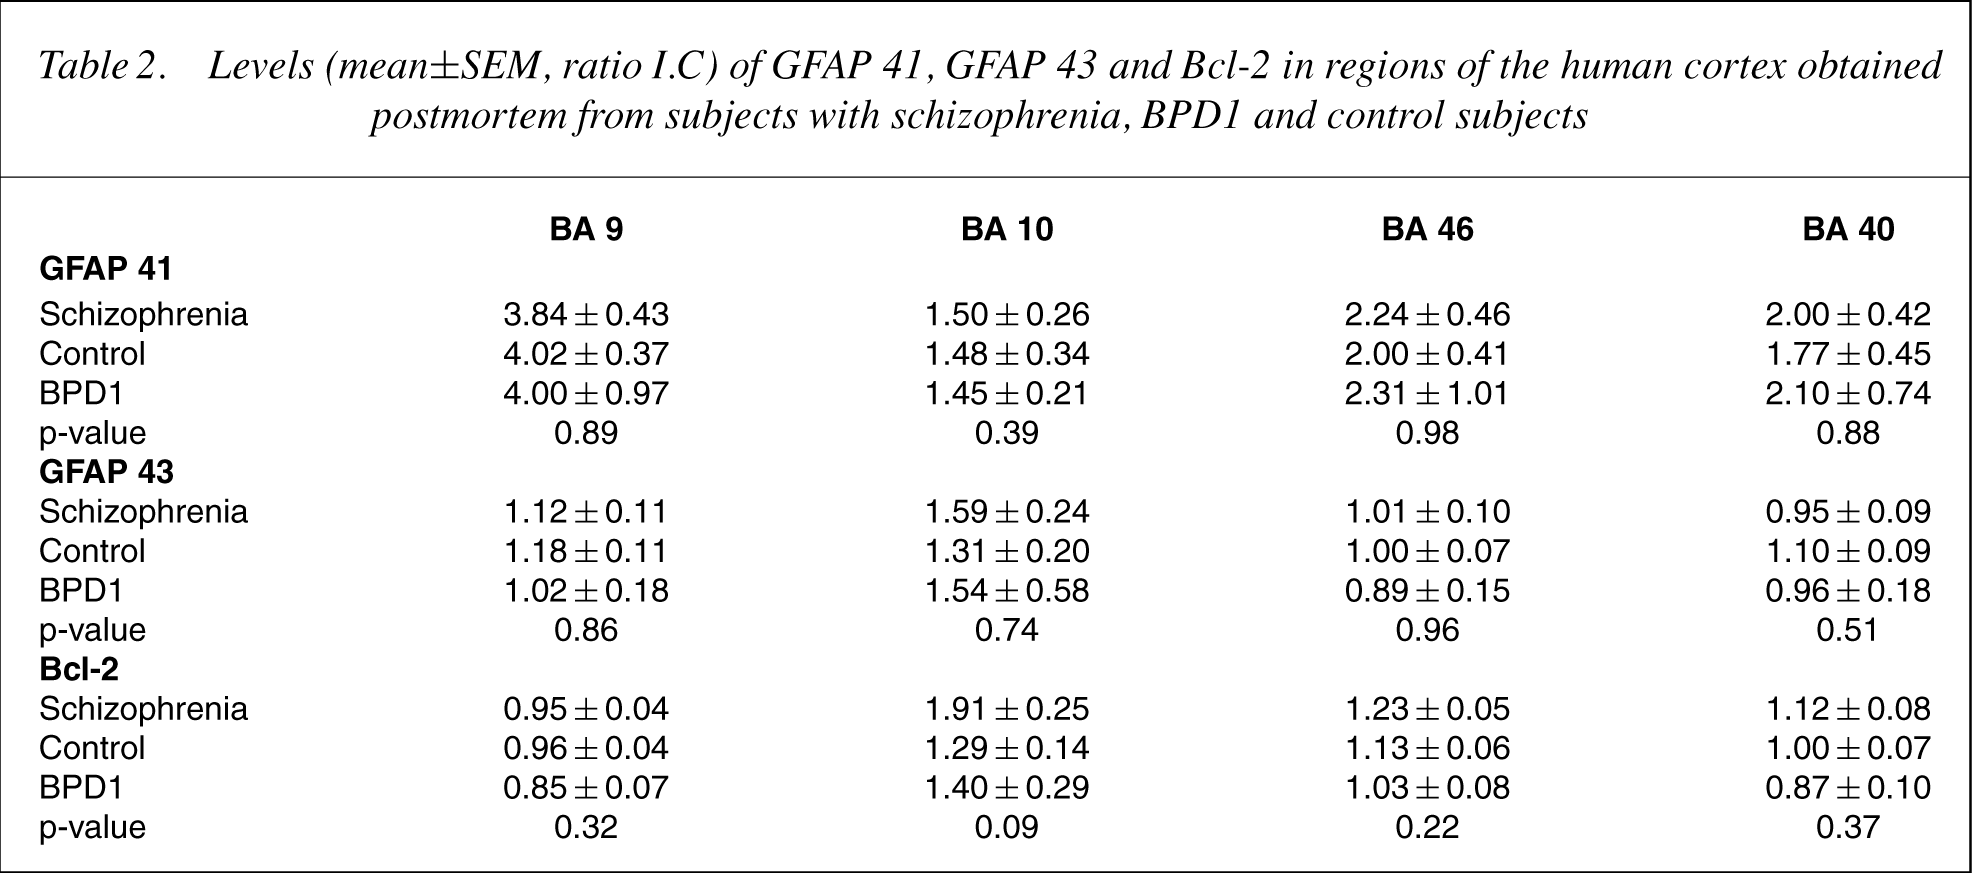
There were no significant differences in levels of GFAP 41, GFAP 43 or Bcl-2 between diagnoses in any cortical region (Table 2).
Levels (mean ± SEM) of S100β expressed as a ratio of internal control in Brodmann's Areas 9, 10, 46 and 40 obtained post-mortem from subjects with schizophrenia, bipolar 1 disorder and control subjects.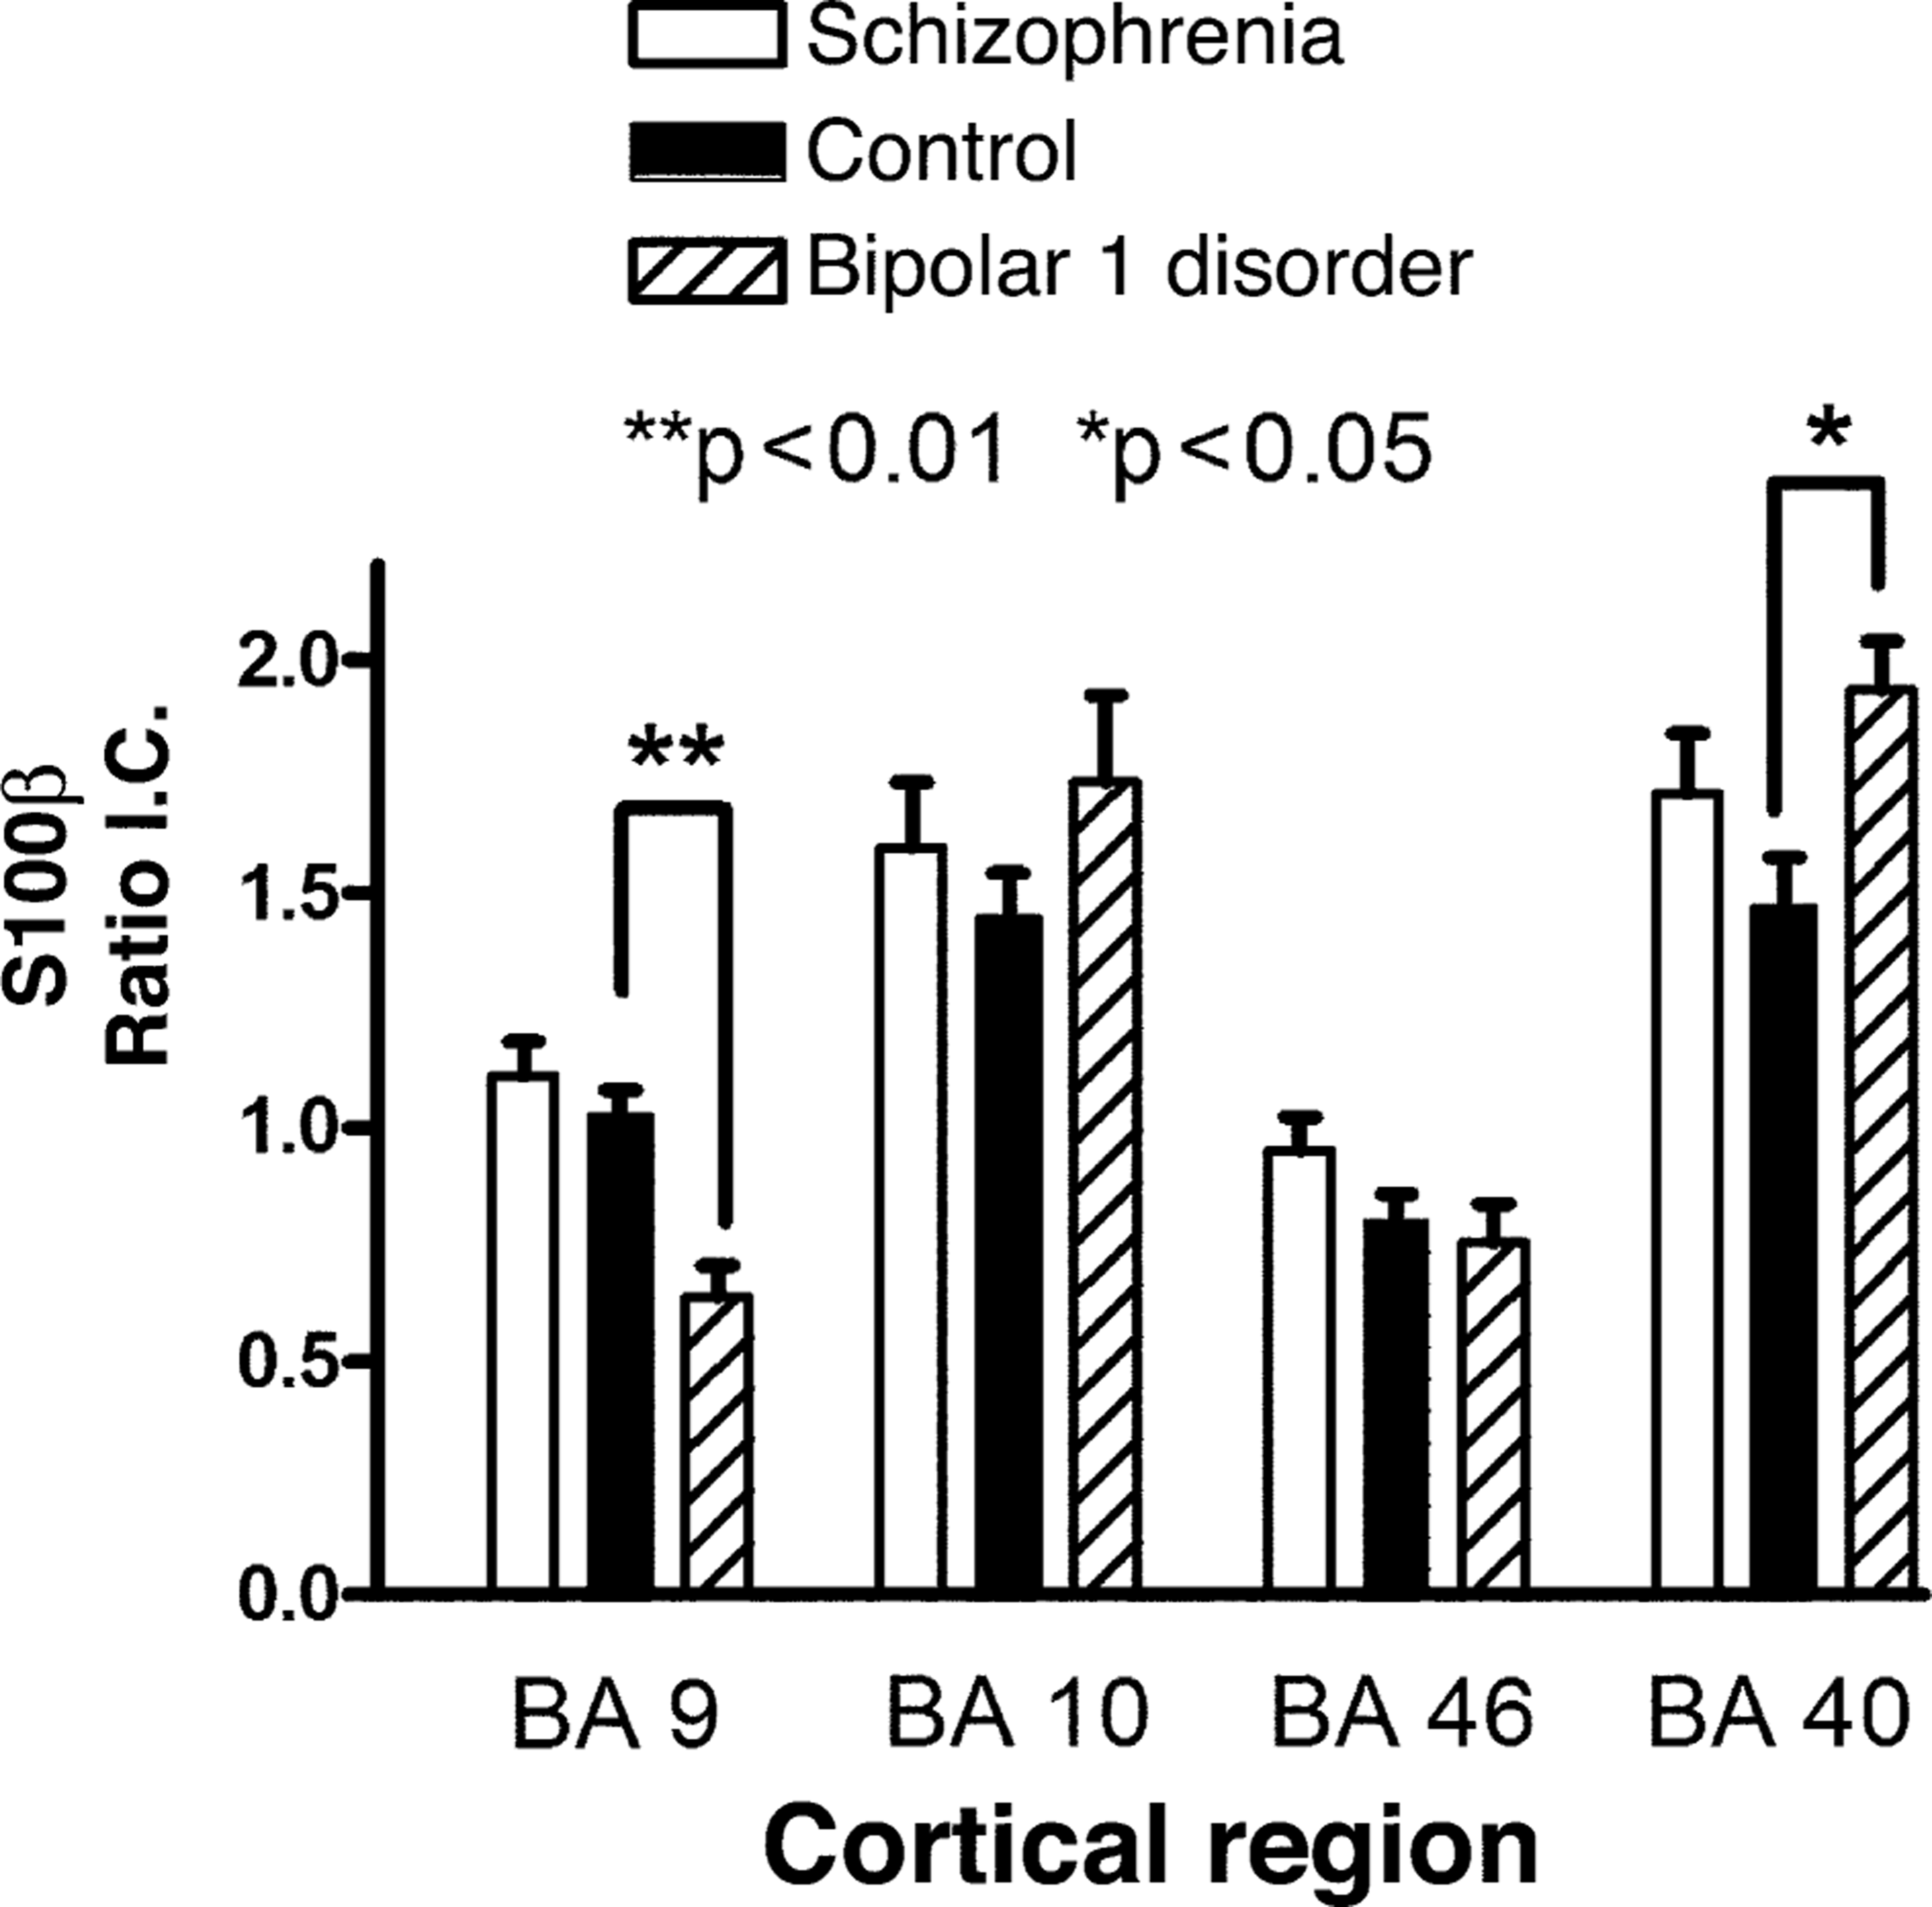
Levels (mean±SEM, ratio I.C) of GFAP 41, GFAP 43 and Bcl-2 in regions of the human cortex obtained postmortem from subjects with schizophrenia, BPD1 and control subjects
There were significant correlations between levels of Bcl-2 and age in BA 46 from control subjects (Fig. 2A) and levels of S100β and age in BA 9 from subjects with the BPD1 (Fig. 2B). There were no other significant correlations between protein levels and age in any other region of any of the diagnostic cohorts (r2 from 0.00032 to 0.32). There was no significant correlation between PMI or pH and any experimental variable in any diagnostic cohort (r2 =0.000006 to 0.37). For schizophrenia and BPD1, there was no significant correlation between any experimental variable and DOI or FRAPDD (r2 =0.0000002 to 0.58).
(a): Relationships between levels of Bcl-2 and age in Brodmann's Area 46 from control subjects. (b): Relationships between levels of S100β and age in Brodmann's Area 9 from subjects with BPD1.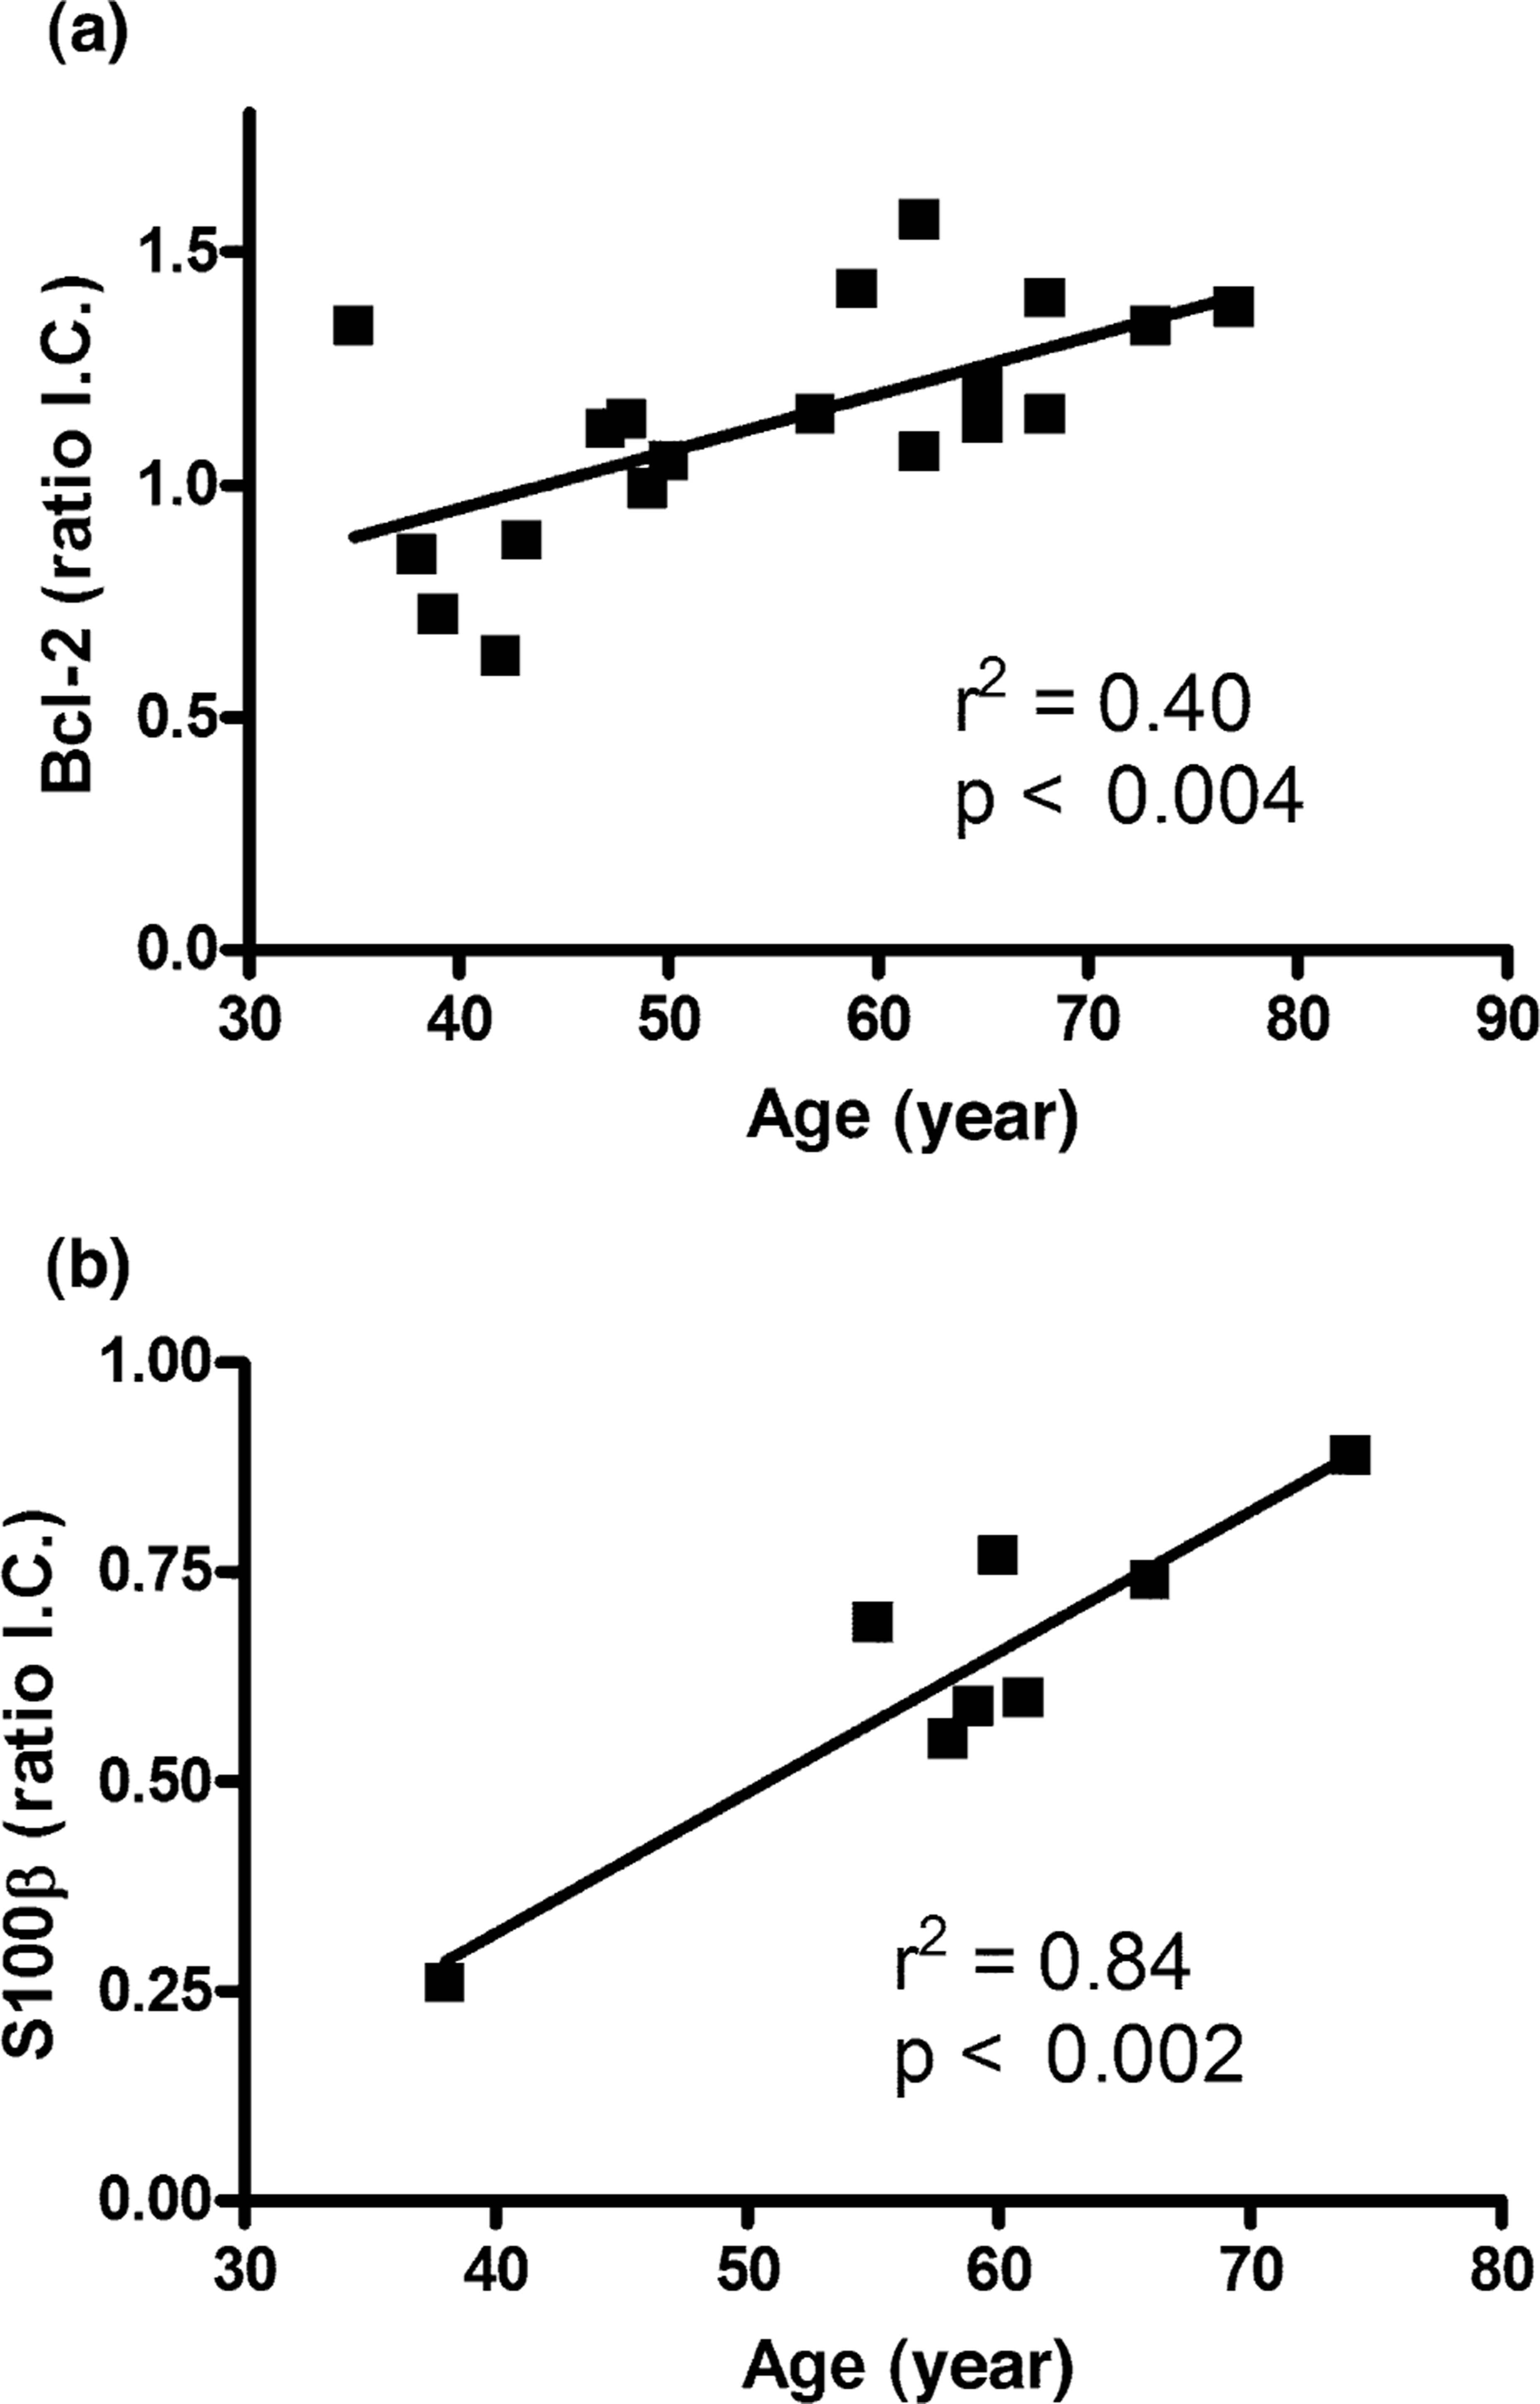
To determine if the relationships between age and protein levels (Controls: Bcl-2 in BA 46; BPD1: S100β in BA 9) had affected analysis of variation across diagnosis, ANCOVA were performed with age and the experimental measures as covariates. ANCOVA of Bcl-2 in BA 46 with age as a covariant suggest that there could be a significant variation in levels of Bcl-2 in BA 46 with diagnosis (F=3.88; df=1, 2, 44; p <0.05). However, subsequent analysis between diagnostic cohorts with Mann–Whitney tests did not reveal any significant differences between diagnostic groups (controls vs schizophrenia, p=0.34; controls vs BPD1, p=0.31; schizophrenia vs BPD1, p=0.11). ANCOVA of S100β confirmed that the significant variation with diagnosis in BA 9 was still apparent after accounting for age as a covariant (F=9.23; df=1, 2, 44; p <0.001). Subsequent analysiswith Mann–Whitney tests confirmed that this variationwas due to a significant decrease in levels of S100β in BA9 from subjects with BPD1 compared with the levels in tissue from control subjects (p <0.0005) and subjects with schizophrenia (p <0.0005). There was no significant difference in levels of S100β in BA 9 from control subjects and subjects with schizophrenia (p=0.67).
mRNA studies: humans
Levels of mRNA expressed as a ratio of housekeeping gene (cyclophilin) were not normally distributed in BA 9 from control subjects or subjects with schizophrenia. Subsequent analysis with Kruskal– Wallis Test with post-hoc Dunn's test comparing all columns showed no significant variation in levels of S100β mRNA in BA 9 with diagnoses (p=0.15; mean±SEM: controls=2.55±0.58, schizophrenia= 3.47±4.8 and BPD1=3.05±0.83). There were no significant relationships between levels of S100β mRNA in BA 9 and any demographic, pharmacological or tissue collection variable (r2 =0.01 to 0.66).
Protein studies: rat
Levels of S100β were not significantly different in the cortex from rats treated with vehicle (mean±SEM: 0.25±0.02 ratio IC) or haloperidol (0.23±0.02 ratio IC; p=0.43) in drinking water or with vehicle (0.48±0.04 ratio IC) or lithium (0.42±0.04 ratio IC; p=0.37) in chow.
Discussion
Our studies have demonstrated regionally specific changes (decreased in BA 9 and increased in BA 40) in the glial-derived protein S100β in tissue from subjects with BPD1 but not schizophrenia. In BA 9, changes in levels of S100β protein are not matched by changes in mRNA encoding the protein, suggesting that changes in S100β in CNS are not necessarily a result of changes in levels of the rate of gene transcription. Moreover, changes in levels of S100β were not due to generalised changes in glial proteins, as neither isoform of GFAP measured were altered in any CNS region from any diagnostic cohort. Therefore, our data would be consistent with the hypothesis that changes in S100β might be associated with the pathology of BPD1.
This studywould appear to be the first study of S100β in CNS from subjects with schizophrenia and BPD1. However, levels of blood S100β have been reported to be increased in bipolar disorder [13] and during mania [14], these data being consistent with the increased levels of S100β we report in BA 40 from subjects with BPD1. However, given the region-specific changes we report in this study, further data are required to determine if overall omnibus changes in S100β in CNS from subjects with BPD1 could significantly contribute to changes in levels of the protein in blood from subjects with that disorder. In schizophrenia, blood S100β levels have been reported to be increased in non-medicated subjects [7–9] and in subjects treated with antipsychotic drugs for 3 weeks with deficit forms of the disorder [10], and to be decreased independent of clinical variables or treatment status [11]. Our study failed to show changes in levels of cortical S100β in subjects with schizophrenia and therefore does not provide a ready explanation as to why blood levels of the protein should be altered in subjects with the disorder.
The rationale for examining S100β in post-mortem CNS from subjects with schizophrenia and BPD1 was that high levels of the protein have been shown to stimulate apoptosis, while lowlevels of the protein increase cell survival [5]. We hypothesized that, if present, changes in S100β in CNS from subjectswith schizophrenia or BPD1 could feed down and alter levels of key pro- or anti-apoptotic proteins. It is therefore significant that we failed to demonstrate changes in levels of the anti-apoptotic protein Bcl-2 [17] in tissue from subjects with BPD1 where S100β was altered. Significantly, our data are consistent with two previous studies that failed to show significant differences in levels of Bcl-2 in the temporal cortex of subjects with schizophrenia [25, 26] or bipolar disorder [26]. Our failure to detect the pro-apoptotic protein p53 prevented analyses to determine if the levels of that protein varied with diagnoses or to test the hypothesis that the p53 gene is a strong susceptibility gene for schizophrenia [27]. Of more immediacy, our data do not support our hypothesis that changes in levels of S100β would cause changes in key pro- or anti-apoptotic proteins in the CNS of subjects with schizophrenia or BPD1. Further investigations to discover which S100β mediated pathways are perturbed in BPD1 are therefore required.
GFAP exists in many isoforms in the human CNS [28,29] and therefore a comparison of findings of GFAP between studies on post-mortem CNSmust be interpreted with caution. The antibody used in this study bound to isoforms of GFAP with molecular weights of 43 and 41 kDa isoforms; no diagnostic-specific change in the levels either isoform was apparent. In general terms, and focusing on studies quantifying GFAP protein, our study agrees with earlier studies that did not find changes in GFAP in the cortex [30, 31], thalamus [31], temporal lobe [31, 32], pontine tegmentum [31] or cerebellum [28, 31] from subjects with schizophrenia. It is therefore significant that a study using two-dimentional electrophoresis has found decreased levels of certain GFAP isoforms in BA 10 from subjects with schizophrenia and BPD1 [29]. These data suggest that more extensive studies of GFAP are required to resolve the question as to whether there are isoform-specific changes in this protein in the CNS of subjects with psychiatric disorders.
One confounding issue in this study is that changes in levels of S100β in BPD1 could be due to an effect of drug treatment prior to death. It is difficult to postulate how the actions of antipsychotic drugs or mood stabilisers could be so exquisitely selective as to cause diagnostic-region– specific changes in S100β in adjacent cortical regions (BA 10 vs BA 9 vs BA 46). Moreover, in the case of antipsychotic drugs, both patient cohorts had received these drugs at similar levels, and it is therefore difficult to postulate disease-specific effects of such treatments, particularly in the absence of any relationship between levels of cortical S100β and FRAPDD. Finally, levels of S100β were not different in the cortex of rats treated with haloperidol for 1 month. In the case of mood stabilisers, there was no difference in the levels of S100β in BA 9 (mean±SEM: 0.58±0.09 vs 0.73±0.07, p=0.41) or BA 40 (mean±SEM: 0.88±0.15 vs 0.85±0.10, p=1.00) from subjectswho had or had not receivedmood stabilizers. Moreover, the level of S100β was not altered in the cortex of rats that had received lithium at doses that produced blood lithium levels in the range that would be expected to give therapeutic responses in humans. Together, these findings suggest that the regionally specific changes in S100β in subjects with BPD1 reported in this study are not simply an effect of drug treatments before death.
In summary, this study has shown diagnostically and regionally specific changes in S100β in the cortex of subjects with BPD1. One limitation of this study is the small number of subjects with BPD1 studied. However, the magnitude of changes in the tissue from these subjects suggests the differences reported would remain significant in a study of a larger cohort of subjects with the disorder. Indeed, the magnitude of differences between diagnostic cohorts in our study means there is a 99% probability that differences would be detected if the study was repeated using as few as five subjects per diagnostic cohort. Extrapolating from our current results, recent data suggest that S100β plays an important role in neurogenesis [33], and it is therefore intriguing to postulate that glial modulation of neurogenesis may be involved in the pathology of BPD1. Supporting this hypothesis are data showing increased levels of S100β in CSF from an animal model of mania [34] and elevated levels of S100β in blood from drug-free subjects with BPD1 [13]. Of equal significance is the observation that cortical S100β is not altered in the cortex of subjects with schizophrenia. These data suggest that the changes in blood [7] or CSF [6] S100β in subjects with schizophrenia is not due to changes in cortical levels of the protein. Further data are required to determine if changes in peripheral S100β do reflect changes in levels of the protein in CNS. Alternatively, changes in peripheral S100β in subjects with psychiatric disorders may be reflecting other factors such as stress [35], altered dietary intake [36], bone fractures [37] or cardiac dysfunction [38].