
Abstract
Psychometric scales are a valid means of assessing routine outcome in mental health. Where outcomes are represented by dichotomous variables it is easy to assess them but, given the dimensional nature of psychiatric signs and symptoms, professionals often find themselves dealing with continuous scales with no clear border between ‘illness’ and ‘wellbeing’. Psychopharmacological and psychotherapeutic clinical trials typically rely on statistical significance tests that are useful in identifying group effects but give no information on how meaningful the observed changes are [1]. Statistical significance between test scores can sometimes be achieved even when the actual difference between scores is very small and it is less useful when we try to understand the outcome of an individual (or a group of service users) in terms of return to a previous condition of ‘normality’ or adjustment. Moreover, statistical and methodological problems limit efforts to understand individual changes in the context of a whole service or outcome study [2].
Health of the Nation Outcome Scales and clinical significance
Jacobson and Truax [3] proposed a method to determine reliable and clinically significant change (RCSC). This concept is meant to assure that a change observed in one individual is: (i) beyond what could be attributed to measurement error or to chance (reliable change); and (ii) such as to bring the person from a score typical of a problematic or suffering patient to a score typical of the ‘normal’ population (clinically significant change). Normative data for analysing clinically significant change has been provided for widely used outcome scales such as the Hamilton Rating Scale for Depression [4], the Symptom Checklist-90-R [5], the Brief Psychiatric Rating Scale [1] and the Edinburgh Postnatal Depression Scale [6].
The Health of the Nation Outcome Scales (HoNOS) were developed as a standardized assessment tool for routine use in mental health services [7], [8]. It consists of 12 scales, each using five points, from 0 (no problem) to 4 (severe/very severe), yielding a total score from 0 to 48. It has been translated into Italian [9], [10]. Independent studies have evaluated its reliability [11], subscale structure [12], sensitivity to change [13] and appropriateness for routine clinical use in busy psychiatric services [14], [15]. However, the application of the RCSC model to HoNOS scores is still controversial. In Audin et al. [16], the lack of normative data in non-clinical populations prevented the use of appropriate methods of determining clinical cut-off scores [2]. In Rees et al. [17], clinical change was measured using a statistical significance test (Greenhouse–Geisser test) indicating that a difference of three to four points was clinically meaningful.
Study aims
To apply the RCSC model to two subsequent HoNOS assessments in a large group of people evaluated in 10 community mental health services (CMHS) in Lombardy, Italy.
To explore changes and to test the HoNOS total score reliability and feasibility in identifying RCSC.
To display longitudinal changes on a two-dimensional graph [2].
Method
Study population
The HoNOS was routinely administered to each individual who came into contact with the staff of one of the collaborating CMHS during the months of January, May and November in 2000.
We collected 16 738 complete HoNOS assessments, concerning 9817 patients. Of these subjects, 4759 (48%) were evaluated at least twice in 2000. Data from the first assessment were used to calculate a reliable change (RC) index and clinically significant (CS) change; subsequently longitudinal changes were explored by applying the RCSC model to the patients with at least two assessments. Further details are given elsewhere [18], [19].
Classification of severity
A simple method for classifying patients' severity was applied. This was proposed by Lelliott [20] who defined severe patients as having higher scores in at least one item. We adopted a similar classification based on a score of ≥3 in at least one item to discriminate between severe and non-severe patients. We further distinguished severity by taking the group of very severe subjects with a score of ≥3 in at least two items. Instead, the group of subclinical subjects had a score <2 in all items [21]. Therefore, the criterion discriminating: (i) between ‘very severe’ and ‘moderately severe’ patients is having more than one item's score of ≥3; and (ii) between ‘mild’ and ‘subclinical’ patients is having at least one item's score of 2 (see Results and Fig. 1).
Classification of severity based on the frequency of HoNOS scores (severe, at least one item ≥3; non-severe, each item <3; very severe, at least two items ≥3; moderately severe, one item ≥3; mild, at least one item = 2; subclinical, each item <2). Distribution and mean total HoNOS scores (mean (SD); 0 = no distress; 48 = highest distress). For 9817 patients who came into contact with community mental health services (CMHS) in 2000.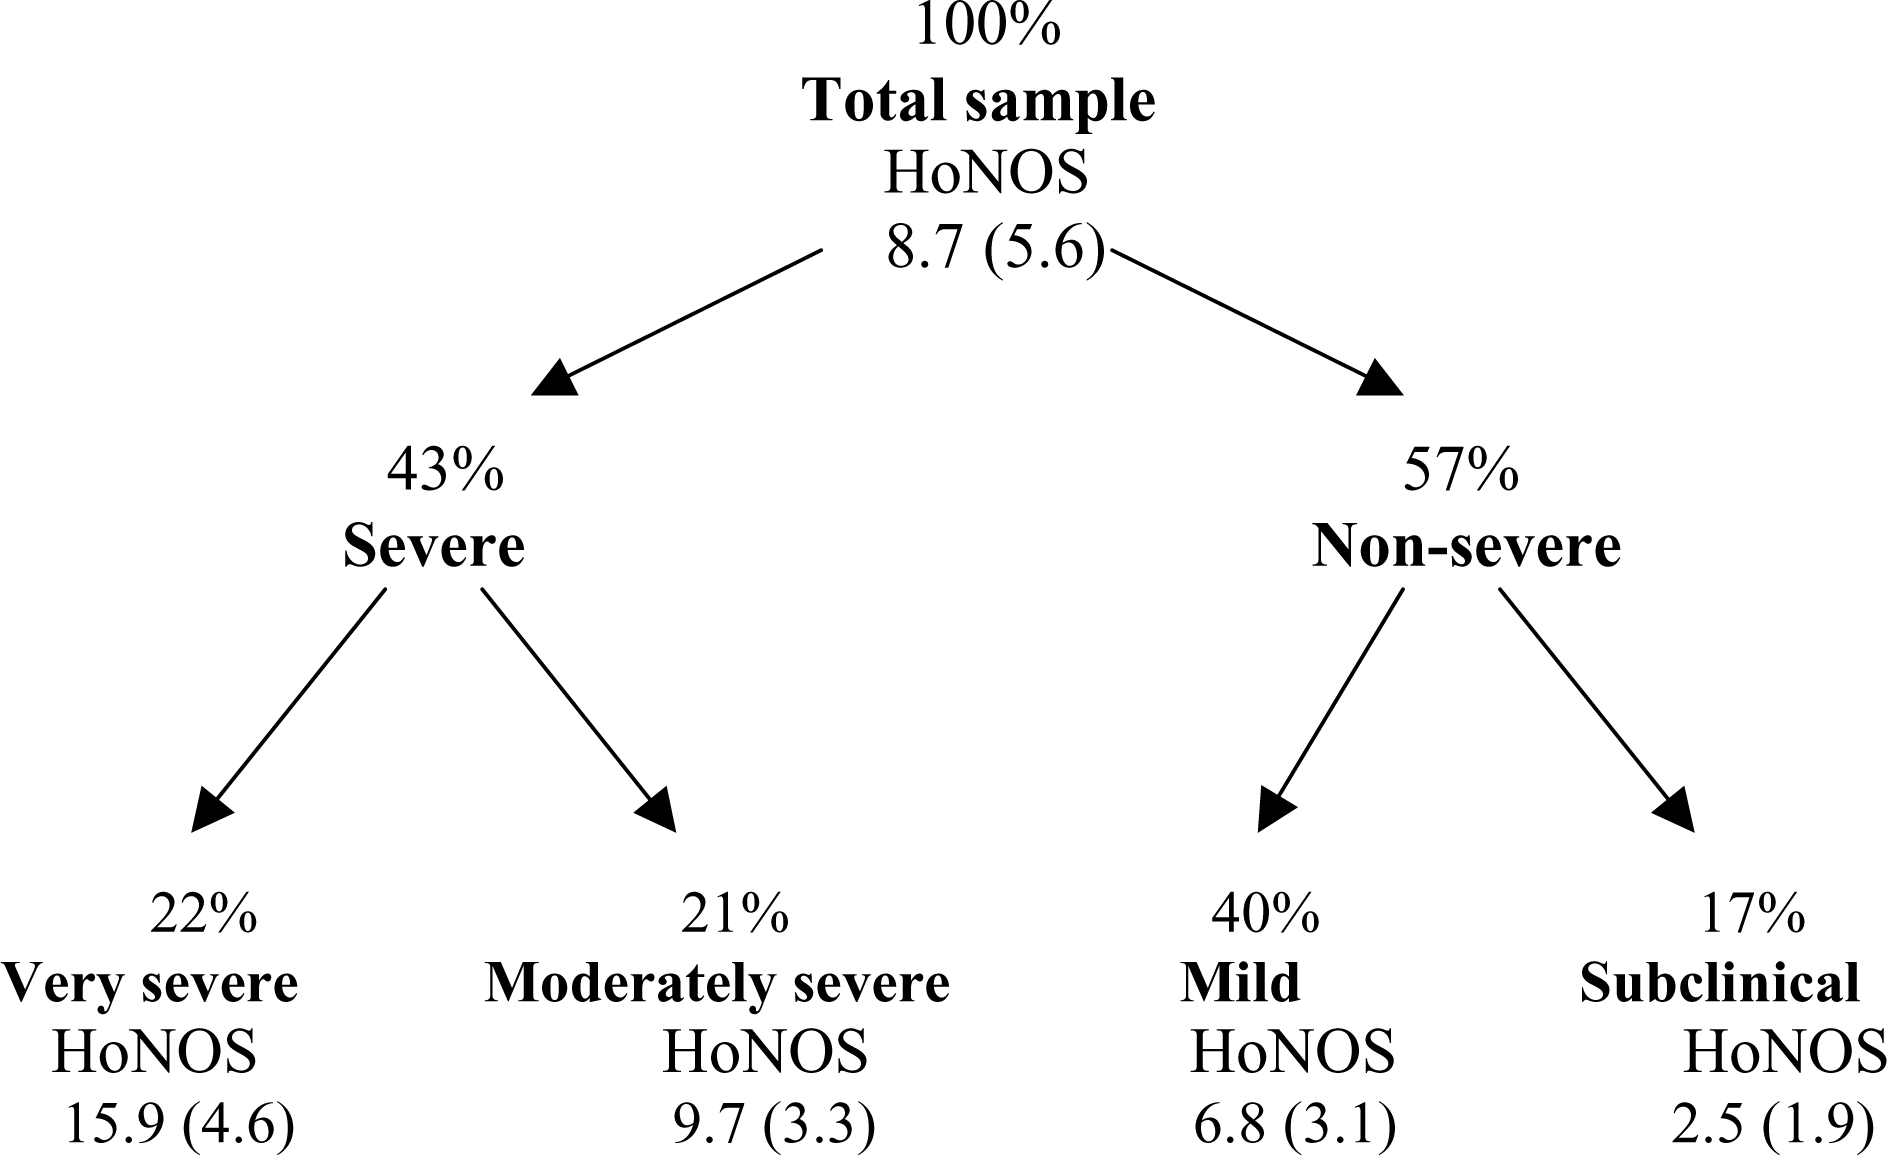
Study procedure
Reliable change refers to the extent to which an observed change falls beyond the range attributable to the measurement error.
Reliable change (RCindex; for formula see Appendix) is assessed using a variation on the standard error (SEdiff; for formula see Appendix) of measurementwhich considers two subsequent assessments (i.e. baseline and follow-up) [21–23].
We calculated RC both on the whole population of service users (9817) and on the subgroup of patients with a score of at least ≥3 (i.e. very severe and moderately severe) (4179).
Clinically significant change is when a person's score moves from the ‘dysfunctional population’ range into the ‘functional population’ range.
This requires determination of the cut-off point where the chance of belonging to either distribution is the same (CScut-off; for formula see Appendix) [3], [22].
Tingey et al. [24] proposed using multiple clinical groups (e.g. inpatients vs outpatients) to determine cut-off points, aiming at a more realistic determination of ‘stepwise’ changes. We calculated the cut-off (cut-off1) that separated the group of ‘very severe’ patients from the other service users and the cut-off (cut-off2) that separated the group of subclinical subjects from the group of clinical subjects (mild, moderately severe and very severe). We then formed a cascade-like distribution referring to clinically different subgroups.
Considering only the subgroup of severe patients (4179), we calculated the cut-off (cut-off3) that separated ‘very severe’ from ‘moderately severe’ cases.
Taking patients who were evaluated at least twice in 2000 (4759), we plotted longitudinal changes on a two-dimensional graph with baseline assessment on the x-axis and follow-up assessment on the y-axis.
We also explored longitudinal changes in the subgroup of ‘moderately severe’ and ‘very severe’ patients (2146). We tested whether cut-off scores could be assumed as a proxy of the category change for each individual. Each subject was classified in two different ways, according to: (i) RC and CS change; and (ii) RC and the real-shift to a different category of severity. In order to explore the degree of agreement between the two classifications, we cross-tabulated the variables and analysed their correlation (Spearman rho; p<0.01).
All analyses were carried out using SPSS for Windows Release 11.
Results
Classification of severity
As reported in Fig. 1, we stratified the 9817 patients at first assessment into four categories of severity. The mean HoNOS scores are reported.
The ‘very severe’ patients' score (mean=15.9) was more than seven points higher than the whole population's score (mean=8.7).
Reliable and clinically significant change
Cronbach's α for the 12 items, as calculated in the total population (9817), was 0.73. The RC index was 8, resulting in an eight-point change being needed to give 95% confidence that a real change had occurred in the individual (RC); cut-off1 was 11 and cut-off2 was 5.
For the subgroup of 4179 severe patients, RC index was 7 and cut-off3 was 12.
Longitudinal exploration
Figure 2 shows longitudinal changes of the 4759 patients evaluated twice. The central diagonal line indicates the points where absolutely no change was observed in at least 6 months (y=x). The ‘rails’ on each side of the diagonal show the limits of the RC area; for anyone falling within this area a change could be attributed to chance and measurement error. Subjects with a point falling above the upper rail showed a reliable worsening of their clinical condition as measured by HoNOS, and those below showed reliable improvement. The two horizontal lines on the y-axis (follow-up) indicate the limits of clinical improvement and remission. Those falling below these lines can be considered clinically improved or recovered. The two vertical lines on the x-axis (baseline) represent the limits of clinical deterioration and recurrence; subjects falling to the left of these lines showed significant worsening of their clinical condition or a recurrence, being previously subclinical.
Longitudinal changes of the 4759 patients evaluated at least twice in 2000: total HoNOS score (0 = no distress; 48 = highest distress). Plot of reliable and clinically significant change parameters.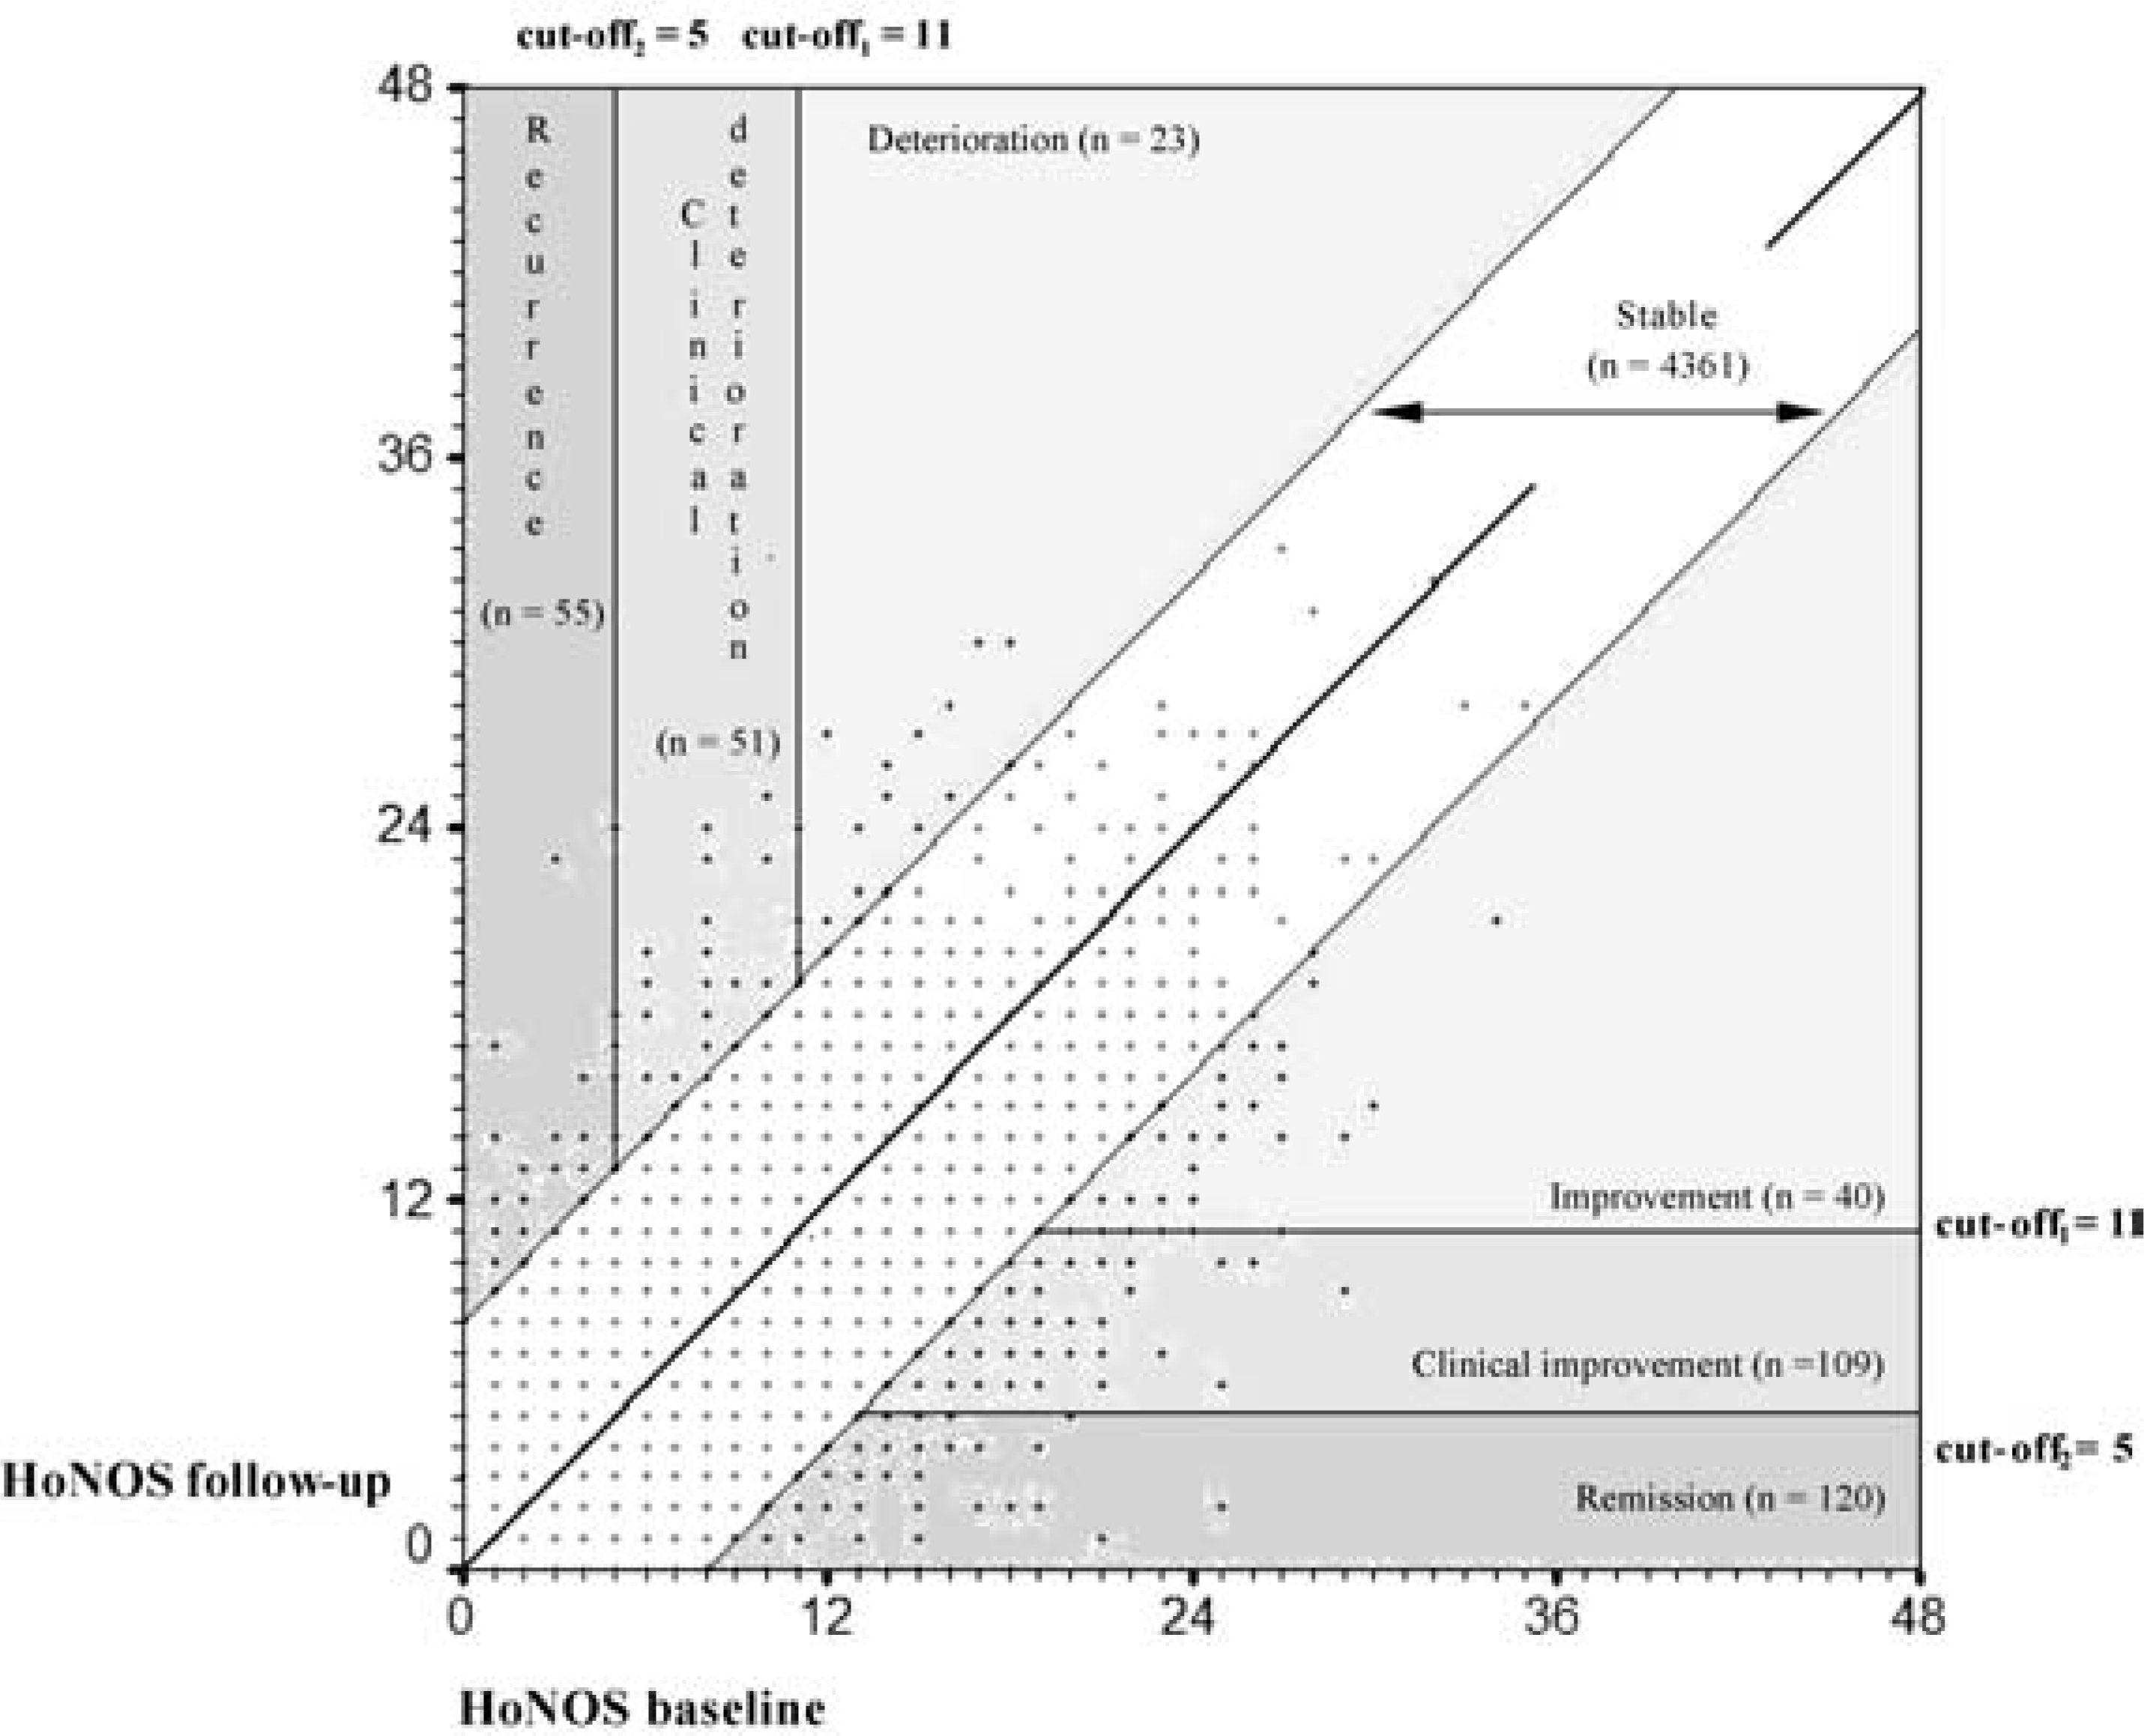
A total of 91.6% of the sample was stable, 5.6% (269) improved and 1.8% (129) worsened.
Figure 3 shows longitudinal changes in the subgroup of severe patients (2146), where only cut-off3 was considered; 82.5% of the sample was stable, 14.4% improved and 3.2% worsened.
Longitudinal changes of the 2146 ‘very severe’ and ‘moderately severe’ patients evaluated at least twice in 2000: total HoNOS score (0 = no distress; 48 = highest distress). Plot of reliable and clinically significant change parameters.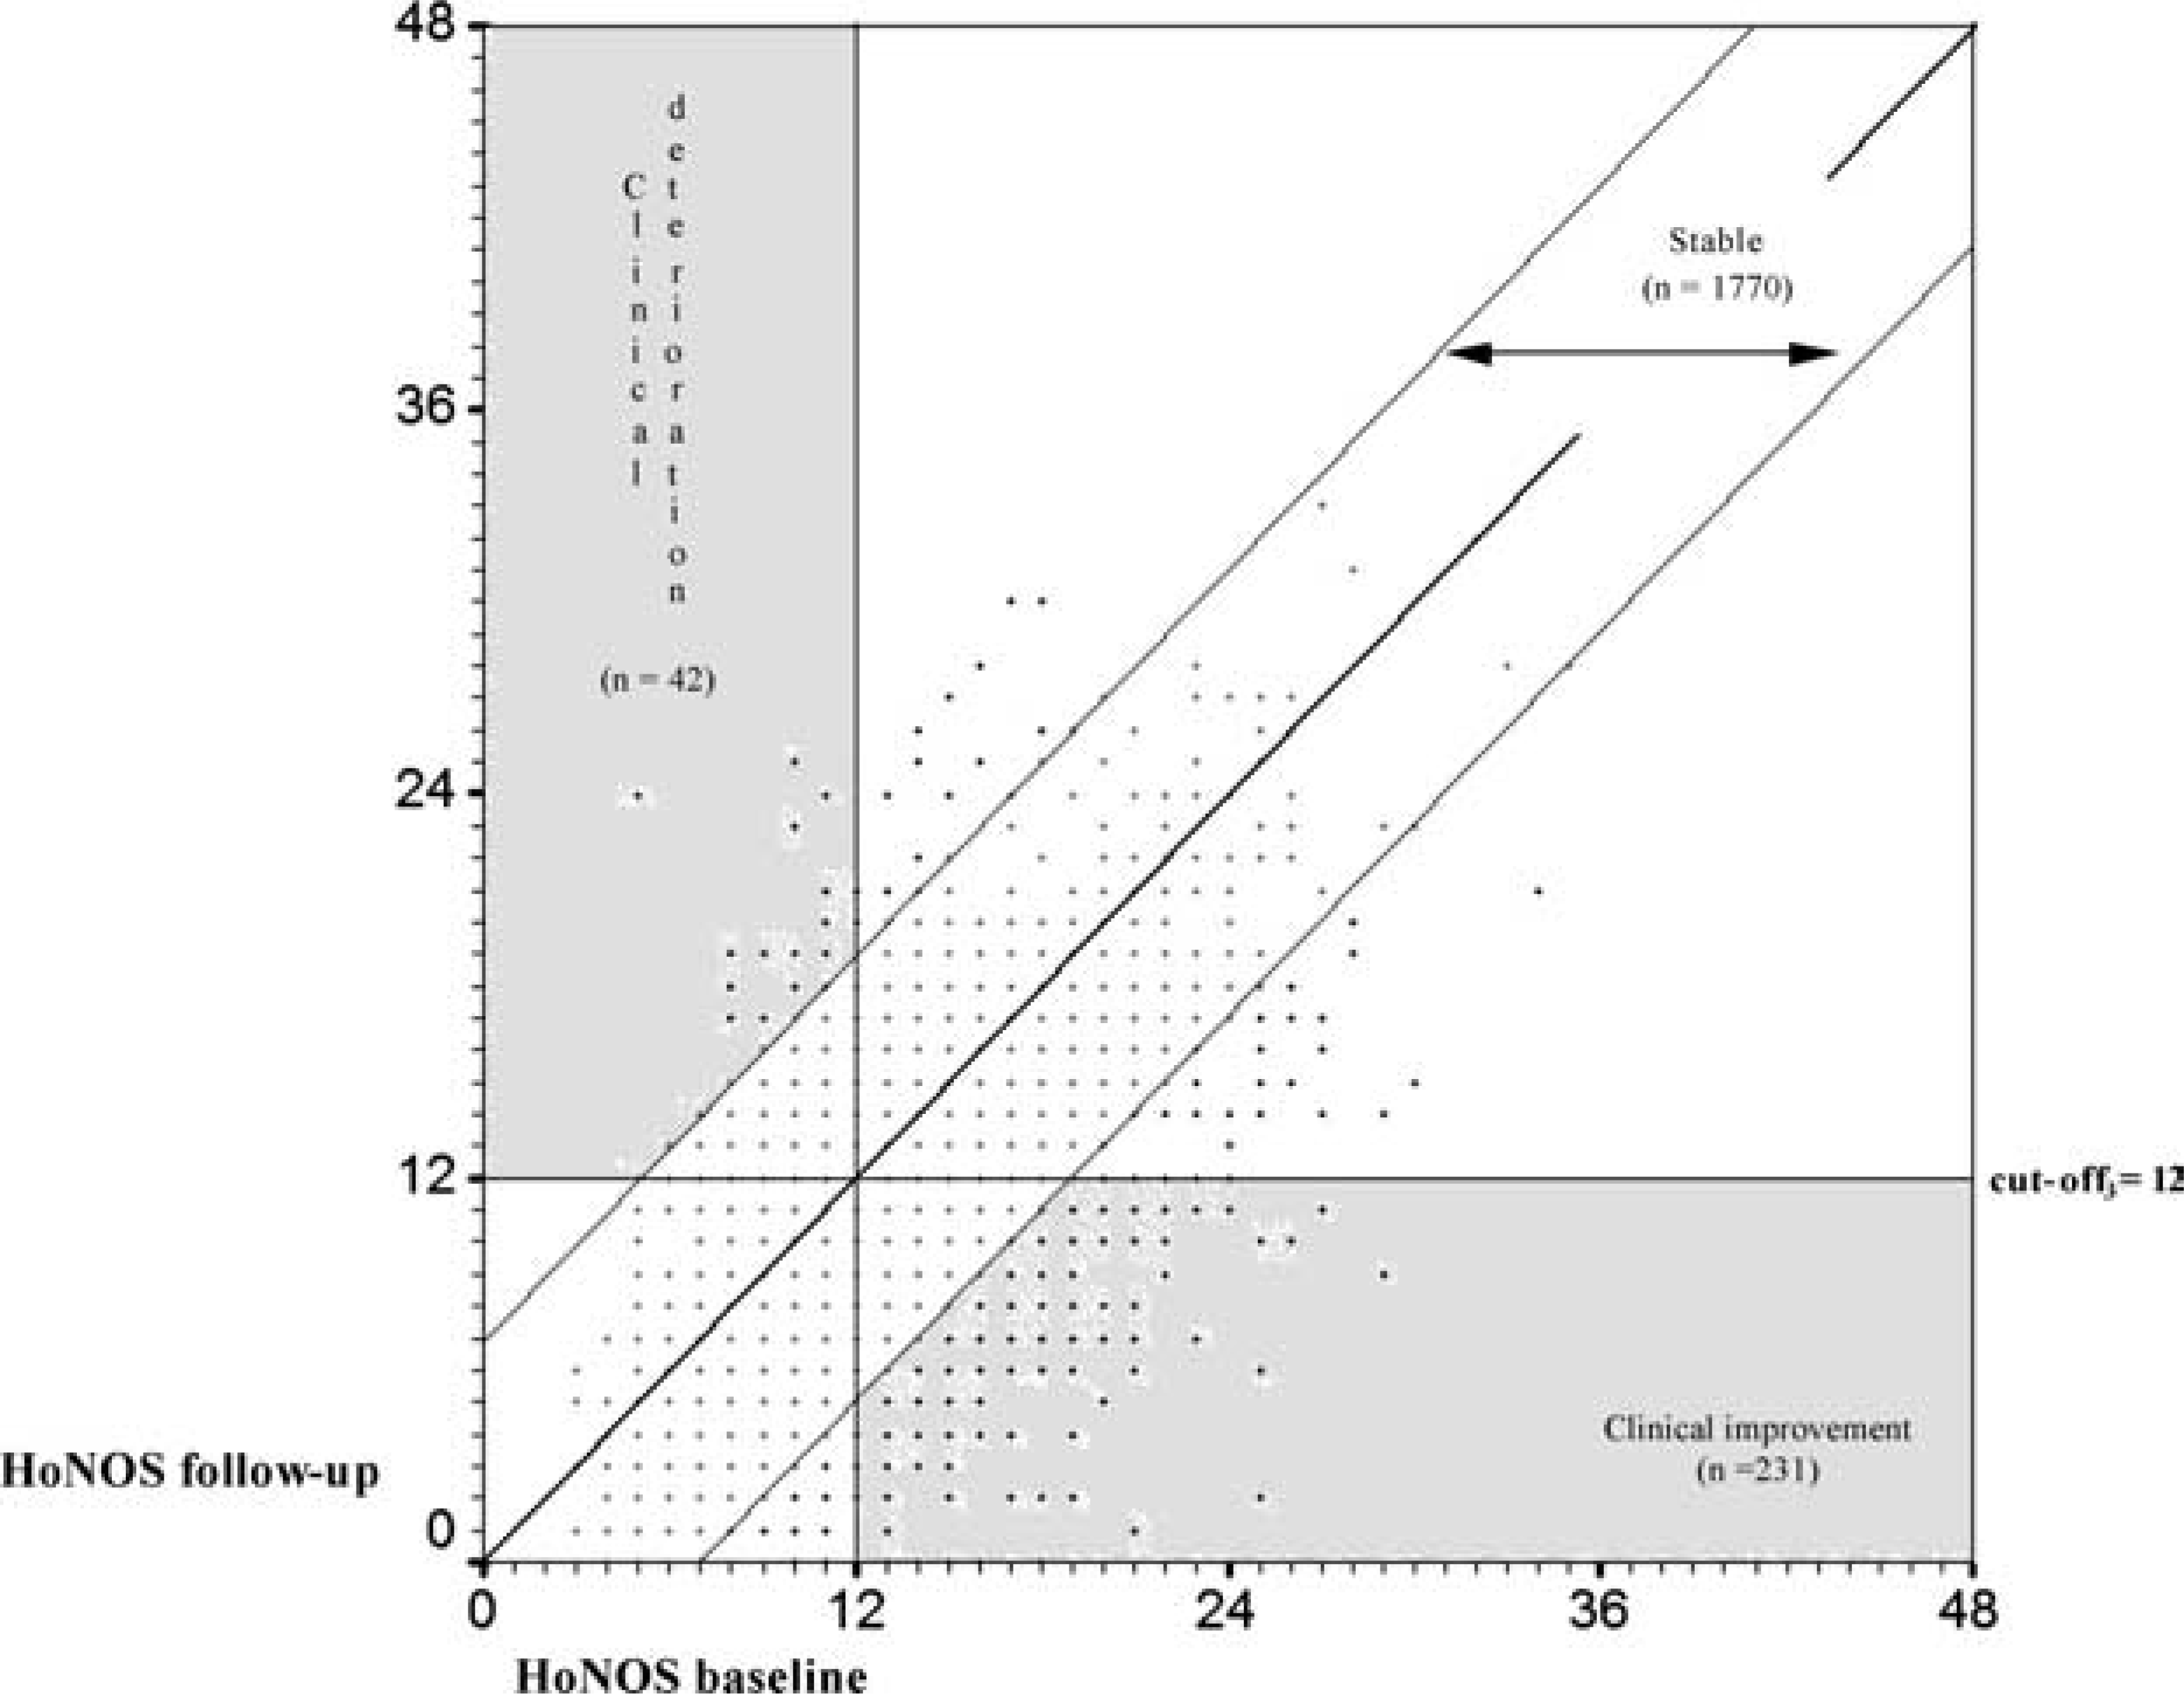
The points plotted both in Figs 2 and 3 do not represent a fixed number of subjects.
Table 1 presents a cross-tabulation of the two outcome variables on which the total sample was classified. Accordance was good, because
Distribution of patients evaluated at least twice in 2000 (4759) in two different categories of outcome: (i) based on RCSC; and (ii) one based on RC and on the real shift to a different category of severity
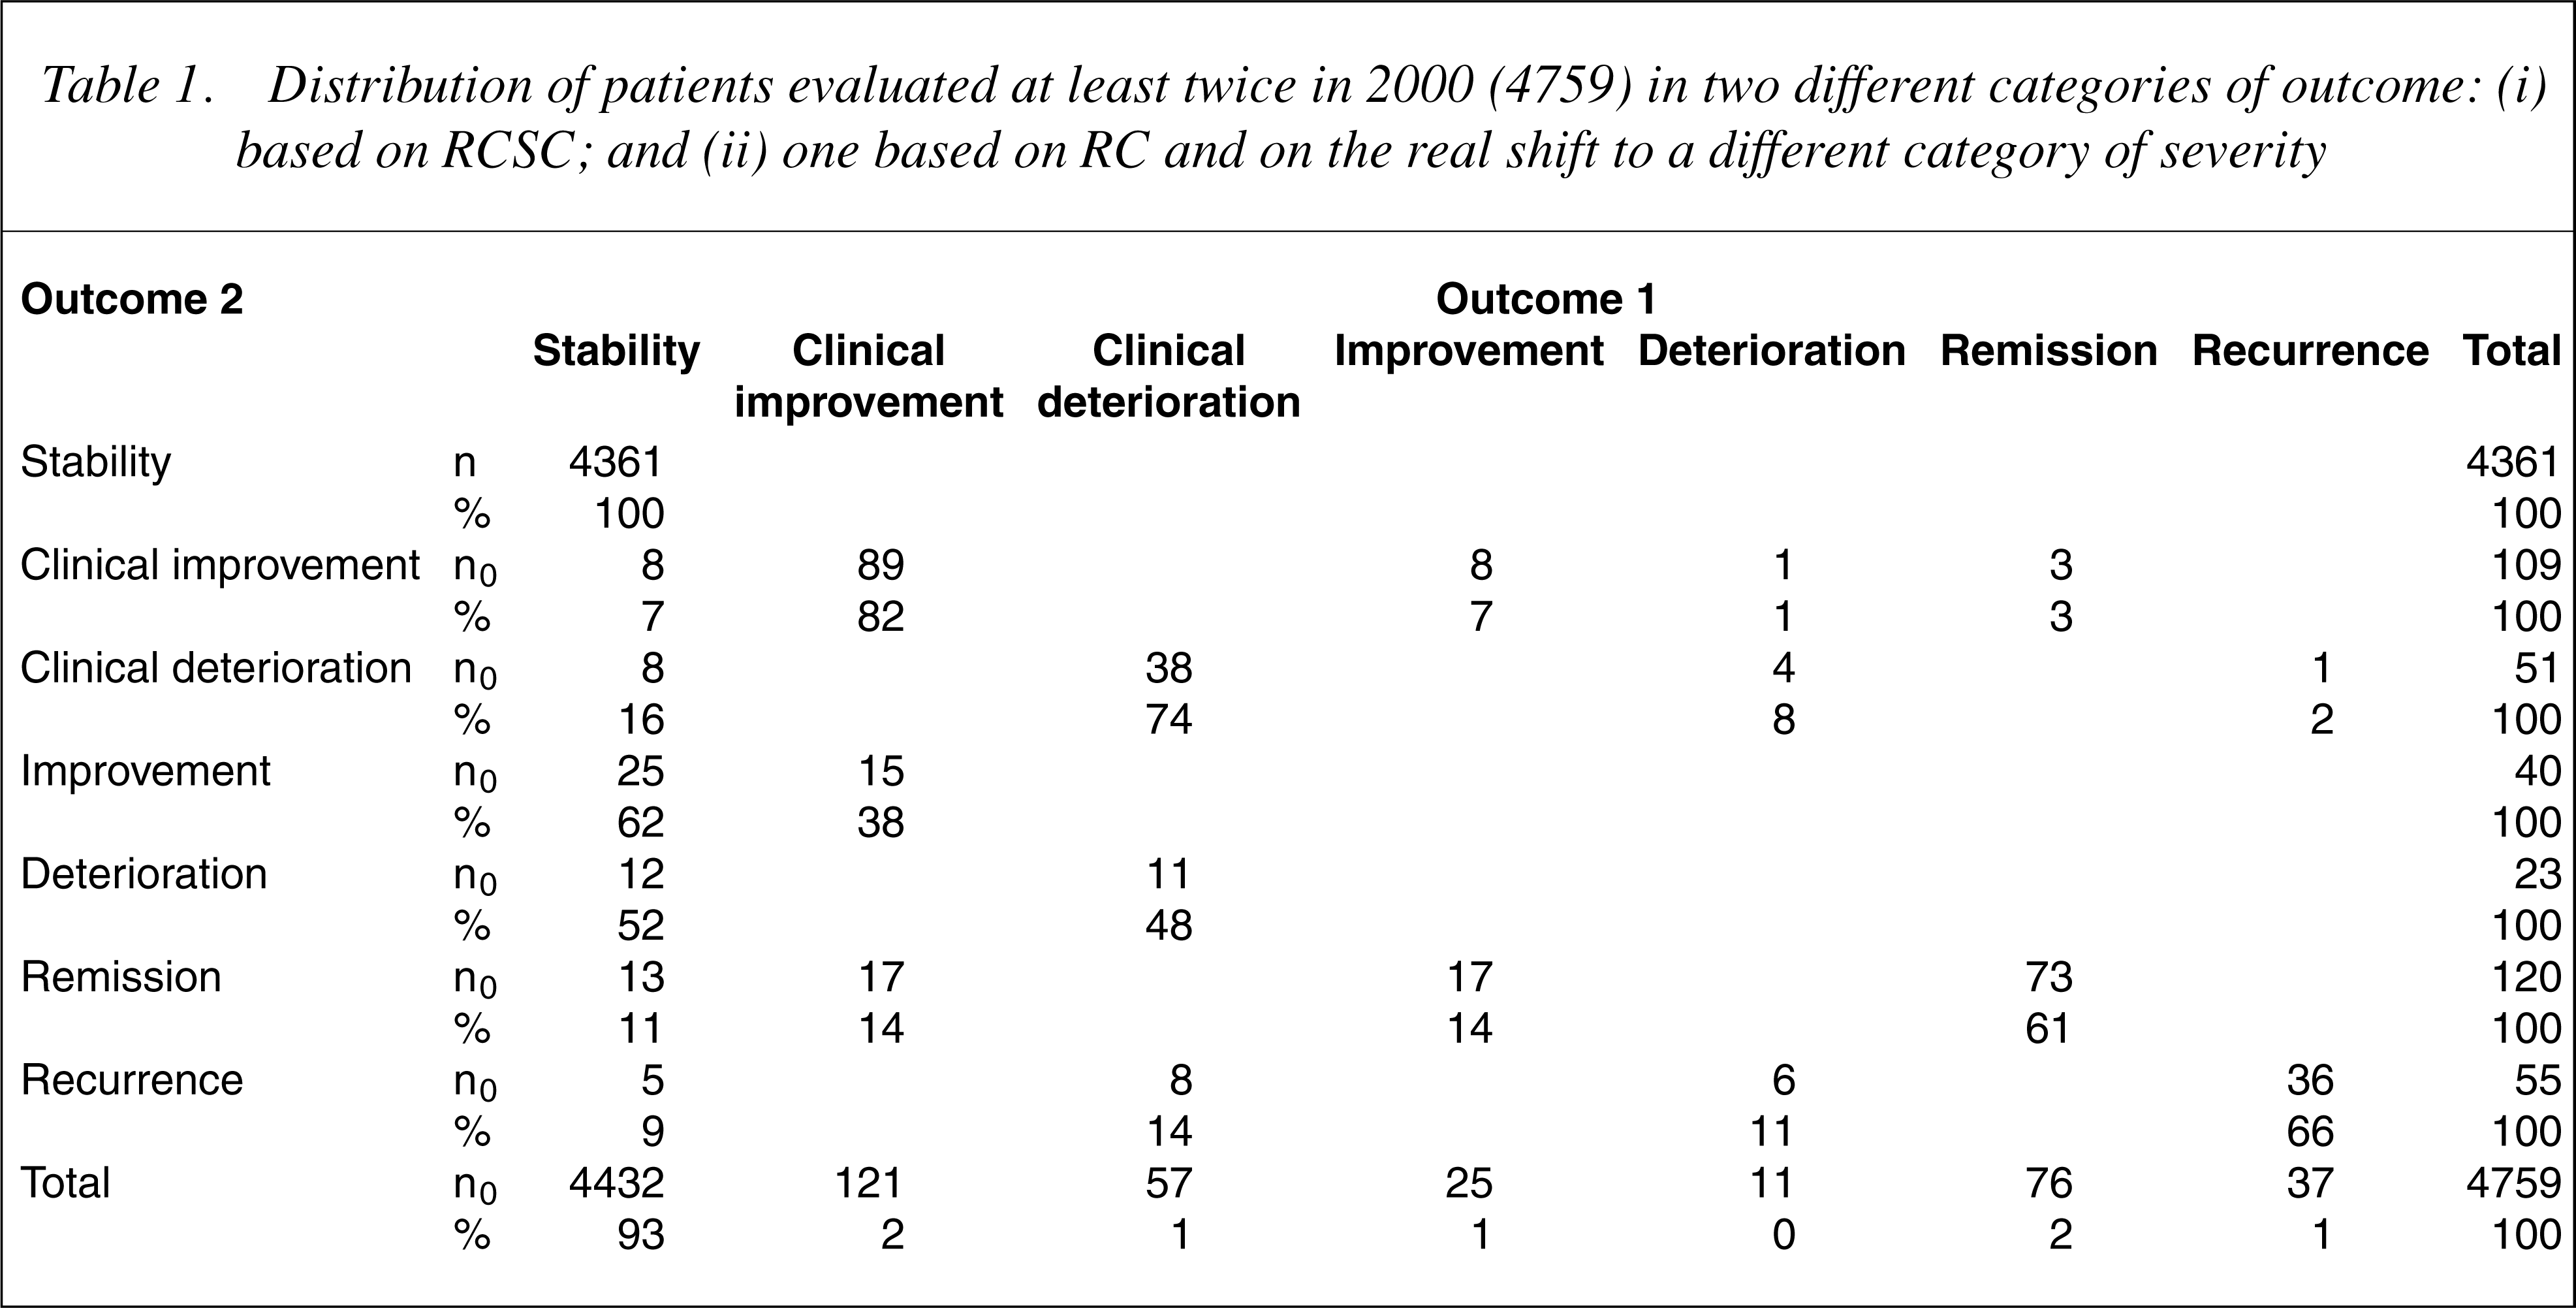
82% and 74% of patients were clinically improved and worsened on both classifications, respectively. Only one patient was designated as improved with one classification and deteriorated with the other. In bivariate analysis, the two outcome variables significantly correlated, with a Spearman's rho of 0.9.
Discussion
Although the model proposed by Jacobson and Truax [3] was designed to translate psychotherapy research results into clinical practice, it is applicable to the measurement of change on any continuous scale for any clinical problem. Crosby et al. [25] reviewed current approaches to define and identify clinically meaningful change in health-related quality of life (QoL). Two broad methods are available: (i) anchor-based methods; and (ii) distribution-based methods. The first approach has been used to determine clinically meaningful change by comparing QoL measures to other phenomena with clinical relevance. The second approach is based on the statistical characteristics of the sample and measurement precision. Jacobson and Truax [3] proposed that individuals should be considered improved or deteriorated only when they fulfilled both the anchor-based (i.e. CS) and the distribution-based (i.e. RC) criteria for change.
For Crosby et al. [25] an integrated model to determine clinically meaningful change should also consider the initial severity of impairment: an outcome of RC is different for a patient who showed marked impairment at baseline (i.e., HoNOS<12) and a patient with better conditions (i.e., HoNOS<12) (Fig. 3). An integrated model should consequently have some means of classifying and quantifying baseline severity.
Audin et al. [16] calculated the threshold for CS change for HoNOS as the mean baseline score plus the mean discharge score, halved. We used a classification of severity to single out the group of most severe and the group of subclinical patients so as to bypass the collection of normative data from a general population sample and to establish cut-off scores which were more sensitive to change and more able to pick up improvement or worsening in a severe service-user population.
Schauenburg and Strack [5] tried to apply the strategy proposed by Tingey et al. [24] to multiple clinical groups (inpatients and outpatients) using the Symptom Checklist-90-R; baseline scores did not differentiate clearly enough between inpatients and outpatients to be able to establish a cut-off. The strategy adopted in the present study may be preferable, because it takes into account clinical groups that have been differentiated on a score basis.
Matthey [6] calculated RCSC in postnatal depression using the Edinburgh Postnatal Depression Scale; he proposed using the RC index to detect improvement or deterioration and both the RC index and CS change to establish recovery. In the present study, we took a step forward by adopting RC to indicate improvement or deterioration and RC plus CS change to establish clinical improvement or deterioration (cut-off1) and remission or recurrence (cut-off2). The method takes into account different degrees of change in the direction of either improvement or worsening.
Another important issue is the method of visualizing clinical significance (Fig. 2); horizontal and vertical cutoff scores are useful to place patients' current health state into ranges relationed to their baseline condition. As shown in Fig. 3, RCSC in a subgroup of severe patients was also explored. The advantage of evaluating improvement or worsening in a more homogeneous sample of subjects is that the RCSC model becomes more sensitive to change (RC is smaller and the CS cut-off is higher).
The overall tendency toward stability shown by our analysis is not surprising. The RC was high both in the total population and in the subgroup of most severe patients, as the total HoNOS score reliability was low (0.73, Cronbach's α). Moreover, the study designwas not meant to detect specific changes in a cohort of patients; we just applied the RCSC method to routine data collection. Moreover, we cannot assume that the changes in the patients with follow-up data were the same of those without; patients who recovered, for example, might not have been evaluated twice in 2000, so remissions may be underestimated.
Psychometric scales summarize results in total scores which are useful not only in experimental and epidemiological studies but also for clinical purposes. However, HoNOS is a group of scales that covers different dimensions of mental illness and the use of a total score to detect RCSC could be questionable.
The external validity of the classification of severity proposed by Lelliott [20] has still to be shown, so the validity of CS cut-offs as anchor-based criteria must be confirmed in order to adopt the normative data in future outcome studies.
This research was carried out in the everyday environment of CMHS, thus the findings may be considered ‘practice-based’ evidence. Although the aim was to identify criteria for RCSC, the method we applied and its visual representation is helpful to illustrate the overall pattern of a service-user population in order to draw attention, for instance, to patients at risk of relapse (patients who showed a deterioration that was reliable but not CS).
The methodological framework we propose allows to compute outcome data that takes account of the actual change of individual patients and that could be used both to monitor services' performances and to evaluate the effectiveness of psychiatric interventions.
Future research should be aimed at analysing the balance between the specificity and sensitivity of this model and at testing the external validity of the severity criteria used.
Footnotes
Appendix
The SE of a measurement of a difference is calculated as:
where SD1 is the standard deviation of the baseline observations and α is Cronbach's coefficient.
The RC index is calculated as:
The CS ‘cut-off’ point is calculated as:
where meanclin and meannorm are the mean scores of the ‘dysfunctional population’ and the ‘functional population’, respectively and SDnorm and SDclin are the standard deviations of the scores in these two groups.