
Abstract
Keywords
Both Australia and the UK have recognized the importance of assessing the performance of their mental health services, and have made efforts to systematize outcome measurement. Much of the discussion about routine outcome measurement has revolved around the rationale for measuring mental health services’ performance [1–3] and ways of bringing clinicians and managers ‘on board’ to maximize data quality [4]. Consideration has also been given to which specific measures to use [5–7]: Australia uses a suite that has the Health of the Nation Outcome Scales (HoNOS) family of measures at its core; the UK has favoured the HoNOS family and the Clinical Outcomes in Routine Evaluation–Outcome Measure (CORE-OM) [1, 8]. Surprisingly little emphasis has been given to how best to analyse routine outcome data in order to determine how services are performing. As part of a broader body of work on developing key performance indicators of effectiveness [9], we examined different statistical models and explored how effective or ineffective services may appear, depending on which is used.
Method
As noted, routine outcome measurement in Australian mental health services relies heavily on the HoNOS [10, 11] and its child and adolescent and older person equivalents, the HoNOSCA [12, 13] and the HoNOS65+ [14]. These instruments assess mental health and social/behavioural functioning: the HoNOS and HoNOS65+ via 12 items and the HoNOSCA via 15. Each item is rated on a 5 point scale from 0 (no problem) to 4 (severe to very severe problem), yielding item, subscale and total scores (Table 1). All three instruments demonstrate adequate or good validity and reliability [6].
Items, structure and scoring for the HoNOS/HoNOS65+ and HoNOSCA†
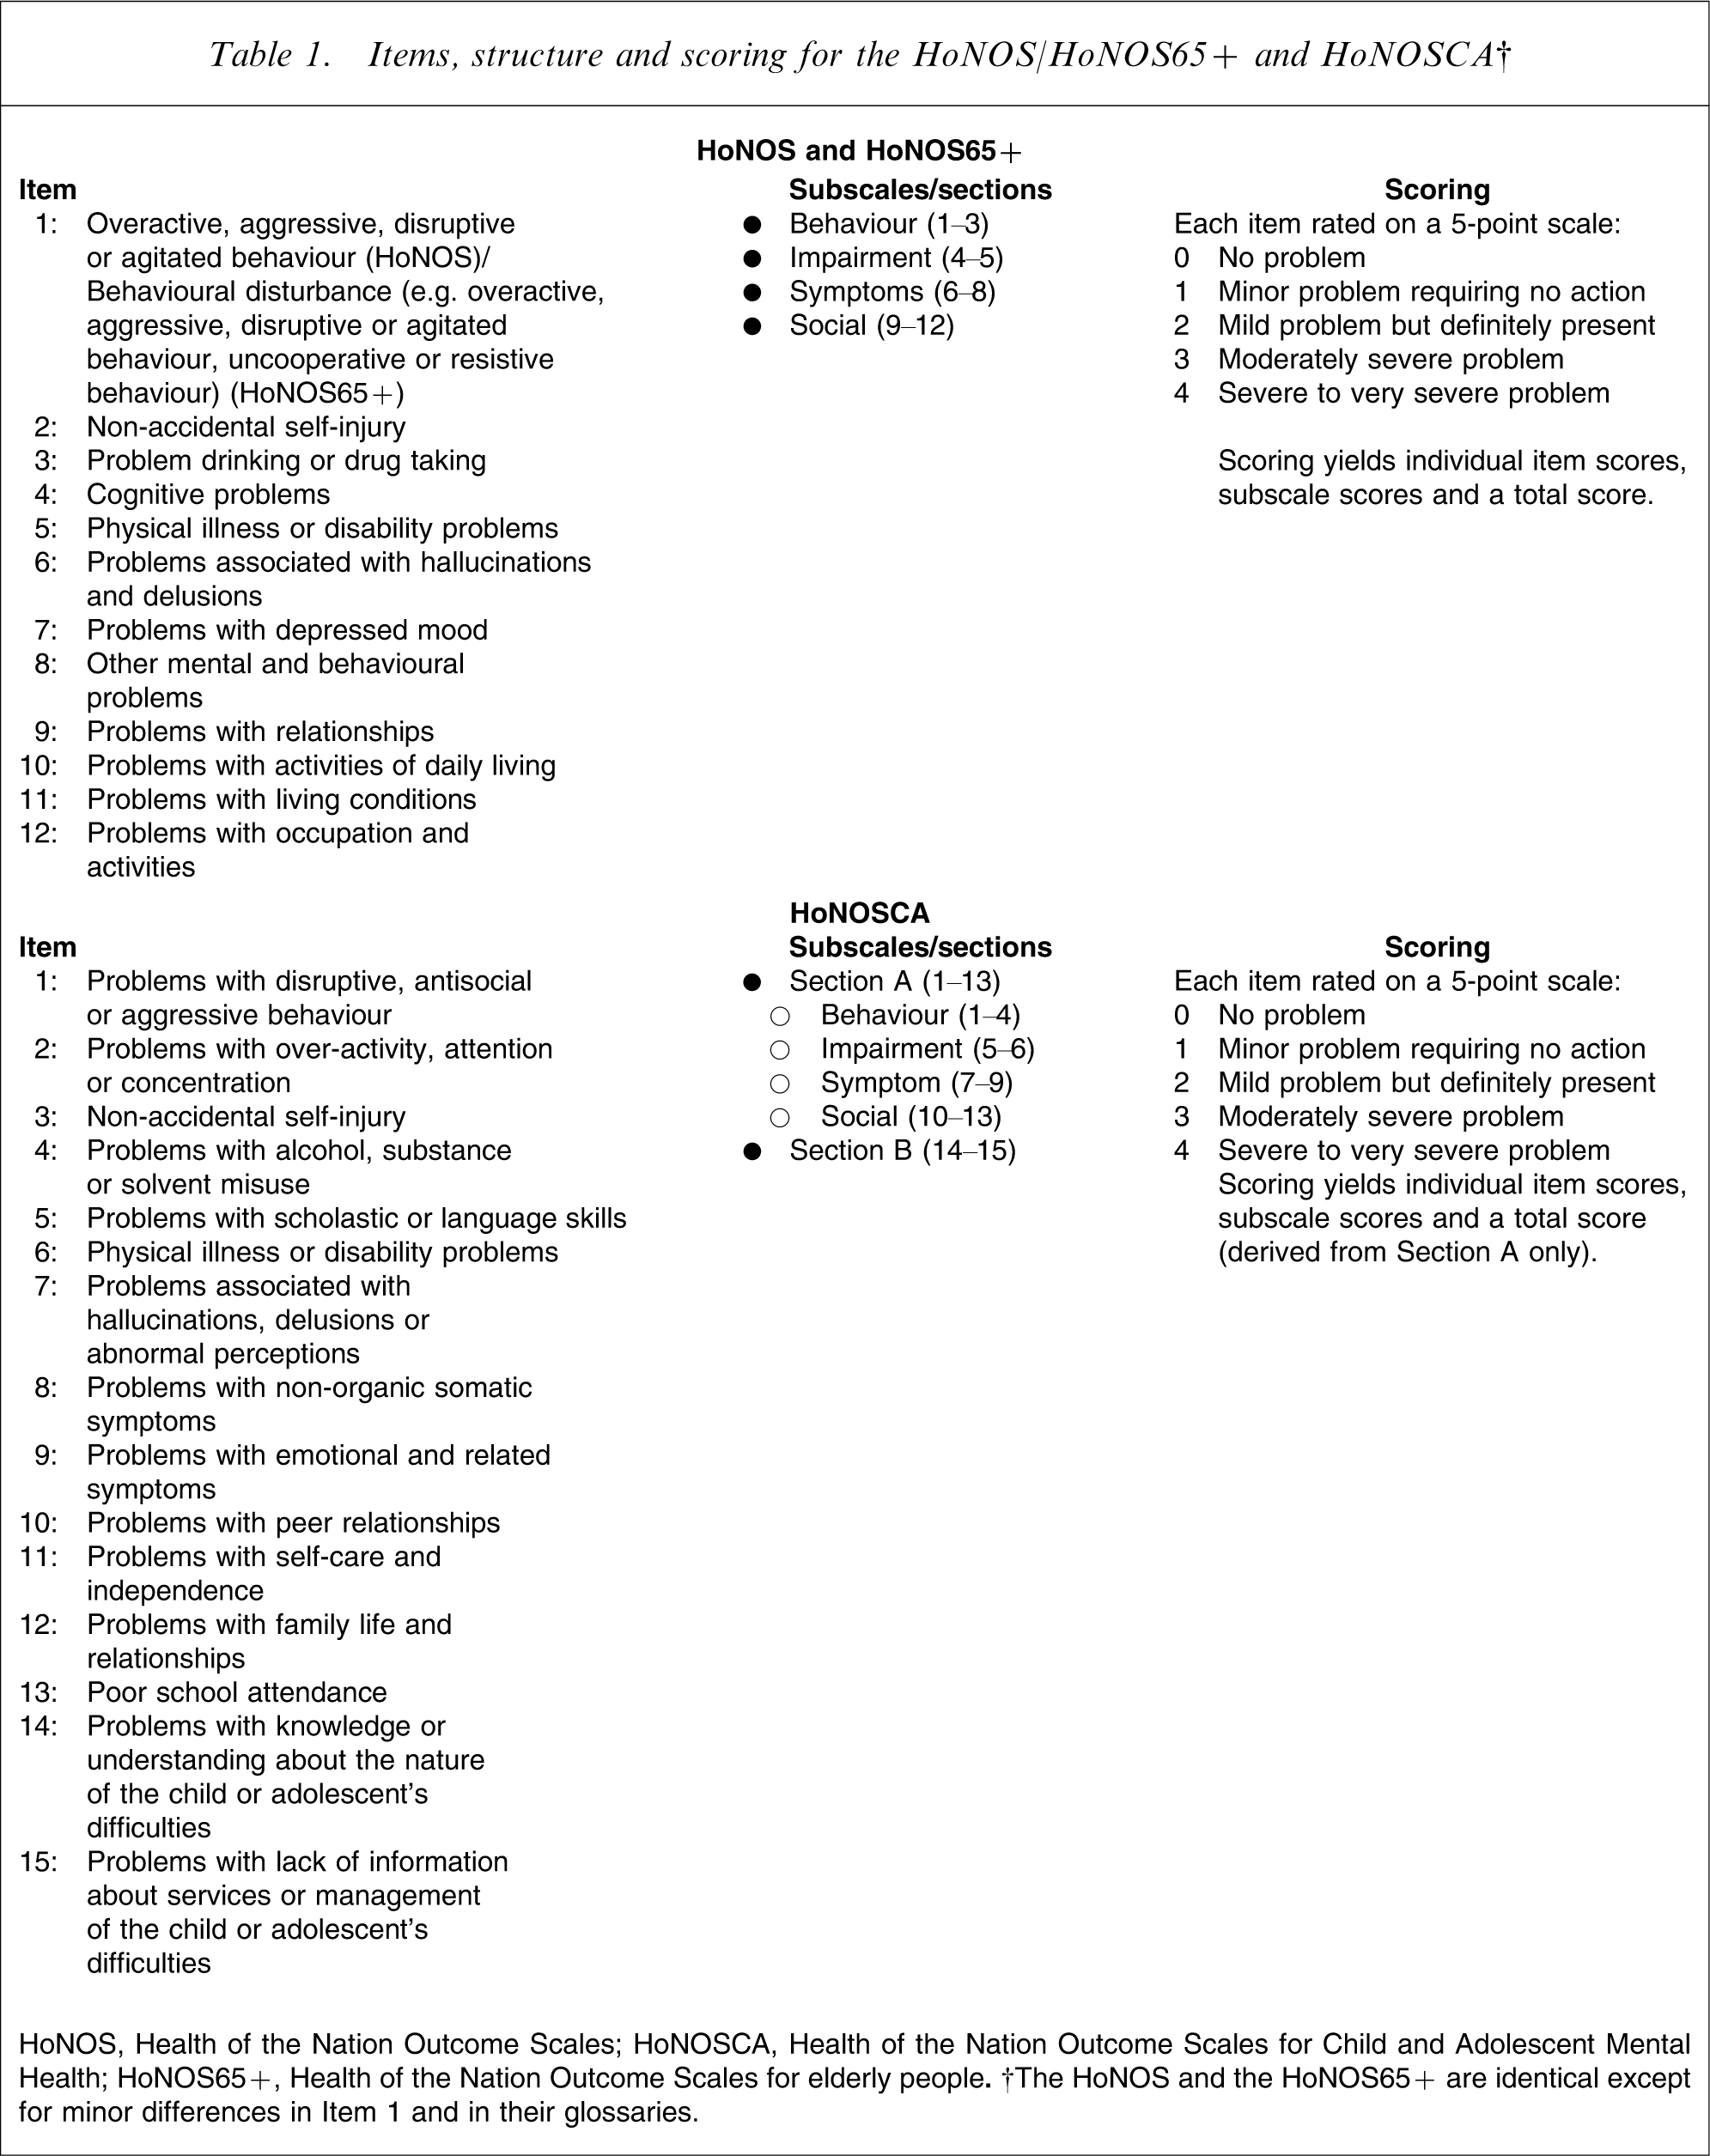
HoNOS, Health of the Nation Outcome Scales; HoNOSCA, Health of the Nation Outcome Scales for Child and Adolescent Mental Health; HoNOS65+, Health of the Nation Outcome Scales for elderly people. †The HoNOS and the HoNOS65+ are identical except for minor differences in Item 1 and in their glossaries.
Clinicians administer these and other instruments at specified collection occasions (i.e. at admission, 91 day review and discharge) in public-sector inpatient and ambulatory settings across Australia, under what is known as the Mental Health National Outcomes and Casemix Collection (MH-NOCC) protocol (www.mhnocc.org). This creates opportunities for examining the outcomes of given periods of care (i.e. care provided between particular collection occasions) in particular settings for particular groups, for example from admission to discharge in acute inpatient settings for adults. We have reported these data at a national level in a variety of forms [15].
We used MH-NOCC data from acute inpatient settings and ambulatory settings from the 2006–2007 financial year. In the case of inpatient data, we considered admission–discharge collection occasion pairs, which can be regarded as special periods of care that also constitute completed episodes of care. These accounted for the majority of all periods of care in the acute inpatient setting, reflecting the fact that most episodes of care in this setting are relatively short. In the ambulatory setting several other periods of care were relatively common, reflecting the fact that many patients have episodes of care that are much longer. For this reason, in the case of ambulatory data only, we also considered consecutive admission–review and review–review collection occasion pairs, which can be regarded as periods of care within ongoing episodes of ambulatory care. Reviews are undertaken after every 91 days in care; and it is possible for an individual patient to have more than one 91 day review within the 12 month study period. Ambulatory review–discharge collection occasion pairs were ignored on the grounds that they could have been preceded by an admission only or by any number of earlier reviews, due to the often long-term nature of ambulatory care; that is, they were potentially more heterogeneous than other collection occasion pairs. Collection occasion pairs were included in the analysis if they had valid clinical ratings for each of their constituent collection occasions. For the 12-item HoNOS and HoNOS65+, this meant that at least 10 items had to have been completed; for the 15-item HoNOSCA, it meant that at least 11 of the first 13 items had to have been completed. Table 2 summarizes the total number of valid collection occasion pairs available for analysis; shaded cells represent the data that were actually used in the analysis.
Valid collection occasion pairs available for analysis
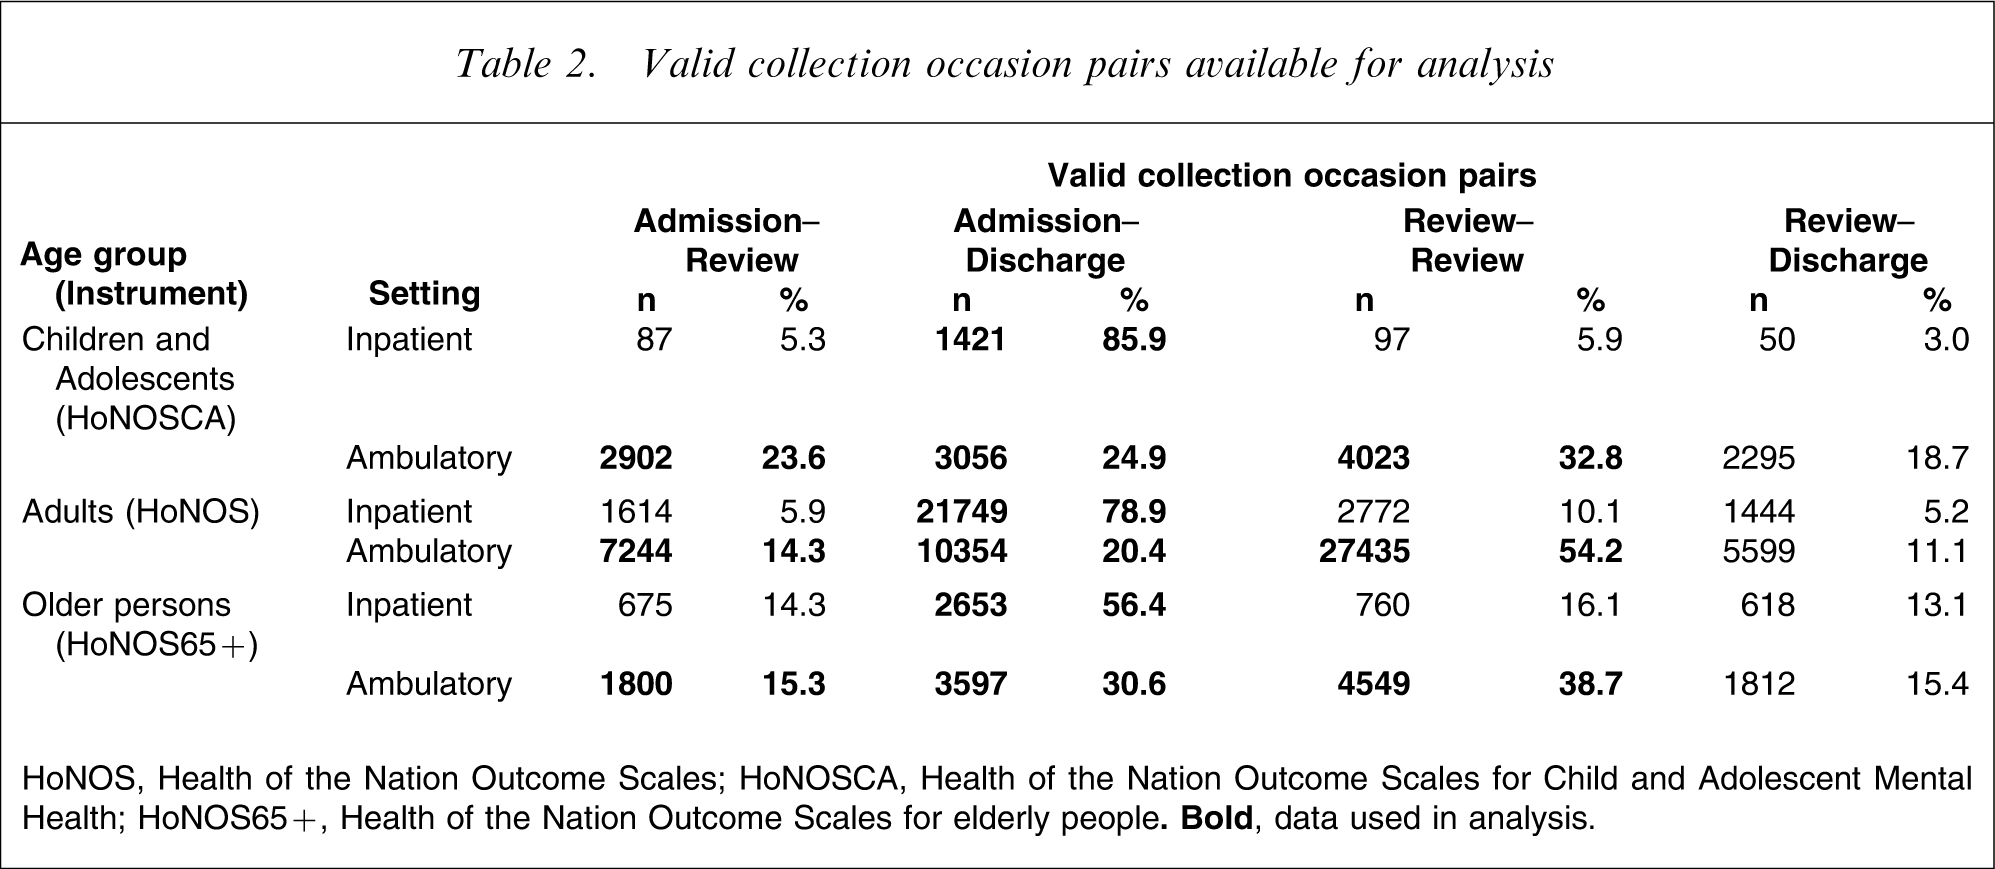
HoNOS, Health of the Nation Outcome Scales; HoNOSCA, Health of the Nation Outcome Scales for Child and Adolescent Mental Health; HoNOS65+, Health of the Nation Outcome Scales for elderly people.
We explored three approaches to measuring effectiveness, namely effect size (ES), reliable change index (RCI) and standard error of measurement (SEM). These were selected on the basis of their being the most commonly cited in studies using the HoNOS family of measures. Each approach is described as follows.
Effect size
The ES statistic was developed by Cohen to assess the magnitude of a treatment effect [16]. It is based on the ratio of the difference between pre-test and post-test scores to the standard deviation of the pre-test score. Cohen's rule of thumb tends to be used to interpret ESs, with ESs of 0.2 considered small, 0.5 considered medium and 0.8 considered large. We explored both medium and large ESs.
Reliable change index
The RCI, developed by Jacobson and Truax, calculates whether the magnitude of change is statistically reliable [17]. Specifically, it subtracts the post-test score from the pre-test score and divides the result by the standard error of the difference. If the final figure is >1.96, change is regarded as statistically reliable at the 95% confidence level. The equivalent figures for lower levels of confidence are 1.65 (90%), 1.28 (80%) and 0.97 (67%). We set confidence limits for RCI at all four levels.
Standard error of measurement
The SEM has been advocated by McHorney and Tarlov as a means of examining individual change on health-related quality of life instruments [18]. The SEM is the standard deviation of an individual score, calculated by multiplying the standard deviation for a given sample by the square root of 1 minus its reliability coefficient.
We estimated relevant parameters (i.e. means, standard deviations, standard error of difference scores, and reliability as estimated by Cronbach's α) for total scores on the HoNOS family of measures, and used them to determine ‘significant change’ thresholds for each of the seven models described: ES–medium; ES–large; RCI–67%; RCI–80%; RCI–90%; RCI–95%; SEM), using the relevant formulae. We did this separately for each of the three collection occasion age groups as prescribed by the MH-NOCC protocol (i.e. children/adolescents, adults, and older persons), specific to each of the two mental health service settings (i.e. inpatient and ambulatory settings). This enabled us to determine change score thresholds for ‘significant change’ on the relevant measure for each age group and setting combination. Positive change scores at the threshold or above were classified as ‘significant improvement’; negative change scores at the threshold or below were classified as ‘significant deterioration’; change scores between these two limits were classified as ‘no significant change’. So, for example, if the threshold was set at 4, change scores of +4 or above were regarded as significant improvement, change scores of −4 or below were regarded as significant deterioration, and change scores of between −3 and +3 were regarded as no significant change.
We then applied the derived thresholds to each individual patient's change score for any given episode or period of care, and aggregated the results to determine the proportion of episodes or periods of care in which there was significant improvement, significant deterioration and no significant change. We did this separately for each collection occasion pair, age group and setting combination.
Results
Table 3 shows the proportion of admission–discharge periods of care in which significant improvement (and no significant change and significant deterioration occurred) in the inpatient setting, broken down by age grouping. Tables 4–6 provide the equivalent data for admission–discharge, admission–review and review–review periods of care in the ambulatory setting.
Models of significant change from admission to discharge in acute inpatient settings
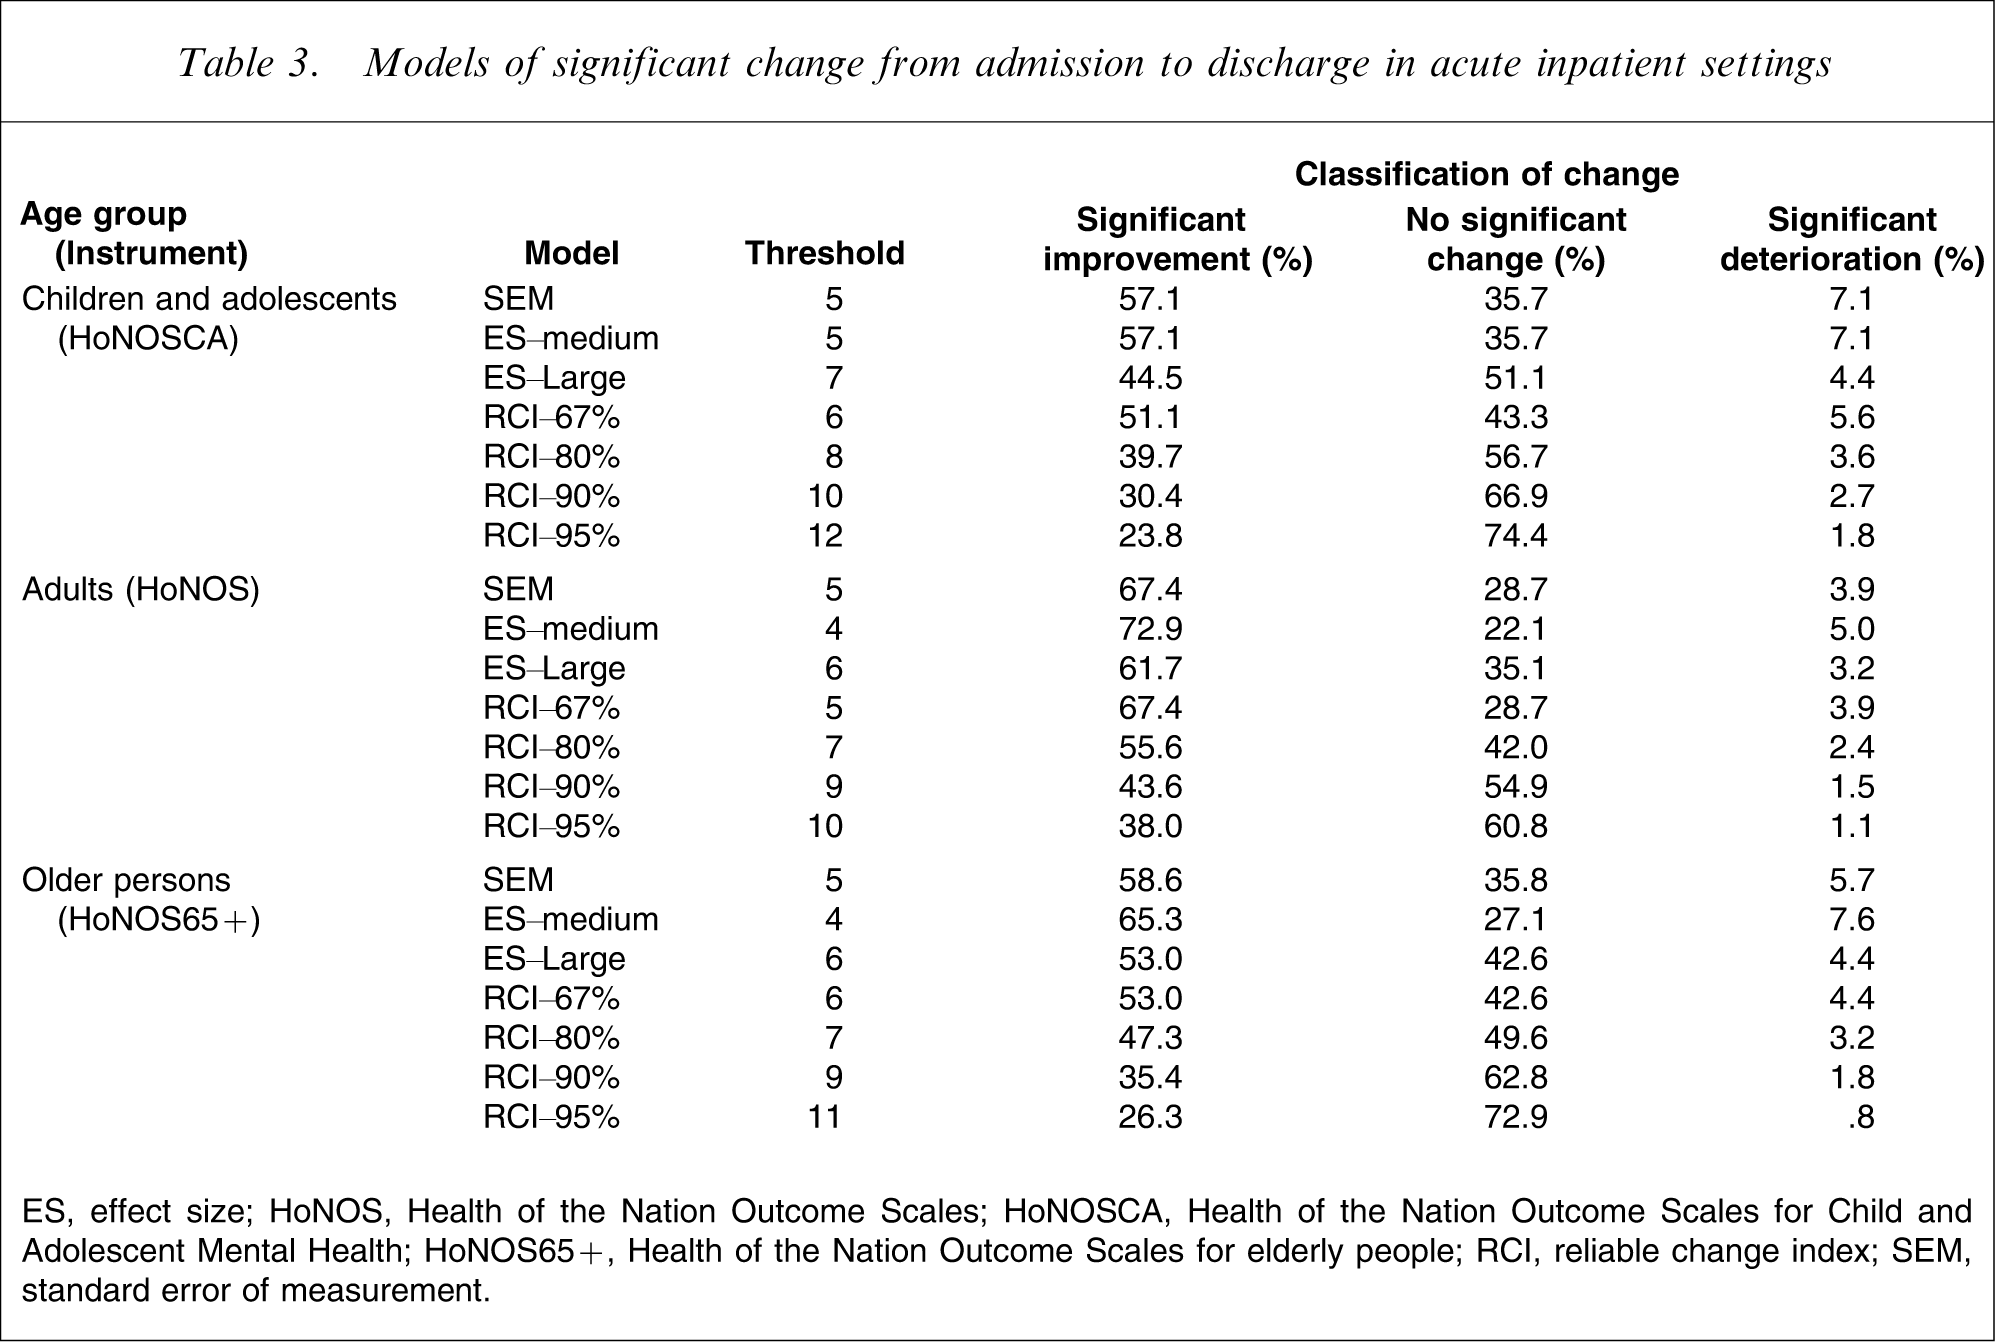
ES, effect size; HoNOS, Health of the Nation Outcome Scales; HoNOSCA, Health of the Nation Outcome Scales for Child and Adolescent Mental Health; HoNOS65+, Health of the Nation Outcome Scales for elderly people; RCI, reliable change index; SEM, standard error of measurement.
Models of significant change from admission to discharge in ambulatory settings
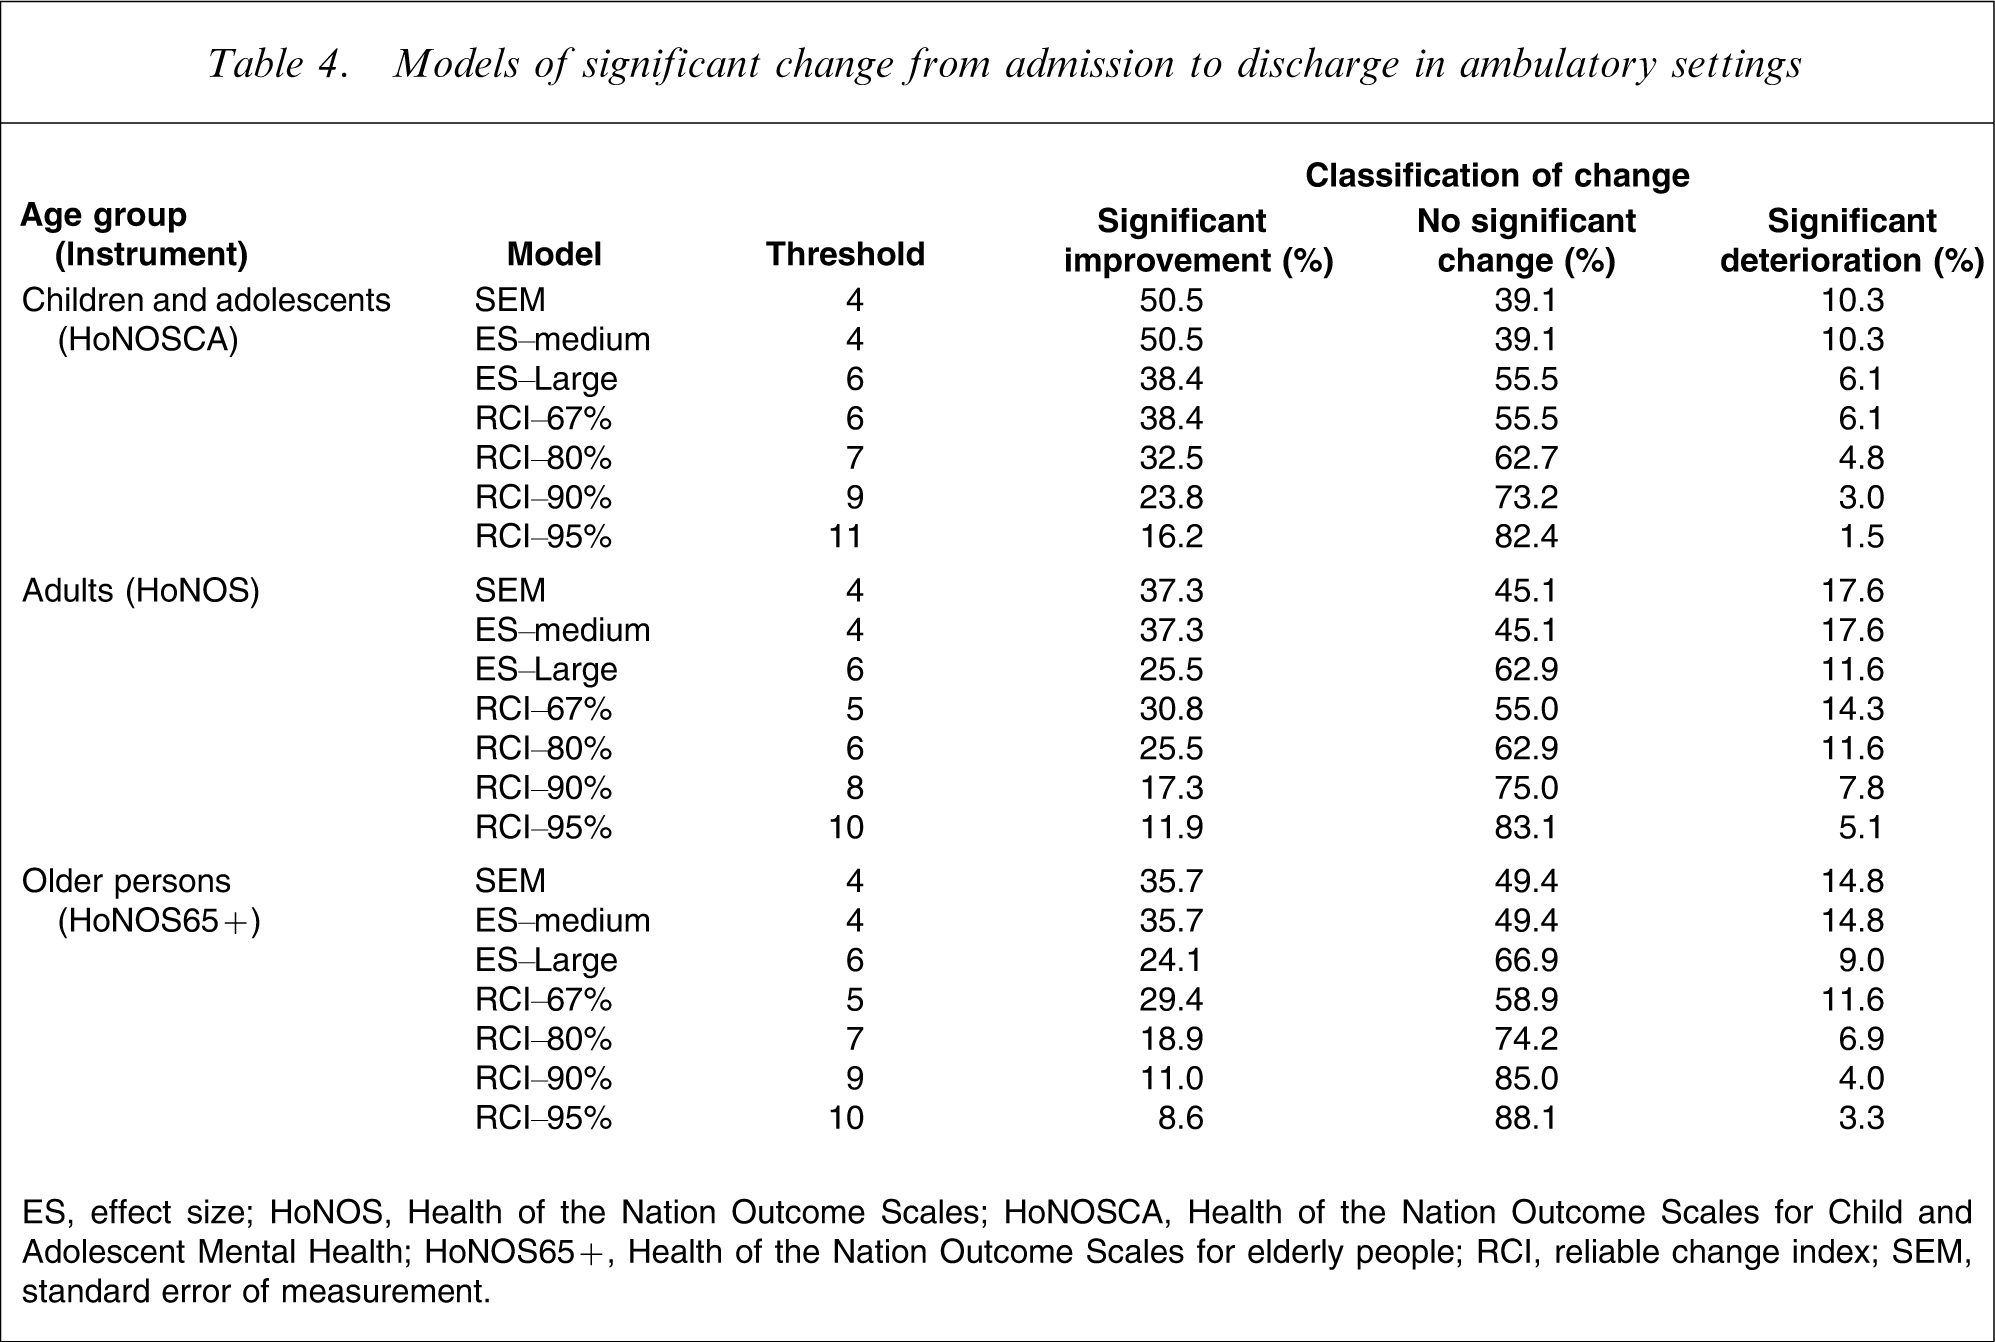
ES, effect size; HoNOS, Health of the Nation Outcome Scales; HoNOSCA, Health of the Nation Outcome Scales for Child and Adolescent Mental Health; HoNOS65+, Health of the Nation Outcome Scales for elderly people; RCI, reliable change index; SEM, standard error of measurement.
Models of significant change from admission to review in ambulatory settings
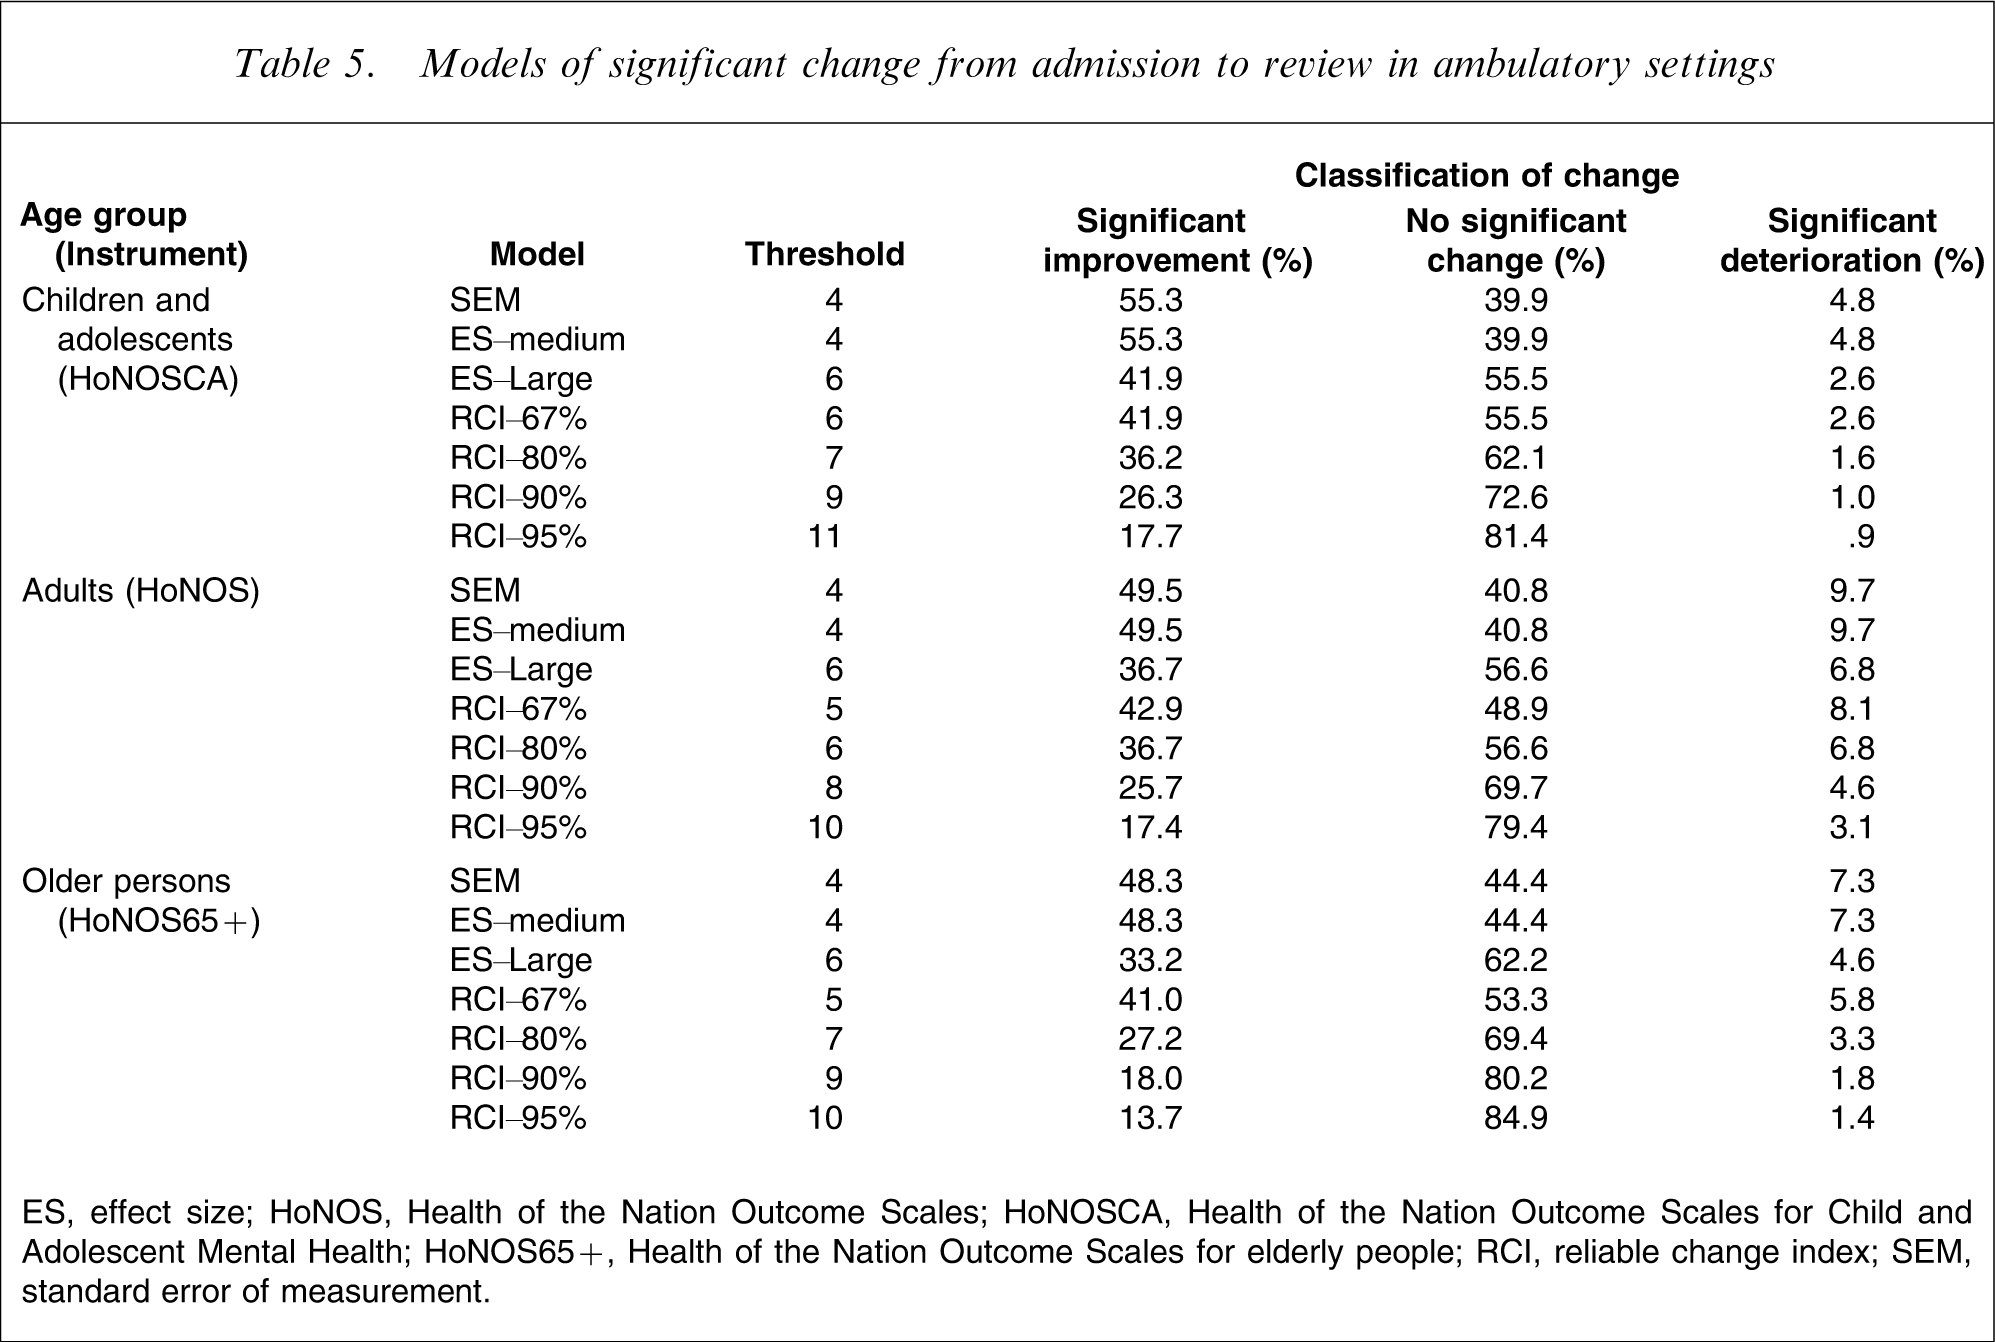
ES, effect size; HoNOS, Health of the Nation Outcome Scales; HoNOSCA, Health of the Nation Outcome Scales for Child and Adolescent Mental Health; HoNOS65+, Health of the Nation Outcome Scales for elderly people; RCI, reliable change index; SEM, standard error of measurement.
Models of significant change from review to review in ambulatory settings
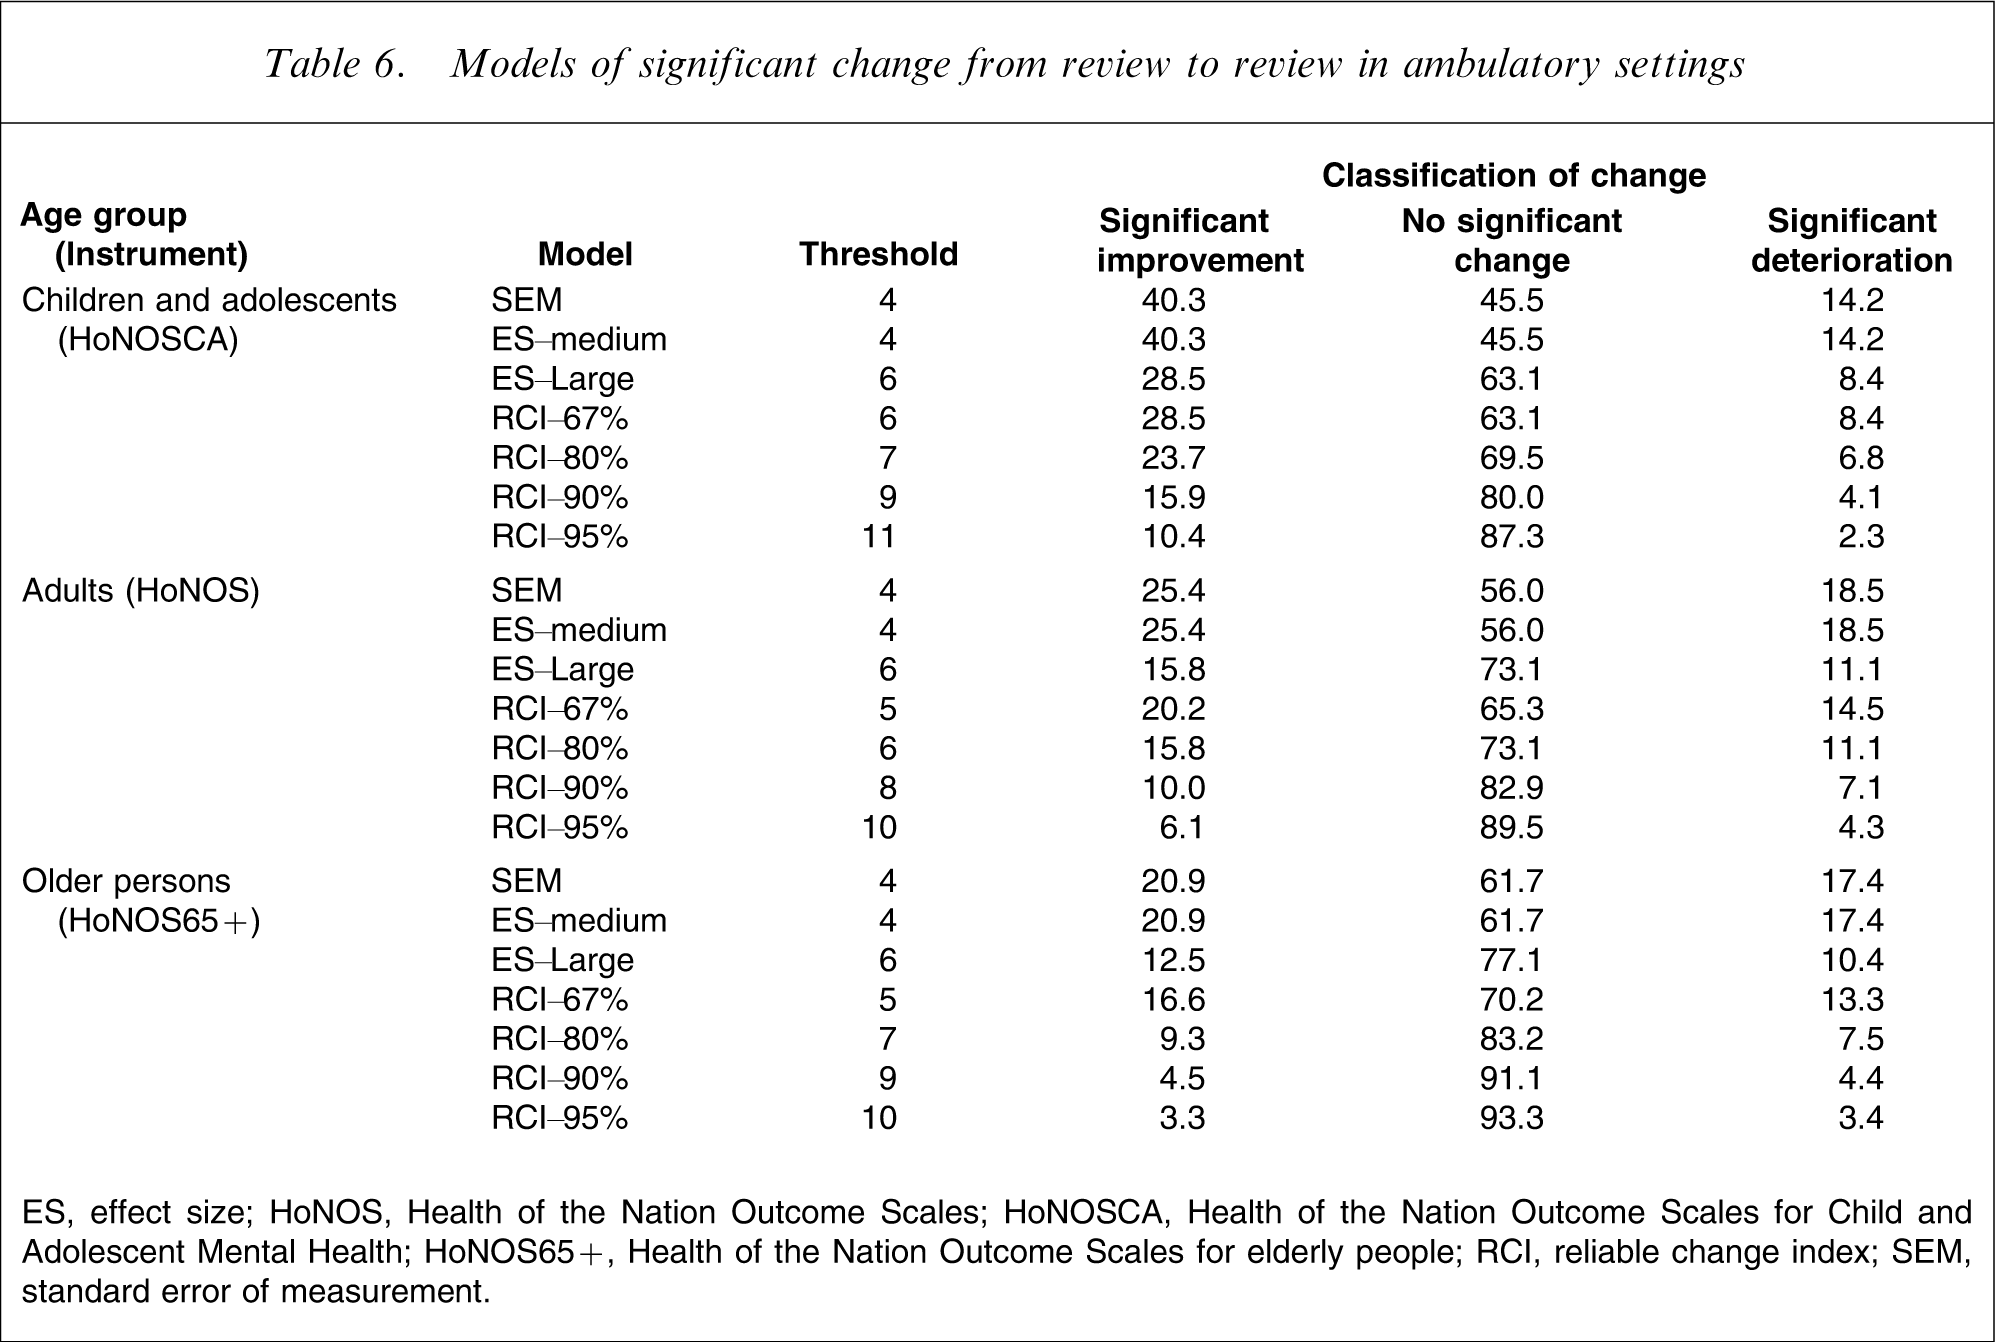
ES, effect size; HoNOS, Health of the Nation Outcome Scales; HoNOSCA, Health of the Nation Outcome Scales for Child and Adolescent Mental Health; HoNOS65+, Health of the Nation Outcome Scales for elderly people; RCI, reliable change index; SEM, standard error of measurement.
The most conservative result is produced by the use of the RCI. This yields a threshold change score of 11 for the HoNOSCA and one of 10 for the HoNOS and HoNOS65+, and results in only 23.8% of inpatient admission–discharge periods of care showing significant improvement for children/adolescents, and only 38.0% and 26.3% doing so for adults and older persons, respectively. The equivalent figures are even lower for the three periods of care in ambulatory settings: universally <17% from admission to discharge, <18% from admission to review, and <11% from review to review. By definition, these proportions improve with the more relaxed confidence intervals around RCI.
At the opposite end of the spectrum, ES–medium and SEM produce the most positive results. In almost all instances, these two statistical approaches yield identical, lenient thresholds of 4 or 5. Where there is a discrepancy, the ES–medium statistic is slightly higher. By these metrics, 57.1% of inpatient admission–discharge periods of care show significant improvement for children/adolescents, 67.4% or 72.9% do so for adults and 58.6% or 65.3% do so for older persons. The equivalent figures are also relatively high for the three periods of care in ambulatory settings, regardless of age group: universally >35% from admission to discharge; >48% from admission to review; and >20% from review to review. The ES–large results are more conservative than the ES–medium results (again by definition), and generally sit fairly close to the RCI–67% results.
Discussion
Previous studies have used a variety of statistical indicators in analysing data from the HoNOS family of measures, sometimes in combination. For example, Audin et al. used both the ES statistic and the RCI in an examination of changes in HoNOS scores for patients in psychotherapy and psychological treatment services in the UK [19]. To our knowledge the present study is the first to pit different indicators of change against each other. The present results clearly indicate that in any routine outcome measurement exercise, the degree of effectiveness demonstrated by services will depend on the specific statistical indicator used to judge effectiveness. Specifically, demonstrating good performance will be easiest for services if the ES–medium or SEM statistics are used, and hardest if the RCI is used.
It is not the purpose of the present study to recommend one statistic over another – all three are sensitive to change, simple to use and applicable across a range of outcome measure data. It is worth, however, highlighting some of the issues that should be taken into consideration in making such a choice. Eisen et al. have described the advantages and disadvantages of the three methods [20], and we provide a summary here. ES is a well-established metric that offers a means of assessing clinically significant change in a relatively objective fashion, because Cohen's medium ES has been shown to equate to a degree of change that could be observed by an independent party. The disadvantage of ES is that it does not address issues of measurement error, making the implicit assumption that observed clinically significant changes are statistically reliable. The RCI overcomes this problem by explicitly determining whether the magnitude of any observed change is statistically reliable, using the kinds of confidence limits that we proposed here. But it then requires a second step to determine whether a reliable change is also a clinically significant one, and this relies on a comparison with relevant population norms. SEM makes allowances for measurement error, through the use of the reliability coefficient in its formula. It also permits an assessment of whether a statistically reliable change is clinically meaningful, because one SEM has been consistently shown to correspond to ‘clinically important’ change.
It is worth noting that all three of the approaches described here are distribution-based methods. Strictly speaking, they therefore rely on change scores being normally distributed, but in practice this assumption is rarely met [21]. We considered transforming the data and/or including non-parametric tests in our range of approaches to deal with this, but rejected the idea on the grounds that it would not have reflected practice in the clinical world or in the scientific literature. More than 100 papers have been published on the HoNOS family of measures, and almost all have presented data in comparable forms to those used here. A notable exception is a paper by Ecob et al., which considered both non-transformed and transformed HoNOS total scores in a multilevel analysis of variation in ratings, and found little difference between the two [22]. Reporting on transformed data and non-parametric tests is complex, and does not readily lend itself to defining relative thresholds in a manner that would have intuitive appeal to clinicians and managers. We acknowledge, however, that there is a need for further research examining different approaches to dealing with skewed outcome data.
Over and above the specific issues to do with indicator selection, and notwithstanding the issue of whether assumptions of normality are met, there are some general principles that should apply in assessing relative levels of effectiveness. In particular, care must be taken to ensure that like is being compared with like. Expectations of change will differ from setting to setting. For example, a reasonable degree of improvement would be anticipated during an average acute inpatient admission, whereas maintenance of current levels of symptomatology and functioning might be a more reasonable goal, at least for some, in ambulatory settings. Expectations of change will also vary within settings, depending on individual person-based factors such as diagnosis, level of severity of presenting symptoms and so on. Appropriate stratification techniques will be required to deal with setting-based expectations of change, and suitable risk adjustment strategies will be necessary to ensure that person-based factors are taken into account.
Routine outcome measurement has the potential to answer a range of crucial performance-related questions (e.g. does Service X perform better or worse than service Y; are the services in area A more effective than those in area B), but only if the same metric is used. Discussion of the appropriate statistical approach to take to facilitate cross-service, cross-area and even cross-national comparisons warrants the same degree of attention as has previously been afforded to consideration of which outcome measures to use.