
Abstract
A mining complex can include multiple mines, stockpiles, waste dumps and processing facilities. Traditional optimization approaches are often based on sequential optimization of the various components in the mining complex leading to suboptimal solutions. They also do not account for uncertainty in critical inputs, resulting in misleading forecasts. This paper presents an application of a stochastic framework that simultaneously optimizes mining, destination and processing decisions for a multi-pit, multi-processor gold mining complex. The framework accounts for supply and market uncertainty via stochastic orebody and commodity price simulations as inputs to a unified optimization model. The case study notably assesses the impacts of integrating market uncertainty as input that influences all components of the production schedule. Additionally, cut-off grade decisions are determined by the simultaneous optimization process, considering material variability and operating constraints while reducing the number of a-priori decisions to be made. This approach generates solutions that capitalize on the synergies between extraction sequencing, cut-off grade optimization, blending and processing while managing and quantifying risk in strategic plans, which ultimately leads to more metal production and higher net present values.
Keywords
Introduction
A mining complex is a resource to market mineral value chain that transforms in-situ materials into valuable products such as concentrate, pellets, bars of precious metals, and others (Montiel and Dimitrakopoulos 2015). The main components of a mineral value chain are generally: mines, stockpiles, waste dumps, mineral processing facilities, and logistics hubs (ports and railways for example) (Pimentel, Mateus, and Almeida 2010). Traditionally, components of the mineral value chain are optimized independently, leading to suboptimal solutions which deteriorate substantially as the complexity of the chain increases (Goodfellow and Dimitrakopoulos 2016, 2017). Simultaneous optimization of a mining complex is an integrated approach where all the components of the chain are optimized simultaneously, leveraging existing synergies towards maximizing the value of an operation (Pimentel, Mateus, and Almeida 2010; Whittle 2010).
Development of frameworks that incorporate multiple components of the mineral value chain into the optimization process began in the mid-1990s. Newmont Mining Corporation recognized the opportunity to leverage synergies present in their expansive Nevada operations. This led to the development of an in-house optimizer based on a mixed integer programming (MIP) formulation to maximize discounted cash flows by simultaneously optimizing material movement from a set of open pit and underground mines to multiple destinations (Hoerger, Seymour, and Hoffman 1999). BHP Billiton followed by developing the Blasor mine planning software, which simultaneously optimizes pushback sequences from multiple pits (Stone et al. 2007). The authors present an application at BHP's Yandi mining complex, an 11 pit, blended iron ore joint venture where Blasor is used to maximize the net present value (NPV) while ensuring market tonnage and material quality targets were respected. Blasor can provide tractable solutions by aggregating spatially connected blocks with similar attributes then sequentially generating near-optimal extraction sequences, ultimate pit, phase designs and finally panel (intersections of benches and phases) extraction sequences (Stone et al. 2007). Zuckerberg et al. (2007) extend the framework to Blasor-InPitDumping, which incorporates optimized waste handling by utilizing sterile mined-out areas. Whittle (2010) describes a global optimizer, designed to incorporate mining, processing and blending components into the optimization process.
While the methods described above improve past approaches, they all have one or more of the following major limitations: aggregation, which misrepresents mining selectivity, stepwise local optimization of value chain components, and failure to account for the effects of uncertainty present in critical parameters. The main sources of risk in a mining project arise from technical, financial and environmental uncertainty (Dimitrakopoulos, Farrelly, and Godoy 2002; Rendu 2017). Furthermore, it has been observed that uncertainty in grades and material types is a significant source of technical risk, referred to as supply uncertainty (also geological). The impact of supply uncertainty on a mining project's ability to meet production forecasts is now a well-studied issue (Ravenscroft 1992; Dowd 1994). Conventional mine planning methods are deterministic, meaning they use a single estimated orebody model as an input to the optimization process; Hustrulid, Kuchta, and Martin (2013) provide a comprehensive review of conventional open pit mine planning practices. Estimated models are incorrectly assumed to be accurate representations of grades and materials in the ground. Instead, they provide overly smoothed representations of attributes of interest (Goovaerts 1997). Uncertainty in mineral deposits is incorporated into the optimization process by stochastic optimization frameworks that use sets of equi-probable stochastic simulations (Goovaerts 1997; Minniakhmetov and Dimitrakopoulos 2017; Minniakhmetov, Dimitrakopoulos, and Godoy 2018) as inputs to stochastic integer programming (SIP) formulations (Ramazan and Dimitrakopoulos 2007; Birge and Louveaux 2011; Ramazan and Dimitrakopoulos 2013). Dimitrakopoulos (2011) provides a review of applications of stochastic optimization in mine planning, noting significant improvements in NPV and metal recovered while managing and reducing technical risk.
Despite the significant influence that market uncertainty, specifically, fluctuations in commodity prices, has on project risk, conventional planning practices assume constant and certain prices. Attempts to overcome this simplification by sensitivity testing different price scenarios a-posteriori are limited in that decisions such as destination policies (cut-off grades), life-of-mine (LOM), capacities and others are fixed. Past efforts at incorporating the joint supply and market uncertainty into the planning process allow some of these decisions to be made while accounting for the uncertainty. Examples of such efforts include assessing the impacts on phase and ultimate pit designs as well as determining cut-off grade strategies, mining rates and capacities (Asad and Dimitrakopoulos 2013a; Asad and Dimitrakopoulos 2013b; Castillo and Dimitrakopoulos 2014; Kizilkale and Dimitrakopoulos 2014; Farmer 2017). Cut-off grade optimization is one of the most important elements in any mining operation, defining the supply of ore and waste material to various destinations throughout the mineral value chain based on economic and technical parameters. It characterizes an operation's destination policy decisions (where to send what material and when). Asad, Qureshi, and Jang (2016) provide a thorough review of cut-off grade optimization (deterministic and stochastic) methods developed for open-pit mining operations. Cut-off grade optimization is conventionally based on Lane's theory on the economic definition of ore (Lane 1988; Rendu 2014) which predefines cut-off grades to be used for life-of-mine production scheduling optimization. This is a limited approach based on the consideration of grade-tonnage distributions and capacities while attempting to maximize NPV. However, cut-off grades determined prior to production scheduling do not account for fluctuations in material availability and quality from one mining period to another and are required only because the technologies used to date for production scheduling optimization are unable to generate the optimal cut-off grades as an output of the truly optimal life-of-mine production schedule. This has been the case for several decades and is a limitation addressed by the new digital technologies and simultaneous optimization of cut-off grade policies in conjunction with extraction sequencing and processing stream decisions, proposed in this work and along the resource to market mineral value chain.
Recent developments have extended the two-stage SIP models reviewed by Dimitrakopoulos (2011) to the simultaneous stochastic optimization of mining complexes (Montiel and Dimitrakopoulos 2015; Goodfellow and Dimitrakopoulos 2016; Montiel, Dimitrakopoulos, and Kawahata 2016; Goodfellow and Dimitrakopoulos 2017; Montiel and Dimitrakopoulos 2017, 2018). These state-of-the-art frameworks integrate the optimization of extraction sequences, destination policies, processing streams, operating modes and transportation alternatives for multiple sources and processors simultaneously in a single mathematical formulation. The contributions above move away from linear optimization models to incorporate more realistic stockpiling decisions and non-linear interactions in processing streams. These are enabled by a significant departure from conventional mine optimization practices, such as the economic value of blocks as a driving force in optimization. The practice of valuing material by calculating the economic value of mining blocks pre-extraction, assumes that the concept of independent blocks remains intact as the material is transformed throughout the value chain and is not able to consider changes in the value of material due to blending or other downstream non-linear interactions (Goodfellow and Dimitrakopoulos 2016). Thus, simultaneous stochastic optimization shifts the focus from optimization with the economic value of blocks to the economic value of products sold at the end of the mineral value chain, removing the need for a-priori cut-off grade optimization. A major benefit of Goodfellow and Dimitrakopoulos (2016) is that the model is highly generalized, allowing for extensions to a large variety of applications. However, it does not incorporate specific transportation alternatives or operating modes as Montiel and Dimitrakopoulos (2015) or supply from an underground mine as Montiel, Dimitrakopoulos, and Kawahata (2016). Farmer (2017) extends the generalized model to include capital expenditure (CapEx) and mining capacity decisions in an application with complex revenue streams such as offtake and streaming agreements. It also aims to integrate market uncertainty, but does so in a two-step process that fixes the extraction sequence and optimizes the downstream variables. Del Castillo and Dimitakopoulos (2019) use a dynamic approach to integrate CapEx decisions on the mid-term time horizon. Kumar and Dimitrakopoulos (2019) present another application of Goodfellow and Dimitrakopoulos (2016) with complex geo-metallurgical decisions incorporated into the destination policy at a large copper–gold mining complex.
This work presents an application of the simultaneous stochastic optimization framework from Goodfellow and Dimitrakopoulos (2016) at an intricate Nevada type gold mining complex with strict geochemical blending constraints. Notably, this work explores the effects of joint market and supply uncertainty scenarios by using commodity price simulations as inputs to the optimization model, allowing the simultaneous stochastic optimizer to integrate market uncertainty into all three decision variables. Additionally, this study examines the effectiveness of the simultaneous stochastic optimization framework's cut-off grade decisions by considering the value of downstream products, non-linear blending interactions and the extraction sequence. This replaces the need for a-priori cut-off grade optimization using conventional methods and addresses limitations related to determining cut-off grades prior to production scheduling. Due to the blending requirements in the case study, the proposed approach has the additional benefit of reducing the level of operational complexity in the mining complex by significantly cutting down on the number of material types and stockpiles the operation needs to manage.
The next sections provide, a brief description of the optimization model, constraints, and solution approach. Then, a detailed description of the case study, presentation of the results and analysis. Conclusions and future work follow.
Method
This section describes the adaptation of Goodfellow and Dimitrakopoulos (2016) simultaneous stochastic optimization model to the specific application at a large gold mining complex. The general model is configured to accommodate strict geochemical blending constraints related to autoclaving, mineability constraints and market uncertainty.
Definitions and notation
The material in mining complex,  , is extracted from a set of sources (mines),
  . Mines are discretized into selective mining units (SMU) known as mining blocks,
  , where
  denotes the set of mining blocks for a specific mine. The mining cost,
  , represents the cost of mining any block,
  , in period
  . Each block has a set of simulated properties,
  , mineralogical (grades) and geochemical (deleterious elements).
  denotes a set of scenarios (
 ) that quantify the combined uncertainty in grade and related geochemical properties, as well as commodity prices incorporating market uncertainty (when applicable). Material is only available for extraction if all predecessors,
  , of a block
  are extracted. After extraction, material can be sent from locations
  to several destinations such as stockpiles
  , processors
 , or waste dumps
 . The cost of transporting material property
  from a location
  in period
  is denoted
  . The amount of a material property
  at location
  in period
  and scenario
  is
is  . Material properties that can be sent from one destination to another and accumulated, such as ounces, belong to the set
  , while properties that are calculated such as ounces recovered, or element concentrations belong to the set
  . Stockpiles
  are modelled as destinations which can accumulate material and are governed by mass balance type equations which keep track of year-end inventories, a more detailed explanation can be found in Goodfellow and Dimitrakopoulos (2016). Production targets associated with capacities belong to the set
  and those associated with geochemistry belong to
  .
.  represents the cost of processing material property
  at location
  in period
  (including refinery charges).
  Represents the unit selling price of material property
  in period
  and scenario
  . Deviations from a production target associated with property
  at location
  in period
  and scenario
  are measured by
  , while
  represents the unit surplus and shortage costs associated with their respective deviations. Mineability targets, enabled by a set of scheduling constraints, ensure the production schedule is feasible in practice. Blocks that lie within a horizontal ‘window’ around block
  belong to the set
  , blocks that lie vertically above a block
  are denoted
 Represents the number of blocks in the window
  that are mined in a different period from block
  while
while  represents the number of blocks in the set
  that are mined in the same period as block
  . The penalty costs used to enforce the mineability targets on a per block basis in each period are denoted by
  and
and  .
.
Decision variables
There are three types of decision variables that the simultaneous stochastic optimizer can modify to impact the mining complex. Extraction sequence decisions ( ) define whether a block
  , is extracted from mine
  in period
  . Destination policy decisions (
 ) define whether material of grade g is sent to destination
  in period
  . Processing stream decisions
  define what proportion of material is sent from location
  to destination
  in period
  and scenario
  . The destination policy decisions are derived from the robust cut-off grade policies from (Menabde et al. 2018), where a grade distribution is discretized into bins and the optimizer determines the minimum grade bin from which all bins above are sent to a processor. This policy preserves short-term operational flexibility because a block may fall into a different grade bin from one simulation to another, however, the destination decisions governing a group of bins remain scenario independent and delivers outputs that include optimized cut-off grades.
Objective function
The objective function in (Equation (1)) maximizes the value of the products sold from the mining complex and manages risk by minimizing deviations from targets in the value chain.
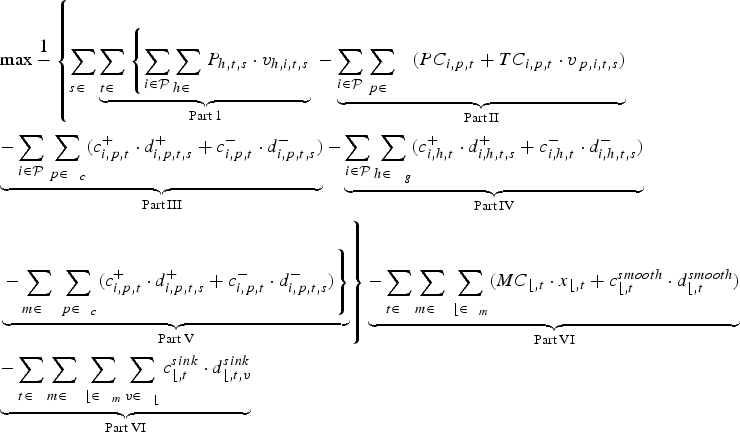
Part I from Equation (1) represents the discounted cash flow derived from products sold. Part II represents the processing costs at the various processors and the transportation costs from each location to the destination. Part's III, IV, and V represent the cost of deviating from processing capacity, geochemical, and mining capacity targets, respectively. Part VI represents the mining cost and the cost of deviating from the schedule smoothness constraints. Part VII represents the cost of deviating from schedule sink rate constraints. All penalty costs for deviating from targets are time varied using a geological discount rate, meaning 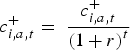 , where
  is the geological risk discount rate, similar to an economic discount rate used in NPV calculations (Dimitrakopoulos and Ramazan 2004). Penalties are set by a user-based empirical approach that generally relies on the order of magnitude for unit cost violations. For more discussions on the determination and impacts of penalty costs the reader is directed to (Dimitrakopoulos and Ramazan 2008; Benndorf and Dimitrakopoulos 2013; Ramazan and Dimitrakopoulos 2013).
Constraints
The transformation of sulphide ore material into gold products in a mining complex is a complicated process that can require pressure oxidation as a pre-treatment to conventional gold recovery circuits. This treatment requires the addition of an autoclave to the process flowsheet. An autoclave is a horizontal cylindrical pressure vessel with multiple compartments that require specific physical and metallurgical controls to ensure effective operation (Cole and Rust 2002). Blending ore material to maintain a feed that respects the autoclaves optimal operating targets is critical its performance. This requires a set of constraints to measure deviations from the geochemical targets of the autoclave feed which are then penalized in Part IV of the objective function in Equation (1). The concentrations of sulphide sulphur and carbonate in the feed are carefully monitored for the autoclaving treatment as well as the total amount of acid added. Acidic slurry is often added to help achieve the necessary pH requirements by reducing the carbonate content of the feed. The recovery of gold from the sulphide ore material is dependent on the organic carbon (OC) concentrations. Consequently, the OC content is also carefully monitored, and a target concentration is included in the objective function. Equations (2) and (3) calculate the deviations from upper and lower targets on feed geochemistry which are penalized in the objective function.


Equations (4) and (5) define the scheduling constraints (smoothing and sink rate) enabling the optimizer to penalize deviations from mineability targets in parts VI and VII in the objective function.

Recall that the smoothing window  is centred around
  in the same units as block dimensions and that
  is used to count the number of blocks scheduled in different periods from
  . If a block is mined in period
  and it is a member of the smoothing window for its adjacent blocks, who are not also scheduled for extraction, then a penalty is incurred in Part VI of the objective function. The smoothing constraint serves a similar purpose to ‘mining width’ constraints used in some commercial mine optimization software. The sink rate constraints allow the optimizer to control the number of blocks mining can advance vertically in any period. Recall that the set
  contains the block that directly overlie
  , this set can contain at most one block,
  where if block
  then block
  and
and  is the sink rate of
  . If
. If  = 1, meaning both blocks
  and
and  are mined in the same period, then
  , otherwise
  , satisfying Equation (5). It follows that the sum of all
  variables represents the number of sink rate constraint violations in the extraction sequence and incurs a penalty Part VII of the objective function. The model is also subject to: capacity, reserve, slope, destination policy, and processing stream flow constraints detailed in Goodfellow and Dimitrakopoulos (2016).
Solution method
Stochastic modelling allows for integrating various sources of uncertainty into the optimization process, however, this also considerably increases the size and complexity of what is already a challenging combinatorial optimization problem. Solution approaches that involve commercial MIP solvers are often not feasible. Metaheuristics provide a practical alternative for solving these models, and many existing metaheuristics have been successfully adapted to the stochastic optimization of mines and mining complexes (Lamghari and Dimitrakopoulos 2016). The solution approach uses a combination of metaheuristic algorithms to solve the model and is described by Goodfellow and Dimitrakopoulos (2016, 2017).
Case study
This section describes and examines the application of the method described herein at a large Nevada style gold mining complex. The results are reported as a probabilistic risk analysis on several key performance indicators (KPIs). In Section 3.2 the cut-off grade optimization component of the simultaneous stochastic optimizer is compared to a base case cut-off grade policy provided by industry partners. In Section 3.3 market uncertainty is integrated into the model and the results are analysed.
Overview of the mining complex
The material in the mining complex is extracted from two open-pit mines and delivered from a set of nearby operations (referred to as external sources). The material can flow through the mineral value chain to three processing destinations (an autoclave, oxide mill, and oxide leach pad), a waste dump, and a set of stockpiles for each material type. Figure 1 shows the components of the mining complex. Supply uncertainty is incorporated by using a set of multivariate geostatistical simulations provided for each mine. A set of simulations is also generated to capture uncertainty in the delivery of material from external sources. The model comprises several million integer variables and several thousand scenarios for evaluation and optimization.
Diagram of the mineral value chain. (Images are available in colour online).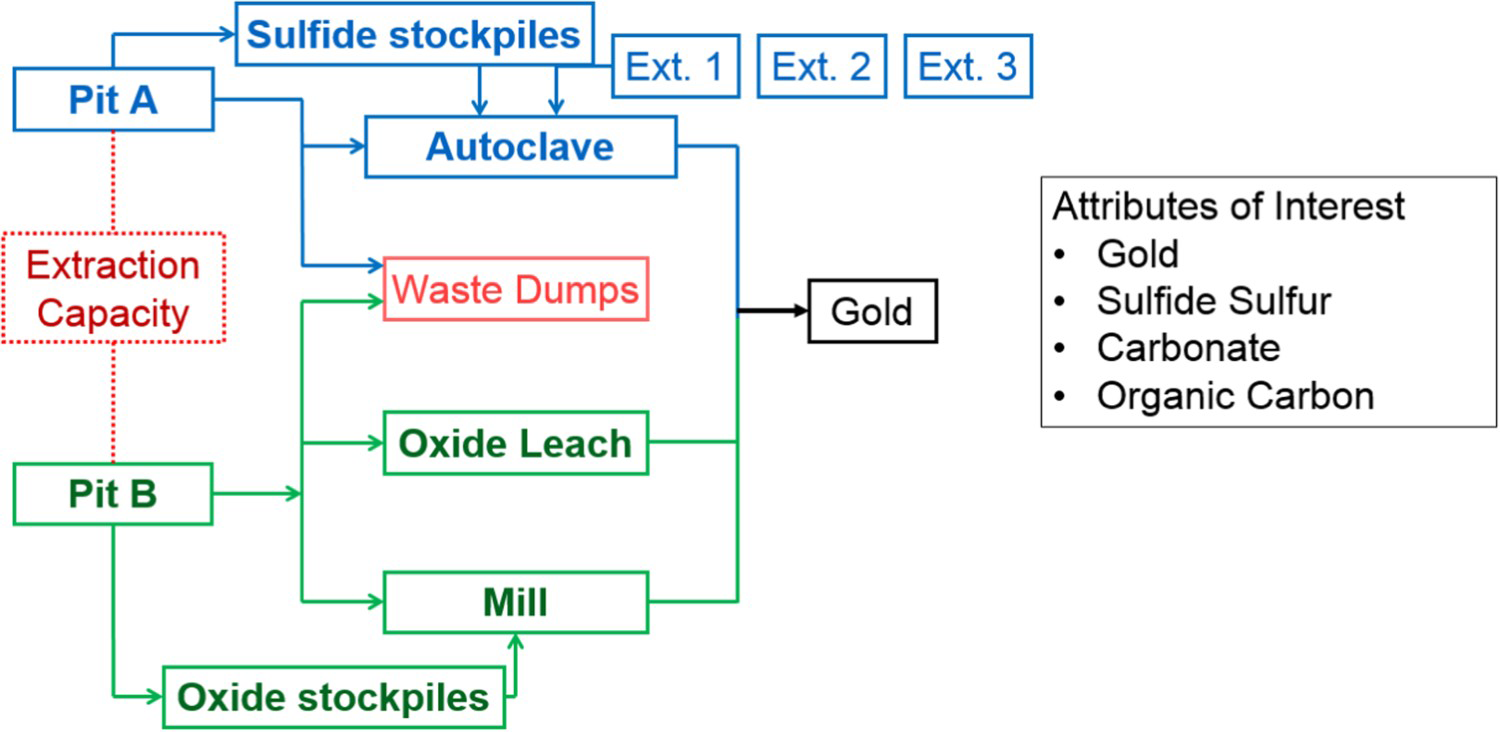
Pits A and B share a mining fleet which defines an upper bound on their joint mining capacity in each period. The simultaneous optimizer defines the allocation of capacity between the two pits in conjunction with other factors such as material supply and needs of related processing streams in order to maximize project value and minimize deviations from operating targets. However, the mining capacity is not a project bottleneck, meaning it does not materially impact processes such as cut-off grade optimization and as such is not included in the discussion of results. High-grade oxide ore extracted from Pit B is processed at the oxide mill, while a heap leach facility processes lower grade oxide ore material. An autoclave processes sulphide ore extracted from Pit A and delivered from external sources. A non-linear recovery function models gold recovery at each of the processing destinations. At the oxide mill and heap leach pad, the recovery function is dependent only on gold grade in the feed. Recovery at the autoclave is governed by gold grade and OC content. The autoclave has a strict set of operating requirements for feed geochemistry to effectively treat the sulphide ore material as mentioned in Section 2.4. The operating efficacy is dependent on several physical and chemical controls to treat the feed for the next phase of metallurgical gold recovery. The geochemical blending and acid consumption necessitated by the process are of particular interest to this study, especially the ratio of sulphide sulphur (SS) to carbonate (CO3) concentrations in the feed.
The sulphide ore material from Pit A is classified into 11 geochemically distinct material types a-priori based on SS, CO3, and OC concentrations. Each material type has its own stockpile. The optimizer determines the gold cut-off grade boundaries for each material type, deciding which grade bins are sent to the stockpiles, the autoclave or the waste dump. The sulphide stockpiles are an important component of the downstream processes. The optimizer utilizes the stockpiles to ensure that the necessary material is available to achieve the desired mill feed geochemistry and throughput in each period. However, the real-life utility of stockpiles is realized more significantly in short-term mine planning to overcome issues related to daily or weekly fluctuations in material characteristics, for that reason a detailed description of year-end stockpile inventories is not included in the following results. The material from Pit B is not concerned with the deleterious elements because they do not affect the metallurgical recovery process that governs oxide ore at the mill or the leach pad. The optimizer determines the gold cut-off grade boundaries for sending material to the waste dump, stockpile, leach pad, or mill. Cut-off grade decisions are optimized simultaneously to maximize the NPV considering the extraction sequence, downstream processing and blending decisions and related constraints. This configuration of the mining complex is referred to hereafter as the ‘simultaneous case’.
The simultaneous case is compared to the ‘base case’ configuration of the mining complex. The base case is also a simultaneous stochastic optimization; however, it is constrained by the destination policy and material type configuration provided by the mining complex's conventional cut-off grade optimization procedure. Each of 11 sulphide material types from Pit A is further divided into a maximum of 5 subgroupings based on gold grades, resulting in 45 sulphide ore material classifications. Eight of these material types are sent to the autoclave directly, while 37 are sent to distinct stockpiles for future reclamation. Oxide material from Pit B is classified as either waste (<0.0088 Au Oz/ton), low-grade (0.0088–0.022 Au Oz/ton), or high-grade (>0.022 Au Oz/ton). Low-grade material is sent to the leach pad, high-grade material is sent to the oxide mill or stockpiled on an ad-hoc basis.
Results and comparisons
Figure 2(a–d) presents the risk profiles for discounted cash flow, ounces of gold recovered and throughput at the two main processing facilities, the base case is in blue, and the simultaneous case is in black. The relevant values have been scaled for confidentiality. Figure 2(a) shows that over the ten-year span there is a negligible difference in NPV between the two cases (0.16% difference in p50 values), however, the base case forecast would be adversely affected by mill capacity violations that will be addressed later. Furthermore, the risk profiles are particularly tight over the first five periods, projecting confident forecasts. Figure 2(b) shows that both cases deliver stable discounted cash flows (200+ million USD) throughout the life of the operation. Cash flows are comparable in most periods except for period three, where the simultaneous case forecast is significantly higher. Figure 2(c,d) depict gold ounces recovered; they closely mirror the cash flow forecasts. Both optimized plans forecast stable ounce profiles throughout the life of the operation, never delivering less than 300 thousand ounces a year.
Base case (blue) and simultaneous case (black) cash flow and gold recovered risk profiles.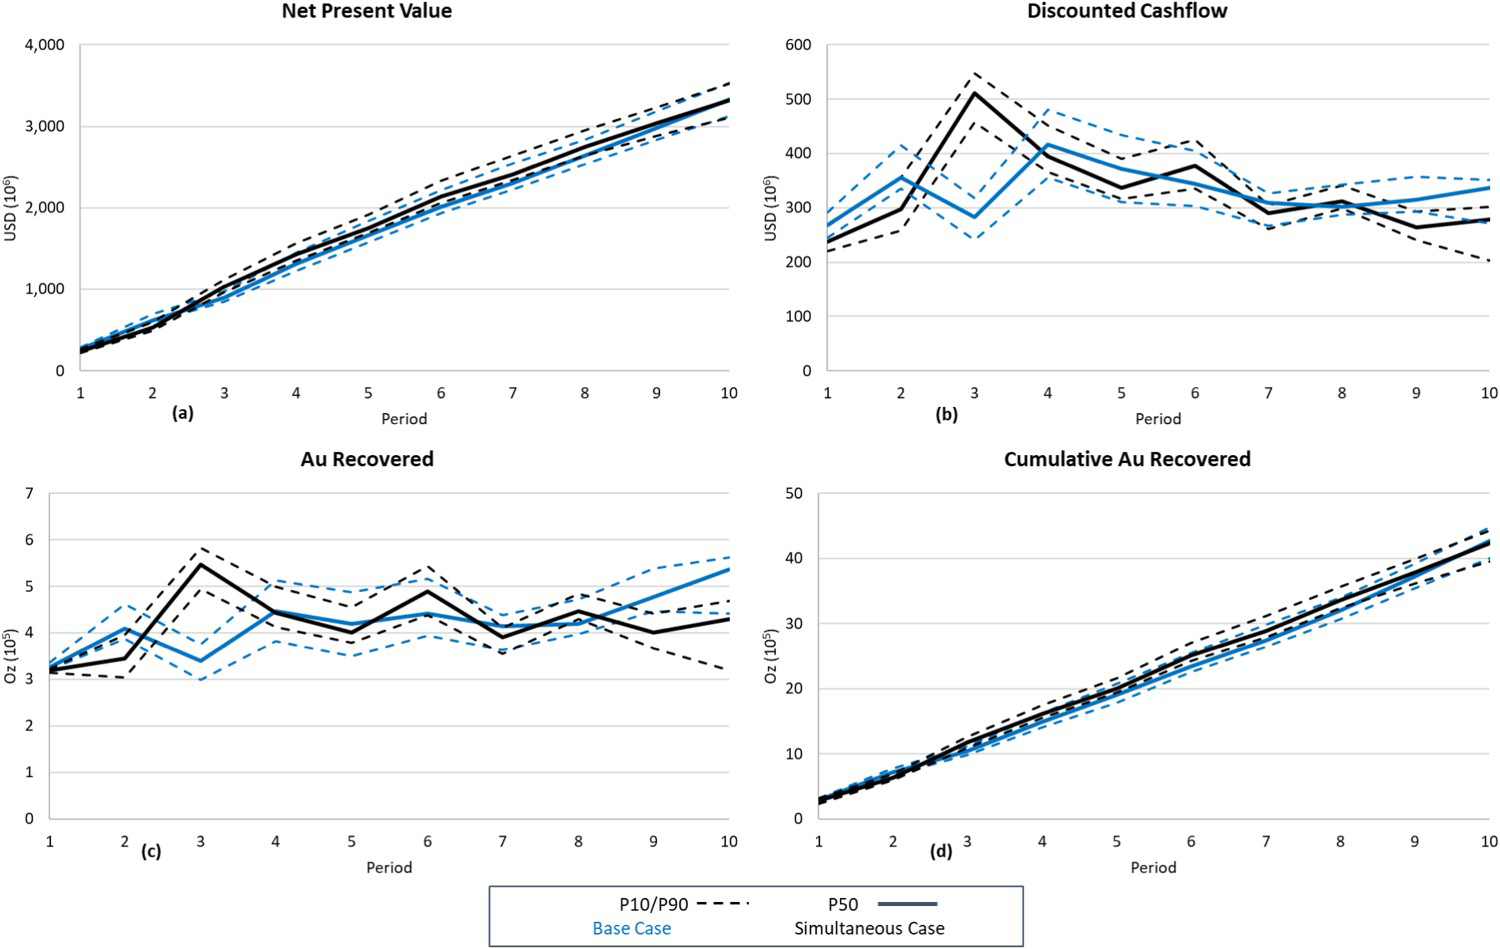
Figure 3(a–c) provides the risk profiles throughput at each processing facility in the mining complex. The base case forecast under delivers autoclave throughput in period 1. Otherwise, both cases respect the capacity targets through the life of the operation. The oxides provide more contrasting differences between the two cases. The flexibility afforded to the optimizer in the simultaneous case enables it to adjust the destination policy decisions to deliver a consistent throughput to the oxide mill. The base case struggles to respect the oxide mill's capacity targets in periods 1, 3-8. It is important to note that the oxide mill capacity violations would negatively impact the base case NPV forecast, meaning the real difference is more pronounced than the 0.16% shown in Figure 2(a). Examining the oxide cut off grades and the leach pad throughput provides some insight into these results.
Base case (blue) and simultaneous case (black) throughput forecasts at each processing facility.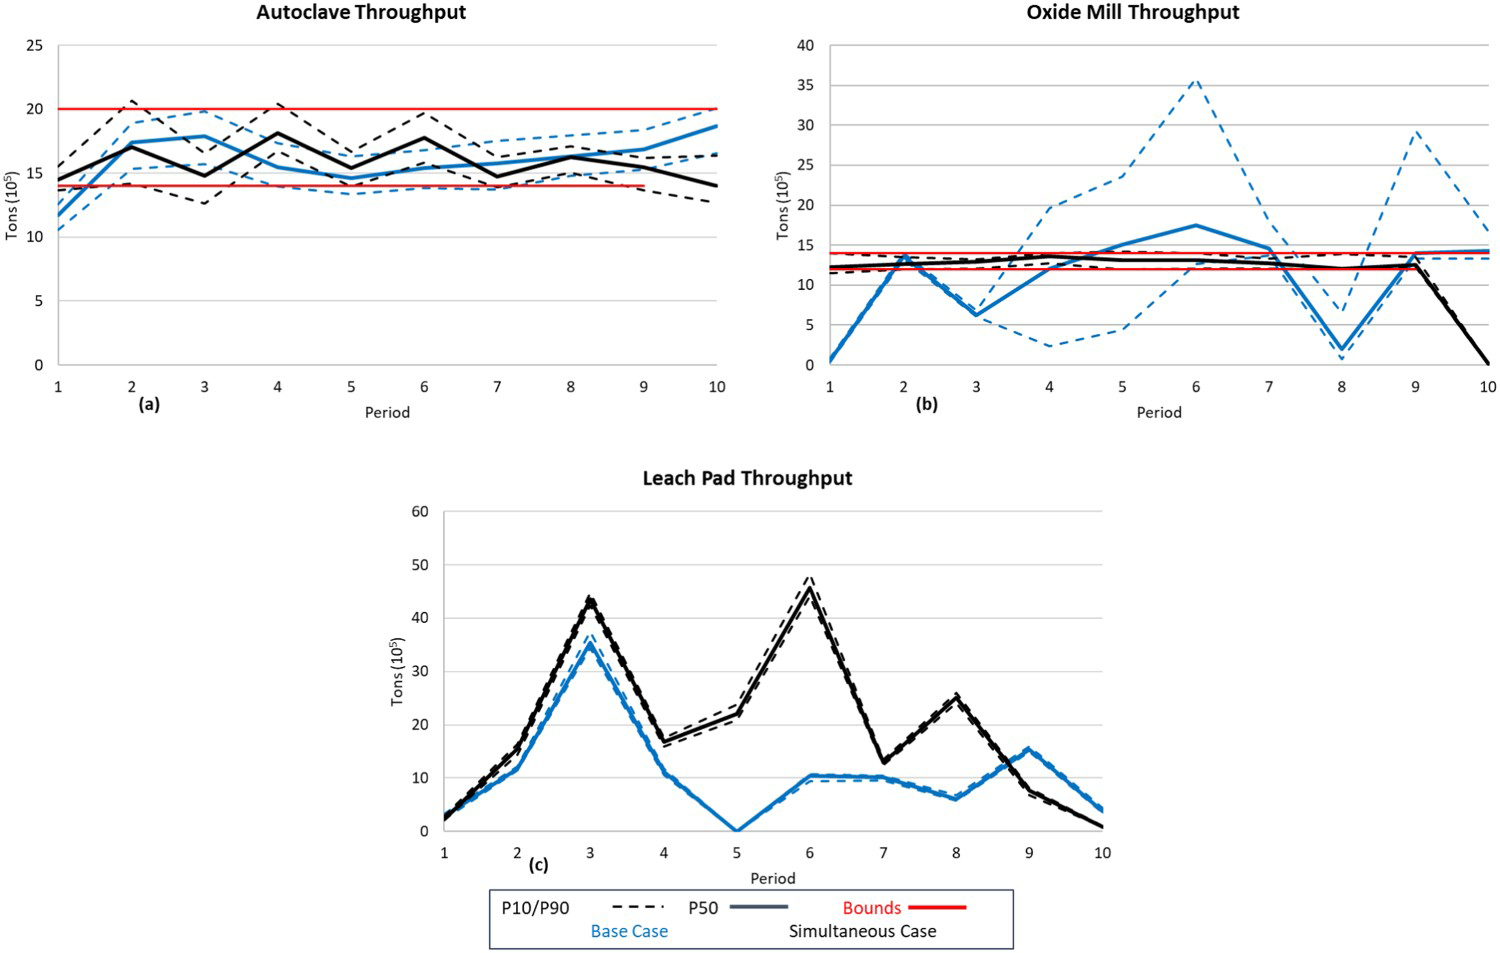
Figure 4 presents the oxide cut-off grades and Figure 5 presents the feed grades to both oxide processing facilities. Recall, the base case uses predetermined cut-off grade decisions. The simultaneous case optimizes the cut-off grades in conjunction with the extraction sequence and processing stream decisions. Figure 4 highlights the adjustments made to keep the mill well fed. Cut-offs are raised when there are large quantities of high-grade material available, such as in period 3, and lowered when high-grade materials are scarce such as in period 1. Figure 5(b) confirms these observations as the trend in feed grade to the oxide mill mirrors the cut-off grade adjustments. It is important to note that just because there is high grade being mined in period 3 of the simultaneous case, it does not mean that the same high-grade material is being mined in the base case, the extraction sequences are not the same. Figure 6 shows that they are very different, in fact, not even the final pit limits are the same. The simultaneous case mines 3% more material than the base case over the ten-year period.
Base case and simultaneous case oxide material cut-off grades. Base case (blue) and simultaneous case (black) oxide mill and leach pad feed grades. Pit B extraction sequence cross-section: simultaneous case (left) base case (right).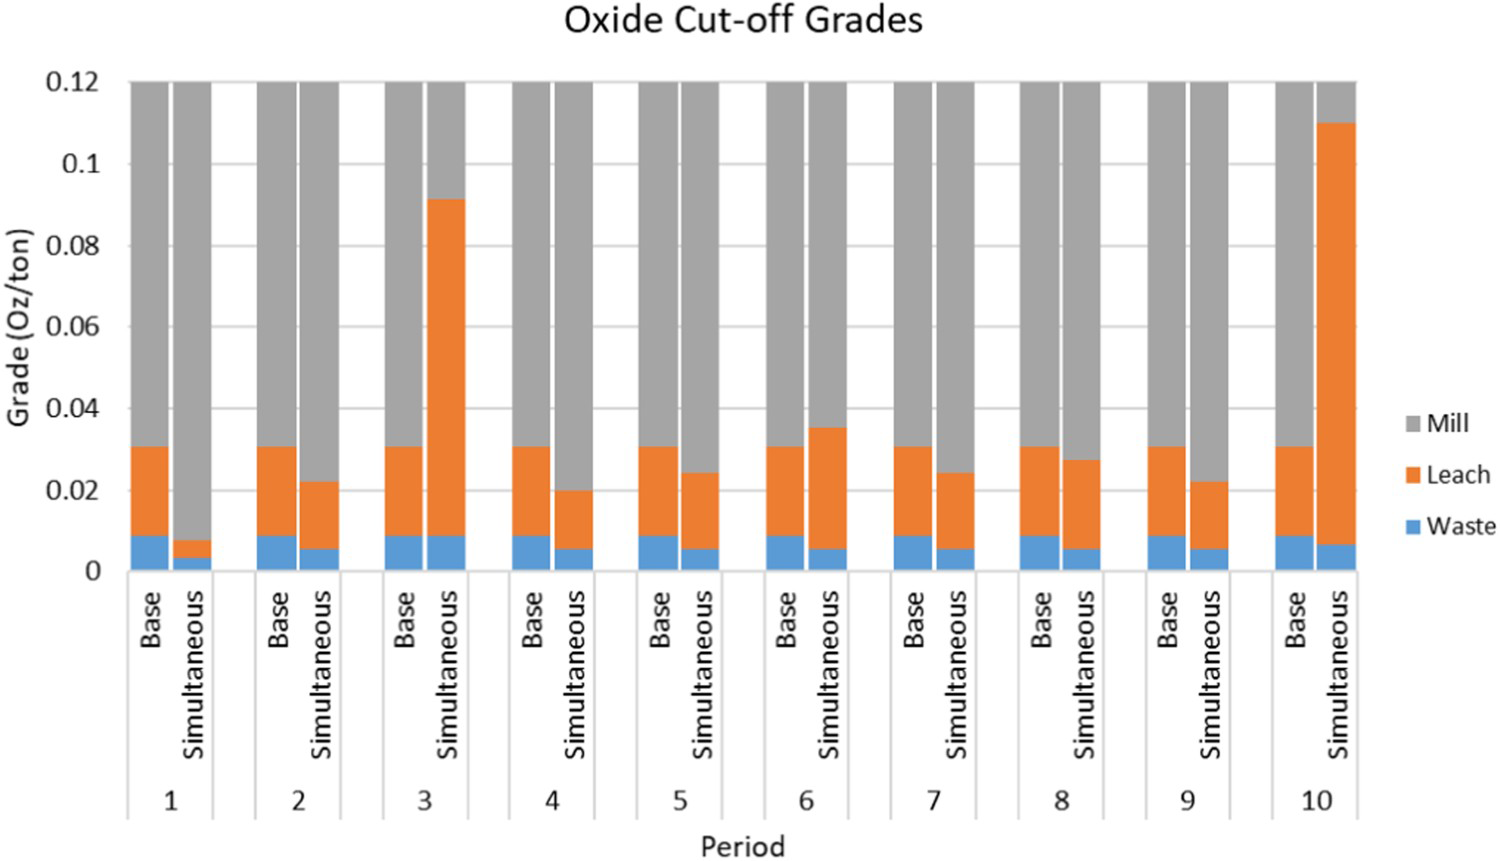
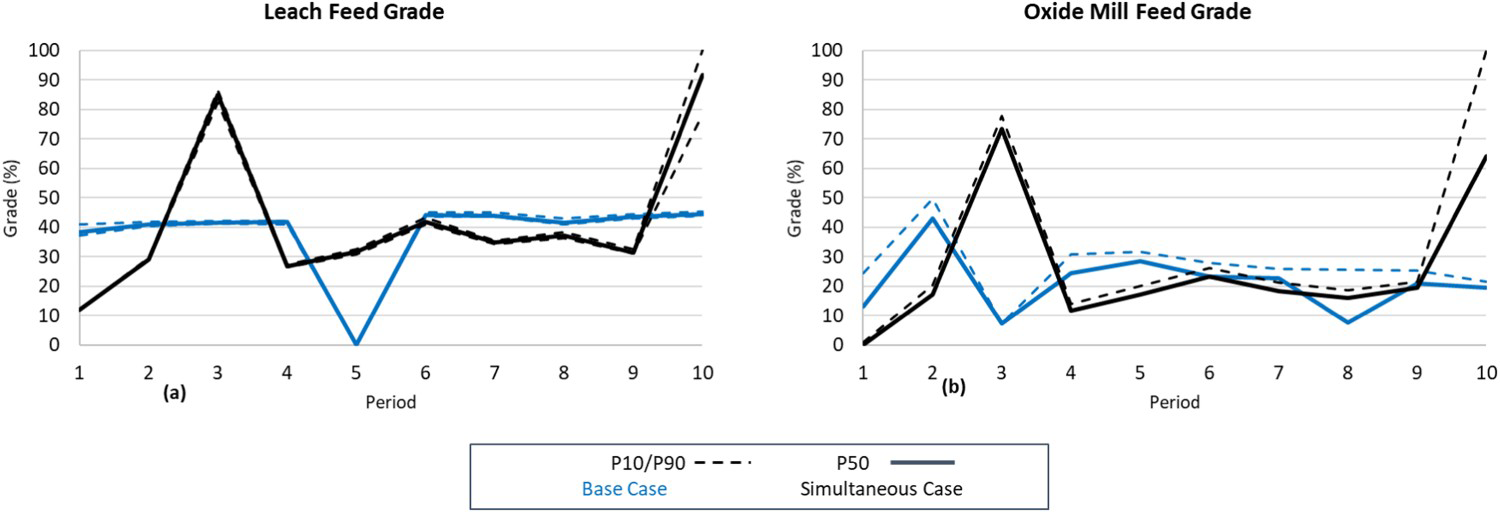
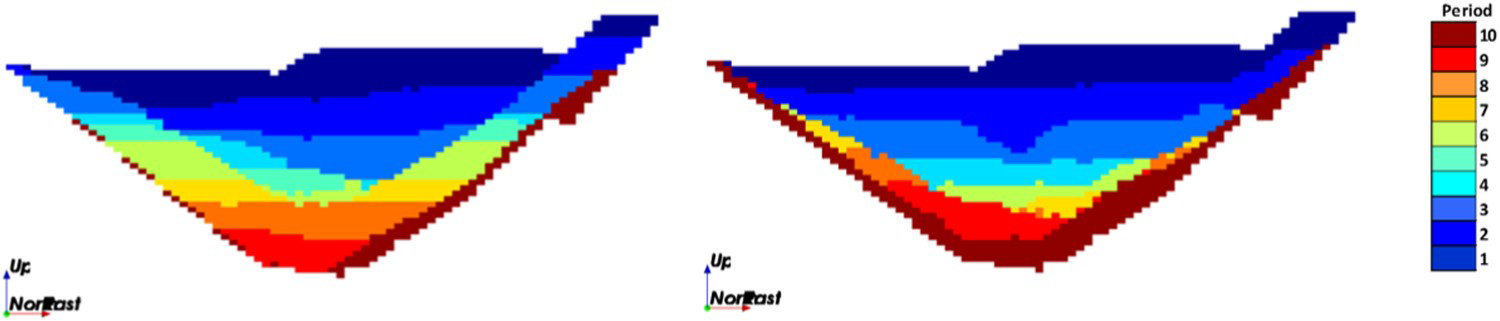
Figure 7(a–e) presents the risk profiles for the blending constraints. Recall the autoclave requires certain levels of acidity in the feed slurry for efficient operation. The most critical blending target is the SS:CO3 ratio, shown in Figure 7(b). When the SS or CO3 levels fall too low or too high, acid is added to the feed slurry to control the pH. However, acid consumption capacity is strictly limited by regulation. It is evident that other than the SS targets, both cases satisfy the blending constraints in most periods. Although the SS levels do not consistently respect the blending targets, the violations are on the order of fractions of a percentile. The potentially negative impacts are mitigated by the very well controlled SS:CO3 ratio.
Base case (blue) and simultaneous case (black) blending results.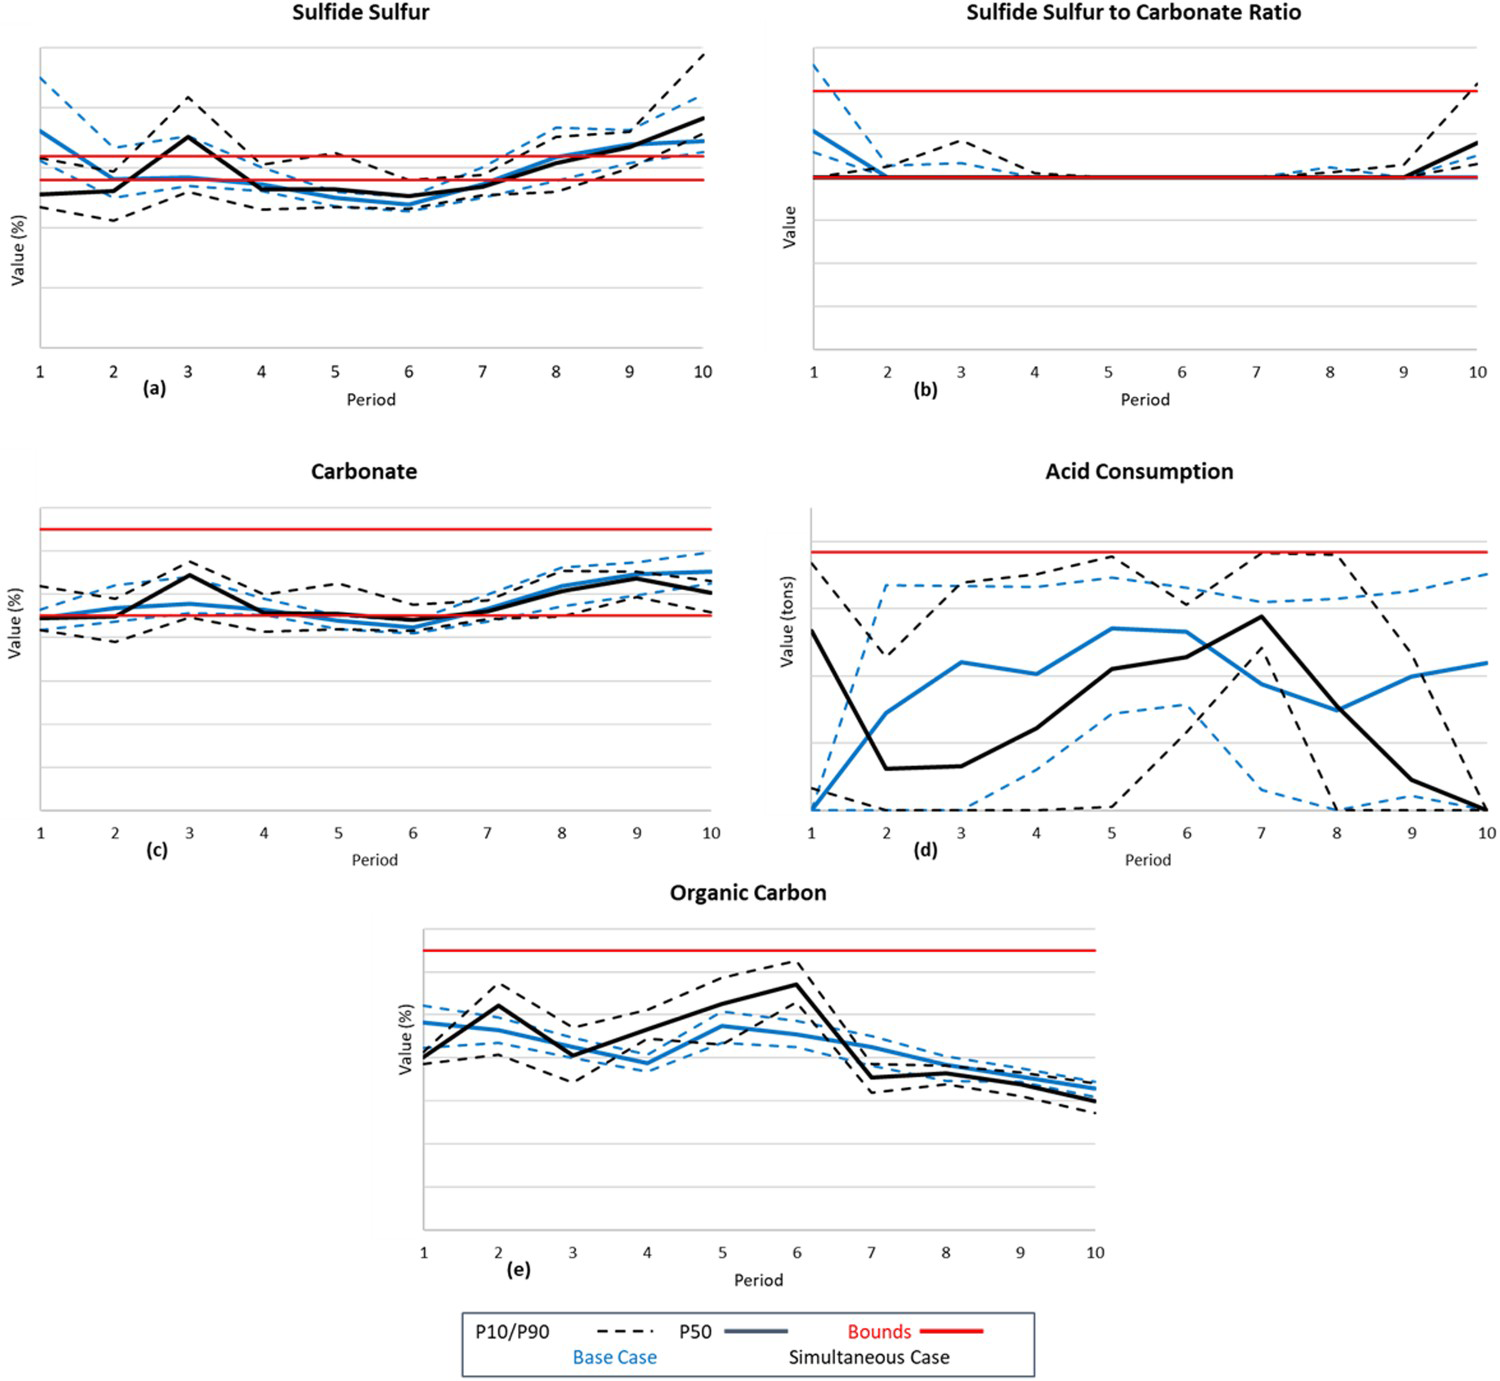
In summary, allowing the simultaneous stochastic optimizer to determine cut-off grade decisions in conjunction with extraction sequence and processing decisions yields several key improvements. The simultaneously optimized cut off decisions perturb the extraction sequence to deliver stable material flows that respect the capacities of the processing facilities. The pre-determined cut-off grades in the base case configuration yield production forecast that struggle to respect processing capacity targets. While the NPVs of both configurations appear similar, the base case forecasts may be misleading due to these violations. Furthermore, the configuration of the simultaneous case significantly reduces the number of necessary stockpiles on site. Thus, reducing the operational complexity in managing the mineral value chain.
Incorporating market uncertainty
Incorporating market uncertainty through the use of commodity price simulations as inputs to the simultaneous stochastic optimization framework generates a long-term plan that manages and quantifies risk derived from volatile spot markets jointly with geological risk. Note that Part I in Equation (1) accommodates the joint grade and market uncertainty. Gold prices are simulated using an established model for precious metals, geometric Brownian motion with Poisson jump diffusion (Schwartz 1997), described by Equation (6), where St is the metal price at time t, W is a Weiner process, β is the size of Poisson jump P. Average annual price drift, η, is the trend component often used in price models where the price is correlated with inflation, σ2, is average annual price volatility.
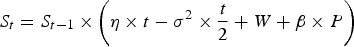
Figure 8 presents the simulated gold price scenarios used in this case study, the mean of the simulated prices and the constant price used in the comparative case. It is typically accepted that the number of simulations necessary to accurately quantify metal price uncertainty can be on the order of hundreds (Farmer 2017). Such a number makes the problem intractable as the number of variables is already in the order of 106 and the number of joint uncertainty scenarios is in the thousands. However, the sensitivity of long-term production scheduling for mineral value chains to the number of price scenarios has not been sufficiently explored. For example, Albor and Dimitrakopoulos (2009) and Montiel and Dimitrakopoulos (2017) show that due to support-scale effects (also known as volume–variance relationship), 12–15 stochastic orebody simulations are enough to quantify geological uncertainty in long-term mine production scheduling applications. This implies using more than 15 simulations as inputs does not change the solution. This application should be considered as a proof-of-concept that it is possible to consider market uncertainty in the simultaneous stochastic optimization framework and that has material differences to the outputs of the process. Further studies must determine the number of commodity price simulations necessary to generate stable solutions and provide accurate quantifications of uncertainty in this context.
Gold price simulations (grey), mean of simulated prices (red dotted), constant gold price (black dotted).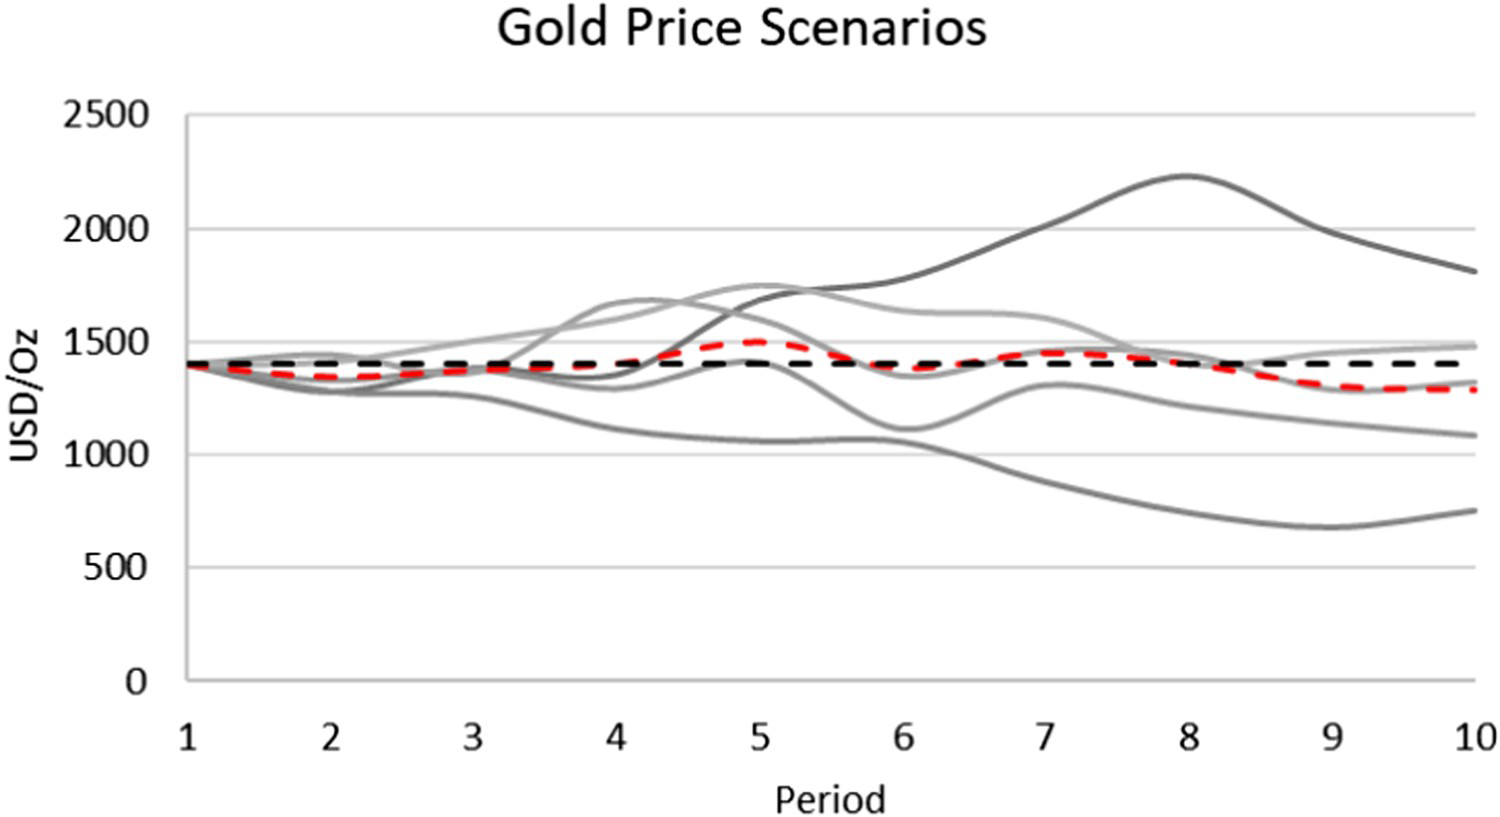
Risk analysis considering market uncertainty
This section examines the risk profiles of the case study considering joint market and supply uncertainty scenarios. To provide a comparison, the simultaneous case from Section 3.2, which uses the constant gold price (shown in Figure 8) is included and referred to as the ‘supply uncertainty’ case. Figure 9(a–d) present the discounted cash flow and gold recovered risk profiles. The effect of the joint uncertainty scenarios becomes quite evident in the p10 and p90 values after period 4 in Figures 9(a,b). In all periods, the cash flows are less certain than the case that only considers supply uncertainty, however, through the first four periods the optimizer forecasts cash flows with a reasonable amount of confidence. Examining the gold price scenarios in Figure 8 provides a reasonable explanation, the fluctuations in gold price simulations begin to vary significantly more as time progresses beyond period 4. However, the forecasts beyond period 4 provide a quantification of risk in projected cash flows. Despite the fluctuating price scenarios in the later periods, the forecasts remain positive throughout the life of the operation, with the p10 value never dropping below 100 million USD and the p50 never dropping below 200 million USD. The joint uncertainty case delivers stable ounce profiles (Figure 9(d)) throughout the life of the operation while remaining profitable. In fact, despite the significant exposure to the downside in gold prices, the ounce profile remains comparable to the case that does not consider market uncertainty.
Supply uncertainty (black) and joint uncertainty (green) cash flow and gold recovered risk profiles.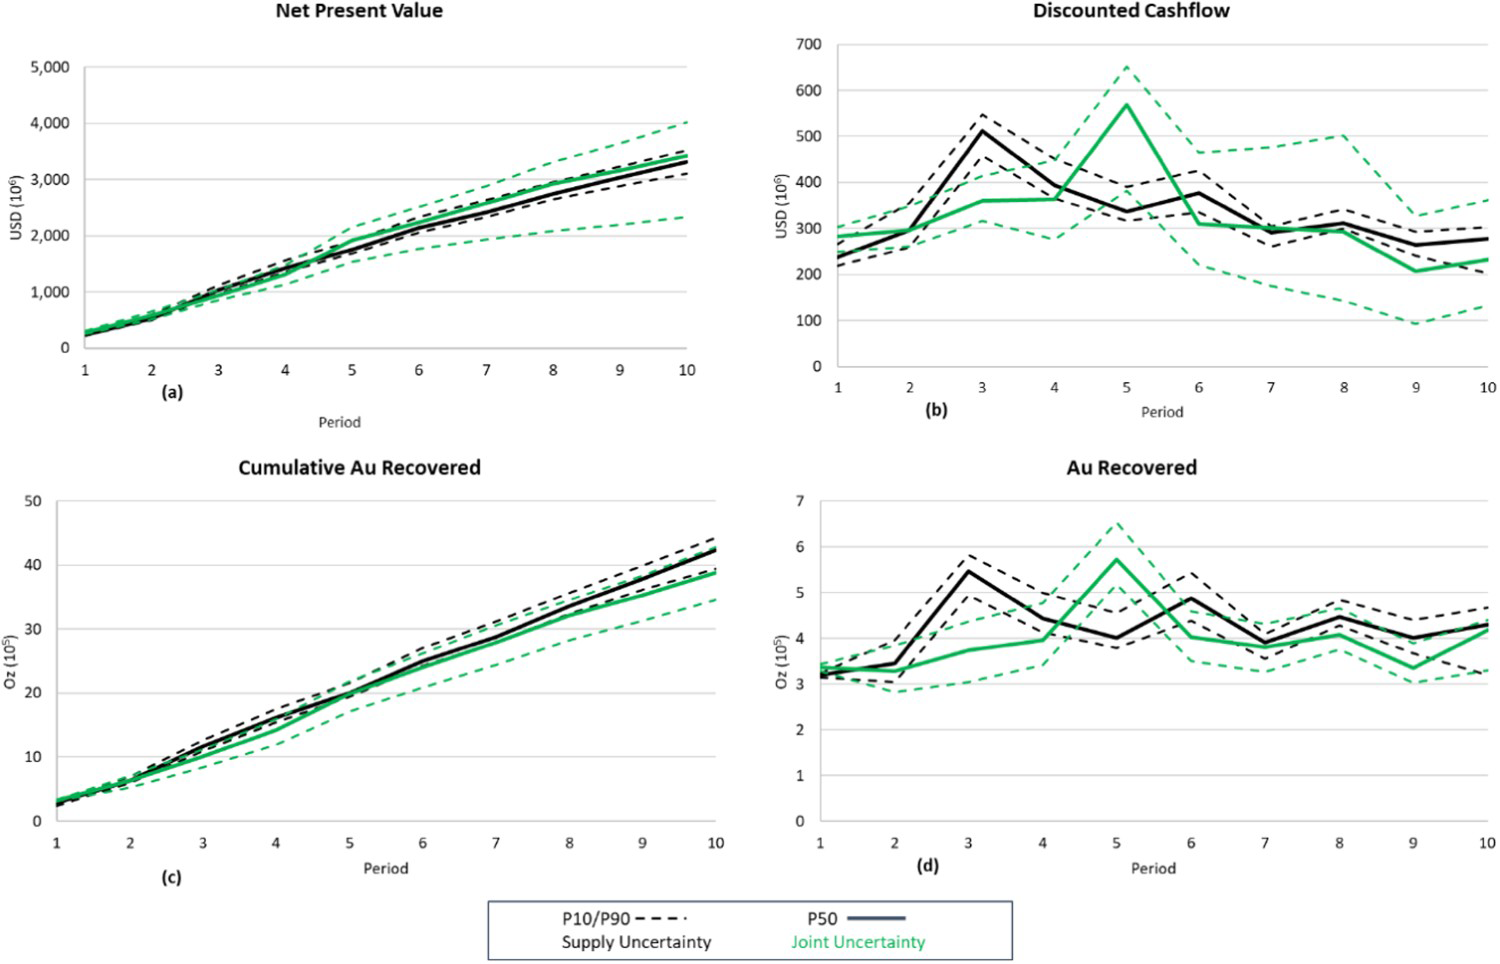
Figure 10(a–c) provide the risk profiles for throughput at each processing facility; it is evident that optimizer provides a long-term plan that respects the capacity targets of each processing facility. In Figure 10(b,c) period five highlights one of the benefits of incorporating market uncertainty into this process. First, note that several price scenarios enjoy an upswing in period 5. The optimizer can take advantage of this upswing and mine more high-grade material, but it does not violate the maximum capacity of the oxide mill. Instead, it utilizes the leach pad to process significantly more tons. This leads to higher cash flows and a larger number of ounces recovered in period 5. Note the relative increase in cut-off grade in period five shown in Figure 11.
Supply uncertainty (black) and joint uncertainty (green) throughput risk profiles at each processor. Figure 5: Supply and joint uncertainty oxide material cut off grades.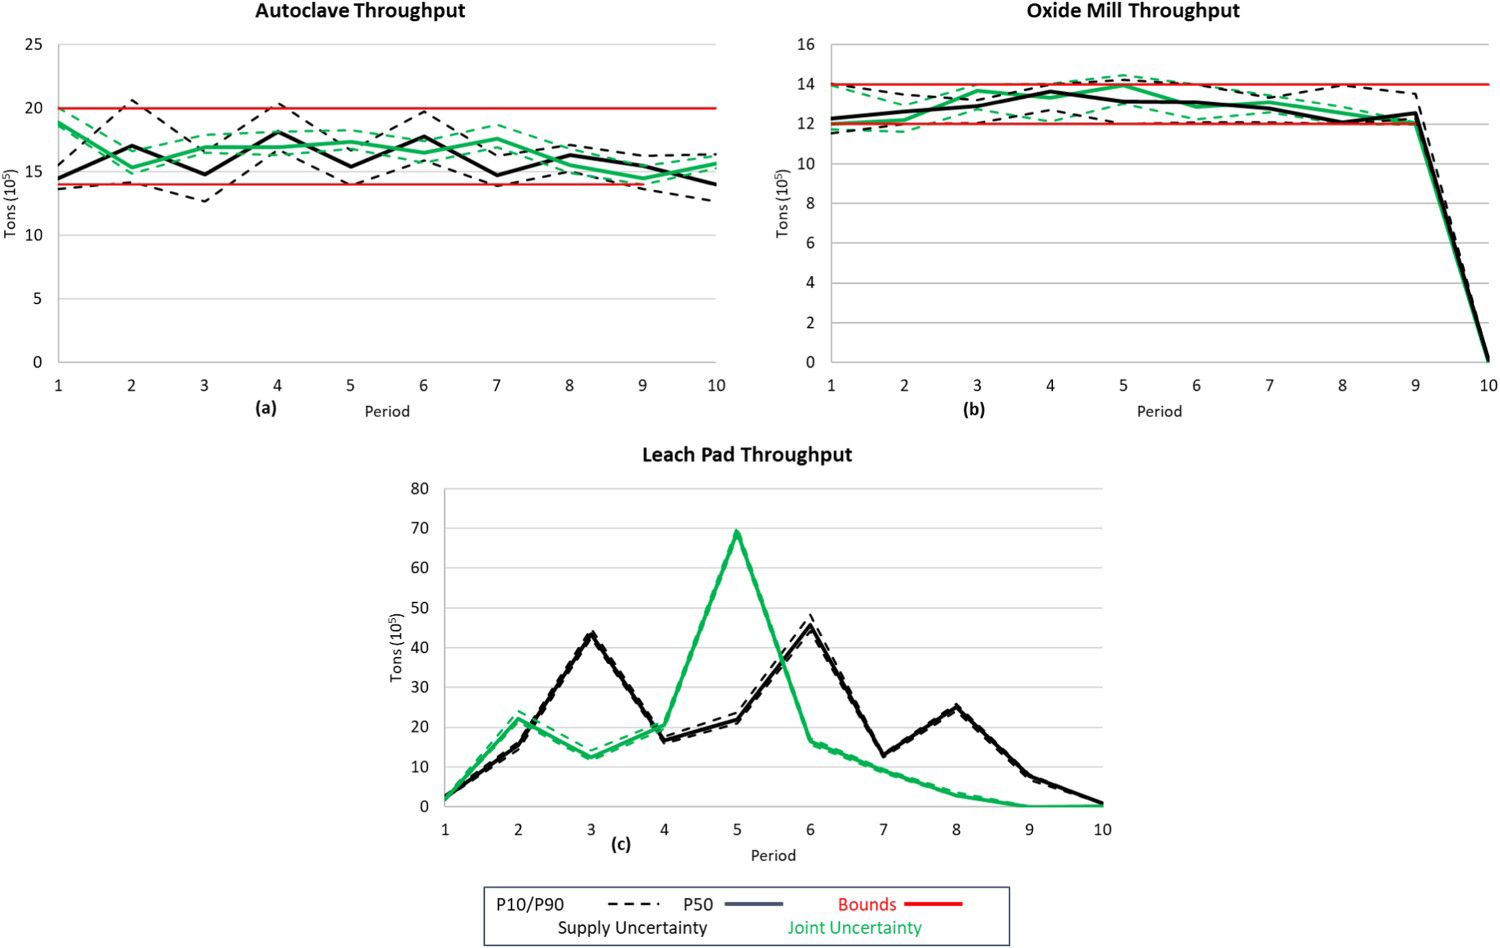
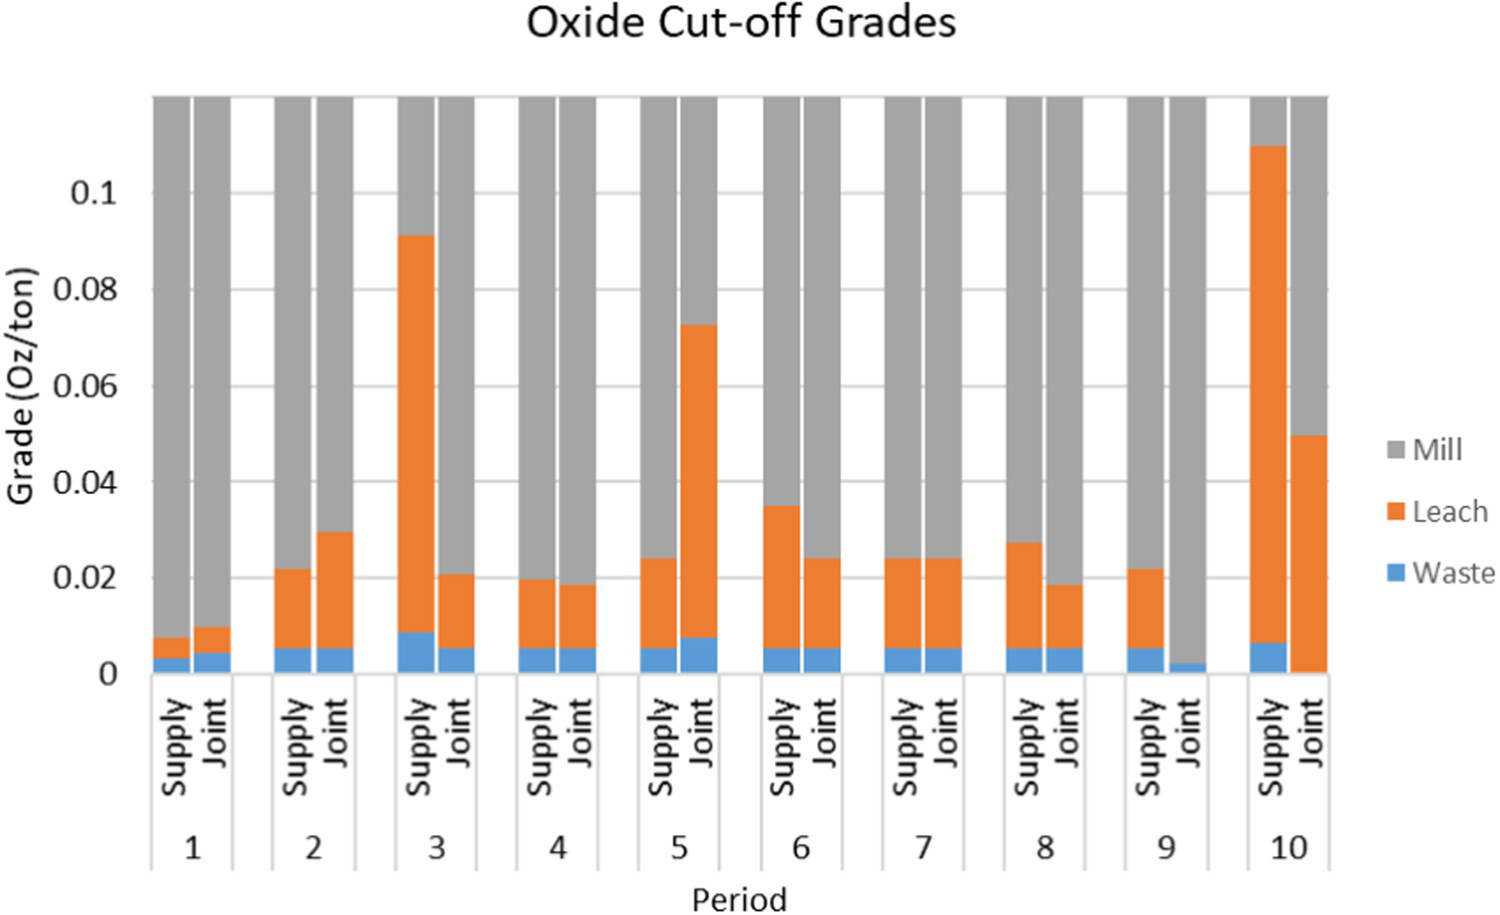
Figure 12 presents the same cross-section of both pit B extraction sequences, the difference in material scheduled for extraction in period 5 is visually clear. Recall, that the extraction sequence is scenario independent. This provides some insight into the differences in material scheduled for extraction in periods 9 and 10 when the downside exposure to price uncertainty becomes more pronounced. Beyond the visual differences in the extraction sequences, the incorporation of joint uncertainty scenarios also leads to differences in the physical boundaries of the open pit mines. The total extracted material mass in the joint uncertainty case is approximately 119 million tons. In the supply uncertainty case, the extracted mass is approximately 174 million tons. Despite the 32% difference in total extracted material, there is only an 8% difference in the p50 values for total recovered announces. However, this does not translate to an improvement in p50 for the NPV; the joint uncertainty case has a 3% higher p50 NPV. This highlights the ability of the simultaneous stochastic optimizer to capitalize on extra production in elevated price scenarios while managing the impact of risk throughout the life of the operation.
Pit B extraction sequence cross-section. Joint uncertainty (left) and supply uncertainty (right).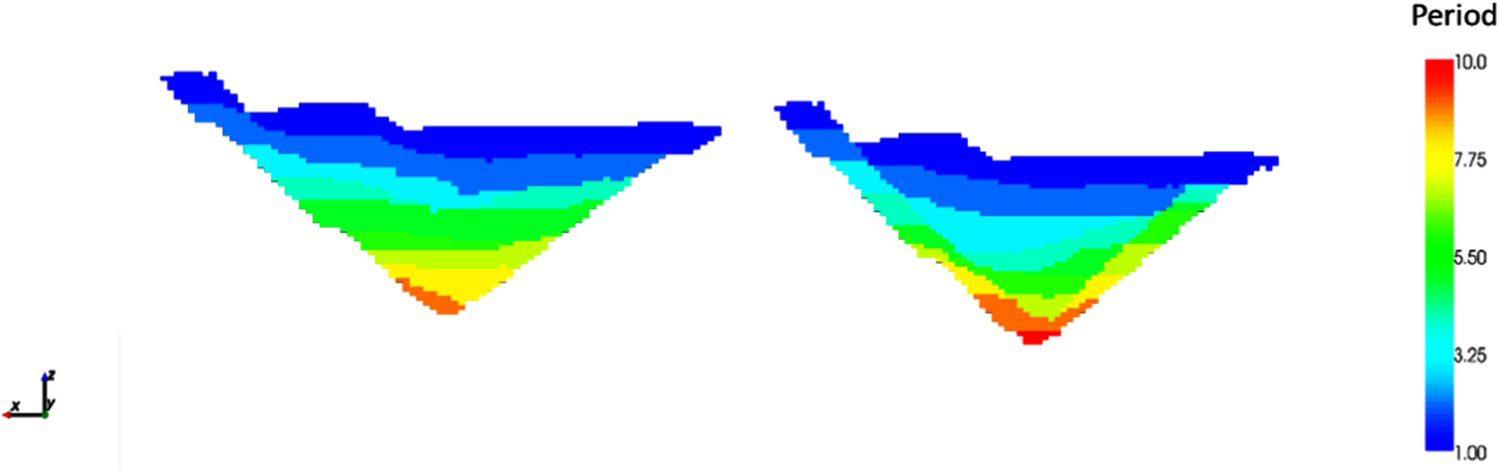
Conclusions
This paper presents an application of the simultaneous stochastic optimization framework at a multi-pit, multi-processor Nevada-type gold mining complex and its strategic mine planning; including extraction sequences, destination policies, and processing stream decisions. The contributions are highlighted by the case study at the mining complex composed of two open pit mines, three external sources of ore delivery, three processing facilities and a series of distinct stockpiles. The mining complex is subject to numerous operating constraints related to capacities and geochemical blending requirements. The application documents the effectiveness of the framework's cut-off grade optimization component by comparing results with a base case model that uses cut-off grades determined a-priori by conventional methods. It also explores the incorporation of market uncertainty into the simultaneous optimization of a mining complex and effects on all its major aspects. The results show that the proposed approach improves the operation's ability to respect operating capacity targets by optimizing cut-off grades in conjunction with material availability and processing requirements. The approach also allows for a reduction in operating complexity as the simultaneous case utilizes only 12 stockpiles compared to 38 in the base case. Additionally, the integration of commodity price fluctuations and optimization of the mining complex under joint market and supply uncertainty underscores the flexibility of the framework. The results demonstrate the optimizer's ability to adapt the schedule to mine and process more material during periods of elevated price environments while being more conservative when the downside exposure to prices becomes more pronounced. This highlights the ability of simultaneous stochastic optimizers to generate long-term schedules that manage exposure to commodity price fluctuations and provide accurate quantifications of risk to an operation's strategic decision makers.
The development and adoption of hyper-heuristic algorithms (Lamghari and Dimitrakopoulos 2018) that take advantage of reinforcement learning techniques to better search the solution space of massive combinatorial optimization problems will enable the framework to consider larger numbers of joint uncertainty scenarios in reasonable amounts of time. Such advancements would allow for more in-depth sensitivity analyses on the number of commodity price simulations necessary to generate stable and resilient outputs. Future extensions of the method should include the ability to optimize mining capacity and processing rates. Another area of particular interest is the extension of the destination policy to consider multiple attributes into cut-off grade decisions.
Disclosure statement
No potential conflict of interest was reported by the authors.