
Abstract
From our recent work on the three-dimensional structure of epoxide hydrolases we theoretically deduced the likelihood of a two-step catalytic mechanism that we and others have subsequently experimentally confirmed. Analysis of the rate of the two steps by us and by others show that the first step—responsible for removal of the reactive epoxide from the system—works extraordinarily fast (typically three orders of magnitude faster than the second step), sucking up the epoxide like a sponge. Regeneration of the free enzyme (the second step of the catalytic mechanism) is slow. This becomes a toxicological problem only at doses of the epoxide that titrate the enzyme out. Our genotoxicity work shows that indeed this generates a practical threshold below which no genotoxicity is observed. This shows that—contrary to old dogma—practical thresholds exist for definable genotoxic carcinogens.
Keywords
INTRODUCTION
Genotoxic carcinogens are generally assumed to not show a threshold for their effect (N.N., 1991, 1994; Purchase and Auton, 1995). This is based on the view of genotoxic effects as stochastic, irreversible events, in contrast to, for example, pharmacologic and toxicological effects of a drug that are reversible, in most cases. Receptor-mediated effects most often require a minimum percentage of the respective receptor molecules to be occupied, the classical setting for a threshold, whereas the DNA alteration eventually giving rise to a discrete step in cancer development may be the consequence of a single hit. Thus, the chance for tumor induction decreases linearly with the dose of the genotoxic carcinogen while the likelihood for a pharmacologic effect decreases steeply beyond the threshold dose and rapidly approaches zero. From this point of view, there is indeed no indication for a threshold in carcinogenesis by genotoxic agents in contrast to the case of nongenotoxic carcinogens for which threshold effects have been documented. However, this simple view neglects the possibility that the concentrations of genotoxic agents may be tightly controlled by metabolism.
CARCINOGEN-METABOLIZING ENZYMES AS CONTROL FACTORS OF GENOTOXICITY
There is a fair number of direct-acting mutagens/carcinogens, but most genotoxic agents require metabolic activation (Oesch and Arand, 1999). To allow elimination of initially lipophilic compounds via the aqueous excretion systems of the mammalian body, a huge network of xenobiotic-metabolizing enzymes has evolved. During biotransformation by these enzymes, some compounds are “accidentally” activated to genotoxic metabolites. In the so-called phase 1 of drug metabolism the molecule is functionalized by introduction or liberation of a functional group that can be used as a handle in phase 2 of drug metabolism to conjugate the molecule, usually with a hydrophilic endogenous chemical compound (Figure 1). The resulting terminal metabolite is generally nonreactive, nontoxic, and well soluble in water and thus easily excretable. The functionalized intermediate arising from phase 1 metabolism, however, is often chemically reactive. If the functional group that has been introduced is electrophilic, as is the case with epoxides, it has a tendency to react with electron-rich moieties in the DNA and give rise to DNA adducts and/or DNA strand breaks. One example for a compound that is activated to a genotoxic intermediate in the human body is styrene, a compound produced in thousands of tons per year. Luckily, the genotoxic intermediate, an epoxide, is rapidly inactivated by the microsomal epoxide hydrolase (mEH; EC 3.3.2.3), one important enzyme that protects the body from the hazardous effects of many epoxides (Oesch, 1973). As will be detailed below the metabolic capacity of mEH determines a practical threshold for the genotoxicity of compounds that are inactivated by this enzyme.
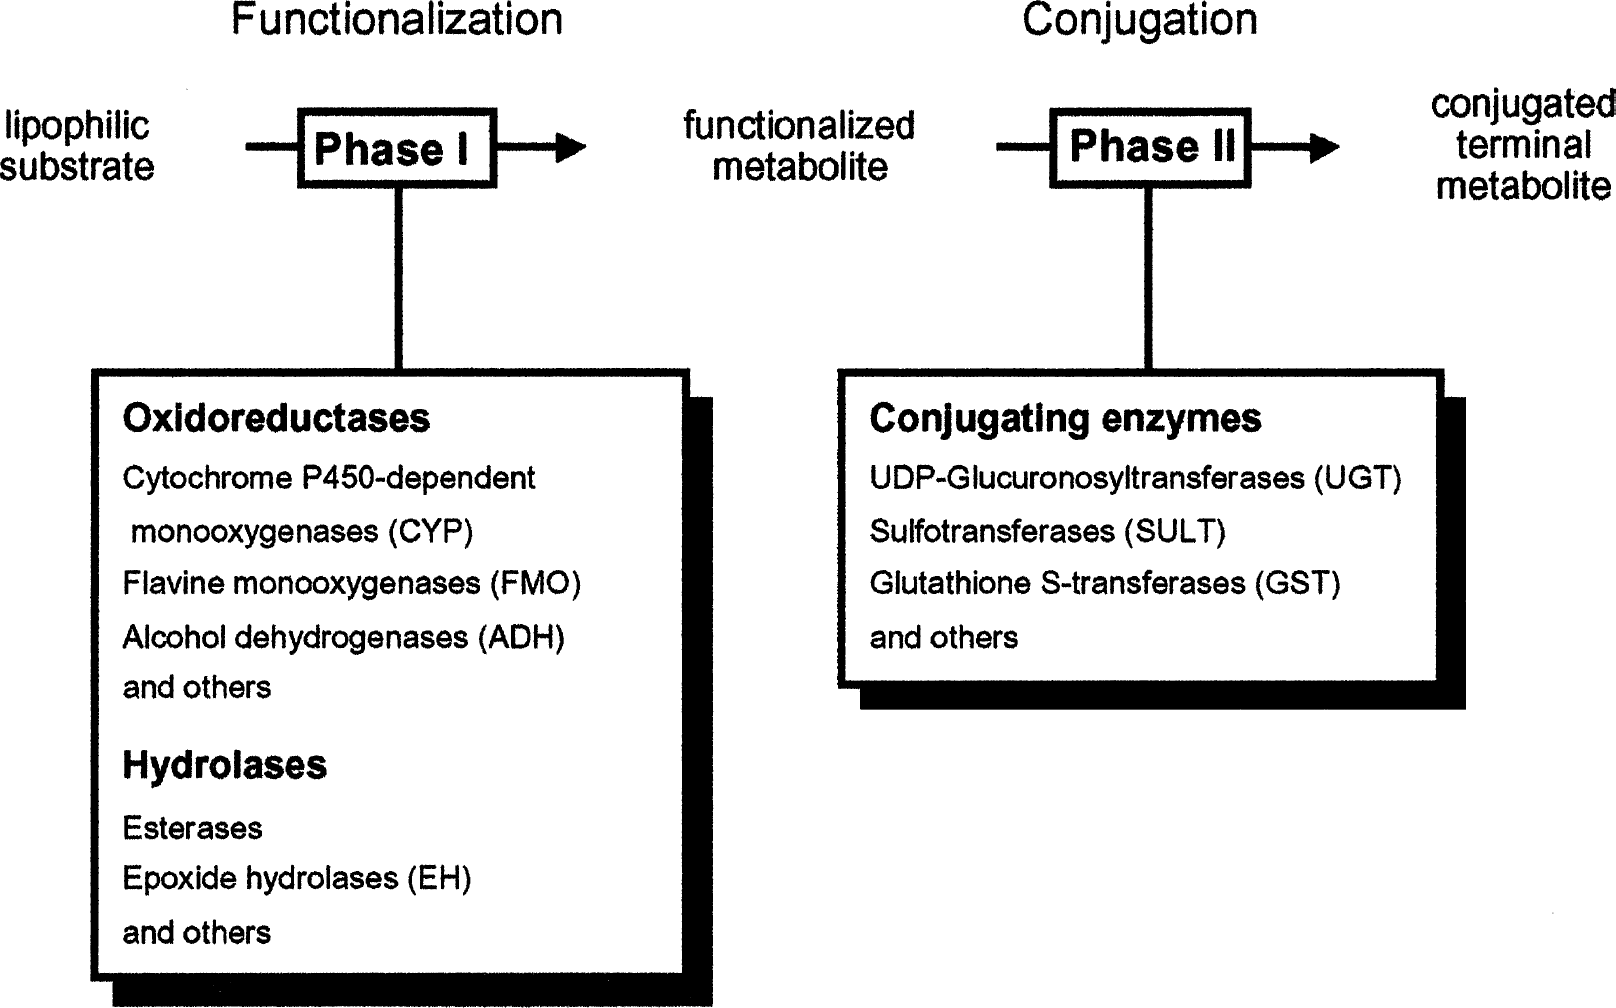
The phase concept of drug metabolism.
FAST DETOXIFICATION BY THE MICROSOMAL EPOXIDE HYDROLASE DESPITE LOW TURNOVER NUMBER
Concept
mEH possesses a very broad substrate specificity. On the other hand, the enzyme displays a comparatively low turnover number with most of its substrates, usually smaller than 1 s−1 (Thomas et al., 1990). This is partly compensated for by a very high concentration (10–50 μM, i.e., 10–50 μmol per kg wet weight tissue, in the human liver, the prominent organ for intermediate epoxide formation). However, even this is not sufficient to account for its role as a rapid detoxifier. Recent findings have led to a detailed understanding of the enzymatic mechanism by which mEH and the related soluble epoxide hydrolase hydrolyze their substrates (Lacourciere and Armstrong, 1993, 1994; Arand et al., 1994, 1996; Hammock et al., 1994; Tzeng et al., 1996, 1998; Müller et al., 1997; Laughlin et al., 1998; Arand et al., in press). These enzymes belong to the large structural family of α/β hydrolase fold enzymes (Ollis et al., 1992). These enzymes harbor a catalytic triad. In the first step of the enzymatic reaction, the catalytic nucleophile, which is an aspartic acid residue in the case of the epoxide hydrolases, attacks the substrate to form an enzyme-substrate ester intermediate. This is subsequently hydrolyzed by an activated water molecule. Water activation is achieved by proton abstraction through a charge-relay system composed of a histidine residue that is hydrogen-bonded to an acidic residue, either glutamic or aspartic acid. In the case of enzymatic epoxide hydrolysis, the first step of the reaction proceeds significantly faster than the second step, which therefore becomes rate-limiting. Armstrong (1999) calculated, for glycidyl-4-nitrobenzoate as the substrate, the rate constant of step 1 to be three orders of magnitude higher than the rate constant for step 2 (Tzeng et al., 1996). According to our own work, similar reaction kinetics exist for the turnover of 9,10-epoxystearic acid (Arand et al., 1999) and styrene oxide. The most important point from this new insight in the enzymatic mechanism of mEH is to realize that the rate of product formation does not adequately mirror the detoxification efficiency of the enzyme. Because step 1 is much faster than step 2 of the enzymatic reaction, the ester intermediate will accumulate at the cost of the substrate, that is, the free epoxide. Therefore, in the initial phase of the reaction, much more epoxide will be consumed than terminal (phase 2) product (the diol) is formed (Figure 2). As long as the enzyme is in excess over its substrate, which can be taken as a realistic setting under usual conditions of exposure to toxic epoxides, the epoxide is eliminated much faster than the diol is formed.

Computer simulation of epoxide hydrolysis by epoxide hydrolase. In the present scenario, an epoxide is added to a compartment containing an epoxide hydrolase. The starting concentrations of enzyme and substrate are assumed to approximately reflect the reality with human mEH as enzyme and styrene oxide as substrate 50 and 1 μM, respectively. Using 2 mM, 200 s−1, and 0.2 s−1 as the values for KS, k1, and k2, the above time curves result. The major observation is that the substrate (i.e., the epoxide) disappears rapidly while the final product, the diol, builds up comparatively slowly. The apparent discrepancy is resolved by the fact that the covalent intermediate that is rapidly formed represents a reservoir from which the product is gradually released by the slow, hydrolytic step of the enzymatic epoxide hydrolysis. E = enzyme, S = substrate (epoxide), ES = Michaelis—Menten complex, E · S = covalent enzyme—substrate intermediate, P = product (diol), KS = dissociation constant of the Michaelis—Menten complex, k1 = rate constant of the first step (formation of the covalent intermediate), k2 = rate constant of the second step (hydrolysis). Further details of the computation are given by Arand et al. (2003).
This theoretical consideration can be tested in a first step by computer simulation. As anticipated, the in silico analysis reveals a much faster decrease in epoxide concentration compared to the increase in diol formation. Thus, the effective dose of the genotoxic agent as represented by the area under the time—concentration curve is actually much smaller than the calculation from the formed diol predicts. Also important is the finding that, also under conditions well below substrate saturation, there is an inverse proportional relationship between epoxide steady-state concentration and epoxide hydrolase concentration.
Proof
A meaningful way to test the importance of a given detoxifying enzyme in the control of a genotoxic agent is its recombinant expression in a suitable indicator cell line and the subsequent analysis of the susceptibility of the recombinant cell line compared with the parental cell line toward the genotoxic effect of the compound tested (Herrero et al., 1997). We have used V79 Chinese hamster fibroblast cells (Doehmer et al., 1988) as the indicator cell line and tested the influence of recombinant mEH expression on the styrene oxide-induced DNA strand breaks as measured by the alkaline elution technique (Herrero et al., 1997). The results show that the expression of mEH protects V79 cells from styrene oxide-induced DNA strand break formation up to a concentration of at least 100 μM. Above this concentration a steep rise in the genotoxic effect of the agent occurs. The parental cell line that is essentially devoid of mEH expression shows a monophasic, dose-dependent increase in DNA strand breaks without the initial lag phase observed with the mEH-expressing cells. Thus, mEH expression introduces a practical threshold for the susceptibility of V79 cells to styrene oxide genotoxicity. The aforementioned enzymatic mechanism is one important factor contributing to the high clearance of styrene oxide by mEH, yet it may not be sufficient as a stand-alone explanation for the observed threshold. In the experiment described, the threshold concentration of 100 μM equaled a total amount of 500 nmol styrene oxide in the entire culture dish (cells plus medium). The total amount of mEH in one dish, however, is only about 500 pmol, although the mEH concentration within a single cell is similar to that of the epoxide, namely about 50 μM (simplified, taking the cells as the “solvent”). Because, in this setting, there is a large substrate excess in terms of number of substrate molecules in the entire culture dish, but in the cell there are approximately equimolar concentrations of substrate and enzyme at the practical threshold level, this threshold may be dominated by the cellular concentrations of the partners, implying that the replenishment of substrate at the site of enzyme may not be substantially faster than the regeneration of the free enzyme. As the immunofluorescence analysis of the recombinant cells showed, the mEH was especially highly concentrated in the endoplasmic reticulum that surrounds the cell nucleus, the target structure of genotoxic agents. This potentially leads to a filter effect for many lipophilic epoxides (such as the styrene oxide) interfering with their entering the cell nucleus. The mEH may turn the endoplasmic reticulum into a barrier that is hard to overcome for epoxides, which eventually leads to a large difference in epoxide concentration between the two sites separated by this barrier. The genotoxic effect of the epoxide would become apparent once the capacity of this barrier is exhausted.
Thus we present here an illustrative example—the detoxification of styrene oxide by mEH—of how practical thresholds in chemical carcinogenesis can be determined by the detoxication rate of the DNA-damaging intermediate. A number of factors such as the enzymatic mechanism and the subcellular compartmentalization of detoxifying enzymes synergize in the protection of the cells against these challenges. Also, the kinetics of processes in the activation of carcinogens may lead to nonlinearity in the dose-response curve of such chemical carcinogens. Such practical thresholds in carcinogenesis should be considered in the discussion on realistic risks.