
Abstract
Numerous studies of populations living in areas with good air quality have reported correlations between daily average levels of ambient particulate matter (PM) and daily mortality rates. These associations persist at PM levels below current air quality standards and are difficult to reconcile with the toxicology of PM chemical constituents. The unusual level of lethality per unit PM mass predicted by these associations may result from confounding by unmeasured societal, behavioral, or stress factors. Daily average ambient PM levels may be expected to correlate with societal activity level, because a working population increases PM emissions through increased manufacture, power utilization, construction, demolition, farming, and travel. Also, people's perceived and actual health depend on societal and psychological factors. A stress such as anger strongly increases the risk of death due to heart attack. Societal factors modify mortality as shown by calendar-related changes in mortality that are unrelated to air quality. Cardiovascular and respiratory mortality are correlated to day of the week, end of the month, and to the first week of the year. There is likely a role of such nontoxicologic variables in the PM associations, and without vigorously testing if other variables correlate as well as PM, we may erroneously conclude that reducing already low levels of PM will yield real public health benefits.
INTRODUCTION
Over the past decade, numerous mathematical analyses have tested for correlations between daily average concentrations of ambient air pollutants [gases and particulate matter (PM) as monitored regularly by the U.S. Environmental Protection Agency (USEPA) and similar agencies in other nations] and existing health statistics collected for monitoring trends in morbidity and mortality (Phalen, 2002; Stieb et al., 2002). Using sophisticated mathematical models, epidemiologists have reported small, positive correlations between increments in ambient PM levels and increments in death rates (Dominici et al., 2003). Despite considerable uncertainty on the meaning of such associations, published models have used associations to predict that low levels of outdoor PM (concentrations below health-based air quality standards) are causing some people in large populations to become sick and die (Levy et al., 2002).
The USEPA periodically reviews the air quality literature, and regulators considering the potential health effects of ambient air PM need the best possible understanding of how to interpret the epidemiologic time-series studies that report associations between fluctuations in day-to-day PM levels and fluctuations in day-to-day measures of mortality and morbidity. Because the PM associations appear to be at odds with laboratory experiments, human volunteer exposures, and toxicology of known PM chemical constituents, their role in supporting a new air-quality standard for PM is uncertain (NRC, 2002).
Although both cohort studies (Pope et al., 2002) and time-series studies (Samet et al., 2000) form the PM versus mortality database, the time-series studies are more numerous and are interpreted as providing support for a causal interpretation of the cohort studies. Figure 1 shows an example of the type of data that goes into the time-series studies. This figure illustrates a multitude of dots, each one of which represents a given calendar date. The point at which the dot is placed gives the daily ambient PM concentration in a metropolitan area and the daily death count for that date in the same metropolitan area. Even though the placement of the dots does not show an obvious relationship between deaths and PM levels, exhaustive mathematical analysis yields a slope of approximately 1.5% increase in daily deaths per 10 μg/m3 increase in PM concentration (Schwartz, 1992). Clearly, these associations are neither obvious nor dramatic, and a causal link is only one of many possibilities. Some of the published analyses clearly display the multitude of variables at play in these associations, namely, season, temperature, humidity, barometric pressure, as well as co-pollutant gases (NO2, SO2, O3, and CO) (Figs. 1 and 2 in Vedal et al., 2003). As emphasized by the famous epidemiologist A. Bradford Hill, the fundamental question that confronts interpretation of epidemiologic associations is whether “there is any other way of explaining the set of facts before us, … [is] any other answer equally, or more, likely than cause and effect?”
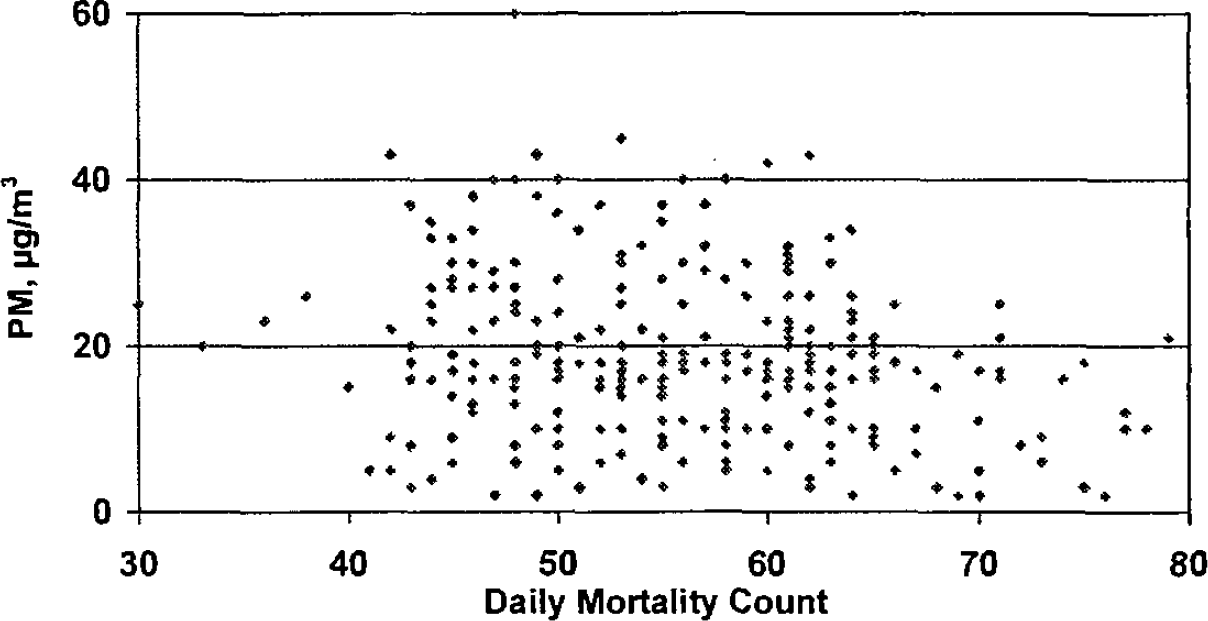
St. Louis, MO, data on daily deaths versus daily PM concentrations. Although the data appear randomly scattered, intensive statistical analysis predicts that daily mortality increases 1.5% for every 10 μg/m3 increment in PM.

Aside from a direct effect of PM, several separate pathways, all linked to PM, may causally affect daily mortality and morbidity rates.
One of the puzzling aspects of the PM associations is that neither a lower threshold of effect nor a specific dependence on PM chemical composition has been established. Because the results are not in agreement with the dose-response expectations for the major chemical components of PM (for example, sulfate, nitrate, elemental carbon), the role for a direct, causal link to PM versus an indirect, surrogate link to PM requires careful consideration. Could the unexpected level of lethality of PM, per unit mass concentration as derived from the time-series associations, be due to an alternative causal pathway(s)? As shown in Figure 2, multiple factors interact with PM in a way that may influence day-by-day variation in population mortality/morbidity rates. Aside from the possibility of a direct toxicologic effect of PM, three other pathways shown in Figure 2 may act as “classic confounders” for the PM effect. The possible causal role of PM in the time-series associations would be strengthened if the PM hypothesis survived serious attempts at disproof by invoking a role for one of the alternate causal pathways.
QUESTIONS ON TOXICOLOGY OF PM
Adverse health effects certainly can result from chronic inhalation of very high concentrations of airborne PM, as demonstrated by health statistics for cigarette smokers and for workers exposed to elevated levels (milligrams per cubic meter) of specific types of airborne PM. However, typical ambient PM levels are in the 10 to 30 μg/m3 range (Vedal et al., 2003) and would appear to be below known toxicological adverse-effect thresholds. Chemical toxicology, animal experiments, and human volunteer exposures in chambers have not as yet provided a mechanistic basis for health-effect associations with low, ambient PM levels (Gamble, 1998). Moreover, associations with health outcomes reported for ambient PM concentrations (10–30 μg/m3) are 100-fold below those typical of occupations where workers can be exposed to dusty conditions (1,000–3,000 μg/m3). If mortality rates were truly increased by, say, 0.5% over baseline for every 1 μg/m3 increment in PM (Levy et al., 2002), then worker health statistics should reflect a doubling of mortality risk at PM exposures above 200 μg/m3. Worker health statistics do not show such an effect (Gamble and Nicolich, 2000).
An additional difficulty is that if PM produces many different adverse health effects at low levels, then each effect likely depends on some presently unidentified, specific aspects of PM. Table 1 illustrates a matrix of PM characteristics versus health-endpoint associations, and the exposure—response functions that need to be entered in the vast majority of the cells of Table 1 are presently unknown at the low PM concentrations analyzed in the population studies.
Missing entries in this table designate the many unknown factors regarding what PM characteristic(s) is (are) responsible for the concentration—response associations seen between ambient PM mass concentration and health endpoints (assuming the PM associations have a causal basis)

“a” designates health endpoints for which associations have been reported.
Just as one would not attribute health effects to “generic gases” in the air, likewise, whether a given systemic, respiratory, or cardiovascular health outcome can arise from inhaled ambient PM depends on the nature of the PM, that is, its form and concentration and not on its status as “generic PM.” If the PM associations are causal, then some physical, biological, and chemical forms of PM may initiate or exacerbate adverse health effects at certain concentrations, while other forms and lower concentrations of PM may not. The mere “nongaseous” nature of airborne PM is not likely to trigger a respiratory-tract response, given that the maximum velocity with which a PM-2.5 particle can settle onto a lung surface is 0.02 cm/sec.
Some broader classifications aside from individual chemical species are possible. Just as several different chemical species of gas may fit into the category of irritant gases, there are several chemical species of aerosol particles that could be considered irritant particles. Thus, for example, a class of PM of different chemical composition that shared the characteristic of acidic PM could have similar effects in irritating the respiratory tract. But even here, different chemicals would have different irritancy dose-response functions.
A hallmark for causality is consistently finding a specific chemical species linked to a specific health effect. If the health-outcome associations consistently arise with undifferentiated PM, particularly at concentrations far below known toxicological thresholds, then one might suspect that the PM association reflects bias or confounding, which in turn diminishes the likelihood of causality.
OTHER FACTORS MAY GIVE RISE TO ASSOCIATIONS WITH PM
Outdoor air pollution levels are potentially measures of other factors, for example, increased anthropogenic activity (traffic, commerce, and industry) and changes in population indoor air pollution exposure. PM levels change from day to day, because (a) weather patterns change, (b) anthropogenic PM emissions change, (c) natural PM emissions change, and (d) atmospheric chemistry changes. It has long been noted that weather, temperature, and season have strong effects on mortality rates, and attempts are made to “smooth” these influences out of the daily mortality counts (Vedal et al., 2003). As factors (a) and (b) change, it is also true that (1) societal behavioral patterns change, (2) stress factors change, and (3) population “business activity” changes. Ambient PM levels are in general increased by increased societal activity (for example, through increased driving of cars and trucks, increased emissions from factories and power plants, resuspension of road dust, plowing of fields, construction, and various other kinds of dust-generating endeavors).
Factors that contribute to increased PM emissions (for example, increased human activity, increased cars and truck traffic, or increased working hours) plausibly increase the risk of (nonaccidental) mortality.* The psychological stress of anger is strongly associated with increased risk of deaths due to heart attacks, with heart attack risk going up 900% within an hour of an episode of anger (Moller et al. 1999). As another example, the symptoms and severity of asthma and respiratory episodes are affected by stress (Rietveld et al., 1999; Smyth et al. 1999). The well-known placebo effect is one demonstration of importance of psychological factors. The strength of such factors was demonstrated by the fact that the effect of Canada's doctors going on strike was to reduce mortality rates during the period of the strike (Robin, 1984).
Figure 3 shows that overall mortality rates exhibit end-of-the-month fluctuations (Phillips et al., 1999). Another study showed that among asian populations, the “4th day of the month” shows excess mortality (Phillips et al., 2001). These effects are considerably more dramatic than the effects illustrated for PM in Figure 1.

Effect of day of month on mortality rates. Total and average number of deaths in the United States on the first 14 days of the month and the last 14 days of the preceding month. The dashed line indicates the average number of deaths that would be expected if there were no day of month variation. Bars are 95% confidence intervals (Phillips et al., 1999, reprinted with permission).
Other studies have reinforced the fact that mortality rates have small but highly significant correlations with calendar date. Figure 4 illustrates the day-of-the-week variation in coronary symptoms and mortality rates (Müller-Nordhorn and Willich, 2000; Arntz et al., 2002). Moreover, U.S. National Health Statistics show a marked upswing in deaths between the last week of the calendar year to the first week of the New Year (Fig. 5). People's sense of health and well-being depends on societal and psychological factors. Societal activity thus affects both PM and health statistics and is a potential confounder in PM epidemiological studies.

Day-of-week variation in the onset of myocardial infarction. The dashed line indicates the average number of events that would be expected if there were no day-of-week variation (Müller-Nordhorn and Willich, 2000).

Mortality in the 122 largest cities in the United States during the week prior to and the week after the New Year (CDC mortality tables available at http://wonder.cdc.gov).
Certain characteristics of the PM—mortality associations are suggestive of a common societal factor rather than a common PM-mass-concentration factor. First, PM—mortality associations have been found for large populations in many settings around the world, regardless of the PM source. Second, the PM—mortality associations show no clear trend with PM chemical composition. Third, the PM—mortality associations seem not to have a lower, no-effect threshold, and in fact appear to increase in slope at lower PM concentrations (Samet et al., 2000). These characteristics suggest that PM is acting as a marker for time-varying factors common to human populations around the world, namely, variations in the intensity of activities such as manufacturing, travel, construction, and commerce.
CONCLUSIONS
The current literature on PM associations is dominated by repeated application of the same methodology (Samet, 2002). Reporting “yet another generally consistent correlation” does not constitute causation. For most of the health outcomes, the potential role of alternative causal pathways has not been carefully investigated. Outdoor air pollution levels are potentially measures of other factors such as societal changes and industrial activity. If traffic and other social stresses are causing frustration or psychosomatic effects that are increasing people's risk of asthma attacks, hospitalization, or sudden death, then lowering already low levels of ambient pollution may have no health benefit. An effective test of whether PM is the direct causal basis of the correlations is through rigorous efforts at disproof. If the PM hypothesis survives such a challenge, then it has been strengthened.
Repeatedly finding a PM association using the same input variables is not equivalent to ruling out alternative possibilities. Psychosocial studies have shown that stress, calendar events, and behavioral changes can have small but striking effects on population mortality, that is, health statistics are modulated by factors other than toxicological exposures. The possible role of nontoxicological variables in the PM time-series associations has not been rigorously tested. Possible surrogate markers for societal activity might include (1) daily retail sales, (2) daily traffic volume, (3) daily electricity usage, (4) daily auditory noise levels, (5) daily volume of telephone calls, (6) daily common-carrier passenger volume (bus, train, airplane), and (7) daily banking and stock transactions. If there is indeed a toxicological basis to the PM associations, scientists, policymakers, and regulators will feel more reassured if the PM associations survive a vigorous effort to test for possible confounding societal variables.
Footnotes
*
The existence of a statistical correlation between day-by-day traffic volume and day-by-day nonaccidental (for example, cardiovascular) mortality could be examined, but, to the author's knowledge, such an analysis has not been attempted.