
Abstract
Environmental exposures to ambient air particulate matter (PM), ozone (O3), environmental tobacco smoke (ETS), and to dioxin and related compounds are of considerable public health concern, and risk assessments for them have generally been based on linear, non-threshold models derived from epidemiological study data. While the epidemiological databases for PM, O3, and ETS have been sufficient to show that adverse health effects are occurring, the relative risks have been quite low, and it has not been possible, to date, to identify thresholds or non-linear relationships for them. For dioxin and related compounds, the evidence for excess cancer risks has been inadequate to establish causality, and there is suggestive evidence that hormesis may have occurred.
INTRODUCTION
It is generally recognized that epidemiology is a blunt tool, and that searches for evidence of either linearity or non-linearity in dose-response relationships are seldom successful. On the other hand, the epidemiological data bases for the criteria air pollutants are relatively rich, and the procedures used for setting National Ambient Air Quality Standards (NAAQS) in the U.S. and establishing Air Quality Guidelines (AQGs) by the World Health Organization (WHO) give preference to data from epidemiological studies (Lippmann and Maynard, 1999). When standards or guidelines are set, or quantitative risk assessments are performed for complex mixtures such as ambient air particulate matter (PM), environmental tobacco smoke (ETS), or dioxin and related compounds (dioxins), definition of the shape of the dose-response relationship is inherently more difficult. For these mixtures, exposures are characterized in terms of one component, and responses among the general public are characterized by relative risks (RRs) that are typically below 1.5, and sometimes below 1.1. The at risk component of the population is largely composed of individuals with uncommon genetic or age-related susceptibilities, pre-existing disease, or greater than average exposures. With all of these variables, the “noise” associated with them, and with the typically limited range of environmental exposures, it is generally assumed, in the absence of any mechanism based model, that there is a non-threshold linear dose-response relationship.
In this paper, I review the evidence for non-linear dose-response relationships in epidemiological databases for general populations for some complex mixtures, i.e., PM, ETS, and dioxin and related compounds. I also review the evidence for ozone (O3), as an example of a criteria pollutant that is a clearly defined chemical.
PARTICULATE MATTER
PM in the ambient air is composed of primary particles, i.e., those that are emitted into the air and remained suspended for some appreciable time, and secondary particles, i.e., those that form in the air from gaseous precursors. Some primary particles, such as soot from Diesel engine exhaust, remain in the accumulation mode of the particle size range (See Figure 1), but most of the primary particles are either of biological origin, or are mineral particles. The mineral particles are mechanically dispersed, are greater than 1 μm in aerodynamic diameter, have chemical compositions comparable to surface soils, are only slightly soluble in water, and are basic.

Representative biomodel mass distribution as a function of aerodynamic particle diameter for Phoenix, Arizona, showing effect of size-selective sampling inlet on mass collected for (a) wide-ranging aerosol classifier (WRAC), (b) standard total suspended particulate (TSP) high-volume sampler, (c) sampler following EPA's (PM10) criteria for thoracic dust, and (d) sampler following EPA's criteria for fine particulate matter (PM2.5).
By contrast, secondary particles, formed initially in high number concentrations in sizes in the low nanometer range, rapidly agglomerate, form droplets or aggregates in the 0.2 to 0.8 μm range, and remain suspended for many days in the absence of rain. Some are composed largely of semivolatile organic compounds, while others are inorganic acids or hygroscopic salts of sulfuric and nitric acids.
Routine monitoring of ambient air PM has been done by optical transmittance or reflectance [Black Smoke (BS), Coefficient of Haze (CoH)], or by mass. The mass concentration measures used have been: total suspended particulate (TSP); thoracic particles, i.e., those less than 10 μm in aerodynamic diameter that can penetrate the airways of the head (PM10); and fine particles (those less than 2.5 μm in aerodynamic diameter (PM2.5). All of these indices of PM concentration are chemically non-specific, although BS and CoH are most influenced by elemental and organic carbon in the particles. In arid regions, where windblown soil dominates the mass of measured PM10, there is generally a poor correlation between PM10 and PM2.5, and PM10 concentrations can vary widely. On the other hand, in the more humid eastern half of the U.S., where secondary aerosol dominates the mass of the PM, PM2.5 and PM10 are usually highly correlated, and both have relatively homogenous regional concentrations.
When relying on concentrations measured at central monitoring sites for epidemiological studies, regionally uniform concentrations can provide an index of population exposures to PM with less measurement error than can measures having more spatial concentration variations. This is especially true for PM2.5 of ambient air origin, for which indoor concentrations approach those measured out-of-doors.
Many different human health effects have been associated with ambient PM concentrations, including daily and annual mortality rates, hospital admissions for cardiopulmonary diseases, reduced pulmonary function and increased symptoms, and lost time from school and work. Some are most closely associated with PM2.5, most notably mortality and especially mortality attributed to cardiac disease. Others, such as upper respiratory symptoms and hospitalizations are more closely associated with PM10, or with the coarse particle component of PM10, i.e., PM10–2.5.
There is an enormous, and rapidly growing epidemiological literature on PM and mortality. EPA's latest Criteria Document draft for PM lists hundreds of time-series studies of daily mortality (EPA, 2003). Much of the recent focus on exposure-response for peak exposures to PM and daily mortality rates has centered on the National Mortality and Morbidity Air Pollution Study (NMMAPS) on the basis of its application of a uniform approach across many U.S. cities. For this study, Dominici et al. (2003) examined evidence for the presence of a threshold using the largest 20 U.S. cities for 1987–1994. Several analytic models were fit for each city separately. The best fit among the models, within each city and over all cities, were determined using the Akaike's Information Criterion (AIC). As shown in Figure 2, the results using the natural spline model showed that, for total and cardiorespiratory mortality, the spline curves were roughly linear, consistent with the lack of a threshold. For mortality from other causes, however, the curve did not increase until PM10 concentrations exceeded 50 μg/m3. The hypothesis of linearity was examined by comparing the AIC values across models. The results suggested that the linear model was preferred over the spline and the threshold models. Thus, these results suggest that linear models without a threshold may well be appropriate for estimating the effects of PM10 on the types of mortality of main interest.

Particulate matter < 10 μm in aerodynamic diameter (PM10)-total mortality concentration-response curves for total (TOTAL) mortality, cardiovascular and respiratory (CVDRESP) mortality, and other causes (OTHERS) mortality, 20 largest US cities, 1987–1994.
While there have been far fewer studies of annual mortality rates in relation to long-term PM exposure, the public health impact of such exposures is more quantifiable and considerably greater. Several large prospective cohort studies (Pope et al., 1995, 2002; Dockery et al., 1993, Laden et al., 2001) have shown that long-term exposure to fine particulate air pollution (PM2.5) is associated with increased risk of death from cardiopulmonary diseases. These findings indicate that people who live in areas with elevated PM2.5 experience cumulative adverse health effects in addition to acute transient effects. Since cardiovascular-related deaths account for the majority of cardiopulmonary deaths, these recent studies suggest that long-term exposure to PM2.5 causes chronic irreversible effects on the cardiovascular system. Figure 3 illustrates the exposure-response relationships between PM2.5 concentrations and mortality for the latest update on the American Cancer Society cohort study (Pope et al., 2002). It demonstrates increasing rates of cardiopulmonary and lung cancer mortality with increasing average concentration, and no PM2.5 influence on all other causes of mortality. It also shows no evidence for a threshold, but rather the steepest slopes at the lowest levels. A further analysis of these data, by Pope et al. (2004), illustrated in Figure 4, demonstrated that cardiac causes accounted for most of the excess deaths.

Nonparametric smoothed exposure response relationship for annual mortality. Vertical lines along x-axes indicate rug or frequency plot of mean fine particulate pollution; PM2.5, mean fine particles measuring less than 2.5 μm in diameter; RR, relative risk; and CI, confidence interval.

Cardiovascular mortality and lung cancer affected by long-term fine particulate matter. Relative risks and 95% CI's are shown for a 10 μg/m3 increase in annual average PM2.5 mass concentration. The size of the dots corresponds to the relative number of deaths. Sources: Pope et al., Circulation 109:71–77 (2004); Pope et al., JAMA 287:1132–1142 (2002).
The plausibility of a linkage between PM2.5 exposure and cardiac disease has been strengthened in recent years by laboratory exposures to concentrated ambient air PM (CAPs) in human volunteers (Ghio et al., 2000; Harder et al., 2001; Petrovic et al., 1999; Gong et al., 2000) and laboratory animals (Clark et al., 2000; Saldiva et al., 2002; Nadziejko et al., 2001, 2002; Godleski et al., 2000; Wellenius et al., 2003; Zelikoff et al., 2003; Gordon et al., 1998, 2000), which have demonstrated changes in heart rate and heart rate variability. In a panel study in humans, discharges of implanted cardiac defibrillators have been associated with PM2.5 concentrations (Peters et al., 2001). Other studies in human populations have demonstrated PM2.5 associated changes in heart rate and heart rate variability (Liao et al., 1999; Pope et al., 1999a,b, 2000; Gold et al., 2000; Creason et al., 2001). These studies showed that these markers of cardiac function varied in association with PM concentration.
Ambient PM concentrations have substantially declined in the U.S. since about 1960, when average TSP levels in large cities were several hundreds of μg/m3. By 1970, levels were closer to 100 μg/m3, and subsequent enforcement of air quality standards has brought average PM10 levels below 50 μg/m3. The decline in cardiovascular mortality illustrated in Figure 5 may be due, at least in part, to the coincident fall in PM concentrations.

Cardiovascular causes as a fraction of all deaths: U.S. 1900–1997.
ENVIRONMENTAL TOBACCO SMOKE
Environmental tobacco smoke (ETS) is a mixture of side-stream smoke released from the burning end of a cigarette and exhaled mainstream smoke, both of which are complex mixtures whose concentrations vary with butt length, inhaled smoke volume, and interval between puffs. Further changes in particle size and chemical composition occur while the smoke particles remains suspended in the indoor microenvironment into which they are discharged as particles grow by coagulation and shrink as semivolatile components, such as nicotine, evaporate.
Crude, but generally adequate indices of exposure of nonsmokers for epidemiological studies are: 1) the number of cigarettes smoked in the environment per day for acute effects; and 2) the number of pack-years of smoking by other occupants of the home or work environment. A more individual index of short-term exposure is the concentration of cotinine, a metabolic product of nicotine, in samples of blood or saliva.
Most epidemiologic studies of the health effects of ETS have assumed linear exposure-response relationships. Summaries of many of the effects of ETS on human health are available in the recent review articles listed in Table 1. Data on exposure-response for lung cancer relative work in relation to cumulative exposure is presented in Figure 6. The regression lines in this figure suggest a linear relationship, but the data points that are plotted therein are also consistent with a J-shaped relationship.
Summary of Significant Health Effects Associated with ETS Exposures


Relative risk of lung cancer by cumulative exposure to involuntary smoking. [Circles: Boffetta et al., 1998, triangles: Fontham et al., 1994].
DIOXIN AND RELATED COMPOUNDS
The issue of the shape of the exposure-response relationship for dioxin (2,3,7,8-Tetrachlorodibenzo-p-dioxin, aka TCDD) and related components was a controversial topic in the EPA Science Advisory Board (SAB) review (USEPA, 2001) of EPA's Risk Reassessment for dioxin. The related compounds include 17 dibenzo-p-dioxins (PCDDs) and dibenzofurans (PCDFs), as well as 13 planar polychlorinated biphenyls (PCBs) that all compete with TCDD for binding sites on the Ah receptor. Each compound has an assigned Toxicity Equivalence Factor (TEF). The Toxicity Equivalent Quotient for the mixture is the sum of the concentrations of dioxin-like compounds in the mixture multiplied by their corresponding TEFs.
In the SAB review (USEPA 2001), the Panel concluded that the actual shape of the low-dose exposure response relation could not be determined from the available data. Some Panel members believed that there may be evidence for anti-carcinogenicity of TCDD at low doses in the animal studies, and that EPA should have been more forthcoming about that evidence, i.e., the discussion should have been more complete, with consideration of what is known about the promoter-like characteristics of 2,3,7,8 TCDD. The Kociba (1978) study in rats actually showed a deficit for all tumors combined in all dose groups in comparison to the controls. That finding was statistically significant for the lowest two dose groups, and deficits in uterine, mammary, and pituitary tumors in female rats and pancreatic and adrenal tumors in male rats were statistically significant in the highest dose group. When the analysis was restricted to all malignant tumors, the data showed statistically significant deficits at the lower two doses and a statistically significant increase only at the highest dose (Kociba, 1982). The EPA risk reassessment document discounted most of the deficits as related to significant weight loss, but did not offer an explanation for the mammary tumor deficit. It also did not discuss the implications of significant weight loss on the evaluation of maximally tolerated dose. Without the highest dose, the Kociba experiment would have been judged negative. Kociba's own conclusion was that the data “indicate that doses of TCDD sufficient to induce severe toxicity increased the incidence of some types of neoplasms in rats, while reducing the incidence of other types.”
Similarly, in the Pitot et al. (1987) study, the investigators examined the numbers and size of altered hepatic foci (AHF) in livers of adult female rats. The authors concluded in the abstract of the paper that “At several sub-threshold doses of PB and TCDD an inhibition of AHF formation and growth … was observed.” These findings from Kociba et al. (1978) and Pitot et al. (1987) suggested to some SAB Panel members that TCDD might be a net carcinogen at higher exposures but a net anticarcinogen at lower exposures, raising the possibility that TCDD would be an anti-carcinogen in the human population at current levels of exposure. The Panel concluded that EPA should acknowledge the possibility that reducing current body burdens of TCDD might lead to no change at all in cancer incidence, or even a net increase. Given the uncertainty in the data, the Panel agreed that choice of complex models cannot be justified.
The occupational epidemiological studies on the carcinogenesis of dioxin that EPA relied on in their risk reassessment were considered to be inconclusive by most members of the SAB Panel on the basis that most of them could not control for smoking on for exposures of the chemical plant workers to other toxic chemicals. Subsequent to the SAB Panel's report, several papers have carefully reviewed the epidemiological studies of dioxin exposed workers.
Starr (2001) showed the all cancer standardized mortality ratios (SMRs) for the three largest occupational cohorts. As shown in Figure 7, the SMRs were above 1 for all but one of the cohorts, but were relatively independent on body burdens over a range extending over three orders of magnitude. I interpret these results as indicating that the SMRs were more likely elevated because of exposures to cigarette smoke and/or other workplace exposures than to dioxin exposure.
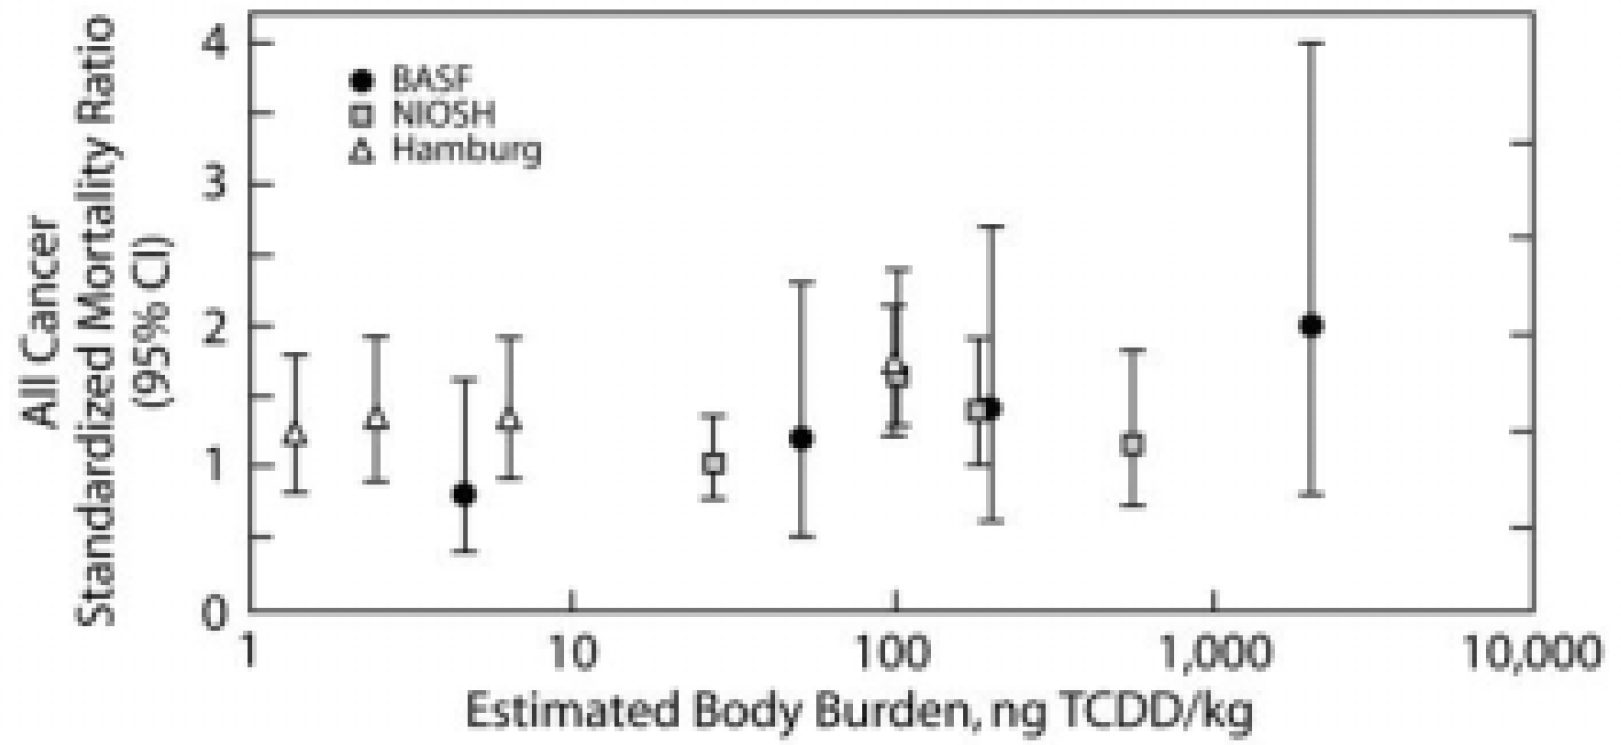
Standardized mortality ratios (SMRs) and 95% confidence intervals for all-cancer mortality versus estimated lifetime average TCDD body burden for twelve study/exposure subgroups in the initial dose-response analyses.
Crump et al. (2003) analyzed data from the same cohorts and fit a linear model to them. They concluded that there was a significant dose-related trend (See Figure 8). However, it is clear that this conclusion depends on the presence of the few very high doses on the right side of the plot.

SMRs (with 95% confidence bounds) from three studies categorized by cumulative lipid concentration, adjusted to include background TEQ.
Bodner et al. (2003) added 10 years of follow-up to the largest cohort (over 2,000 workers) within the NIOSH study, and “found no coherent evidence of increased cancer risk from dioxin exposure”.
Mackie et al. (2003) did an analysis of the NIOSH cohort and two non-occupational cohorts. They were a relatively large population exposed by a large accidental release in Seveso, Italy, and a relatively small population of military personnel exposed to Agent Orange in Vietnam (Ranch hand study). As shown in Figure 9, the data were fitted two ways. Giving equal weight to each study's SMR showed a flat exposure-response relationship. Weighting each study's SMRs according to population size suggests that lower dioxin exposures are protective against cancer.

Population-weighted and unweighted linear-log regressions of SMR for all cancers versus TCDD exposure. The shaded area shows the range of general population TCDD exposures.
In my view, these dioxin epidemiological data provide no convincing evidence that dioxin is carcinogenic to humans at exposures within several orders of magnitude of current general population exposures, and that hormesis may be consistent with these results.
OZONE
For a single toxicant like O3, it is possible to explore the nature of exposure-response for short-term exposures and acute responses in humans under controlled laboratory conditions and in field studies (Lippmann, 2000). Furthermore, O3 is a very strong oxidant and has a limited range of reactions with lung cells and lung surface fluids. Despite these advantages, in comparison with the complex mixtures discussed previously, there are many variations in human responses to O3 exposure that remain poorly understood. Well documented responses to short-term exposures include: deficits in pulmonary function; increased respiratory symptoms; increased hospital admissions for respiratory diseases such as asthma, influenza, pneumonia, and chronic obstructive pulmonary disease (COPD) (Lippmann, 2000). There are also increased rates of daily mortality as illustrated in Figure 10 from Thurston and Ito (2001). By contrast, chronic exposure to O3 has less effect on lung function growth in children than other pollutants in ambient mixtures, such as nitrogen dioxide, acid vapors, and fine particles (Gauderman et al., 2002), and no apparent effect on annual mortality rates (Pope et al., 2002).

Total mortality RR versus O3 concentration (adjusted for weather, season, day-of-week, and PM) in Detroit, MI.
In studies by Horstman et al. (1990) involving 6.6 hours of O3 exposure in chambers at 80, 100 and 120 ppb with moderate exercise in young adult volunteers, the average deficit in forced expiratory volume in one second (FEV1) grew steeper with each hour of exposure in a concentration related fashion (See Figure 11). However, when examining the variability of responses among those exposed in the same protocol (See Figure 12) it can be seen that some individuals exposed at 100 and 120 ppb had very little, if any, response, while others had FEV1 reduced by half. It has also been shown that individuals have reproducible responses. Susceptibility factors that could account for such extreme variability have been sought, but not yet found, other than that the FEV1 response varies with age (See Figure 13). It is also of interest that other health effects endpoints were measured in some of the volunteers who were exposed to O3 in the series of 6.6 hr studies. Devlin et al. (1991) reported that a significant inflammatory response, as indicated by increased levels of neutrophils, was also observed in bronchohalveolar lavage fluid from subjects exposed to either 80 or 100 ppb O3 for 6.6 hours. As illustrated in Figure 14, the 6.6 hours at 100 ppb O3 produced a 3.8-fold increase in neutrophils at 18 hours after the exposure, whereas the 6.6 hours at 80 ppb produced a 2.1-fold increase. The amounts of O3 inhaled in the 80 and 100 ppb protocols were about 2.0 and 2.5 μg, and about 3.6 μg in the 400 ppb protocol. Thus the effect of concentration was apparently somewhat greater than that of exposure duration. The significant increase in neutrophils at a concentration as low as 80 ppb suggests that lung inflammation from inhaled O3 has no threshold down to ambient background O3 levels.

Mean FEV1 after each 50 min of exercise during exposures to O3 at 0 (open circles), 80 ppb (squares), 100 ppb (triangles), and 120 ppb (solid circles). Asterisks indicate significant reduction in FEV1 from corresponding values at 0 ppb. From Horstman et al., Am Rev Resp Dis 142:1158–1163 (1990).
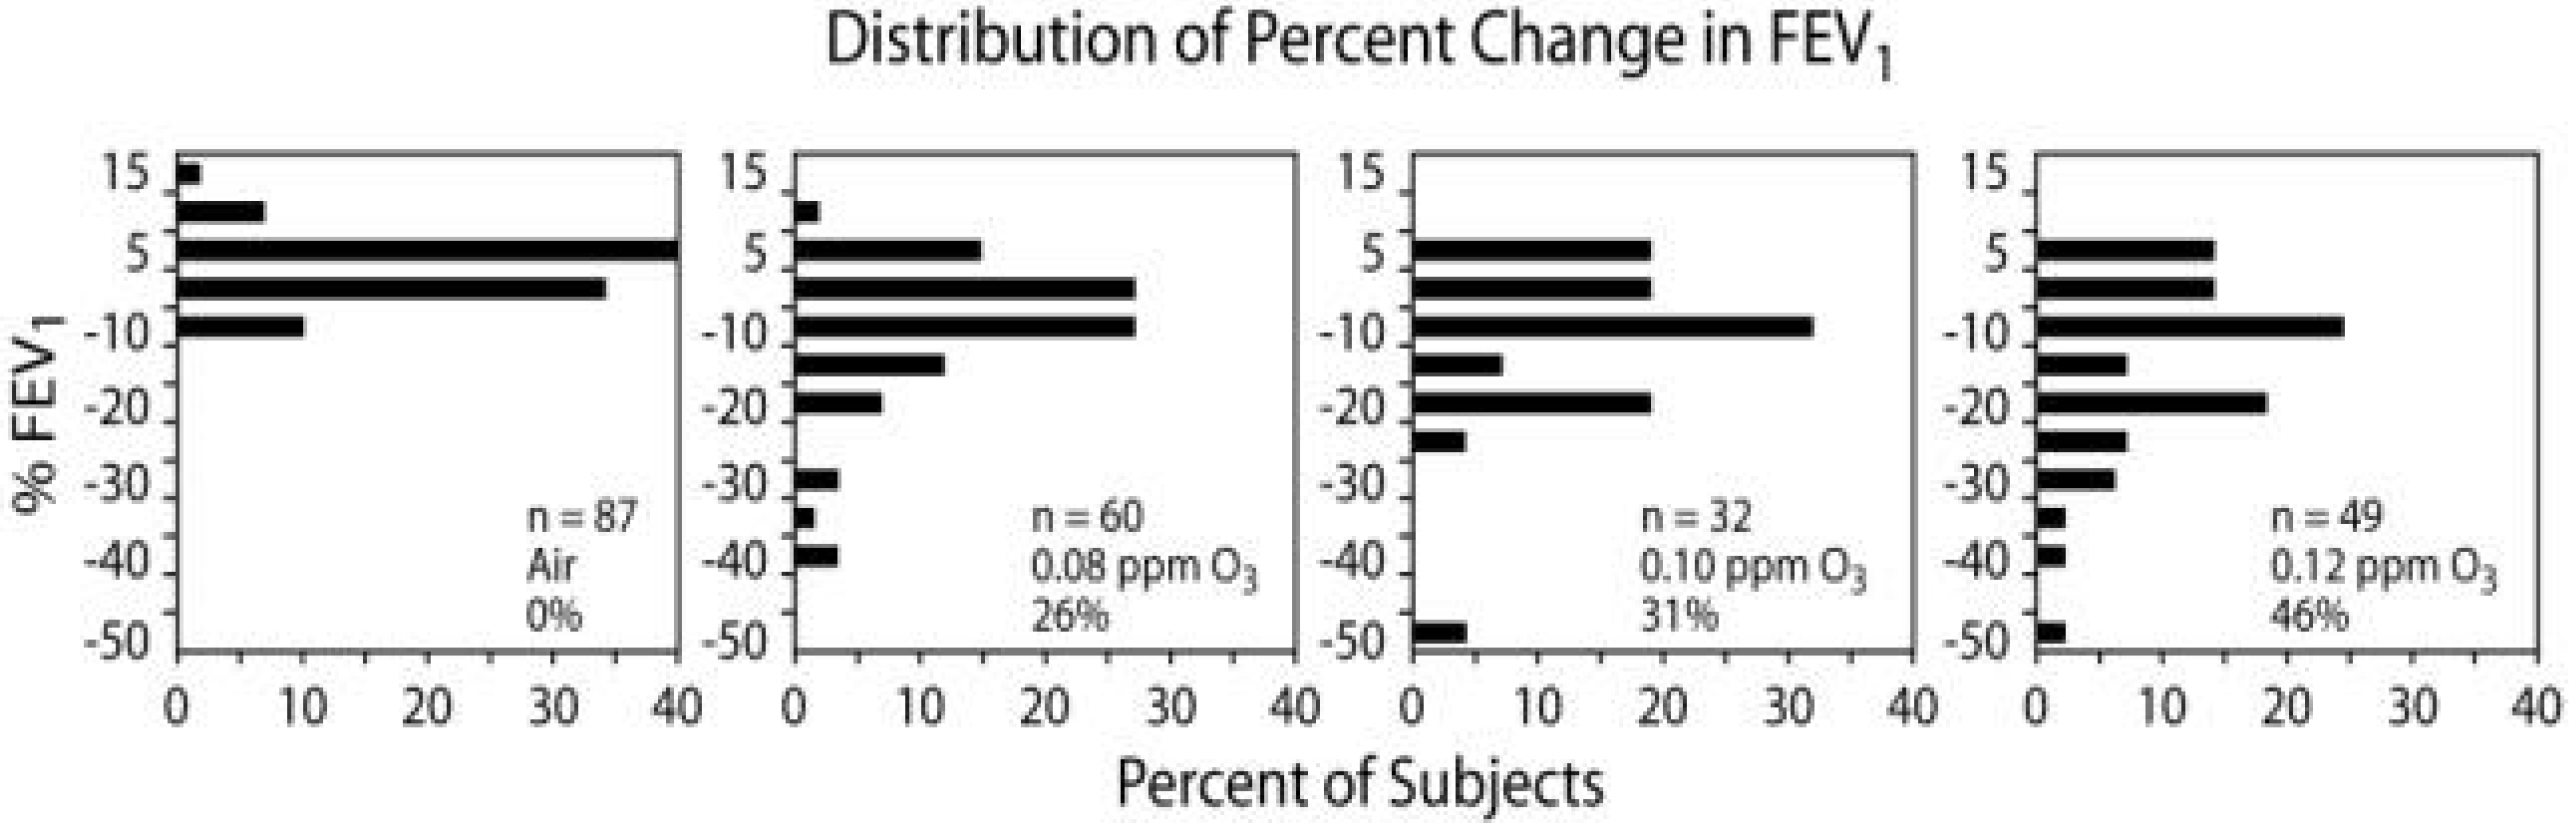
Percentage change in FEV1 in healthy nonsmokers following 6.6 hours exposures to clean air and O3 at 80, 100, and 120 ppb during exercise lasting 50 minutes of each hour for studies performed at EPA's Clinical Research Laboratory at Chapel Hill, North Carolina. Each box shows the number of subjects studied and the percentage of subjects with reductions in FEV1 that were greater than 10%.

Predicted mean decrements in forced expiratory volume in L(ΔFEV1) following 2 hours exposures to ozone while undergoing heavy intermittent exercise for three ages. (Note: To convert ΔFEV1 to % ΔFEV1, multiply by 22.2%.) From: McDonnell et al., Am Rev Resp Dis 147:818–825 (1993).

Range of subject response 18 hours after 6.6 hours of O3 exposure at 100 ppb (closed circles) or 80 ppb (open circles). Squares indicate the mean changes (±SE). From: Devlin et al., Am J Resp Cell Mol Biol 4:72–81 (1991).
Other studies indicate that the inflammatory process caused by O3 exposure is promptly initiated (Seltzer et al., 1986) and persists for at least 18 hours (Koren et al., 1989). The time course of this inflammatory response and the O3 exposures necessary to initiate it, however, have not yet been fully elucidated. Furthermore, these studies demonstrate that cells and enzymes capable of causing damage to pulmonary tissues were increased, and the proteins that play a role in the fibrotic and fibrinolytic processes were elevated as a result of O3 exposure.
Of further interest is the fact that different individuals exhibit different kinds of responses to these controlled O3 exposures. The levels of O3-induced symptoms and respiratory tract injury and inflammation have not been closely correlated with the levels of decrements seen for FEV1 or other functional parameters.
In terms of epidemiological studies focussed on associations between community air concentrations to O3 and health effects there is little evidence for non-linearity. Figure 15, from Burnett et al. (1984), illustrates an essentially linear relationship between daily O3 1 hour peak levels and hospital admissions for respiratory diseases. Figure 16, from Yang et al. (2003), shows that effect size for respiratory hospital admissions varies with age, as noted earlier for controlled chamber exposure studies, with some differences for the elderly (age > 65 years) according to socioeconomic status.

Average number of adjusted respiratory admissions among all 168 hospitals by decile of the daily 1 hour maximum ozone level (ppm), lagged 1 day. From: Burnett et al. (1984).

Adjusted odds ratios (95% confidence intervals) for respiratory admission associated with ozone adjusted for copollutants (carbon monoxide, nitrogen dioxide, sulfur dioxide, and CoH) exposures by socioeconomic status, Vancouver, Canada, 1986–1998.
In summary, even for a well-defined pollutant such as O3, which tends to be relatively uniform in outdoor concentration over broad geographic areas, it is difficult to determine if non-linear exposure-response relationships for general populations. Thus, the assumption of a linear, non-threshold relationship when establishing ambient air quality standards or issuing public health advisories appears to be reasonable and prudent.
Footnotes
ACKNOWLEDGMENTS
The research in this paper was supported, in part, by Center Grants ES 00260 from the National Institute of Environmental Health Sciences and R 827351 from the U.S. Environmental Protection Agency.