
Abstract
In the Belgian supercontainer concept, a carbon steel overpack will surround high-level waste and spent fuel containers and be encased in a cementitious buffer material. A programme of research has been carried out to investigate and measure the rate of anaerobic corrosion of carbon steel in an artificial alkaline porewater that simulates the aqueous phase in the cementitious buffer material and also in solid cement matrices. This paper highlights the main features of the programme and presents some recent results from the analysis of several samples, including two 20-year-old steel in cement samples, which showed that under anoxic conditions there is no localised corrosion or incorporation of iron into the surrounding cement, even in the presence of 20 000 ppm chloride in the porewater.
This paper is part of a supplement on the 6th International Workshop on Long-Term Prediction of Corrosion Damage in Nuclear Waste Systems.
Introduction
The reference design for the Belgium supercontainer for disposal of high-level nuclear waste and spent fuel consists of a 30-mm-thick carbon steel cylindrical vessel (‘the overpack’) surrounding 309 grade stainless steel waste canisters or spent fuel assemblies. The overpack will be surrounded by a cementitious buffer material, which, in turn, will be entirely encased in a stainless steel vessel (‘the envelope’). This paper is concerned with the anaerobic corrosion processes that may affect the carbon steel overpack within the supercontainer. The carbon steel will be exposed to alkaline porewater in the cementitious buffer or in the alkaline self-compacting mortar that may be used as a filler in the annulus between the cementitious buffer and the overpack. After a relatively short period, the interface between the steel and alkaline porewater will become anoxic as oxygen is consumed by aerobic corrosion. Low concentrations of chloride (∼100 ppm) from the Boom clay groundwater may penetrate the buffer and reach the surface of the overpack, but there is also a possibility that sulphur species may arise in the groundwater surrounding the supercontainer assembly [1,2]. This may lead to sulphate concentrations as high as 20 g L−1 sulphate, together with 720 mg L−1 thiosulphate in the disturbed zone [3].
A programme of research has been carried out to investigate and measure the rate of anaerobic corrosion of carbon steel in an artificial alkaline porewater that simulates the aqueous phase in the cementitious buffer material and also in solid cement matrices. Much of the work carried out to date is described in previous papers [4–8]. This paper presents a high-level overview of the work that has been carried out to date. It also presents recent results obtained from modelling the experimental measurements of long-term corrosion rate and the analysis of a number of long-term anoxic corrosion experiments, including two legacy experiments on steel in cementitious grout (>20 years old).
The main themes of the work to date have been to
Measure the corrosion rate of a representative carbon steel in alkaline conditions simulating the cementitious porewater containing a range of possible contaminants; Study the electrochemical behaviour of carbon steel in anoxic alkaline conditions in the presence of a range of possible contaminants; Characterise the corrosion product layers formed in anoxic alkaline conditions.
The anaerobic corrosion of iron releases hydrogen by the following overall reaction:


Experimental
The overall experimental programme consisted of two parallel sets of measurements: first to monitor the rate of gas generation due to the anaerobic corrosion of carbon steel in alkaline conditions and second to monitor the electrochemical behaviour of carbon steel in simulated cementitious conditions, under both unirradiated and irradiated conditions. The experimental details are given below.
Temperature
The experiments were carried out at temperatures of 25 and 80°C. This range of temperatures was chosen to provide data over a range of possible operational conditions and periods after closure of the repository.
Materials
The carbon steel currently proposed for use in the supercontainer is P355 QL2 (EN 10028-6 steel number 1.8869; ASTM designation: A516 gr. 70; commercial name: CarElso 70 SOHIC), but the nearest grade obtainable in wire form at the time of the corrosion experiments described in this paper was Grade 1017, which has the composition (wt-%): C 0.17; Si 0.06; Mn 0.81; P 0.01; S 0.03; Cr 0.038. This steel was used in the form of 0.4 mm diameter wire; wire was used to provide a high surface area in the gas generation experiments. The total nominal exposed surface area of the wire was 0.1 m2.
The cementitious buffer used in the Belgian supercontainer concept has the following composition (kg m−3): CEM I 42.5 N-LA-HSR-LH: 350; Calcitec 2001 MS (ground calcium carbonate): 50; sand 0/4 (limestone): 708; calcareous aggregates (2/6): 414; calcareous aggregates (6/14): 191; calcareous aggregates (6/20): 465; w/c ratio 0.50; superplasticiser (Glenium, PC): 4.4. The corrosion experiments were carried out in a simplified model porewater for this buffer material, corresponding to a relatively short period of time in the repository (known as ‘Young cement porewater’, YCW), with the following composition (mmol L−1):  2.4; OH− 510; K+ 370; Na+ 140; pH ∼13.4. Test solutions for the corrosion experiments were prepared under argon (<10 ppm O2) in a glovebox. Some tests used Cl (as NaCl),
  (as Na2S2O3·9H2O) and/or S2− (as Na2S·9H2O).
After pickling, the steel wires used for most of the measurements in the presence of sulphur species were pre-corroded for 12 weeks in YCW at 80°C, to simulate the development of a corrosion product layer before sulphide reaches the surface of the carbon steel overpack surface.
Measurements of gas generation
The rate of hydrogen production due to the anaerobic corrosion of steel wires in YCW was measured using a barometric gas cell technique and the experimental procedures that have been described previously [4–8]. The volume of gas produced by corrosion is calculated from the change in the height of the mercury column over long exposure periods and the results are normalised to standard temperature and pressure. The test pieces and solutions were placed in zirconia crucibles, which were used because of their resistance to chemical and radiochemical degradation in alkaline conditions. Any gas produced in the test cell caused a pressure increase, which resulted in the mercury rising up a glass manometer column and the increase in height was used to calculate the corrosion rate, based on Equation (2) (i.e. formation of magnetite was assumed). Control cells were operated in an identical way to the test cells, but did not contain any steel wires. The results from the cells containing steel wires were adjusted by deducting any pressure fluctuations that occurred in the control cells.
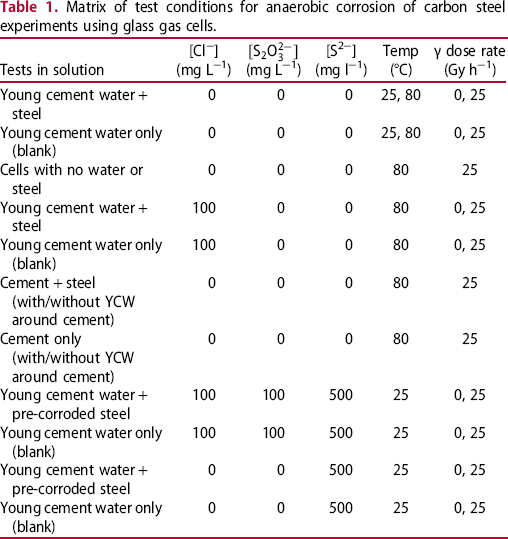
Matrix of test conditions for anaerobic corrosion of carbon steel experiments using glass gas cells.
 (mg L−1)
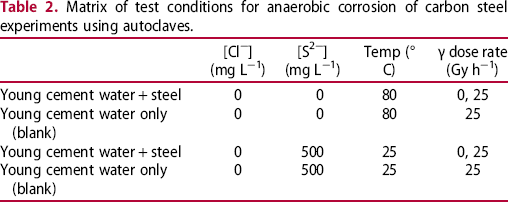
Matrix of test conditions for anaerobic corrosion of carbon steel experiments using autoclaves.
Dismantling and analysis of gas cells
Over the course of the programme, a number of samples in the test matrix were dismantled and weight loss measurements were performed, to check the uniform corrosion rates and the values obtained from the hydrogen gas generation tests. Good agreement between weight loss measurements and gas generation measurements was observed [8]. The corrosion product was analysed using Raman spectroscopy to determine the mineral composition, and scanning electron microscopy (SEM) along with energy-dispersive X-ray analysis (EDXA) was used to identify the morphology, composition and extent of any localised corrosion damage on the steel surface. Focused ion beam (FIB) sectioning of the oxide film on one specimen was performed on one sample and the results from this analysis are presented in reference [8]. Weight loss measurements were carried out in the glovebox according to standard practice [9], using Clarke's solution (inhibited hydrochloric acid) as the descaling agent, and the weight loss was converted to a corrosion rate expressed as µm/year.
Electrochemical measurements
The electrochemical behaviour of anaerobically corroding steel was investigated in anoxic alkaline porewater simulant. Electrochemical measurements were carried out in stainless steel autoclaves (unirradiated experiments), or glass cells (irradiated experiments), containing two anaerobically corroding steel wires, for corrosion measurements, one gold electrode for Eh measurements, and one platinum counter electrode for Eh and polarisation measurements. A Hg/HgO reference electrode, using YCW as the electrolyte, was used. Several designs of reference electrode were developed and tested, but the most stable one was found to be the one in which a slug of grout was used as the solution junction and the components of the reference electrode were mounted in a small zirconia thimble. In addition, a mixed metal (Pt–Ir) oxide reference electrode was also used as a pseudo-reference electrode. The test solution was placed in a zirconia crucible, as for the gas cell measurements, and the cell was assembled in an argon-purged glovebox. The cells were used to monitor the corrosion potential of the carbon steel electrodes.
Analysis of long-term anaerobic corrosion experiment
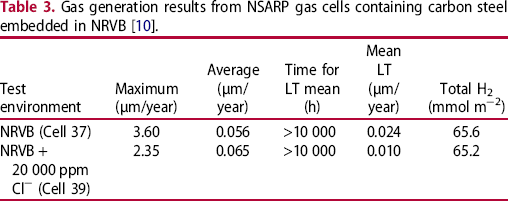
Gas generation results from NSARP gas cells containing carbon steel embedded in NRVB [10].
As they did not have the manometers fitted after monitoring ceased, it was not possible to monitor any residual gas generation after monitoring stopped. However, in order to investigate the behaviour of the steel in the anoxic grout after a long exposure period (i.e. 7-8 years at 50°C, then ∼15-16 years at ambient temperature), the two cells were dismantled and analysed. A gas sample from the cells was analysed by gas chromatography and the presence of residual hydrogen in the gas cell confirmed that the cell had remained sealed during storage. The glass cell was broken open in an anoxic glovebox and samples were removed for analysis by SEM-EDXA, Raman spectroscopy and weight loss measurements [9]. Examination of a sample of near-surface grout with phenol phthalein pH indicator showed that no carbonation had occurred, supporting the conclusion that the sample had not been exposed to air during storage. In addition, synchrotron analysis using the DIAMOND light source at Harwell, UK was used to carry out X-ray fluorescence and X-ray absorption spectroscopy (XAS, specifically extended X-ray absorption fine structure, or X-ray absorption Near Edge Structure) measurements for iron in the cement near the steel interface, and X-ray tomography measurements to image the cement/steel interface.
Results
Gas generation results
Examples of the results from the gas cell measurements, expressed as anaerobic corrosion rates (assuming magnetite formation), for the gas cells from Phase 2 of the programme are shown in Figure 1 for unirradiated and irradiated conditions, respectively. This plot shows the data corrected using the blank cells (i.e. the gas generation rates have been corrected to allow for gas released due to thermal effects). The fluctuations in the corrosion rate plot are due to fluctuations in the instantaneous corrosion rate between measurements, which are based on the amount of gas produced since the previous measurement. The long-term corrosion rate is <0.1 µm/year, but there is some noise in the instantaneous corrosion rate measurements.
(a) Example results for anaerobic corrosion rate for carbon steel in Young cement water simulant, under unirradiated and irradiated conditions, as a function of temperature and chloride concentration (Phase 2). Calculated assuming Fe3O4 (adjusted against control cells); (b) modelling of cumulative gas generation data from anaerobic corrosion experiment (Cell 3R: carbon steel in YCW at 25°C, 0 ppm Cl, 0 Gy h−1).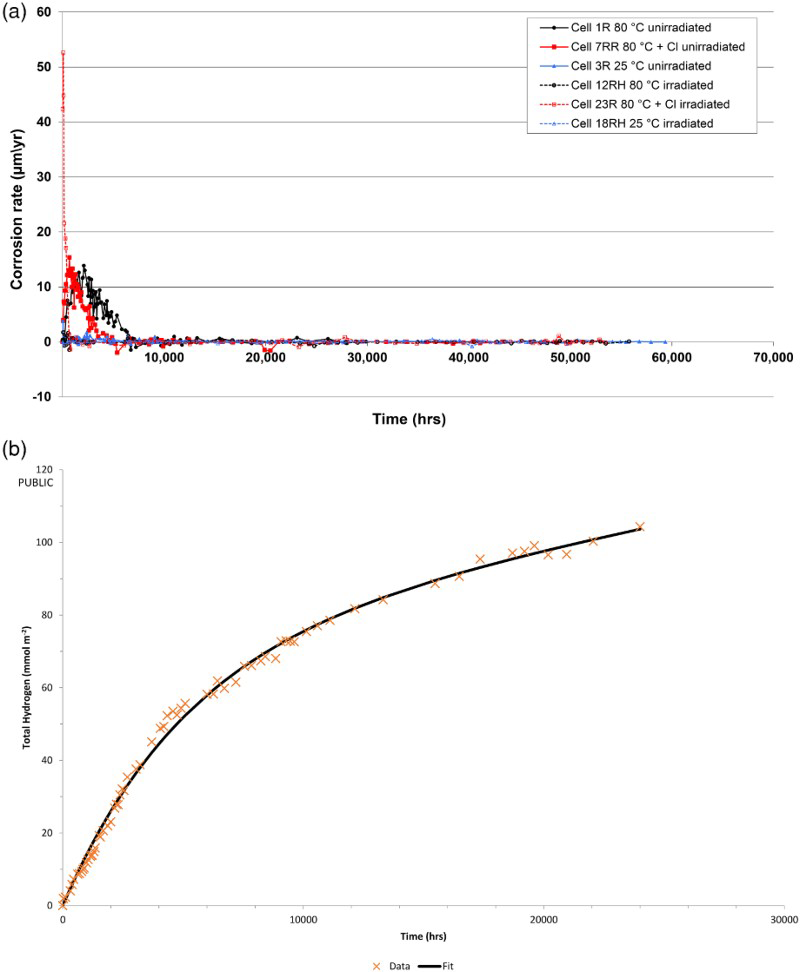
In order to be able to extrapolate the gas generation rates to long timescales, the results for the cumulative amount of hydrogen generated against elapsed time from one experiment (Cell 3R, unirradiated, 25°C, 0 ppm Cl) were fitted mathematically (Figure 1(b)). The requirement was to fit these data using a (nonlinear) model, and then to determine the parameter values in the model. The general objective was to ‘guess’ a model that could be used to fit the data, and then to use a nonlinear solver to determine the parameter values that gave a best fit for that model to the data. In particular, it was assumed that
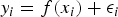
 is the cumulative amount of hydrogen generated at elapsed time
  ,
,  is the model, and
  is the error between the model and the corresponding datum. Then, the parameters in the model were determined by minimising the sum of the squares of the errors between the model and the data. (Note that this ordinary least squares method makes a tacit assumption that the measurement error in
  is negligible.)
Initially, Microsoft Excel was used to plot the data together with various model fits; the Excel function ‘Solver’ was used to find the parameter values. From the data, it is apparent that there is an initial period of rapid corrosion (acute corrosion) that is followed by a prolonged period of slower corrosion (chronic corrosion). The best fit was obtained using the decaying exponential term of the form:
a = 1.4107 10−2 with a standard deviation of 2.38 10−4, so that the 95% confidence interval for this parameter is 1.363 10−2–1.458 10−2; b = 1.9363 10−4 with a standard deviation of 1.28 10−5, so that the 95% confidence interval for this parameter is 1.682 10−4–2.191 10−4; and c = 1.3123 10−3 with a standard deviation of 2.07 10−4, so that the 95% confidence interval for this parameter is 8.984 10−4–1.726 10−3.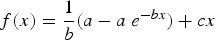
 ,
,  and
and  are unknown model parameters. Note that the corrosion rate
  (mmol m−2 h−1) is determined by taking the derivative of
  , so that
The actual fit is shown in Figure 1(b). This equation could be used to extrapolate the gas generation rate to long time periods and hence to calculate an equivalent corrosion rate value in µm/year.
An example of the data obtained by monitoring gas generation using an autoclave system for pickled steel wire (i.e. no pre-corrosion) in YCW containing 500 mg L−1 sulphide is shown in Figure 2. The plot shows the cumulative hydrogen production curve and the corresponding integrated measurements of corrosion rate since the start of the experiment, which were smoothed using a running average over a period of 96 readings. This plot shows that the corrosion rate was still decreasing even after more than three years’ exposure, according to an exponential decay relationship.
Autoclave experiment to measure corrosion rate of pickled carbon steel wires in YCW + 500 mg L−1 sulphide in an autoclave at 25°C – total hydrogen produced at STP and the corresponding integrated corrosion rate based on a moving 96-point average smoothing procedure.
Electrochemical measurements of carbon steel in the anoxic alkaline solutions
The main feature of the long-term potential measurements was the highly negative value of the potential of the platinum and Mox electrodes, in the range −700 to −800 mV vs. SHE, indicating an anoxic environment, and the corrosion potential of the carbon steel, which was in the same potential range; this is consistent with the formation of magnetite, based on the Pourbaix diagram for iron.
Composition of corrosion product layers
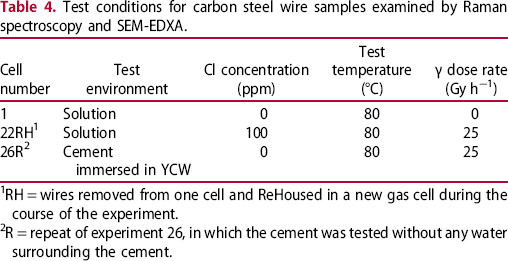
The conditions inside the gas cells that were removed and examined by Raman spectroscopy and SEM-EDXA are listed in Table 4. Raman spectroscopy analysis of wire samples removed anoxically from all the cells examined showed that the predominant corrosion product was magnetite (Fe3O4). A selection of SEM images of the surfaces of wire specimens removed from the experiments is shown in Figure 3.
SEM images and EDXA of surfaces of carbon steel wires removed from various anaerobic corrosion gas cell experiments – see Table 4 for details. (a) Cell 1 SEM, (b) Cell 1 EDXA, (c) Cell 22RH SEM, (d) Cell 22RH EDXA, (e) Cell 26R SEM, (f) Cell 26R EDXA. Test conditions for carbon steel wire samples examined by Raman spectroscopy and SEM-EDXA. 1RH = wires removed from one cell and ReHoused in a new gas cell during the course of the experiment. 2R = repeat of experiment 26, in which the cement was tested without any water surrounding the cement.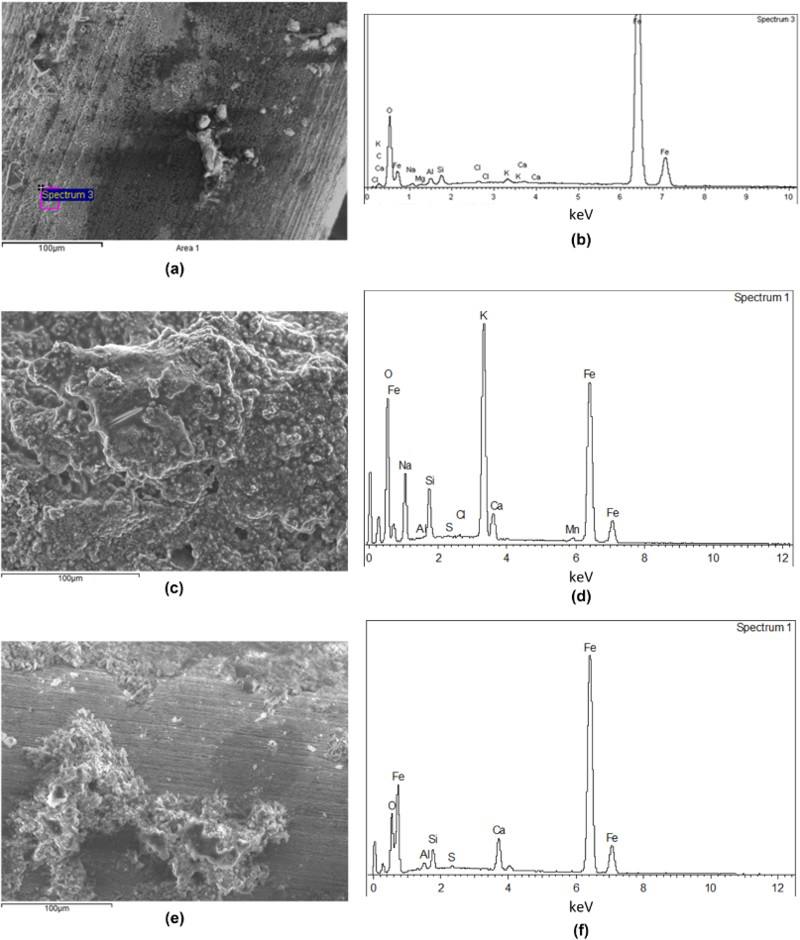
The SEM-EDXA examination showed that main components of the surface of the steel were iron and oxygen, with residues from the test solution (Cell 1 and 22RH: K, Na, S) or the cement (Cell 26R: Ca, Al, Si). No signs of localised corrosion were apparent on the surface of any of the wires examined. The morphology of the surface is different between Cells 1 and 22RH, with the only difference being the dose rate, suggesting that the presence of radiation and/or chloride affects the morphology of the surface but not the measured gas generation rate.
Analysis of long-term anaerobic corrosion experiment
Photographs of the specimens analysed, showing the steel wires embedded in NRVB, are given in Figure 4(a,b) in which the rings indicate the wires analysed using the synchrotron and subsequently by SEM-EDXA. Figure 4(c,d) shows the areas analysed by XRF prior to carrying out XANES measurements at specific locations. Example XRF data for the areas shown in Figure 4 are shown in Figure 5, which also shows the areas subsequently analysed by XANES. The XRF results show that there was no clear enhancement in the iron concentration in the cement near the steel interface, but localised regions of elevated iron concentration were present in the bulk matrix of the cement.
Samples removed from long-term carbon steel in NRVB anaerobic corrosion experiments: (a) Cell 37, 0 ppm Cl; (b) Cell 39, 20 000 ppm Cl in porewater. The rings show wires analysed by XAS. Lower images show areas of samples analysed for Fe by XRF in synchrotron: (c) Cell 37, 0 ppm Cl; (d) Cell 39, 20,000 ppm Cl in porewater. Examples of XRF Fe data for areas of (a) Cell 37, 0 ppm Cl; (b) Cell 39, 20 000 ppm Cl in porewater, also showing position of XAS measurements. The colour scale indicates the relative intensity of the iron signal.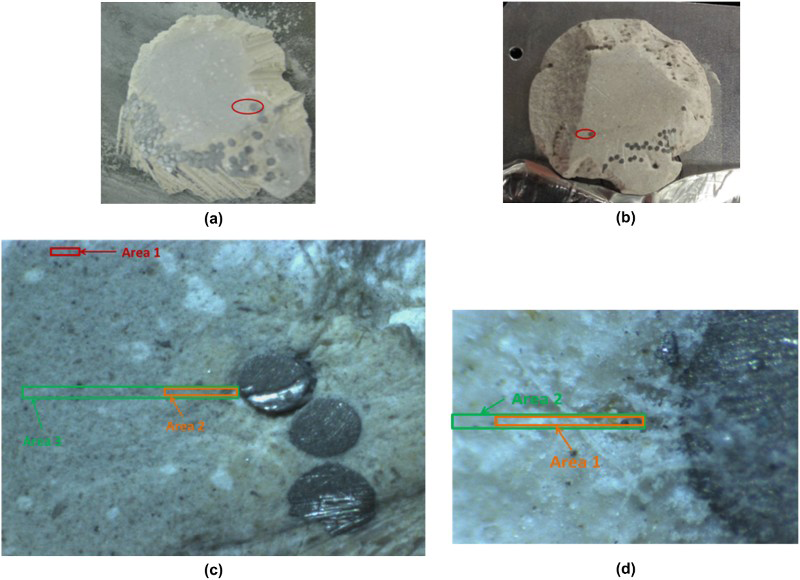
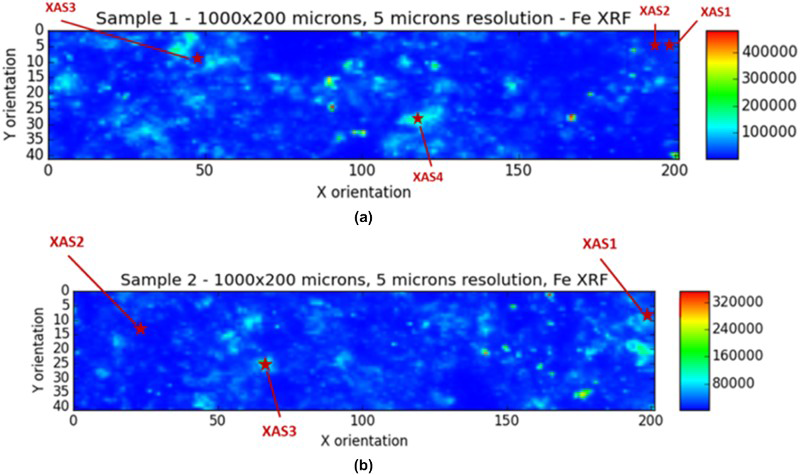
For Cell 37, XAS1 corresponds to an interface between a wire and a cement area. XAS2 is nearby the location of XAS1 but further from the wire. XAS3 indicates the lowest Fe concentration across the studied area and XAS4 corresponds to an area with higher Fe concentration. Figure 6 presents the normalised Fe K-edge XANES spectra for Cell 37 collected at the positions shown in Figure 5 (Sam1_wire was outside the recorded XRF map). The XANES curves of the samples were normalised to facilitate comparison. There were clear similarities in the XANES region for the four positions analysed in the cement, with a very characteristic pre-edge feature at ca. 7114 eV, which corresponds to 1s to 3d transitions within 3d-4p mixing. The pre-edge intensity increases as the degree of centrosymmetry of the metal atom environment decreases. Significant differences can be detected when looking at the Fe K-edge XANES spectrum collected on a wire (black line, Figure 6), for which the XANES features are typical of the metallic Fe phase, with the absorption edge shifted towards the lower energy, high intensity of the pre-edge and the low white line intensity at ca. 7130 eV. The XAS data recorded for a cement part of the sample show a low signal-to-noise ratio due to the heterogeneity of the sample.
Normalised Fe K-edge XANES of sample 37 collected at different positions of the sample block along with the Fe references: Fe2O3, Fe3O4, FeCO3 and Fe metal.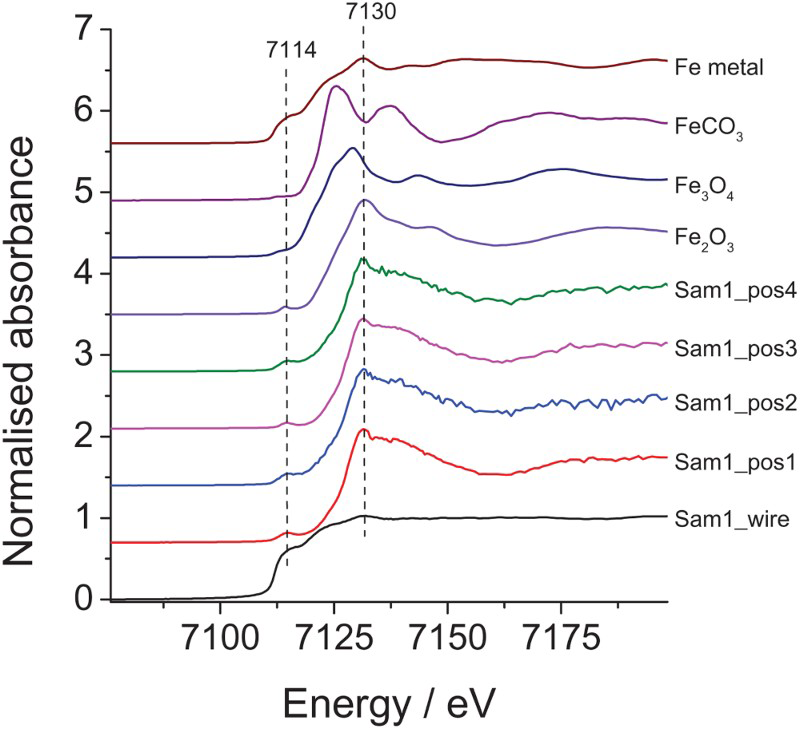
For comparison, Figure 6 also shows the normalised Fe K-edge XANES spectra for various references, namely Fe2O3, Fe3O4, FeCO3 and Fe metal. The standards show a progressive shift of the absorption edge energy towards higher values (from 7112 to 7125 eV) corresponding to different oxidation states varying from 0 to +3. Moreover, the pre-edge and edge-step features of the XANES region vary considerably for each Fe reference. Based on the spectra for the reference materials, the XANES data of the studied sample at each position in the cement are similar to the Fe2O3 XANES features, with the same pre-edge present at 7114 eV and white line intensity at ca. 7130 eV. This indicates that the iron present at the positions investigated was mainly in the +3 oxidation state. This is probably due to the original Fe2O3 present in the starting material.
A set of example tomographic slices from a high-resolution local tomography scan from all three orthogonal planes are shown in Figure 7. From these images, it can be seen that there were no indications of localised corrosion affecting the surface of the steel.
Example tomographic slices in all three orthogonal planes of a 1-mm diameter carbon steel wire in Cell 39 (20 000 ppm Cl in porewater, NRVB): (a) xy-plane (2.9 mm × 2.9 mm), (b) yz-plane (2.9 mm × 1.2 mm) and (c) xz-plane (2.9 mm × 1.2 mm).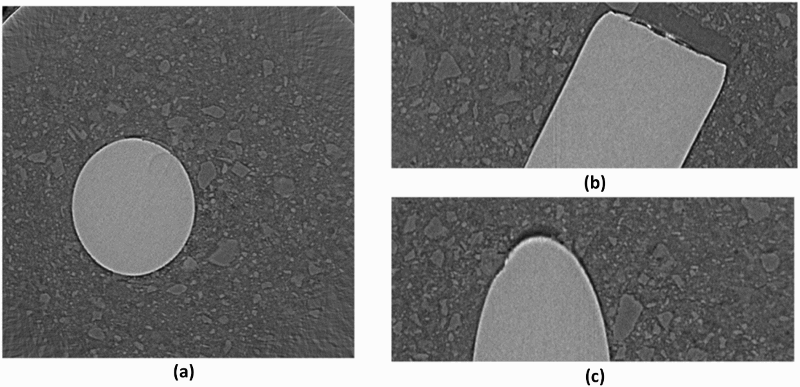
The results of the Raman spectroscopy analysis of the surfaces of the wires removed from the NRVB are shown in Figure 8. Both samples showed the presence of predominantly magnetite (Fe3O4), characterised by a strong broad peak at 670 cm−1 and smaller broad peaks at 540 and 320 cm−1, with possible indications of FeOOH, characterised by sharp peaks at 390 and 410 cm−1. The peaks at higher wavenumbers are characteristic of (i) graphitised carbonaceous material, with two strong peaks at 1340-1360 and 1580-1610 cm−1 (it is possible that carbonaceous material on the surface of the wires was graphitised by exposure to the laser beam, although no obvious sample damage was observed) and (ii) anions, characterised by sharp bands at 900-1100 cm−1 (e.g. carbonate or sulphate).
Raman spectra of surface of carbon steel wires embedded in NRVB after long-term anaerobic corrosion experiments: (a) Cell 37, 0 ppm Cl; (b) Cell 39, 20 000 ppm Cl in porewater.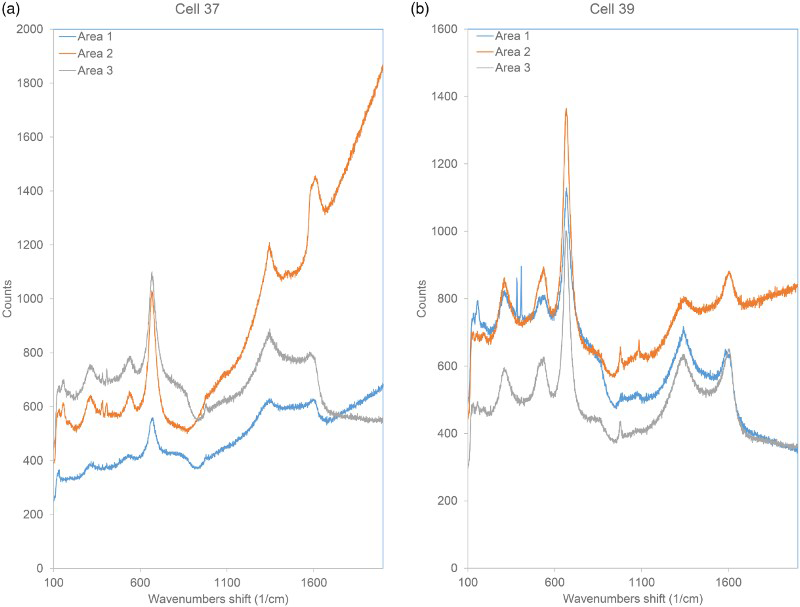
SEM examination of the wires removed from the NRVB showed that there were no indications of localised corrosion on the surface of the steel, in agreement with the X-ray tomography results. The Fe map from the EDX analysis showed that no iron had entered the cement from the corroding steel surface, in agreement with the XRF analysis. In the case of Cell 39, EDX analysis showed that there was an enrichment in the chloride concentration around the surface of the wire.
Weight loss measurements on wires removed from the two samples of steel embedded in NRVB gave overall corrosion rates of 0.10-0.23 and 0.04-0.18 µm/year for Cell 37 and 39, respectively, for a total exposure period of ∼23 years. These values can be compared to those given in Table 3 for the original gas cell monitoring results.
Discussion
A large matrix of anaerobic corrosion experiments was set up and monitored to determine the corrosion rates of carbon steel under conditions that were representative of those expected for the Belgian supercontainer concept. The results have shown that, based on rates of hydrogen generation, the long-term corrosion rate is less than 0.1 µm/year. Recent sensitive measurements using autoclaves equipped with pressure transducers indicate that the long-term corrosion rate is of the order of <0.03 µm/year (e.g. see Figure 2) and still decreasing after nearly 4 years’ exposure.
Under anoxic conditions, the long-term corrosion rates were not significantly sensitive to environmental parameters such as temperature, chloride concentration, concentration of sulphur species or gamma radiation dose rate at 25 Gy h−1. Previous studies [8] have shown that a pre-existing corrosion product film formed on the surface of carbon steel inhibits corrosion when the material is then placed in solutions containing sulphide. The results in the current paper show that without pre-corrosion the gas generation rate in the presence of sulphide is similar to that in the absence of sulphide.
The fact that corrosion behaviour is not affected by the chloride concentration is probably because, as a result of the low oxygen concentration, the corrosion potential is considerably more negative than the pitting potential for carbon steel in alkaline chloride solutions, even in the presence of 25 Gy h−1 γ-radiation, which would be expected to produce oxidising species. The low anaerobic corrosion rate occurring in anoxic alkaline conditions may be attributed to the formation of a thin protective inner barrier layer and the slow development of a thicker outer layer.
Post-test analysis has shown that the corrosion product on carbon steel in anoxic alkaline conditions is predominantly magnetite, which is consistent with the electrochemical potential measurements. No localised corrosion was observed of any of the surfaces examined.
Examination of two long-term experiments on carbon steel embedded in a cementitious grout, with and without a high concentration of chloride in the porewater, showed that under anoxic conditions, no iron had been transported into the surrounding cement even after over 20 years’ exposure. This is in contrast to aerobic conditions, where rapid corrosion would be anticipated in the presence of such high concentrations of chloride. The amount of water consumed during the long-term corrosion process can be estimated from the weight loss measurements. If a long-term anaerobic corrosion rate of 0.1 µm/year is assumed, the mass of water consumed, according to reaction (2), would be ∼0.8 g. This value can be compared to the mass of water present initially in the cement mixture (112.3 g), from which it can be seen that the water content of the grout was greatly in excess of the water consumed by the anaerobic corrosion reaction, suggesting that there was sufficient residual water in the cement grout to support anaerobic corrosion. The pH of the porewater would have been ∼12.5, compared to pH of 13.4 for the YCW, but the results of this examination are relevant to the initial anoxic period of waste disposal in the Belgian concept, before groundwater saturation occurs.
Conclusions
For carbon steel in highly alkaline anoxic environments, hydrogen generation rate experiments show a high initial corrosion rate on pickled carbon steel surfaces at 80 and 25°C. However, the low long-term rate is <0.1 µm year−1 and still falling after several tens of thousands of hours exposure to approximately 0.01 µm/year. Mathematical modelling can be used to derive empirical rate equations that can, in principle, be used to predict the long-term corrosion rate. No significant effect of chloride concentration up to 100 mg L−1, temperature up to 80°C, or gamma-irradiation up to 25 Gy h−1 was observed on the anaerobic corrosion rate. Analysis of long-term corrosion tests under a range of conditions, including cementitious environments, shows that the predominant corrosion product is magnetite, Fe3O4. Electrochemical measurements are consistent with the formation of magnetite. No localised corrosion was observed on the steel surfaces exposed to highly alkaline anoxic conditions, even in the presence of high concentrations of chloride.
Footnotes
Acknowledgements
The authors gratefully acknowledge Oxford University Materials Characterisation Service for providing material analysis data, DIAMOND Light Source Ltd for synchrotron analysis, Dr A. Hoch (Amec Foster Wheeler) for mathematical modelling of the results from gas generation studies and RWM Ltd, UK, for permission to analyse archived NSARP specimens.
Disclosure statement
No potential conflict of interest was reported by the authors.