
Abstract
A main challenge in design with long discontinuous fibre-based sheet moulding compound (SMC) is to understand flow-induced fibre orientation in the part. There are very few experimental methods for characterising the fibre orientation distribution in carbon fibre SMC. Consequently, even though process simulation models for predicting fibre orientation have been developed, the confidence in using these models remains low. This research aims to study the fibre orientation distribution in compression moulded carbon fibre SMC using a combined experimental and numerical approach. A recently developed micro-CT scanning-based method will be adopted to study carbon fibre SMC samples of various sizes. The data collected from the experimental study will be used to assess the predictive validity of selected commercial process simulation packages.
Introduction
Compression moulding of high fibre content, long discontinuous carbon fibre-based sheet moulding compound (SMC) is an attractive solution for high-rate manufacturing of high-performance composite structures. This technology also opens great opportunities for sustainable composites manufacturing using recycled and reclaimed carbon fibre, and natural fibres, as these materials commonly suffer from limited fibre length, therefore are better suited for discontinuous fibre composites applications. Unlike continuous fibre based materials such as prepreg, SMC flows under compression force to fill the mould cavity, allowing complicated geometry (e.g. ribs and bosses) to be manufactured. One of the main design challenges with SMC is that in-cavity flow during compression moulding increases the level of heterogeneity of the material, particularly in terms of fibre orientation, which can significantly affect the mechanical properties of the part.
Understanding the fibre behaviour during the manufacturing process is the key to improve part quality, and to better predict the structural performance of the part. The level of heterogeneity and complicated fibre architecture in SMC requires 3D analysis of the material's mesoscale structure. There are two commonly used approaches for quantifying the fibre orientation distribution in composite parts: experimental methods and numerical methods. The former involves using experimental techniques to physically determine the fibre orientation in post-manufactured parts, and the latter involves using process simulation techniques to predict the fibre orientation without manufacturing the physical part. In terms of experimental methods, radiology-based techniques such as ultrasonic scanning [1] and X-ray Computed Tomography (referred to as CT in the rest of the paper) scanning [2] have been adopted for fibre orientation analysis in glass fibre SMC. However, the application of radiological techniques for carbon SMC is particularly challenging due to the low contrast between the densities of carbon fibre and polymer matrix, and a very high scanning resolution must be used to clearly distinguish the fibre and the polymer. Consequently, only very small sample sizes (microscale) can be scanned using conventional micro-CT scanners and the fibre architecture can only be studied at filament level.
In terms of numerical methods, commonly used approaches include phenomenological models and mesoscale models. Phenomenological models (e.g. the Folgar–Tucker model[3]) use fibre orientation tensors to represent the fibre orientation, usually on an element-by-element basis, where each fibre orientation tensor indicates the probability of the fibres aligned in each direction. Mesoscale models, on the other hand, predict the orientation of individual fibres by modelling the physical movement of each fibre (e.g. [4]). When applied in conjunction with flow simulation model, the physical fibre architecture of the manufactured part can be predicted using a mesoscale model, which can then be subsequently converted into fibre orientation tensors if needed. However, the computational power required by mesoscale models is often significantly higher than that required by phenomenological models due to the complicity of such models. Nevertheless, because of the lack of experimental methods for quantifying fibre orientation in carbon fibre composites, very limited validation data are available for either type of models, and the confidence in applying these numerical models to carbon fibre SMC remains low.
This paper presents a joint experimental and numerical study for characterising fibre orientation distributions in compression moulded carbon fibre SMC. A novel and robust experimental method utilising CT scanning and image analysis techniques was adopted for physically determining the fibre orientation distributions. The numerical study for fibre orientation prediction investigated one phenomenological model and one mesoscale model. It should be noted that the focus of this research is on assessing and comparing the results generated using different analysis methods, rather than the development of each analysis method.
Experimental methodologies
Compression moulding of SMC and sample preparation
Experimental compression moulding was performed on an Engel V-Duo 1700 tonne press at WMG. The manufacturing process was a single-shot process which the initial charge positioned on the bottom mould half (usually female), followed by a downward stroke of the top mould half (usually male) to fully close the mould cavity. A smart tracker was located in the mould cavity to ensure the part was fully cured before the compression force was realised and the mould was reopened. The material used in this study was a commercial vinyl ester based carbon fibre SMC with 12.7 mm fibre length and 57% fibre weight fraction. For reasons of confidentiality, further details about the materials used in this work will not be disclosed in this paper. A simple flat plaque geometry of 550 mm × 550 mm × 2 mm was selected in this study, and an initial charge of 30% coverage was positioned in the centre to encourage a 1D flow regime (Figure 1). The reason that a 1D flow regime was adopted was to eliminate the errors in fibre orientation predictions caused by incorrectly predicted flow patterns, as with most of the fibre prediction models the fibre orientation tensors were calculated from the flow vectors. A previous study conducted by the co-authors [5] assessed the accuracy of the flow solvers within several commercial compression moulding simulation packages, and it was reported that all the commercial packages investigated could only correctly predict the flow pattern for 1D flows. The mould temperatures were 145°C at the bottom (female mould half) and 140°C at the top (male mould half). The compression moulding process was initially under speed control with 3 mm/s closing speed and changed to force control at a switch-over force of 500 kN. The holding force was 4500 kN.
The flat plaque geometry with 550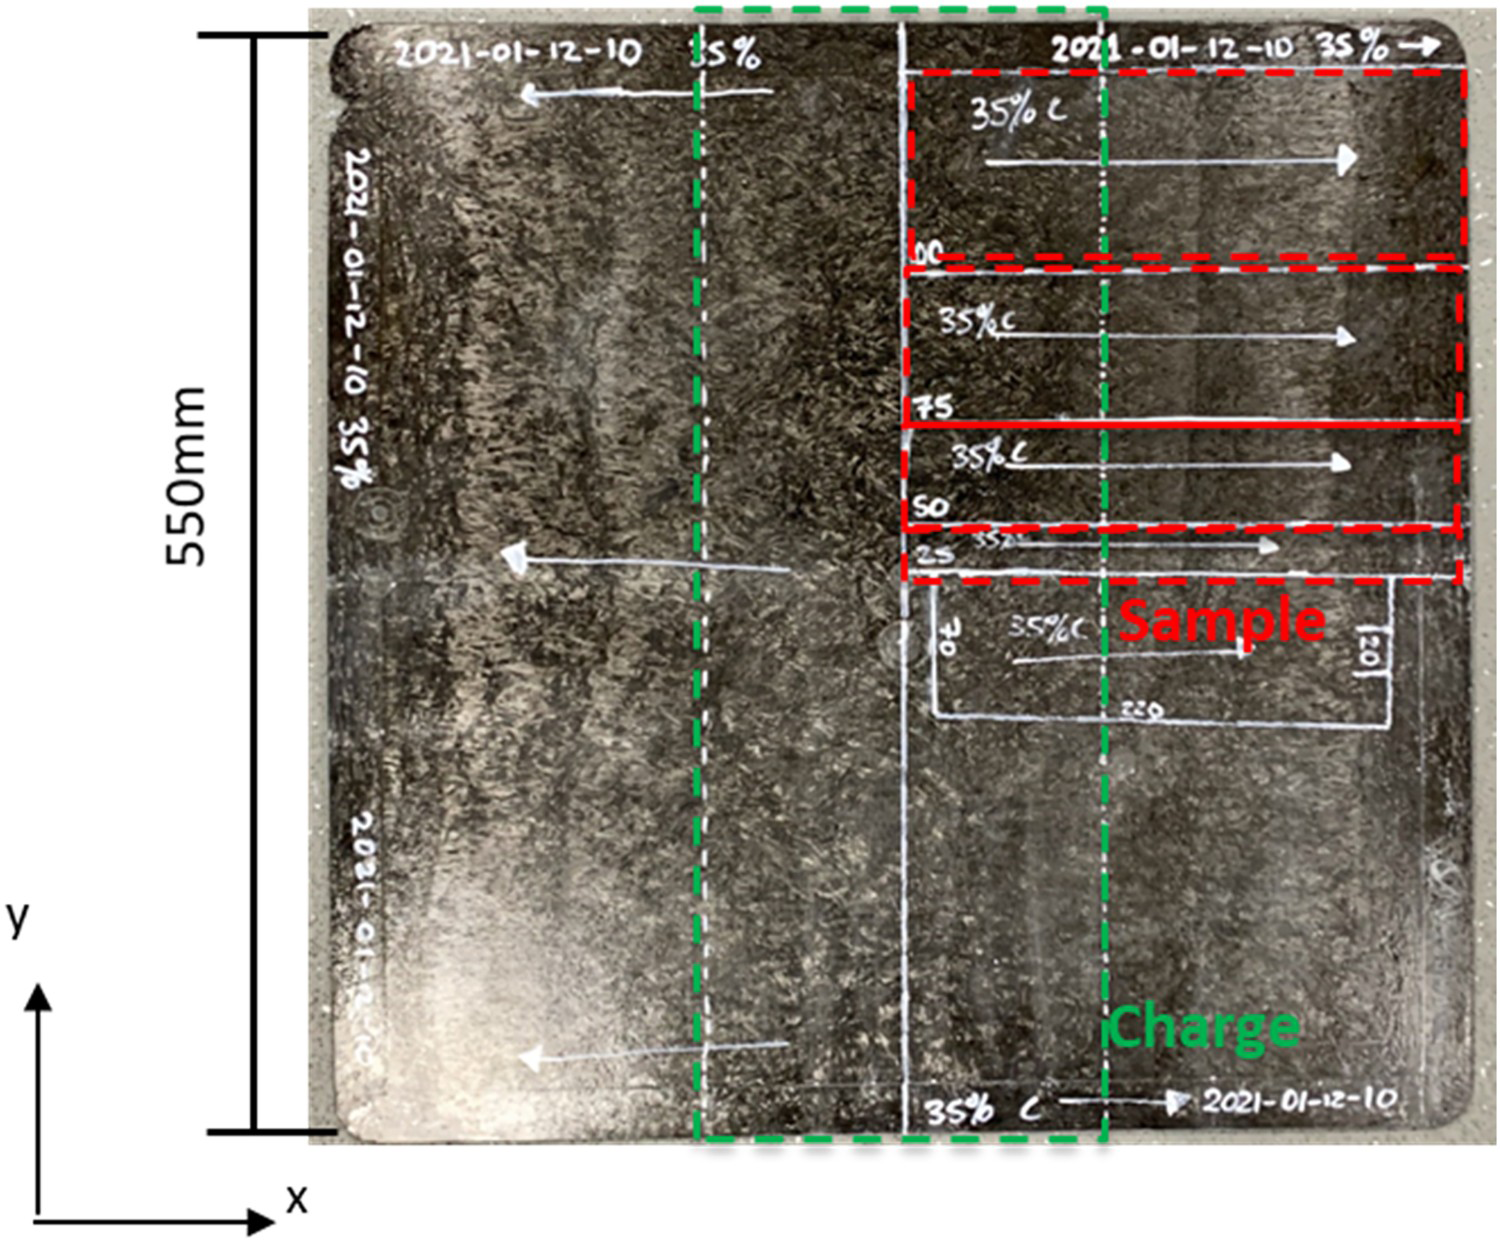
Four long strip samples were cut from the top-right region of the moulded plaque, as indicated in Figure 1. The sample widths were 100, 75, 50 and 25 mm from top to bottom as shown in Figure 1. Different sample widths were chosen in this study to understand the sample size effects on the quality of CT scan and the measured fibre orientation results.
Experimental fibre orientation characterisation
Experimental characterisation of fibre orientation distribution within each sample was performed using CT scanning technique. All samples were scanned using Tescan Unitom XL X-ray CT scanner at WMG. A preliminary study had been conducted to determine the optimum scanning parameters for different sample sizes to achieve the best image quality, and the details of the preliminary study will be published in a separate paper. The four samples studied in this paper were scanned at different resolutions depending on the sample size, where the 25 mm sample was scanned at 15 µm resolution, the 50 mm sample was scanned at 30 µm resolution, the 75 mm sample was scanned at 42 µm resolution, and the 100 mm sample was scanned at 55 µm resolution. It should be noted that during each scan, the sample was held by a fixture on the initial charge's side (i.e. left-hand side in Figure 1), therefore a section of approximately 30 mm long was not scanned. VGStudio Max 3.0 with the fibre orientation module was employed to analyse the CT scans. The software is capable of performing fibre orientation analysis on a pre-defined grid system as demonstrated in previous work [6]. The analysis performed in this study was based on grid size of 2 mm × 2 mm × 0.5 mm for all samples.
Numerical simulation methodologies
Two commercial compression moulding process simulation packages were evaluated in this work: Moldex3D by CoreTech and 3D TIMON's Composites PRESS by Toray Engineering D solutions. The fibre prediction models available in Moldex3D are conventional phenomenological type of models [3], which only maps the fibre content and fibre orientation distribution based on the mesh used in the process simulation. The Folgar–Tucker model was selected for fibre orientation analysis in Moldex3D in this study. 3D TIMON, on the other hand, has a unique in-built Direct Fibre Simulation (DFS) model [4], which models individual fibre tows and their movement caused by the flow. Therefore, the DFS model can predict the physical fibre architecture formed by the flow process.
Compression moulding process simulation in Moldex3D and 3D TIMON was setup in the same manner as described in [5]. In both packages the models were meshed using global element size was 2 mm × 2 mm × 0.5 mm, which was identical to the grid size used in the CT scan analysis. Experimental material characterisation and the material card for 3D TIMON were provided by Toray Engineering D solutions. The material card for Moldex3D was directly converted from that for 3D TIMON by the authors as the material models required for flow analysis in 3D TIMON were also available in Moldex3D. Owing to the reasons of confidentially, the detailed material input data will not be disclosed in this paper.
Results and discussions
Experimental results
Figure 2 compares the grey-scale images from the CT scans of all four samples. There is a clear trend of reduced image quality as the sample width increases. The image becomes more blurred for wider samples, and the brightness becomes less uniform such that the regions around the top and bottom edges of the sample are darker than the centre of the sample.
Comparison of grey-scale images from the CT scans for different sample widths. The two boxes at the bottom are the zoomed-in views of a 25 mm × 25 mm area from the 25 mm sample (bottom left) and the 100 mm sample (bottom right), taken from the centre of the samples as indicated on the sample images.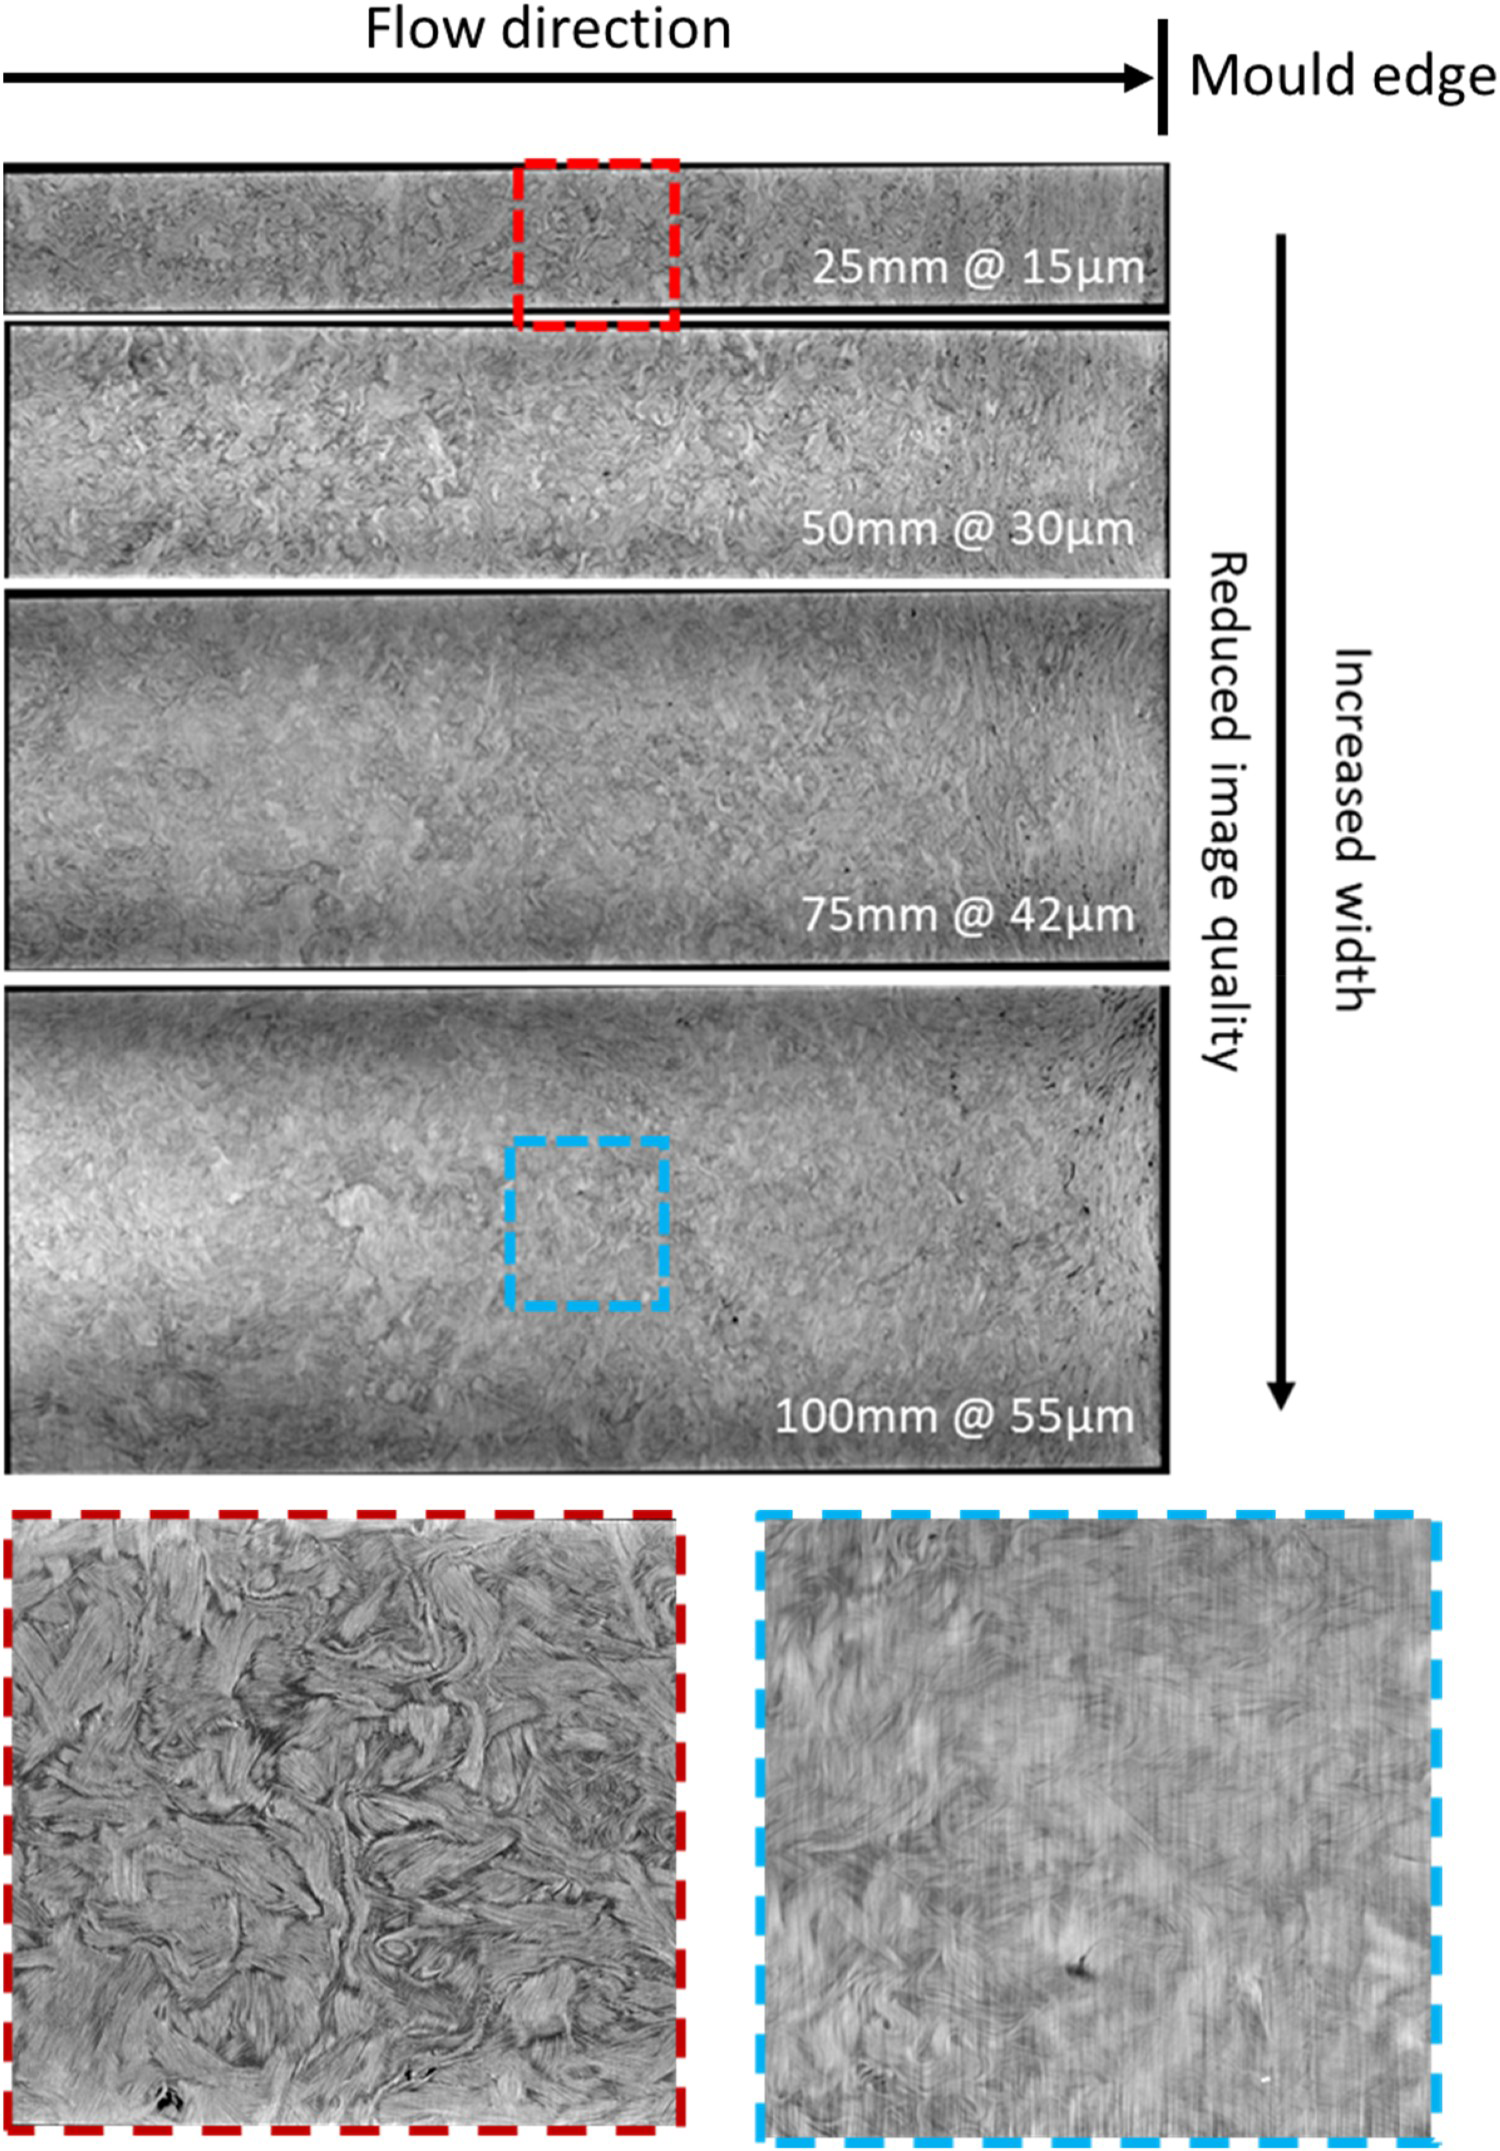
The increased blurring for wider samples is a consequence of two factors. First, the object is four times wider leading to an equivalently larger pixel size representing the sample fibres, i.e. a decrease in resolution. Second is the increased impact of an even higher-aspect ratio sample; where the plate is rotated in the field of view, the path length through the plate material is four times longer in the widest case against the first at the most extreme angles. The penetration reduces exponentially with proportional increases in width according to the Beer–Lambert law so it quickly has a notably impact on image quality leading to greater noise and contrast issues.
Zoomed-in views of a section of the sample are also provided for the 25 mm sample and the 100 mm sample in Figure 2, where in the zoomed-in view of the 25 mm wide sample, the fibre tows can be clearly identified, but in the zoomed-in view of the 100 mm wide sample, it is very difficult to distinguish the fibre and the matrix. Furthermore, vertical marks can be seen in the images of larger (e.g. 100 mm) samples due to streaking artefacts effects as a result of the large aspect ratio, which can significantly affect the quality of the downstream fibre orientation analysis.
Figure 3 presents the fibre orientation distribution results from the CT scan analysis for each sample. The colours in Figure 3 represent the fibre orientation tensor Axx where blue represents Axx > 0.66 (i.e. fibres aligned in the horizontal/flow direction), red represents Axx < 0.33 (i.e. fibre aligned in the vertical/cross-flow direction) and green represents values in between (i.e. random fibre orientation). Figure 3 suggests that there is a higher level of fibre alignment in the cross-flow direction for wider samples, although it would be usually expected that more fibres should be aligned in the flow direction. The main cause of this discrepancy is that the highly blurred images for larger samples make it harder for the fibre analysis software to correctly identify the fibre tows, and artificial marks caused by the streaking artefacts effects trick the software to interpret them as vertical/cross-flow fibres. Furthermore, this phenomenon becomes more dominant around the centreline of the sample where the streaking artefacts effects and the brightness are both the highest. It is observed that with the current scanning settings the most reliable fibre analysis results were achieved for the 25 mm sample, where no unrealistic fibre orientation results were seen along the centreline of the sample.
Comparison of fibre orientation distributions from the CT scan analysis for different sample widths. The colours indicate the fibre orientation tensor where blue represents Axx > 0.66, red represents Axx < 0.33 and green represents the values in between.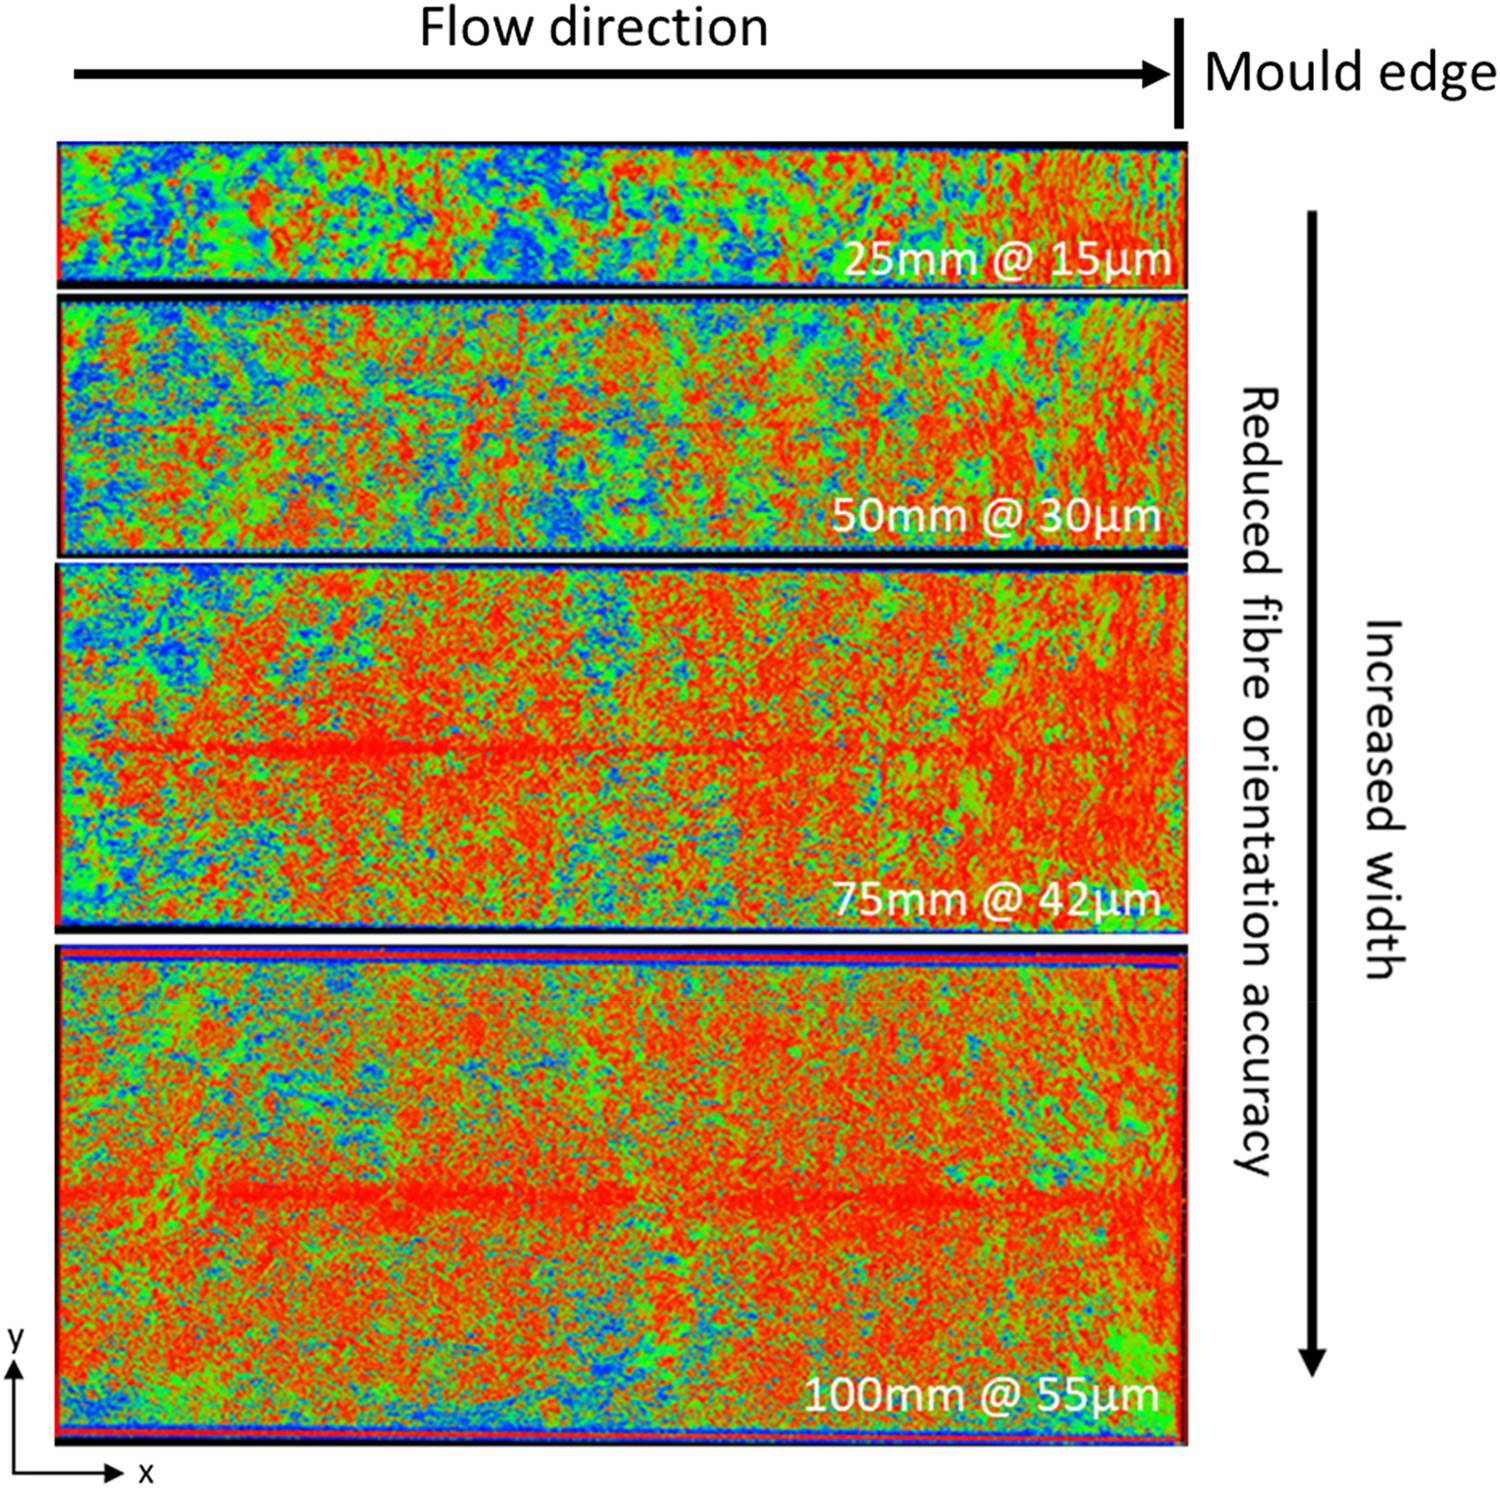
Despite the fibre analysis results for the 25 mm wide sample having achieved good confidence thanks to the great image quality, there are still regions associated with a high level of cross-flow fibres observed with this sample. Figure 4 illustrates the reasons for these apparent cross-flow fibres by comparing the image of the sample surface, the grey-scale image of the fibre architecture obtained from the CT scan and the fibre orientation tensor from the CT scan analysis (Figure 4(a–c)). The first region with a high level of cross-flow fibres can be found on the left half of the sample, as indicated by the long box across Figure 4(a–c). The image of the sample surface in Figure 4(a) suggests that this region contains the edge of an SMC ply, which can also be identified from the grey-scale CT scan image in Figure 4(b). The morphology of the ply edge shows a similar characteristic as a weldline in the grey-scale image, therefore is interpreted as cross-flow fibres by the fibre analysis software (referred to as ply edge effects). Another region associated with a high level of cross-low fibres is at the right-hand side of the sample, as indicated by the box on the right in Figure 4(c). Closed-up views of this region in Figure 4(d,e) suggest that this is caused by the wrinkles in the fibres formed in the cross-flow direction as the material is crushed into the side-walls inside the mould cavity (referred to as part edge effects).
Comparison between (a) the image of the sample surface, (b) the grey-scale image and (c) the orientation tensor Axx from the CT scan analysis for the 25 mm wide sample. The long box across (a-c) highlights the edge of an SMC ply observed in all three images. The box on the right of (b) indicates the edge of the plaque with (f) a zoomed-in view of the in-plane fibre architecture and (e) a cross-sectional view of the out-of-plane fibre architecture.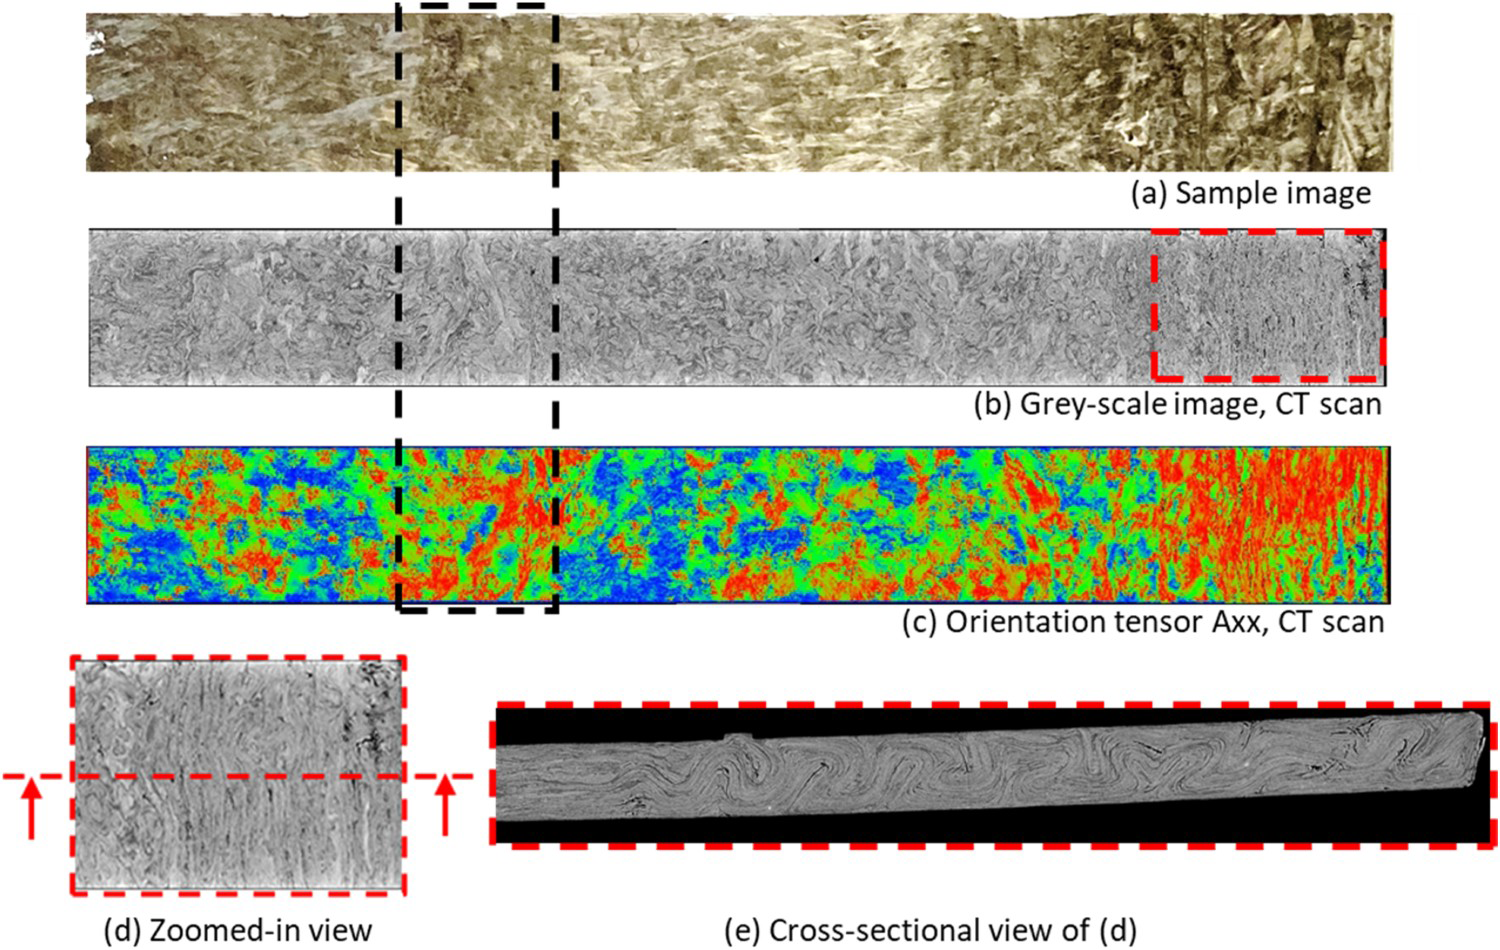
Numerical simulation results
Figure 5 compares the fibre orientation tensor Axx distributions predicted by the two commercial process simulation packages, where the image on the left shows the results predicted by the DFS model, implemented in 3D TIMON, and the image on the right shows the results predicted by the Folgar–Tucker model, implemented in Moldex3D. Generally speaking, the results from both models suggest a high level (Axx > 0.66) of fibre alignment in the flow direction, with a higher level of randomness in the DFS results because the initial fibre architecture generated in the DFS analysis is fully random. The Folgar–Tucker model, on the other hand, has predicted a much more uniform distribution of Axx along the y-direction, as the material variabilities caused by the random nature of the material are not considered by this model.
Comparison of fibre orientation tensor Axx distributions predicted by the process simulation models. Left: Direct fibre simulation (DFS) model, 3D TIMON implementation. Right: Folgar–Tucker model, Moldex3D implementation.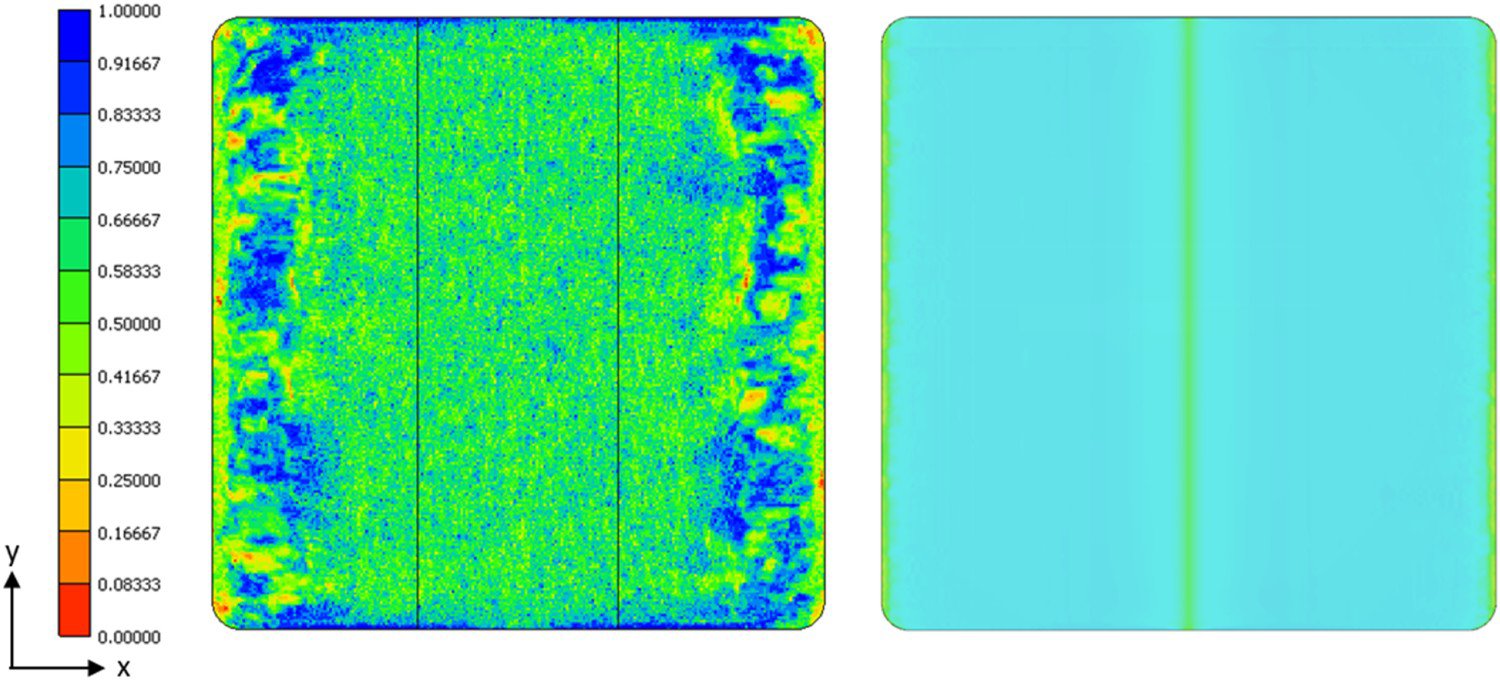
It is also observed from Figure 5 that both models predict lower levels of fibre alignment along the left and right edges of the plaque, and the result from the Folgar–Tucker model contains an additional region with a lower level of alignment along the centreline of the plaque where the initial charge was located. Furthermore, the result predicted by the DFS model shows regions with a very high level of fibre alignment in the flow direction (Axx > 0.9) near the left and right edges of the plaque, which is not seen in the result predicted by the Folgar–Tucker model. These observations suggest that with the DFS model there is a stronger tendency of predicted fibre alignment increases with the flow distance. Similar observations have also been reported in the literature (e.g. [7]) such that the Folgar–Tucker model under predicts the ratio of fibre orientation in injection moulded short fibre composites.
Since the DFS model in 3D TIMON can predict the physical fibre architecture, Figure 6 presents the fibre architecture of the 25 mm sample predicted using the DFS model. The fibre architecture of the whole sample is shown in Figure 6(a), where the fibre orientation vector X is plotted on each fibre. The volume-averaged fibre orientation tensor Axx distribution for the sample is presented in Figure 6(b). It should be noted that a very high level of fibre alignment is observed in Figure 6(b) near the right edge of the sample, which cannot be clearly identified in Figure 6(a), which might suggest that there is a higher level of fibre alignment in the core region compared to the skin of the part.
Fibre architecture and orientation distribution predicted for the 25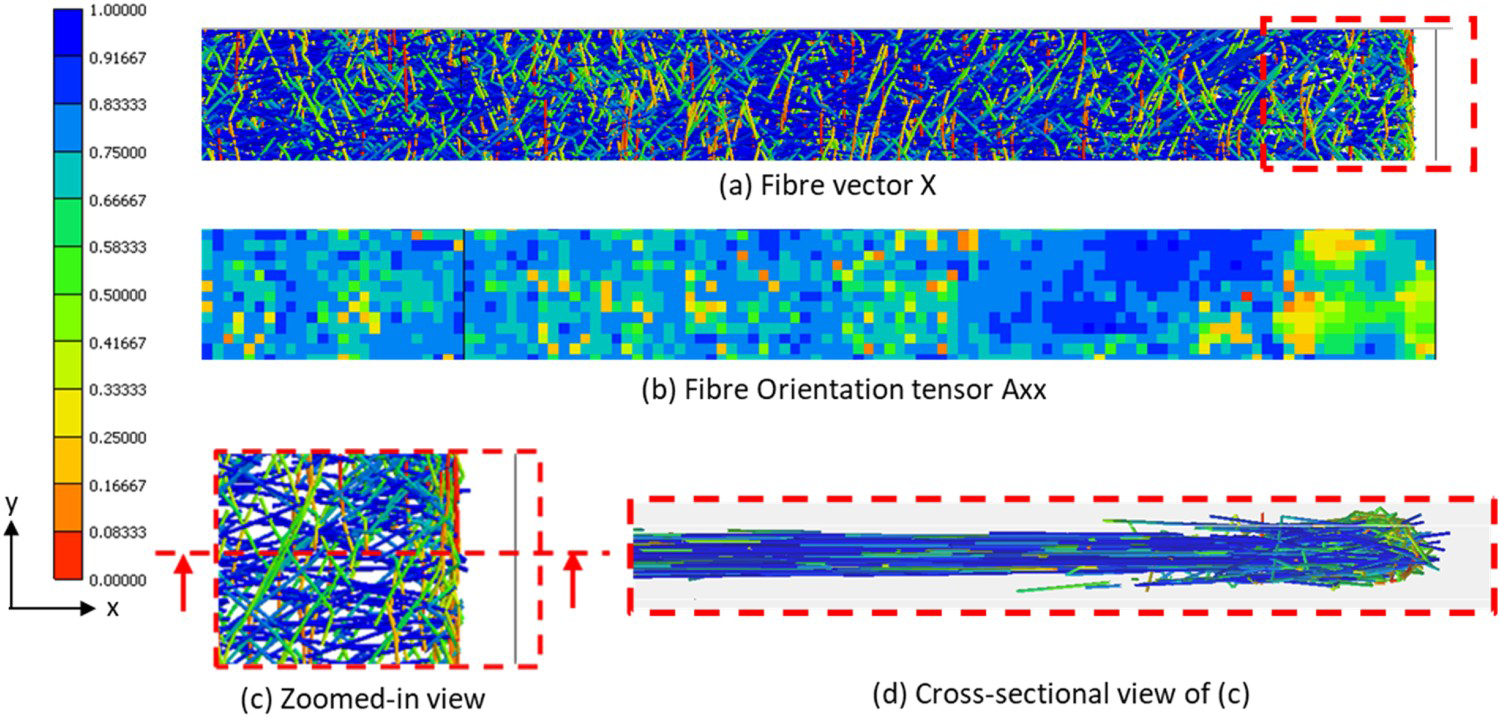
Figure 6(c) shows the zoomed-in view of the fibre architecture near the right edge of the sample, as indicated by the box in Figure 6(a). It can be observed from Figure 6(c) that there is a gap between the edge of the part and the edge of the fibre network, and the fibres at the edge of the fibre network are primarily aligned in the cross-flow direction. This is due to the constraints applied to the fibres during the DFS analysis: the fibre are not allowed to travel ahead of the flow front, and any fibre nodes that are about to violate the constraint will be shifted back. Therefore, the edge of the fibre network is always slightly behind the flow front, and the fibres at the edge of the fibre network are rotated to the direction tangential to the flow front.
Furthermore, the cross-sectional view of the fibre architecture in Figure 6 shows that the fibres at the part edge do not wrinkle as seen in the actual sample in Figure 4(e). Instead, the fibres generally have much lower curvatures in Figure 6, and some fibres even penetrate through the boundaries of the part. This is because the DFS model considers the fibres as linked beams with much higher bending stiffness compared to the actual bending stiffness of carbon fibre. The disturbance to the fibre architecture caused by the edge of the mould cavity is much lower in the simulation in Figure 6(d) compared to in the experimental sample in Figure 4(e), which is because the DFS model does not consider the interactions between fibres, so that the stresses caused by the fibre crushing onto the side of the cavity will not be transferred through the fibre network as in an actual SMC material.
In order to provide a more qualitative comparison in terms of fibre orientation analysis, the fibre orientation Axx distribution is plotted along the length of each sample in Figure 7, where the value of Axx is averaged across the whole sample width at selected x values. Comparison in Figure 7 is made between all samples from the simulation results and the 25 mm experimental sample. It is demonstrated in Figure 7 that the fibre orientation distributions predicted using the Folgar–Tucker model are almost identical to each other regardless of sample size and location. The fibre orientation distributions predicted using the DFS model on the other hand, show variabilities of up to ∼14.3%, and there is no correlation between the level of fibre alignment and the size and location of the sample. The Folgar–Tucker model predicts a higher level of fibre alignment compared to the DFS model for the majority of the sample (up to 80% of the sample length).
Comparison of the fibre orientation tensor Axx distribution along the length of the sample between the results predicted by the Folgar–Tucker model (Moldex3D implementation) and the DFS model (3D TIMON implementation) for all sample sizes and the experimental data obtained from the 25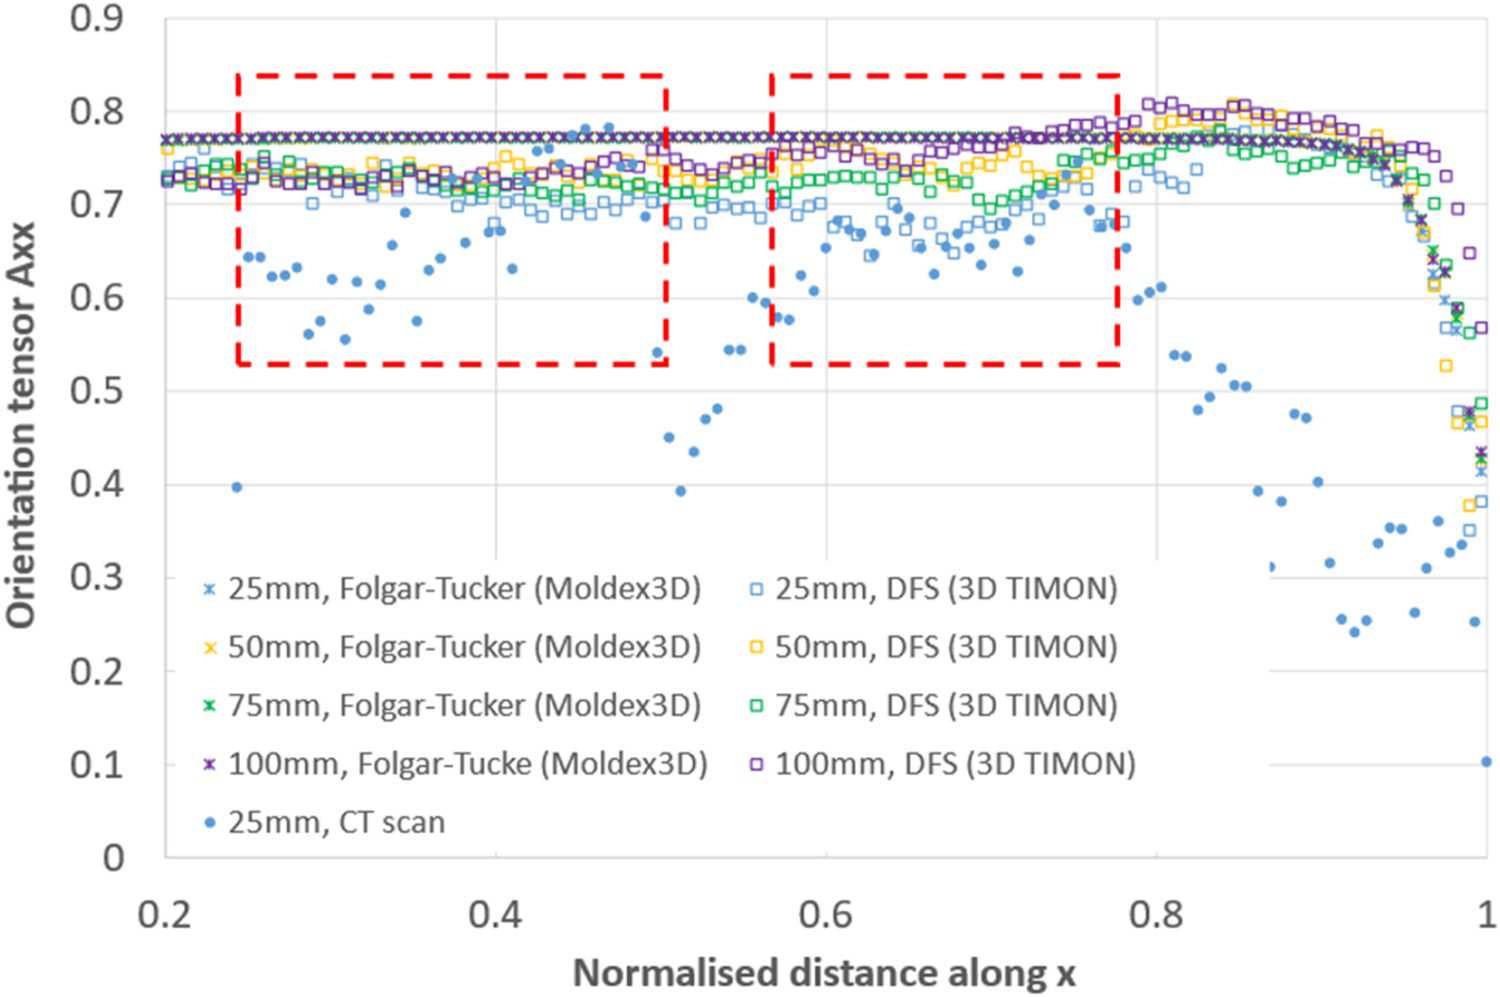
According to Figure 7, experimental data from the CT analysis generally show lower levels of fibre alignment compared to the simulation data, which suggests that the assumptions made by the existing simulation models do not accurately capture the behaviour of long discontinuous fibre and the interactions between the fibres. Furthermore, existing simulation models cannot capture the ply edge effects and the part edge effects, such that large discrepancies are observed between the experimental data and the simulation data in these regions. The boxes in Figure 7 indicate the regions where the experimental sample does not experiment these effects, where a reasonable agreement can be seen between the experimental data and the simulation data: the DFS model over-predicts the Axx values by up to 20%, and the Folgar–Tucker model over-predicts the Axx values by up to 27%. It is also interesting to note that within the regions indicated by the two boxes in Figure 7, the Axx values in the box on the right are generally slightly higher than those in the box on the left, which suggests that the level of fibre alignment might increase with flow distance in the actual SMC sample. However, this finding is not conclusive due to the limited experimental data available.
Conclusions
Experimental and numerical characterisation has been performed to understand fibre orientation distributions in compression moulded carbon fibre SMC. A flat plaque geometry with 1D flow regime has been selected in this study and samples along the flow direction with different widths have been studied. A CT scanning-based fibre analysis technique has been adopted for the experimental study. While this method is capable of inspecting fibre architecture at mesoscale, good image quality and reliable fibre analysis were only achieved from the narrowest sample (25 mm) due to the high aspect ratio of the other samples. Commercial compression moulding simulation packages Moldex3D and 3D TIMON have been used for the numerical simulation study, where the former has an in-built Folgar–Tucker model for fibre orientation analysis, and the latter has a DFS solver for fibre orientation analysis.
Comparison of the results has suggested that both simulation models have predicted a high level of fibre alignment in the flow direction, where the DFS in 3D TIMON can also predict the material variabilities caused by the random fibre architecture. Comparison between the DFS results and the experimental results has demonstrated differences in the fibre behaviour in some critical regions, such as the ply edge and the part edge, which highlights the limitations of the existing DFS model. Both models have demonstrated adequate accuracy when predicting the fibre orientation away from the ply edge or part edge. However, these findings are only observed from a 1D flow scenario, where for more complicated flow scenarios higher level of discrepancies between the predictions and the actual fibre orientation is expected because commercial packages usually cannot predict the flow velocity correctly.
Footnotes
Acknowledgement
The authors would also like to thank Toray Automotive Centre Europe (AMCEU) for their donation of the material used in this study and Toray Engineering D Solutions for providing the material input data for the process simulation. Finally, the authors would like to thank ESI UK and CoreTech for providing discounted academic licenses for 3D TIMON and Moldex3D to support this research.
Disclosure statement
No potential conflict of interest was reported by the author(s).