
Abstract
To date, no published data exists on distances and speeds traveled by rugby or basketball players during game play. The purpose of this study was to provide quantitative information of selected characteristics of wheelchair basketball and rugby game play. A miniaturized data logger was used to collect the distance traveled, average velocity, activity time, and number of starts and stops during basketball and rugby games. Participants were recruited prior to wheelchair basketball and rugby tournaments during the 2007 and 2008 National Veterans Wheelchair Games. Inclusion criteria were age 18 years or older and been participating in wheelchair basketball or rugby. The wheelchair rugby athletes on average traveled 2364.78 ± 956.35 meters at 1.33 ± 0.25 m/sec with 242.61 ± 80.31 stops and starts in 29.98 ± 11.79 min of play per game. The wheelchair basketball athletes on average traveled 2679.52 ± 1103.66 m at 1.48 ± 0.13 m/sec with 239.78 ± 60.61 stops and starts in 30.28 ± 9.59 min of play per game. Previous research has not reported basketball or rugby game play variables such as these, making this data set unique. The information could be used by players and coaches to create training protocols to better prepare for game conditions.
Background
Wheelchair sporting events were first introduced as part of a rehabilitation program for individuals following spinal cord injury during the Second World War era [1] and, over time, have increased to worldwide competitive events. Competitions such as the National Veterans Wheelchair Games (NVWG) and the Paralympics are the largest sporting events for individuals with disabilities, and wheelchair basketball and wheelchair rugby are two of the more popular competitive team sports. In the United States, wheelchair basketball is directed by the National Wheelchair Basketball Association and athletic classification is broken into three groups (I, II, III) depending upon spinal cord injury level and functional ability. Amputees are classified into Class III. Wheelchair basketball rules follow National Collegiate Athletic Association rules for basketball, but are modified as appropriate for the use of wheelchairs. The maximum point value allowed on the court per team is 12 points. [2] Wheelchair rugby is overseen by the US Quad Rugby Association and like basketball, wheelchair rugby participants are classified into one of seven player classifications from 0.5 to 3.5, depending upon functional ability. Participation in wheelchair rugby requires athletes have some functional limitations in all four limbs. The maximum number of points allowed on the court per team is 8.0. [3] In both sports, a higher classification value reflects higher levels of functional ability.
Technology advances and increased opportunities have had a positive impact on the participation of individuals with disabilities in adaptive sports. Participating in wheelchair sports, such as wheelchair rugby and basketball, has numerous benefits for individuals with disabilities and to date, several research studies have been conducted finding multiple benefits from exercise and participating in sporting events. [4-6] Increased physical activity can lead to a reduced risk of cardiovascular disease in individuals with spinal cord injury (SCI) [4] and studies report that individuals with SCI who participated in physical activity had a higher satisfaction with life and greater health related quality of life in general than persons who did not participate. 5, , [6] While the benefits of exercise are well documented, research has also shown persons with disabilities are less likely to engage in regular moderate physical activity than individuals without disabilities. In order to maintain a healthy lifestyle, the Center for Disease Control and Prevention (CDC) recommended that individuals with disabilities complete a moderately intense activity, such as pushing ones wheelchair, for 30–40 min or a strenuous activity, such as wheelchair basketball, for roughly 20 minutes most days. [7]
Studies have been conducted to measure the performance of wheelchair athletes; however, to date no studies have been conducted specifically with actual wheelchair basketball and rugby game play. There have been few studies specific to wheelchair rugby athletes. 8, , [9] Goosey-Tolfrey et al. found the peak power output, peak VO2, peak heart rate, and maximal power output of well trained wheelchair rugby athletes during arm ergometer tests and concluded that they had high levels of aerobic fitness. [8] Abel et al. used metabolic testing to determine the energy expenditure of wheelchair basketball, tennis, and rugby players during practice sessions. [9] Several studies have focused on the physiological responses of wheelchair basketball athletes but these are limited to game-related data and are qualitative in nature. For example, Nyland et al. studied shoulder rotator torque of individuals who participated at a National Wheelchair Basketball Tournament and found class I players had asymmetric shoulder torque with respect to dominant/non-dominant shoulder, while class II and III player were symmetrical. [10] Vanlandewijck et al. videotaped wheelchair basketball games and analyzed female athletic performance in the quality of game performance using the Comprehensive Basketball Grading System. [11] Coutts evaluated short periods of a wheelchair basketball game and simulated game activities to determine factors including maximum speed, acceleration, and force of two basketball athletes for 6 min each. However, this study's conclusions are limited due to small sample size, limited data collection time, and the subjects were not using their wheelchair. [12] No published data currently exists on distances and speeds traveled by rugby or basketball players during game play.
A miniaturized data logger (MDL) [13] for collecting manual wheelchair activity has been successfully used in several community-based studies. Fitzgerald et al. utilized a MDL to compare activity with push-rim activated power assist wheelchairs to manual wheelchairs; [14] Cooper et al. used it to track activity in children who used manual wheelchairs; [15] and Tolerico et al. used it to quantify manual wheelchair utilization among veterans. [16] The purpose of this descriptive study was to provide quantitative information about some of the characteristics of wheelchair basketball and rugby game play. The MDL was used to collect the distance traveled, average velocity, activity time, and number of starts and stops during rugby and basketball games.
Methodology
Participants were recruited prior to the wheelchair basketball and rugby tournaments during the 2007 and 2008 NVWG in Milwaukee, WI, and Omaha, NE, respectively. The NVWG is the world's largest annual wheelchair sporting event and has been expanded to include multiple amputee events. Individuals recruited in 2008 were unique from the athletes in 2007. To be eligible for the study, the participants had to be 18 years of age or older and must be participating in wheelchair basketball or rugby. All athletes were military veterans. Those athletes who expressed interest to researchers and met inclusion criteria were invited to participate in this research study. After providing informed consent, each participant completed a brief survey which contained questions regarding their demographic information (age, disability, and years since injury or diagnosis) and information specific to their wheelchair basketball or rugby participation (classification, type of wheelchair, participation in organized wheelchair basketball or rugby outside of the NVWG and training habits). Prior to protocol initiation, this study was approved by the VA Pittsburgh Healthcare System Institutional Review Board.
Instrumentation
Prior to the start of the basketball and rugby games, a MDL was installed on a wheel of each athlete's sports wheelchair to record time stamped wheel rotation data during the tournament. The MDL was attached to the spokes of the wheelchair in a location that would not interfere with propulsion and game activity. Following the participant's exit from the tournament, the MDL was removed and the data were downloaded for analysis. The computation of the game play variables were calculated using MATLAB 2007b (The MathWorks Inc. Natick, MA). Since the number of games recorded for each participant varied according to how far they progressed in the tournament, the first two recorded games were selected for investigation. For the purpose of this analysis activity time was defined as the sum of time the wheelchair was in motion and a stop and start was defined as 2 sec or more with no wheelchair motion. The average speed was calculated by dividing the total distance by the activity time. All data in this manuscript are presented on a per game basis.
Data analysis
Demographic data were described using frequencies and percentages for categorical variables (e.g., disability, gender, and race) and means and standard deviations for continuous variables (e.g., age and years since diagnosis or injury). Since this is a pilot study, descriptive statistics were run to describe activity levels during wheelchair basketball and rugby games. To provide additional descriptions of this data set, the athletes data collected from the MDL were subdivided into different age and weight ranges. Based on visual inspection of the data, age ranges and weight categories were set to optimize the distribution of the basketball and rugby athletes. SPSSv15.0 was used for all analyses (SPSS Inc. Chicago, IL, USA).
Results
Basketball
Demographic data for all basketball and rugby athletes∗.
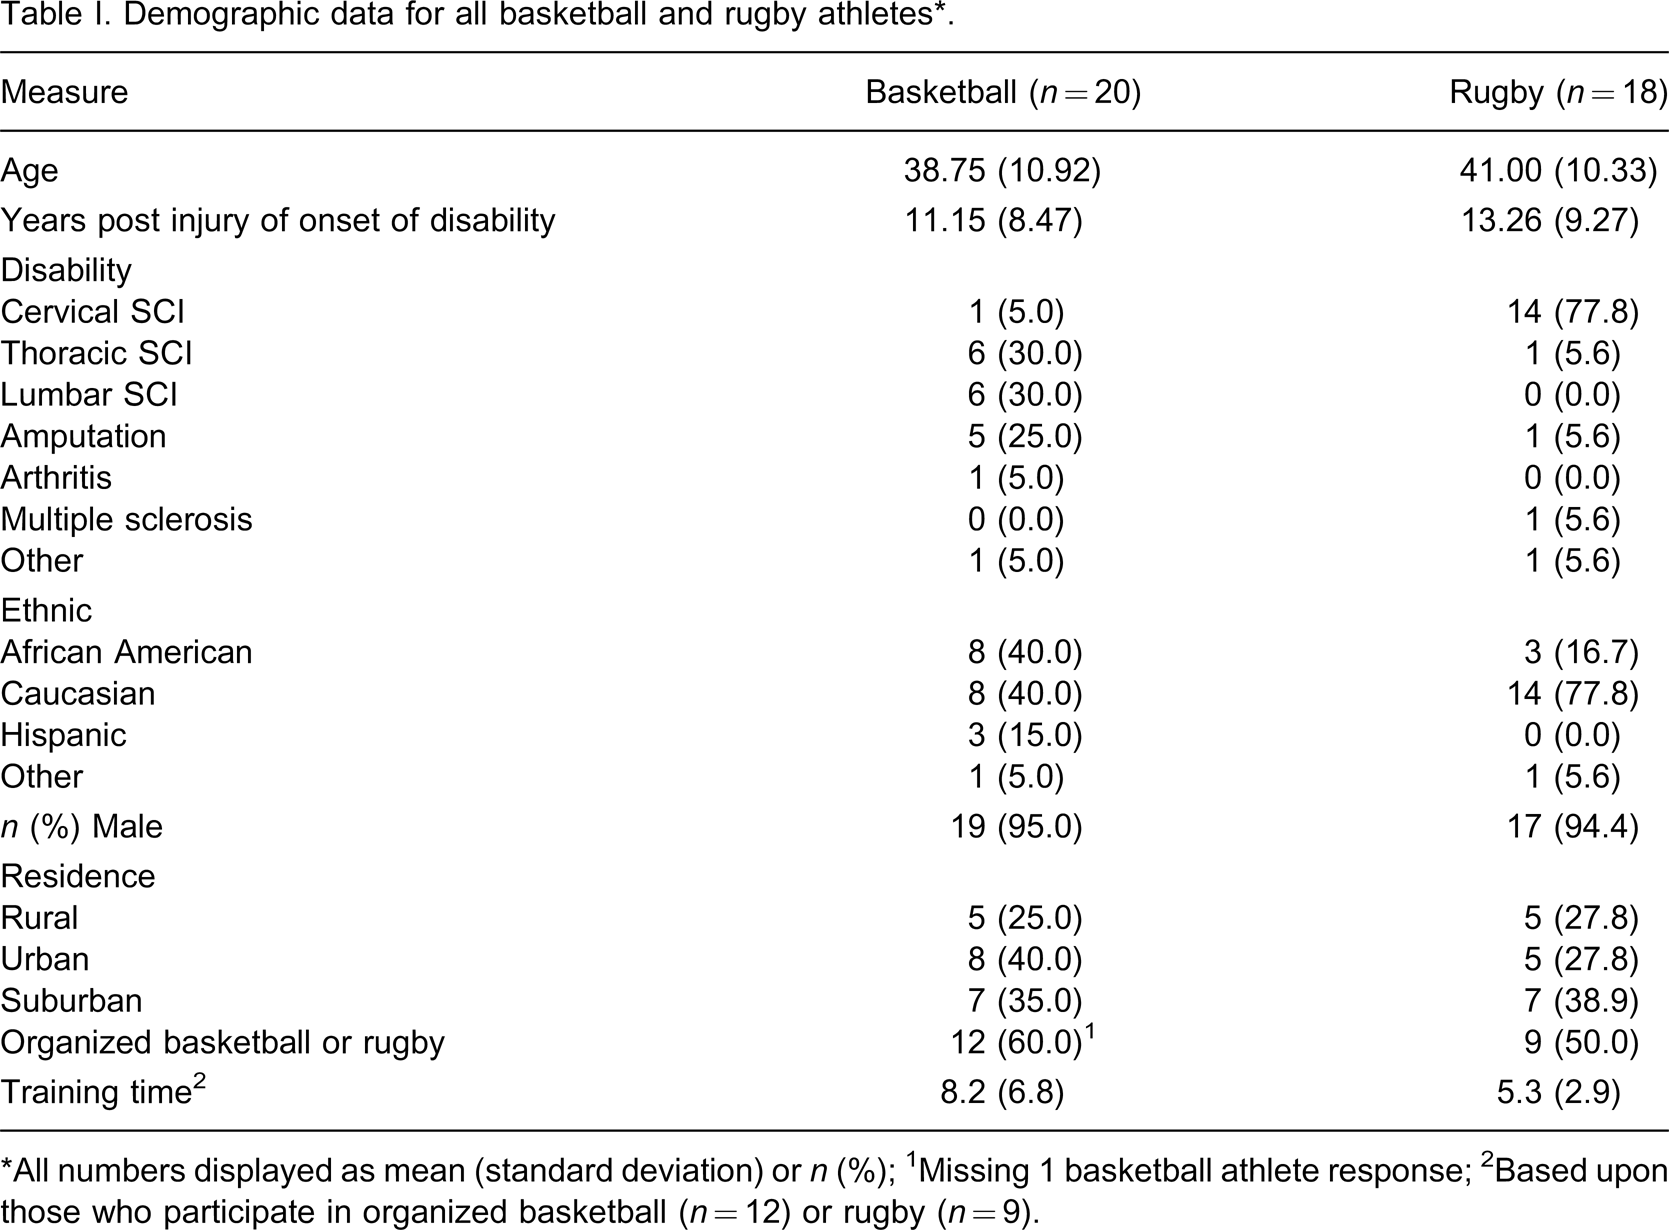
∗All numbers displayed as mean (standard deviation) or n (%); 1Missing 1 basketball athlete response; 2Based upon those who participate in organized basketball (n = 12) or rugby (n = 9).
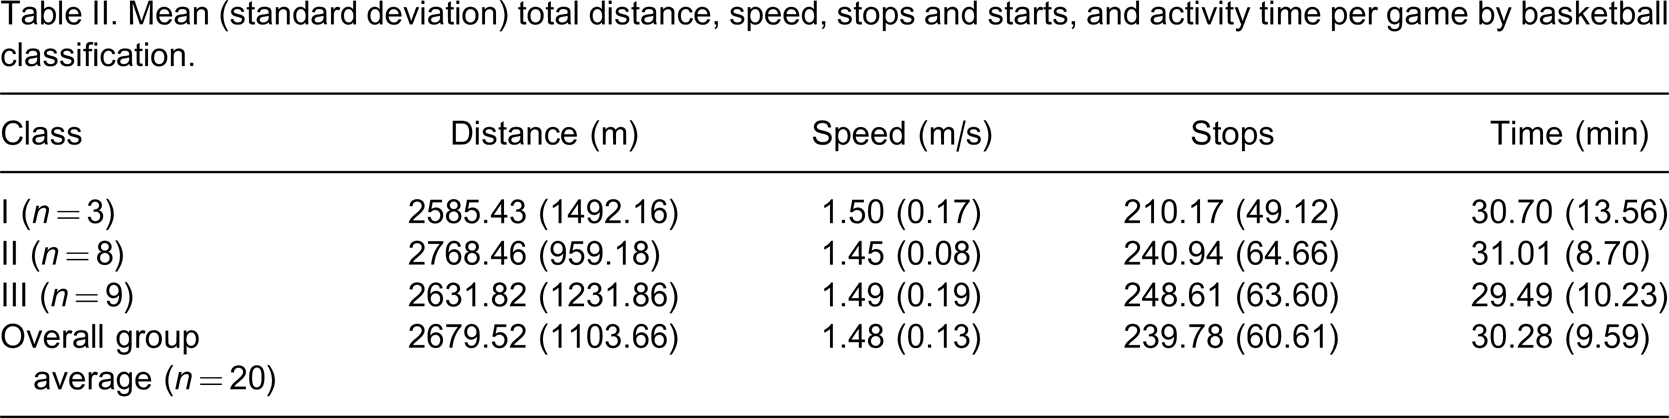
Mean (standard deviation) total distance, speed, stops and starts, and activity time per game by basketball classification.
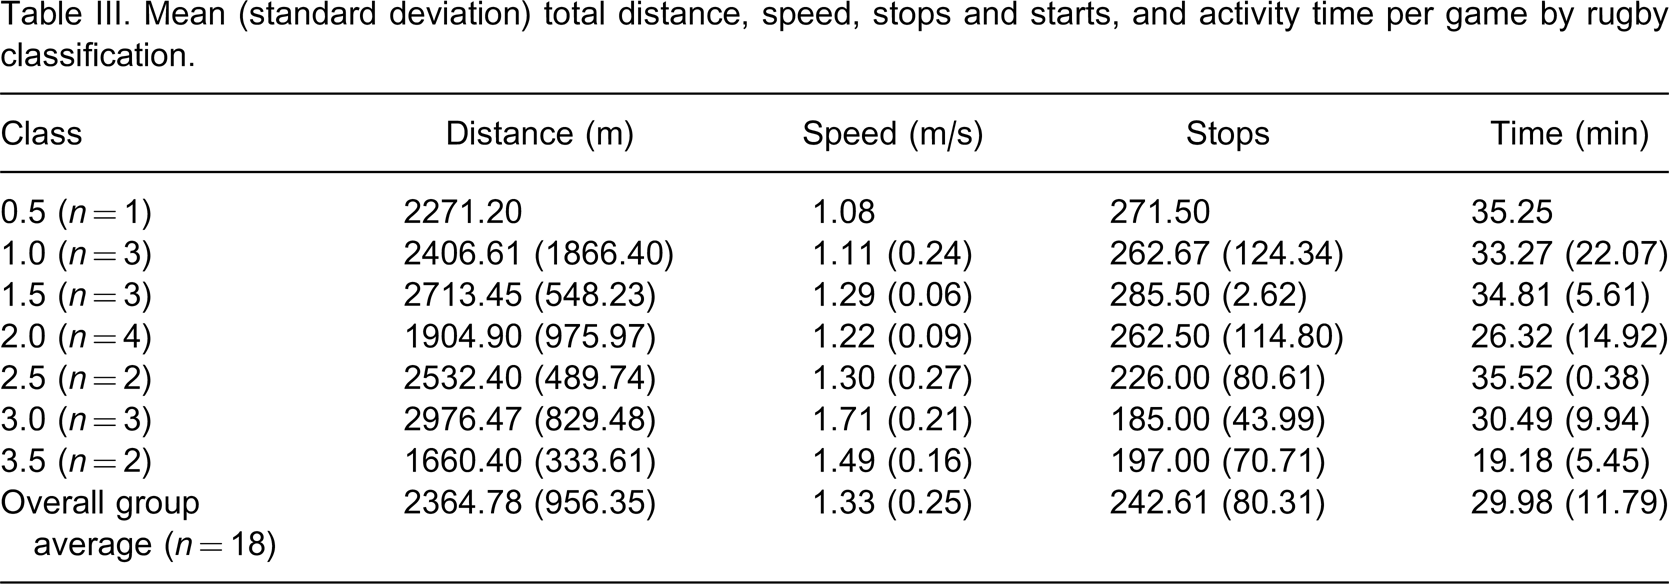
Mean (standard deviation) total distance, speed, stops and starts, and activity time per game by rugby classification.
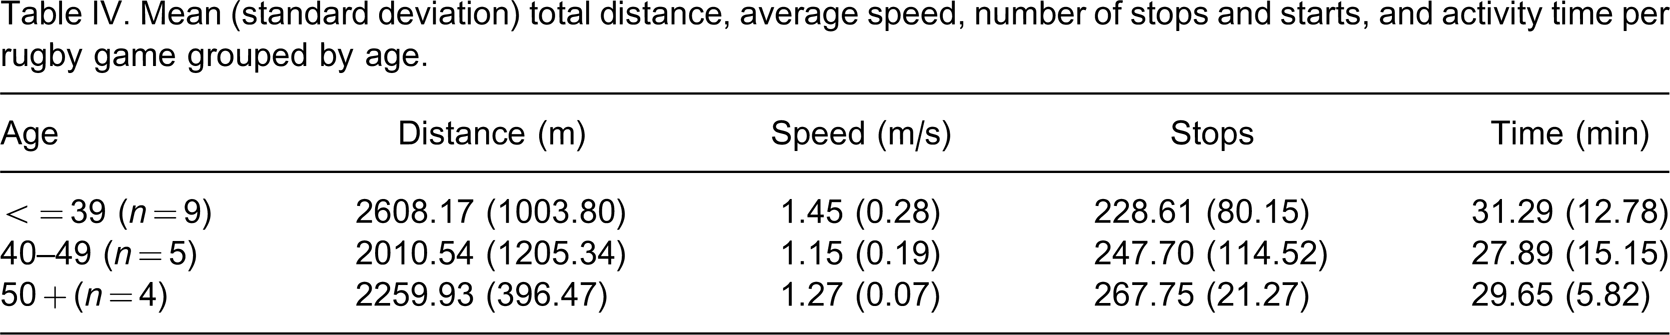
Mean (standard deviation) total distance, average speed, number of stops and starts, and activity time per rugby game grouped by age.
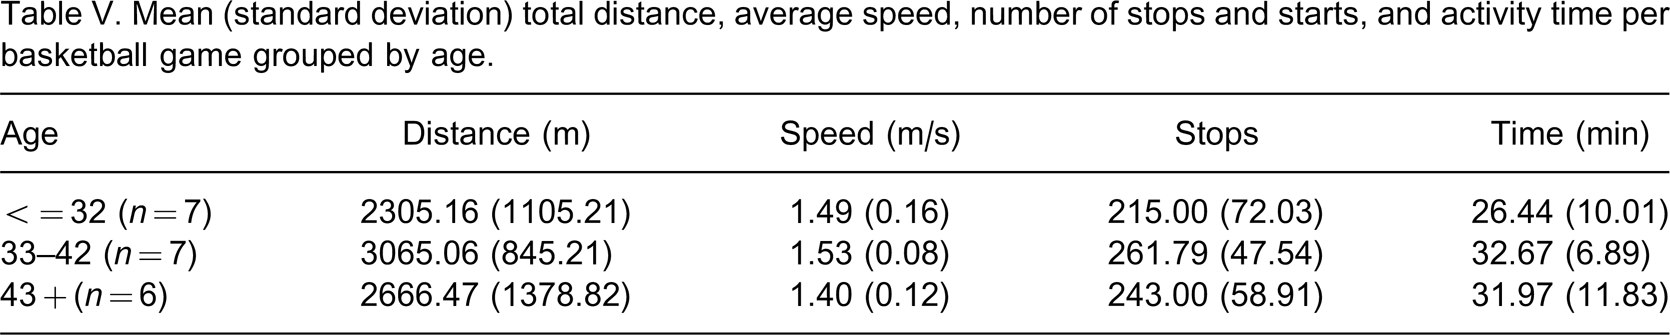
Mean (standard deviation) total distance, average speed, number of stops and starts, and activity time per basketball game grouped by age.
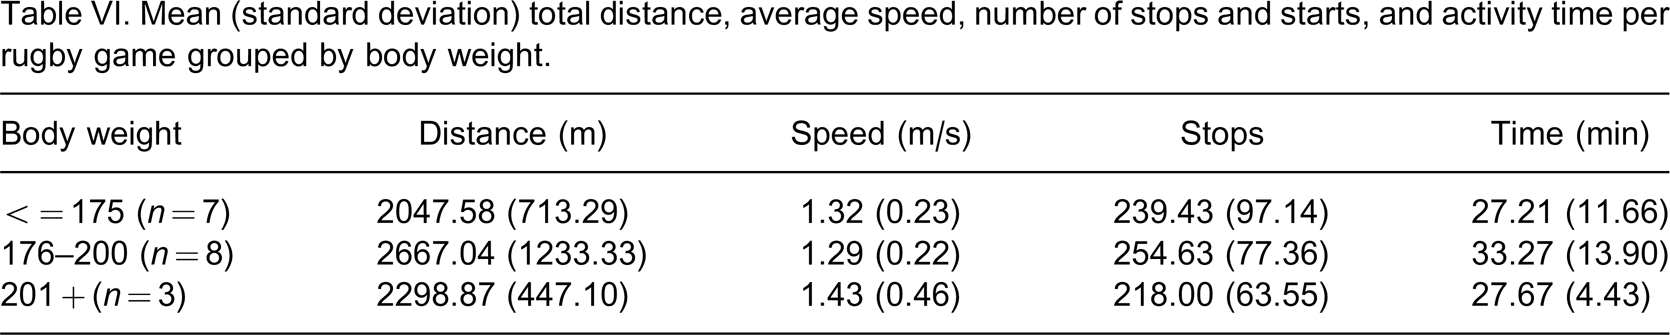
Mean (standard deviation) total distance, average speed, number of stops and starts, and activity time per rugby game grouped by body weight.
Mean (standard deviation) total distance, average speed, number of stops and starts, and activity time per basketball game grouped by body weight∗.
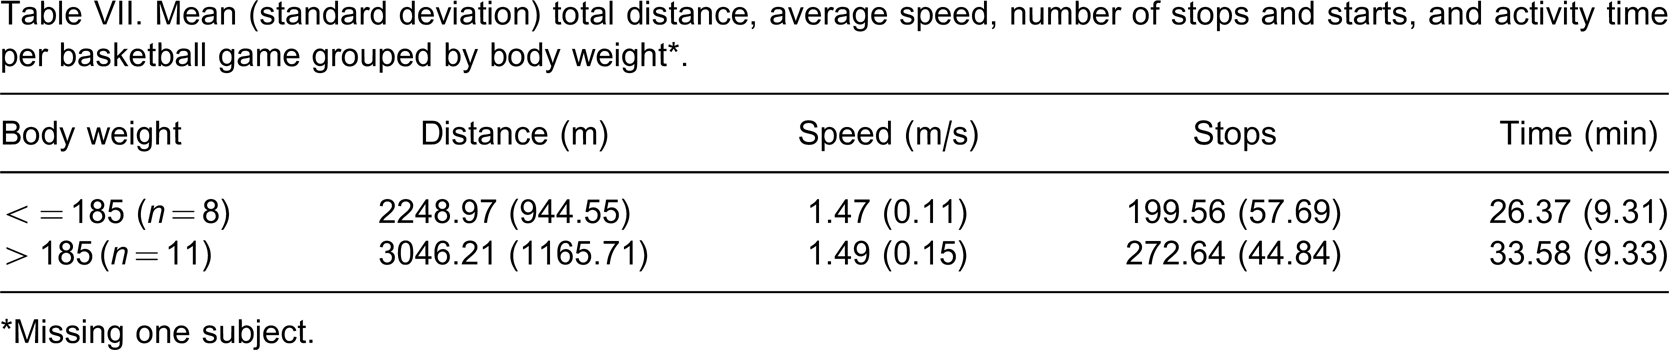
∗Missing one subject.
Mean (standard deviation) total distance, average speed, number of stops and starts, and activity time per rugby game grouped by geographical residence.
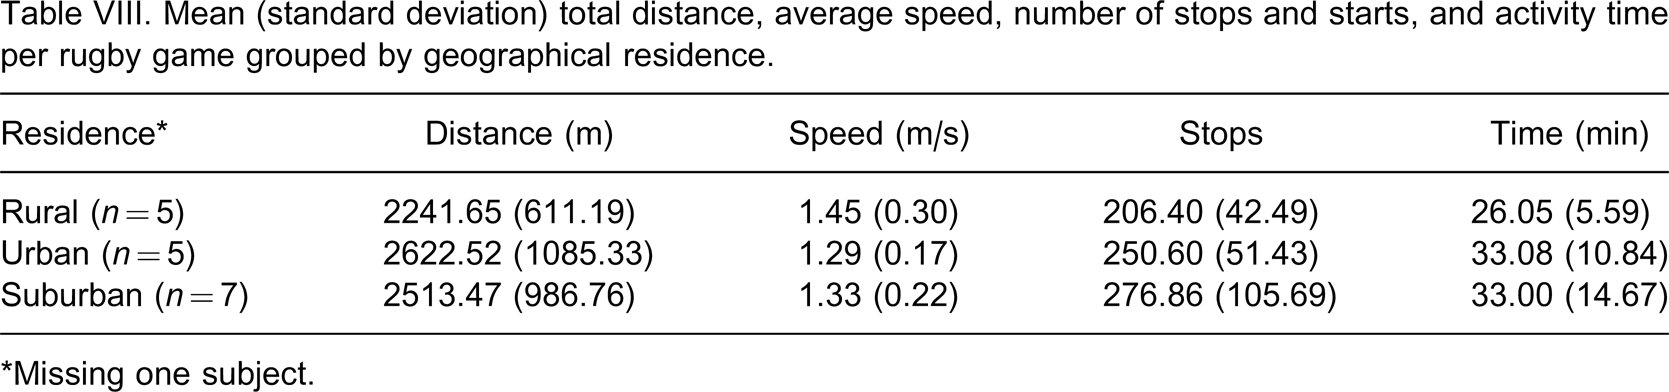
∗Missing one subject.
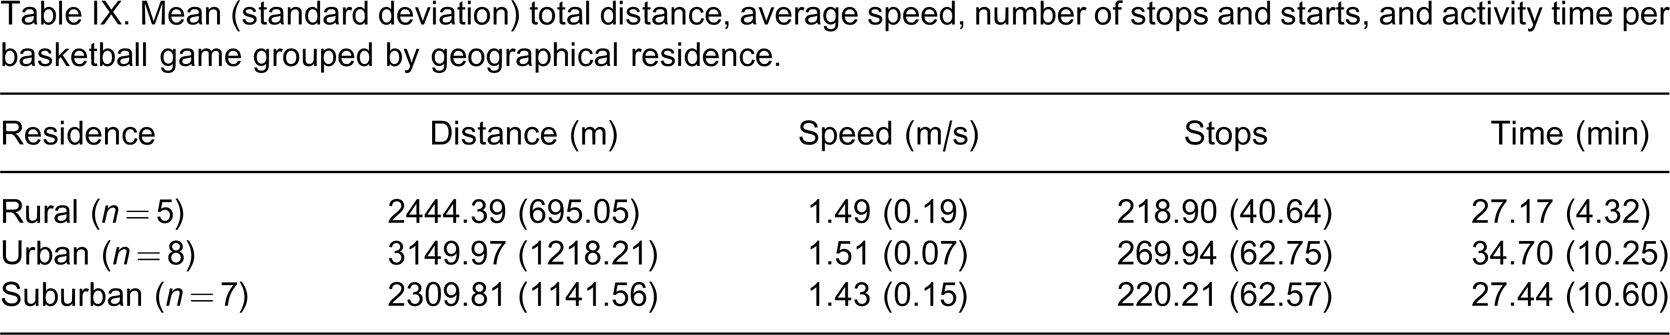
Mean (standard deviation) total distance, average speed, number of stops and starts, and activity time per basketball game grouped by geographical residence.
Rugby
Data were available for 18 individuals who participated in wheelchair rugby at the 2007 and 2008 NVWG. The participants had a mean age of 41.00 ± 10.33 years and a mean of 13.26 ± 9.27 years since injury or onset of disability. Disability and demographic characteristics are presented in Table I and the distribution of rugby classes are provided in Table III. Nine of the participants reported playing organized wheelchair rugby outside of the NVWG with a mean training time of 5.33 ± 2.92 h per week.
Table III displays the means for distance travel, the average speed, the number of stops and starts, and the activity time grouped by player classification. As a single group the participants on average traveled 2364.78 ± 956.35 m at 1.33 ± 0.25 m/sec with 242.61 ± 80.31 stops and starts in 29.98 ± 11.79 min.
Tables IV, VI, and VIII are alternative summaries of the data with the participants being grouped by age, weight, and geographical residence respectively. The age groups for the rugby athletes were set at 39 years and younger, 40–49 years, and 50 years and older. The weight groups were set at less than 175 lbs, 176–200 lbs, and 201 lbs and above.
Discussion
While similar data are available for basketball and rugby athletes, the two sports are different games utilizing different strategies with two different populations of athletes and are therefore not comparable. Several patterns emerged from the rugby data. Higher point rugby athletes (greater functional ability) had higher average speeds and stopped and started less than lower point players as expected; however, less expected was that the overall distances traveled did not vary greatly between classifications. When summarized by age, the younger players traveled farther and faster while stopping and starting less than older players. Athletes who live in urban or suburban locations traveled greater distances and played for longer time periods but at lower velocities and started and stopped more frequently than individuals from rural locations. For the weight subcategories no clear pattern was present and all players had roughly the same activity time.
Fewer patterns emerged within the basketball athletes, but some differences were observed. With respect to the basketball classification, Class II and III athletes traveled farther with more starts and stops than the Class I athletes. All three classes traveled at roughly the same velocity and played for the same amount of time during the game. When looking at these athletes based upon age, individuals who were between 33 and 42 years traveled the farthest and at a greater velocity than individuals who were 32 years or younger or 43 and older. For the weight subcategories, individuals greater than 185 lbs traveled farther and played for longer time than the individuals who weighed 185 lbs or less. Similar to rugby games, the athletes who live in urban locations traveled farther and faster, and played for longer time periods as compared to rural and suburban residences.
While the aforementioned patterns make sense intuitively and support the context validity of the methods, it is the quantitative values that are most important and interesting. No previous research has reported basketball or rugby game play variables such as these, making this data set unique. The information provided could be used by players and coaches to create training protocols that more accurately reflect game conditions. One should also note the overall intensity of game play. Tolerico et al. reported that veterans in their everyday wheelchairs traveled 2456.95 ± 1195.73 m per day at a speed of 0.79 ± 0.19 m/sec; [16] the rugby participants in this study traveled almost the same distance and the basketball athletes traveled farther in roughly an hour. The implication of this is that everyday propulsion is not likely to adequately prepare a player for competition; therefore appropriate training techniques need to be further developed and implemented.
The study population consisted of a relatively homogenous population of veterans from the NVWG, and as a result, the data might not be generalized to other populations. Future studies should aim to include more women and elite athletes. Additionally, the number of participants and number of games collected per participant was limited. If more athletes and more games were included, the data would be less influenced by an individual player in a single game, making the data more generalized. Lastly, the data logging technology could be improved by having the ability to add event markers to the data and improving the time resolution, so variables like instantaneous speed and acceleration could be calculated more accurately. These improvements would also allow immediate feedback to the athletes and coaches of athletic performance during practice and training.
Overall, the results of this study show that the majority (>75%) of the wheelchair athletes in this study (n = 14 rugby, n = 16 basketball) reach the CDC recommended 20 min of activity during a wheelchair basketball or rugby game. The benefits of participating in organized sporting events and recreation have been well documented [17] and promoting participation in wheelchair basketball and rugby may influence activity levels and help reach the CDC's recommended activity levels. [7]
Footnotes
Acknowledgements
This material is based upon work supported by the Department of Veterans Affairs Office of Research and Development, Rehabilitation Research & Development Service, Grant # B3142C.