
Abstract
The Stanmore-Kingston Splat is a graphical display of the goals and achievements of amputee rehabilitation patients using the Locomotor Capability Index. The chart is in a radial polygram form with the sectors coloured and shaded. Three scores can be shown: The patient's capability at delivery of the prosthesis, the goals set for rehabilitation, and the final achievement after the programme. The main advantages are rapid, easy reading for a therapist and convenient use when discussed with the patient at goal setting or progress review. The Splat is being used at Stanmore Disablement Services Centre and an extension to other centres is planned.
Introduction
The standards of the Royal College of Physicians (UK) for the speciality of rehabilitation medicine requires that all patients enrolled in rehabilitation programmes should have goals set formally and that they should have the outcome recorded using recognized outcome measures, preferably validated (Turner-Stokes 2002). There is a basket of outcome measures for prosthetic rehabilitation that covers pain, socket comfort, activity, mobility and other aspects relevant to pre-morbid function (British Society for Rehabilitation Medicine 2003) from which one should select the appropriate measures (Kent and Fyfe 1999). The Harold Wood-Stanmore Mobility Grade (Hanspal et al. 1991) remains the most commonly used disability measure for mobility (Turner-Stokes and Turner-Stokes 1997; Rommers et al. 2001) though the British Society of Rehabilitation Medicine recommends the SIGAM Grades (Ryall et al. 2003) which is the modified version and more recently validated. While these grades give a quick overall picture of the mobility achieved with a prosthesis, the Locomotor Capability Index (LCI) (Grise et al. 1993) is particularly popular with physiotherapists, probably because it measures the specific tasks involved in post-prosthetic physiotherapy and gait re-education. The LCI is part of the Prosthetic Profile of the Amputee Questionnaire (PPA), which has been validated (Gautier-Gagnon and Grise 1994; Gautier-Gagnon et al. 1998; Streppel et al. 2001) and is used in several rehabilitation centres.
The LCI grades the patient in seven basic and seven advanced activities on a scale from 0 to 3, giving a maximum total score of 42. It is generally scored once, at the end of the therapy programme. The patient's total score may give a general impression of the overall mobility, but gives little information about each specific task assessed. In this respect it is similar to the FIM+/−FAM where the total score has little relevance but each sub-score gives a clear picture of the patient's functional abilities at the time and can be used for goal setting in neurological rehabilitation. Nyein et al. (1997) have also designed a graphic representation of the FIM+/−FAM results for each patient.
In the early post-prosthetic phase the patient has gait re-education with a physiotherapist using the 14 tasks in the LCI. Like the FIM+/−FAM, the Stanmore-Kingston Splat may be used both to set goals with the patient and record the outcome scores, fulfilling both requirements of the Royal College of Physicians' standards. The Splat has therefore been designed to indicate three scores, those at the time of delivery of the prosthesis to show ability before the therapy programme, goal setting at the start of the therapy programme and gait re-education and finally at the time of discharge at the completion of the programme. These indicate the patient's clinical and physical improvement, so it is easy to gain an indication of the ‘value added’ that may be useful in a service increasingly subject to audit. A simple graphical display of all three capability scores could meet this need.
Aim
The aim of this article was to devise a system for graphic representation of rehabilitation outcome with a diagram that is intuitively readable by the clinician and easily explained to the patient. The diagram should also allow the individual activity scores to be read easily from the chart and be suitable for filing in printed or electronic form as a patient record and for audit. This would involve the development of software that draws the diagram from the standard patient record data.
Description
The authors have developed a system using Microsoft Excel (Microsoft Corporation, USA) to display graphically the LCI data. After experimenting with several forms of chart, a polygram form of radial chart was selected with colour and shading to differentiate the relevant zones. Scores for the seven basic activities are on the right and those for the advanced ones on the left. The score values may be read easily from the calibration marks or a general impression taken from the shape and size of the diagram. This gave rise to the term ‘Splat’ because one of the experimental charts resembled very soft coloured icing sugar spilled onto a confectioner's slab. Delivery scores typically have several zero values. Hence the position of the zero was moved outwards to create a false zero for legibility; without a false zero the delivery part of the Splat tended to shrivel into a central dot. Basic activities are shown on the right on the Splat to enable it to be read clockwise from the 12 noon position. For conformity the table also has the basic activities on the right.
Figure 1 is an example of a Splat with corresponding LCI table, showing how it can be used to display typical results seen in a rehabilitation clinic. In the example the patient has achieved all but the two basic goals of step up and down a sidewalk kerb. In the advanced activities the patient has missed three goals but exceeded the goal set in one activity. Figure 2 uses data designed to test the Splat in the unusual situation of a patient appearing to regress during a rehabilitation programme; the data were chosen in order to test the Splat representation in an extreme situation. In this Splat for the activity of rising from the floor, the delivery score (solid yellow sector) penetrates the goal (dotted pink) area, drawing attention to a clinical anomaly. In other activities ten of the 14 goals are achieved and goals exceeded in three.
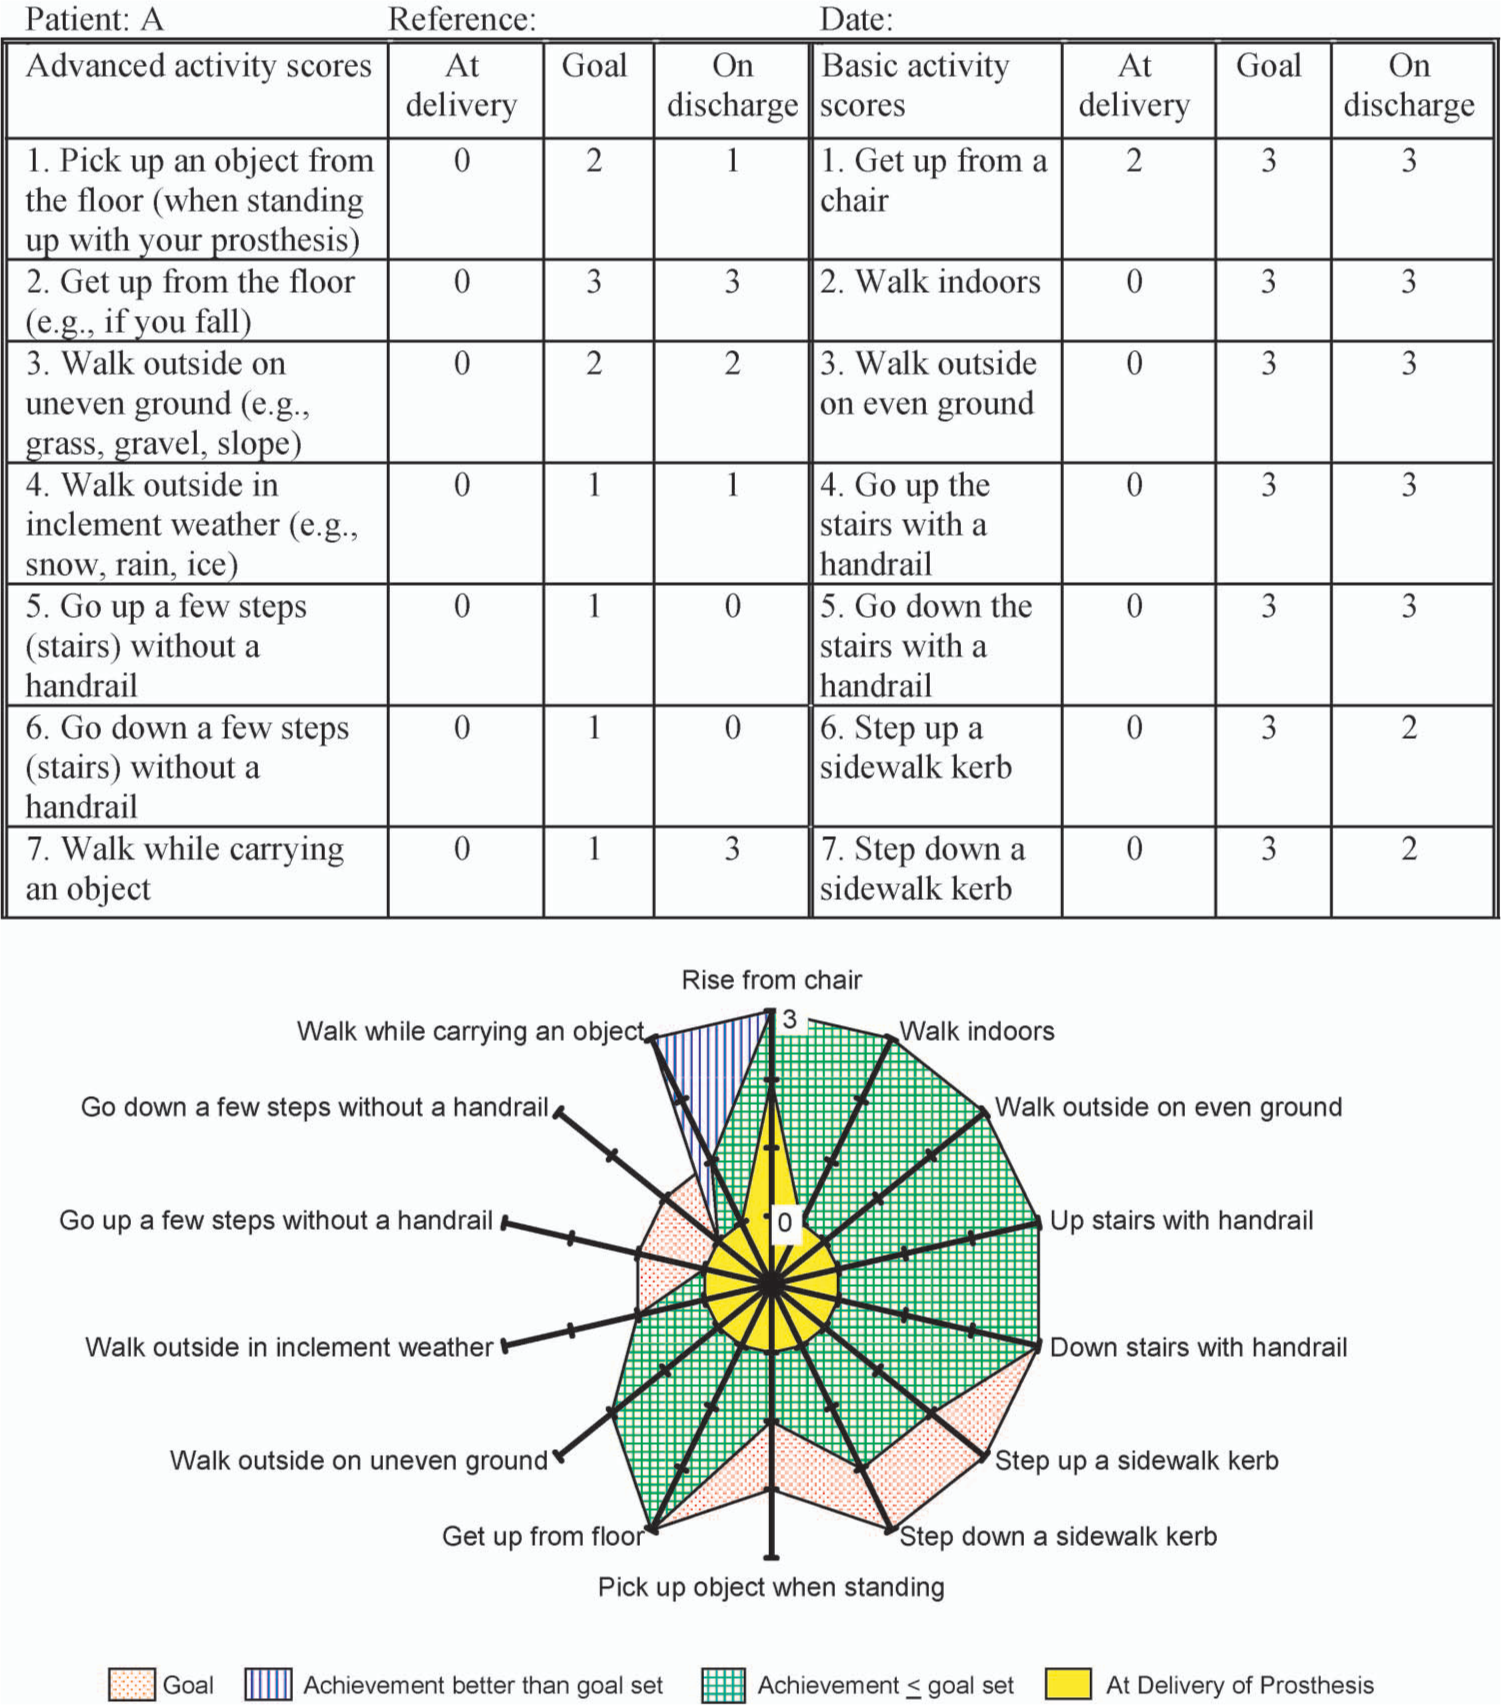
Example of a patient data sheet and the corresponding Splat. Basic activities are shown on the right hand side and the advanced ones on the left. This example shows that the patient has achieved all but three basic goals. In the advanced activities the patient has missed two goals but exceeded the goal set in one (walking while carrying an object).
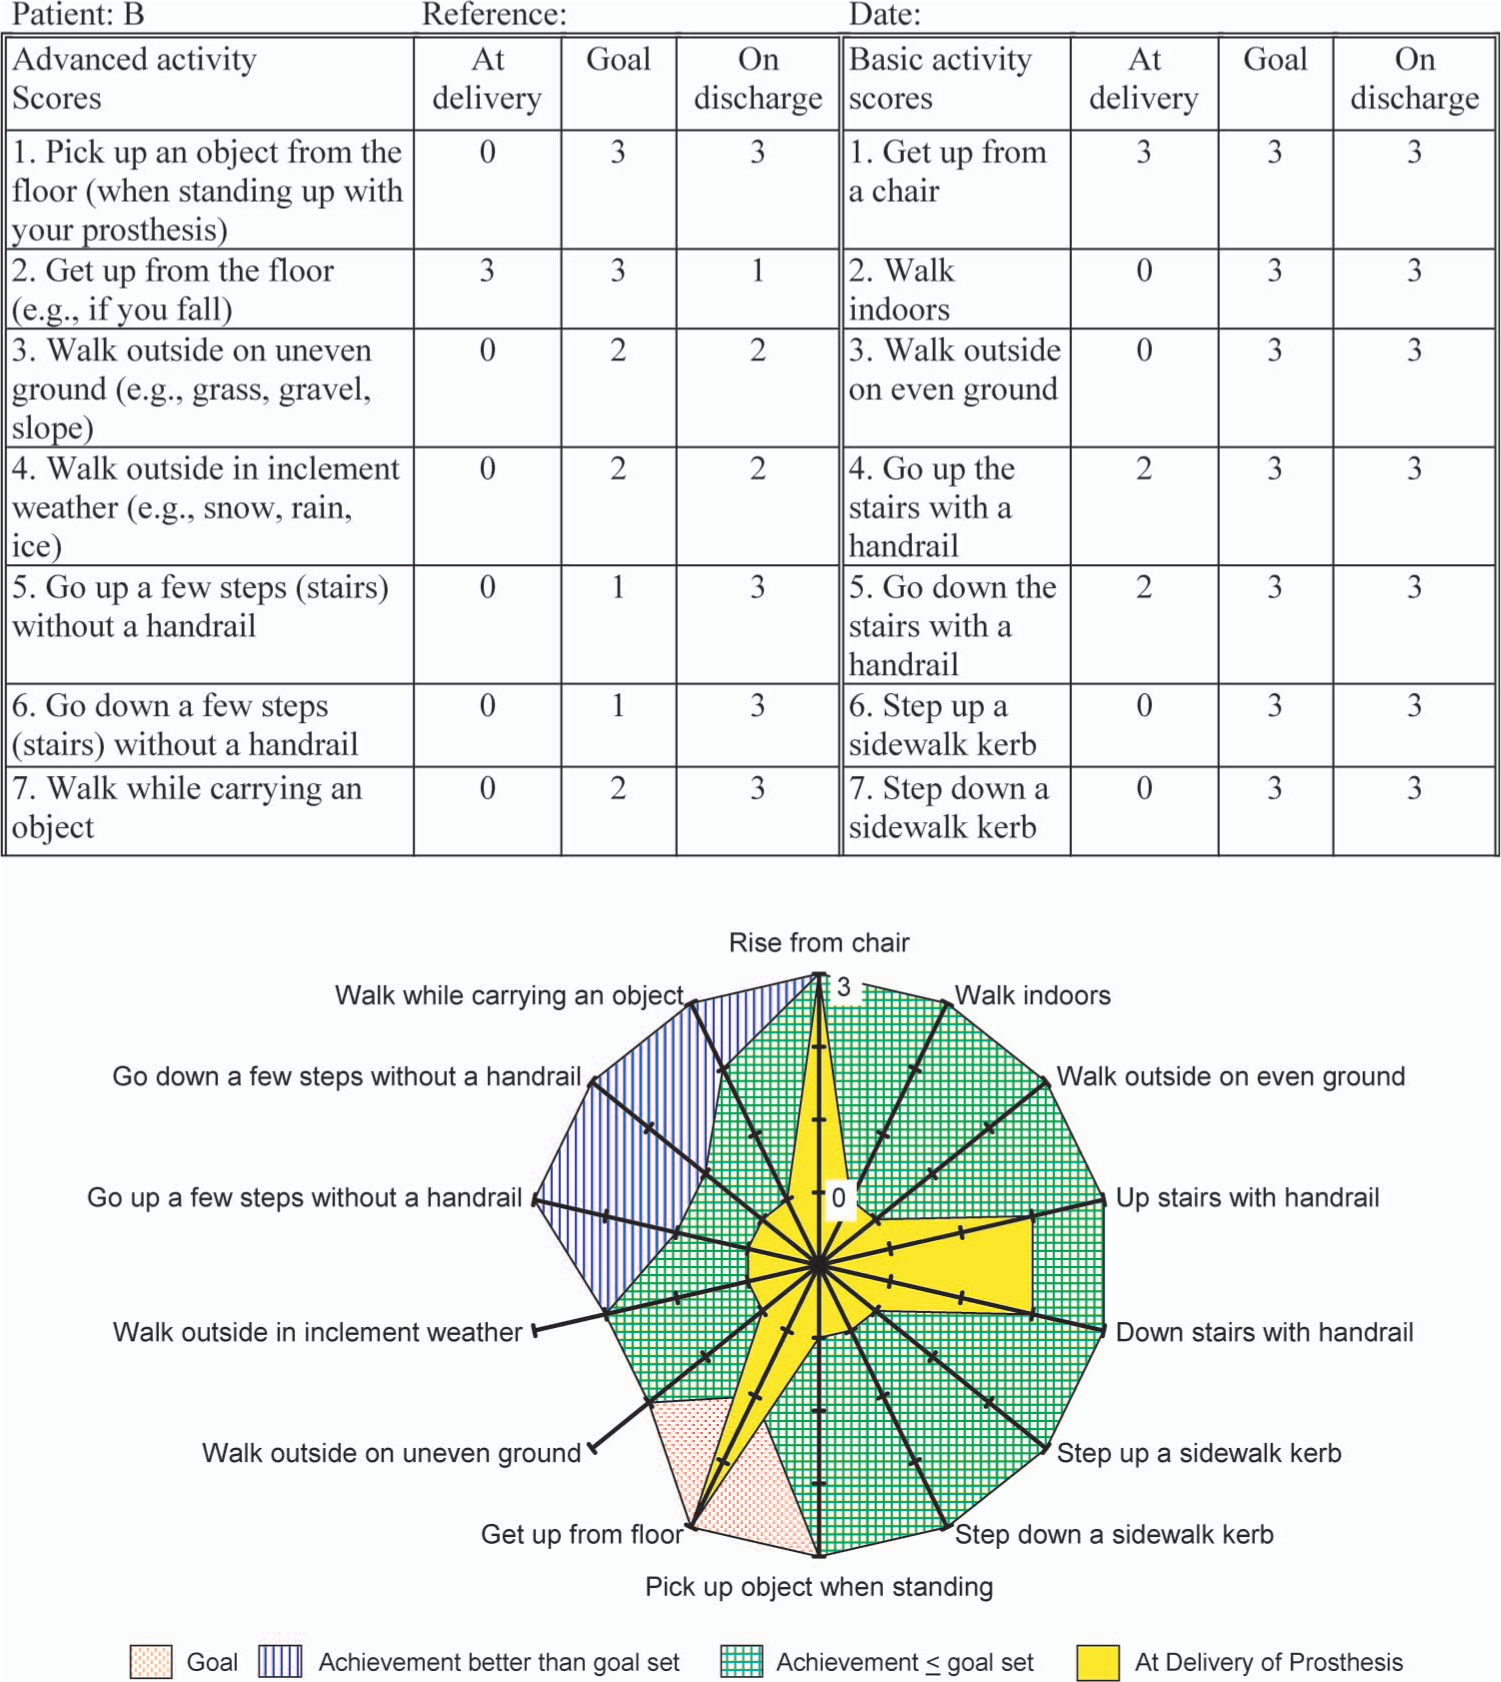
Example of a patient data sheet and the corresponding Splat showing an anomalous clinical condition. The Splat shows clearly that in the activity of rising from the floor the delivery score (plain sector) penetrates the goal (dotted) area, drawing attention to a clinical anomaly. This is not so clear from the data sheet alone. In other activities the patient has achieved ten of the 14 goals and exceeded the goal sets in three.
In both examples, the patient's capability on delivery of the prosthesis is shown by the solid (yellow) area. The dotted (pink) area shows activities in which goals have not been met. The squared (green) area shows the achievement of the patient, while the striped area (blue) highlights the activities in which the patient has exceeded the set goals. (See online for colour detail.)
The Splat should have significant advantages over using the patient data table alone. For example, a therapist should be able obtain a general picture of the patient's capability very quickly and with little practice. The Splat also should be readily understood by patients, because the expected or achieved capability in any activity is shown by the length of the radial line. This ease of comprehension is particularly important when goal setting or reviewing progress. Doing so with only the data table is likely to demand more experience and numerical skills.
Application
The Stanmore-Kingston Splat has been used experimentally alongside the current procedure for recording data from patients at the Stanmore DSC with encouraging results. It is planned to use the Splat in other regional prosthetic centres in England.
Conclusion
The Splat system provides a quick and effective means of displaying LCI data and helps in goal planning. As the system uses Microsoft Excel (Microsoft Corporation, USA) it should be possible for it to be utilized in many establishments.