
Abstract
Recent international studies have highlighted the limitations of epidemiological surveys for estimating the prevalence of schizophrenia and identified significant variation in estimates between different population groups [1–4]. These limitations include low statistical power, response rate bias, and issues of diagnostic reliability associated with the use of structured interviews. Such findings have highlighted the importance of using multiple data sources for estimating the prevalence of schizophrenia and producing estimates for local populations groups.
As an alternative to the survey approach, we applied capture–recapture estimation [5], [6] to routine mental health data to estimate the annual prevalence of schizophrenia in the Māori population of New Zealand. This is a well-established epidemiological procedure used to address issues of case under-ascertainment in low prevalence and/or stigmatized disorders [7], and has been used to estimate the rates of dementia [8], drug addiction [9], intellectual disability [10] and other mental illness [11]. As far as we aware, however, the present study is the first to apply this procedure to schizophrenia.
Historical reports on psychiatric hospital admissions suggest that Māori may have a higher incidence and prevalence of schizophrenia than the non-Māori majority [12]. The first New Zealand mental health survey, however, did not report ethnic-specific data on schizophrenia [13], and the recent national mental health survey did not include this illness [14]. Therefore the population prevalence of schizophrenia is unknown for this ethnic group. The present study provides 12 month prevalence estimates for Māori and non-Māori populations based on data from hospital and community services using the capture–recapture procedure.
Methods
Data sources
We used two New Zealand routine mental health data sources to estimate prevalence. The National Minimum Dataset (NMDS) records all diagnoses of people discharged from inpatient care in public and private hospitals from the 1970s to the present [15]. The Mental Health Information National Collection (MHINC) is a specialized mental health database. It includes information on service activities by private and public hospitals and community mental health services from 2000 onwards [16]. In principle MHINC ought to contain all NMDS mental health records plus those for community services, and thus provide a better data source than NMDS alone to estimate the prevalence of schizophrenia.
We obtained an extract for both sources covering three 1 year periods beginning 1 July 2000 and ending 30 June 2003. We identified service activities for people with schizophrenia by searching for any mention of the ICD9 codes 295.x, excluding 295.4 and 295.7. Both NMDS and MHINC use a common unique personal identifier system, National Hospital Index (NHI), that is regularly audited to remove duplicates. We used an encrypted version of the NHI number to link individuals within and between the two databases. Denominator data were taken from the New Zealand Census 2001. The New Zealand Health Information Service granted approval for this procedure.
The completeness of the data in MHINC consistently improved over the 3 years since MHINC was established in 2000. Although the numbers of hospital service provisions for schizophrenia recorded in MHINC increased by 11% from 2000–2001 to 2002–2003, the numbers of community provisions almost doubled in the same period, reflecting progressive improvements in the reporting of diagnoses for patients receiving these services.
Ethnicity
Both New Zealand mental health and census data collections use self-identification procedures that allow individuals to select multiple ethnic groups. Based on previous evidence, however, it is likely that there is a degree of mismatch in ethnicity coding between such datasets [17]. Therefore we used the recommended approach [17] to address this potential problem and grouped all individuals who selected ‘Māori’ ethnicity as an option into one total ‘Māori ethnic group’. All other individuals were grouped into the ‘non-Māori’ group, the majority of whom were of European descent. The Māori population is generally younger than the non-Māori population, and where appropriate we adjusted our estimates for age-structure differences using the Segi standard population [18].
Socioeconomic deprivation
We also adjusted our estimates for the effects of socioeconomic deprivation using the NZDep01 index [19]. This is an area-based deprivation score derived from the 2001 Census. Each individual in MHINC and NMDS is assigned an NZDep01 score based on their residence. The index is based on the proportions of people: receiving a means-tested benefit; who are unemployed; below an income threshold; with access to a telephone or car; living in a single parent family; with no qualifications; living in households below a bedroom occupancy threshold; and not living in their own home.
Prevalence estimation
We obtained a simple estimate of contact prevalence [20] by counting all 3662 unique cases of schizophrenia in MHINC during the year 2002–2003. Table 1 provides the resulting raw and adjusted prevalence estimates for Māori and non-Māori. Despite our expectation that the NMDS cases for this period should form a subset of the MHINC group, we found 1294 additional cases recorded only in NMDS, giving a total of 4956 cases in 2002–2003. This may have been partly due to missing diagnoses in MHINC, preventing matching of service provisions to specific individuals with schizophrenia.
Estimates of contact prevalence of schizophrenia in New Zealand (2002–2003)†
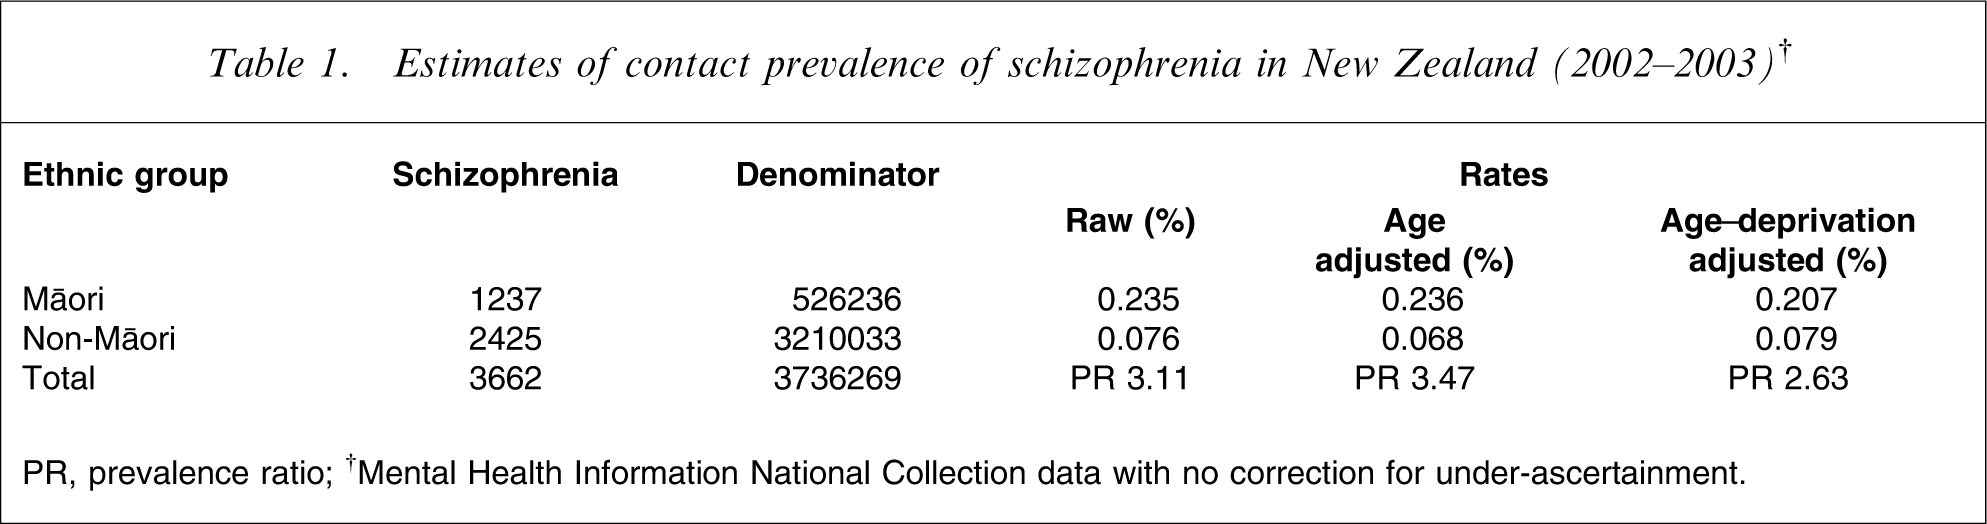
PR, prevalence ratio.
†Mental Health Information National Collection data with no correction for under-ascertainment.
Capture–recapture
Recognizing that neither NMDS nor MHINC provides a complete list of all individuals with schizophrenia, we applied capture–recapture estimation [5], [6] to these databases to generate annual population prevalence estimates for Māori and non-Māori. The capture–recapture method is a means of estimating the size of a population. It is applied in situations where two or more registers or lists of cases are available, but no one list contains the entire population of cases. The degree of matching between the sources is used to estimate the total population size: a nearly complete match between the lists indicates that almost all cases have been seen on one or other list. But if the lists have very few cases in common then a large number of cases are likely to exist that have not have been recorded (‘captured’) by any of the lists.
The simplest capture–recapture procedure involves two case registers or lists. Figure 1 depicts this situation: n1 individuals with a given illness are seen on one list, n2 on the other, and n12 are found on both lists.
Two-list capture–recapture procedure.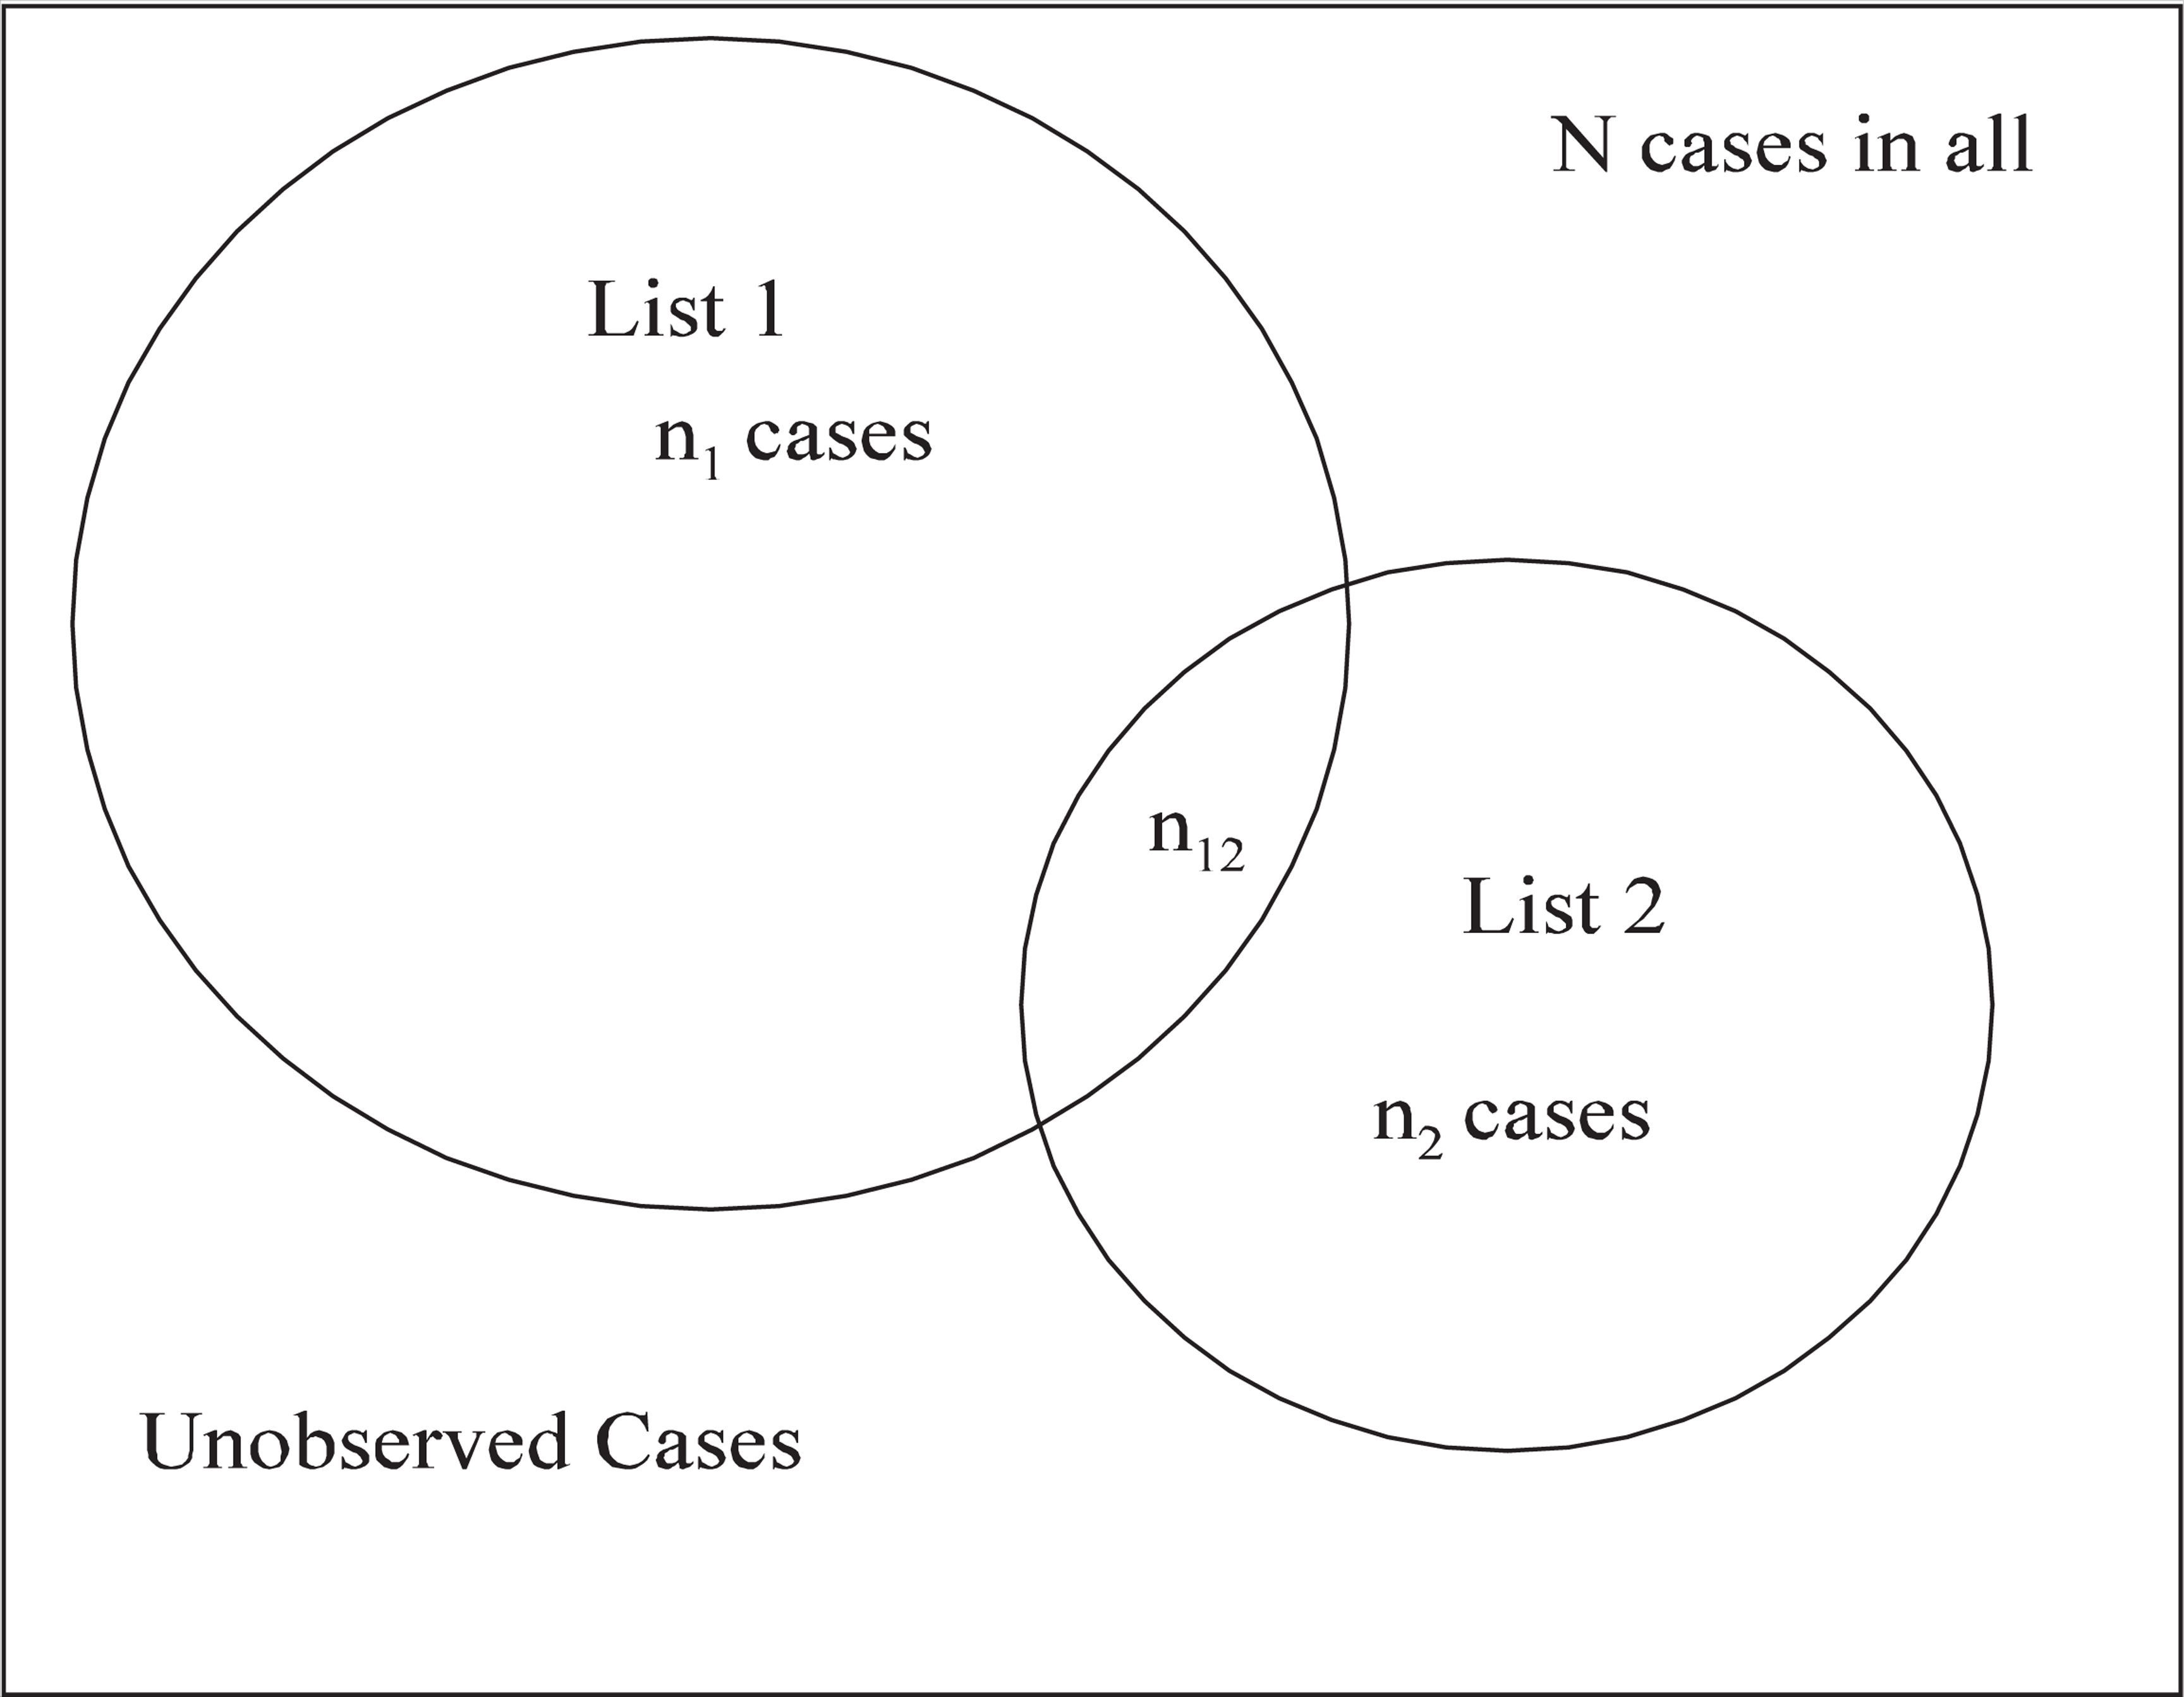
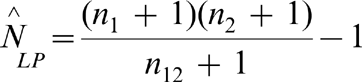
The total number of individuals (N) can then be estimated using the Lincoln–Petersen equation:
To allow for any potential problems of list dependence (Assumption 2), we used a more complex four-list capture–recapture procedure. We divided the NMDS and MHINC extracts (using existing categories) into four lists of people with schizophrenia. Lists 1 and 2 were created from NMDS and lists 3 and 4 from MHINC. Individuals on list 1 were admitted to psychiatric inpatient services and those on list 2 to a general hospital ward. Individuals on list 3 were admitted to either psychiatric or general inpatient services, and those on list 4 were attending community mental health services. Table 2 shows the counts on these lists during 2002–2003.
Schizophrenia patients on four New Zealand health service lists during 2002–2003
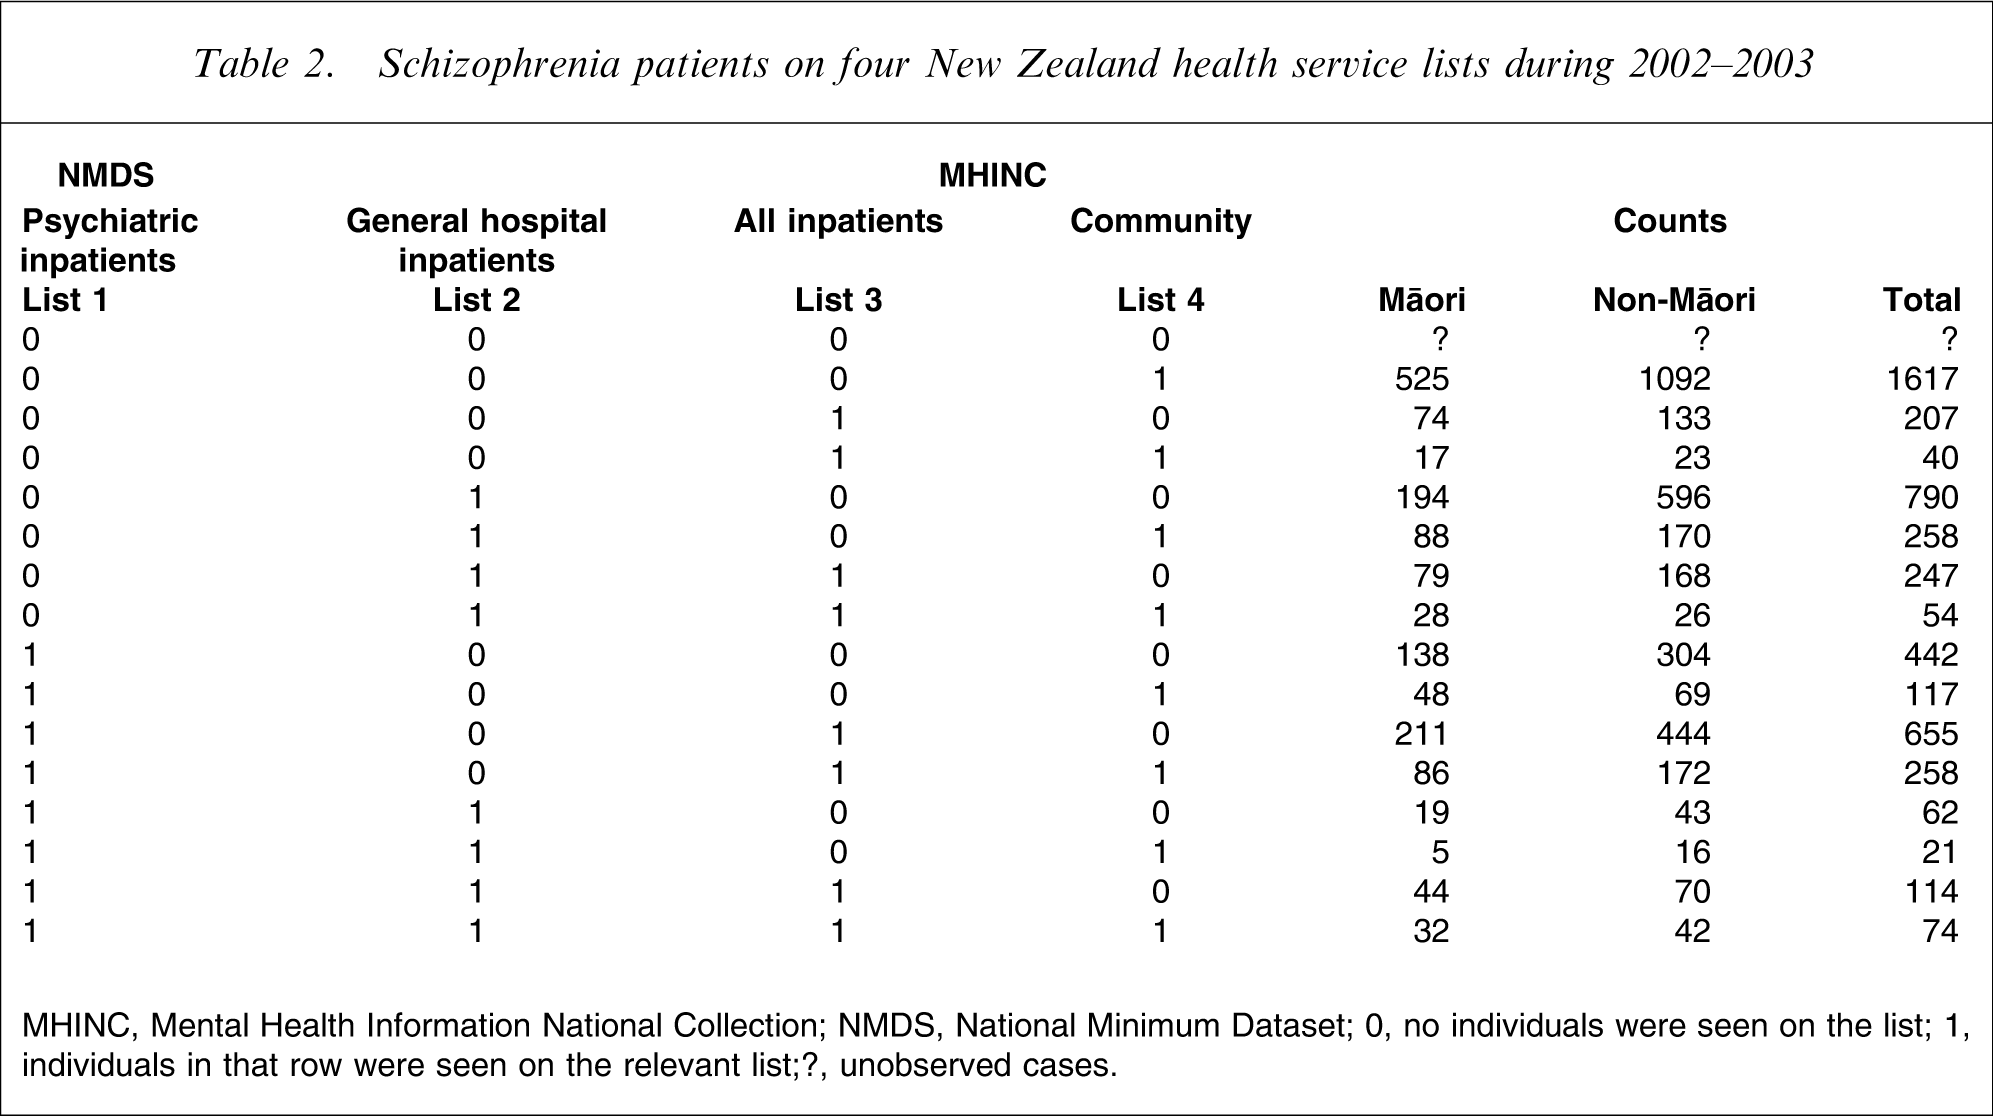
MHINC, Mental Health Information National Collection; NMDS, National Minimum Dataset.
0, no individuals were seen on the list; 1, individuals in that row were seen on the relevant list;?, unobserved cases.
In general the robustness of the capture–recapture procedure depends on the following assumptions.
Accuracy of identification
It is assumed each individual case has been assigned ‘one’ unique identifier. New Zealand Health Information Service, who manage the data, removed 1.3% of records identified as duplicates.
Independence
In the simplest capture–recapture model it is assumed that the probability of a given case being recorded by one list is not affected by the capture of the same case by the other list. The independence assumption is likely to be violated in MHINC and NMDS. Where three or more lists are used, however, the dependence between them can be assessed, and if necessary an appropriate adjustment can be made. We expect a strong positive dependence among the three hospital-based lists (lists 1–3), and weaker dependence between these lists and list 4 (community-based services). This was confirmed when we fitted a saturated log-linear model [21] with all three-way interactions to the Total counts data in Table 2. The only significant three-way interaction involving list 4 was with lists 1 and 3.
Homogeneity of capture probabilities
In simple implementations of capture–recapture each individual is assumed to have the same chance of being recorded on a given list. This assumption can be relaxed and modelled by including measured covariates to account for differences in capture probabilities. We used log-linear modelling to model capture probability. Our final model allowed capture probabilities to depend on age, ethnicity, gender and deprivation.
Closed population
The population should not gain or lose members over the course of the study, but this assumption is typically violated in most epidemiological studies. The effect of incorrectly assuming a closed population (when in fact there are entries and exits) is to generate an overestimate of the true prevalence. To minimize this effect we fitted our model separately for each of the three 1 year periods. We estimate that the proportion of people with schizophrenia that is replaced in any given year is <10%, and therefore any overestimation in prevalence is <10% of its value. Prevalence ratios (PRs) are affected to an even lesser degree by the violation of the closure assumption, and there is no effect at all if the proportion of the population replaced each year is similar in the groups being compared.
Model selection
We fitted separate models to the data in each of the three 1 year periods (2000–2001, 2001–2002 and 2002–2003). The Akaike information criterion (AIC) [6] was used to select the best model in the period 2002–2003, where the data are the most complete and reliable. We included main effects and all two-way interaction terms between age group, gender, ethnicity, deprivation (quintile of the NZDep01 deprivation score) and list membership, and three-way interactions between lists. Only four age groups (15–24 years, 25–34 years, 35–44 years and 45–64 years) were used, in order that the data not become too sparse. Interactions between ethnicity and gender, and between deprivation and gender were dropped from the model by AIC. All two-way interactions between lists were retained, and the only three-way interactions were those between lists 1, 2, and 3, and between 1, 3 and 4. The only interaction between list membership and ethnicity retained by AIC was that for list 4 (MHINC, community-based services), which suggests that the probability of capture is independent of ethnicity for the hospital-derived lists (lists 1–3).
Having selected the variables in the best model for the most reliable and complete 2002–2003 data, we estimated the parameters of that model separately and independently in all 3 years. When fitting log-linear models, additional variability can be modelled using an over-dispersion factor. This has the effect of widening the confidence intervals to account for heterogeneity between groups above that explained by the explanatory variables and random variation [21]. We estimated this over-dispersion when fitting the model and found only mild over-dispersion factors of 1.11, 1.21 and 1.07 for the three study years, respectively. This over-dispersion is incorporated into all of the reported confidence intervals.
Results
Table 3 shows the 1 year prevalence estimates by ethnicity, gender and year. The estimated prevalences for Māori are consistently higher than for non-Māori, even when adjusted for age (Segi), deprivation (NZ-Dep), and case under-ascertainment (capture–recapture). The corresponding PRs for these estimates in Table 3 are shown in Table 4. We tested for the stability of the prevalence estimates over time (by ethnicity and gender) using contrasts of the fitted parameters and their covariances. At the 5% level we find that the estimates are all stable. We similarly compared the prevalence estimates between men and women within the ethnic groups. Māori men had significantly higher prevalence estimates than Māori women, who had higher estimates than non-Māori men, with non-Māori women having the lowest prevalence of all (Table 3). These differences are found consistently in all three time periods, and remain significant after a sequential Bonferroni correction for multiple testing.
Capture–recapture prevalence estimates of schizophrenia in New Zealand during 2000–2003 (ages 15–64 years)
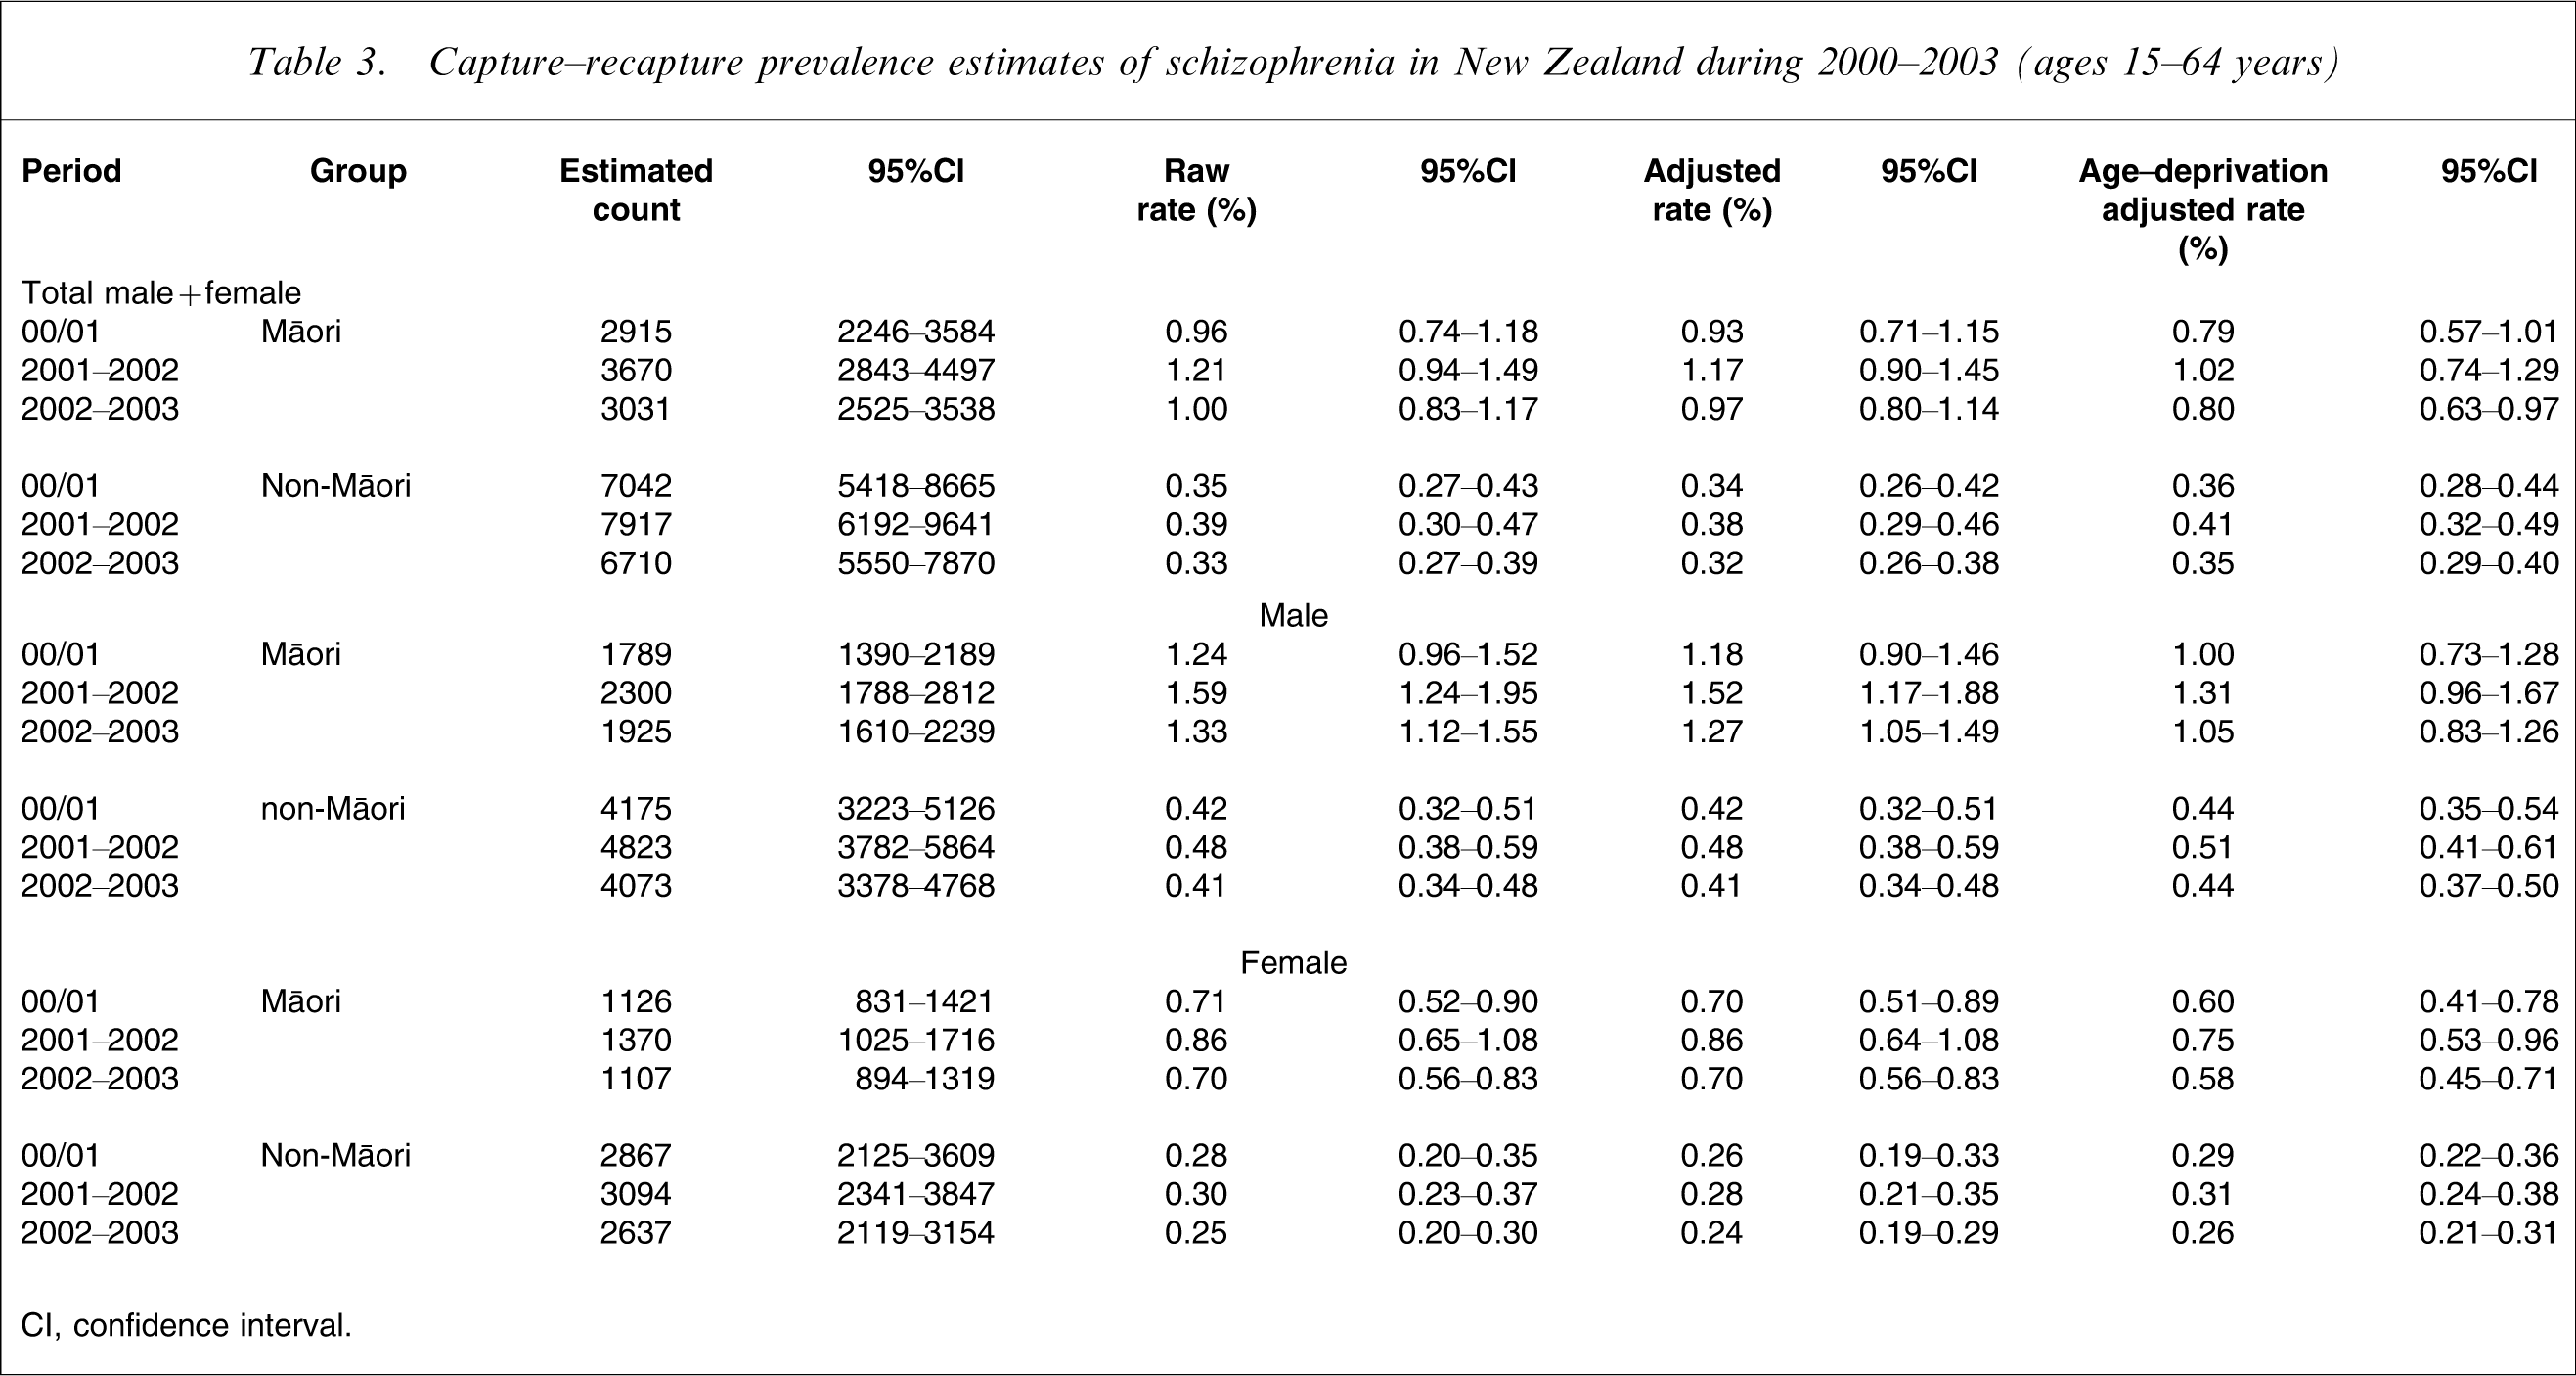
CI, confidence interval.
Capture–recapture prevalence ratios of schizophrenia for New Zealand Māori population, taking non-Māori as reference (ages 15–64 years)
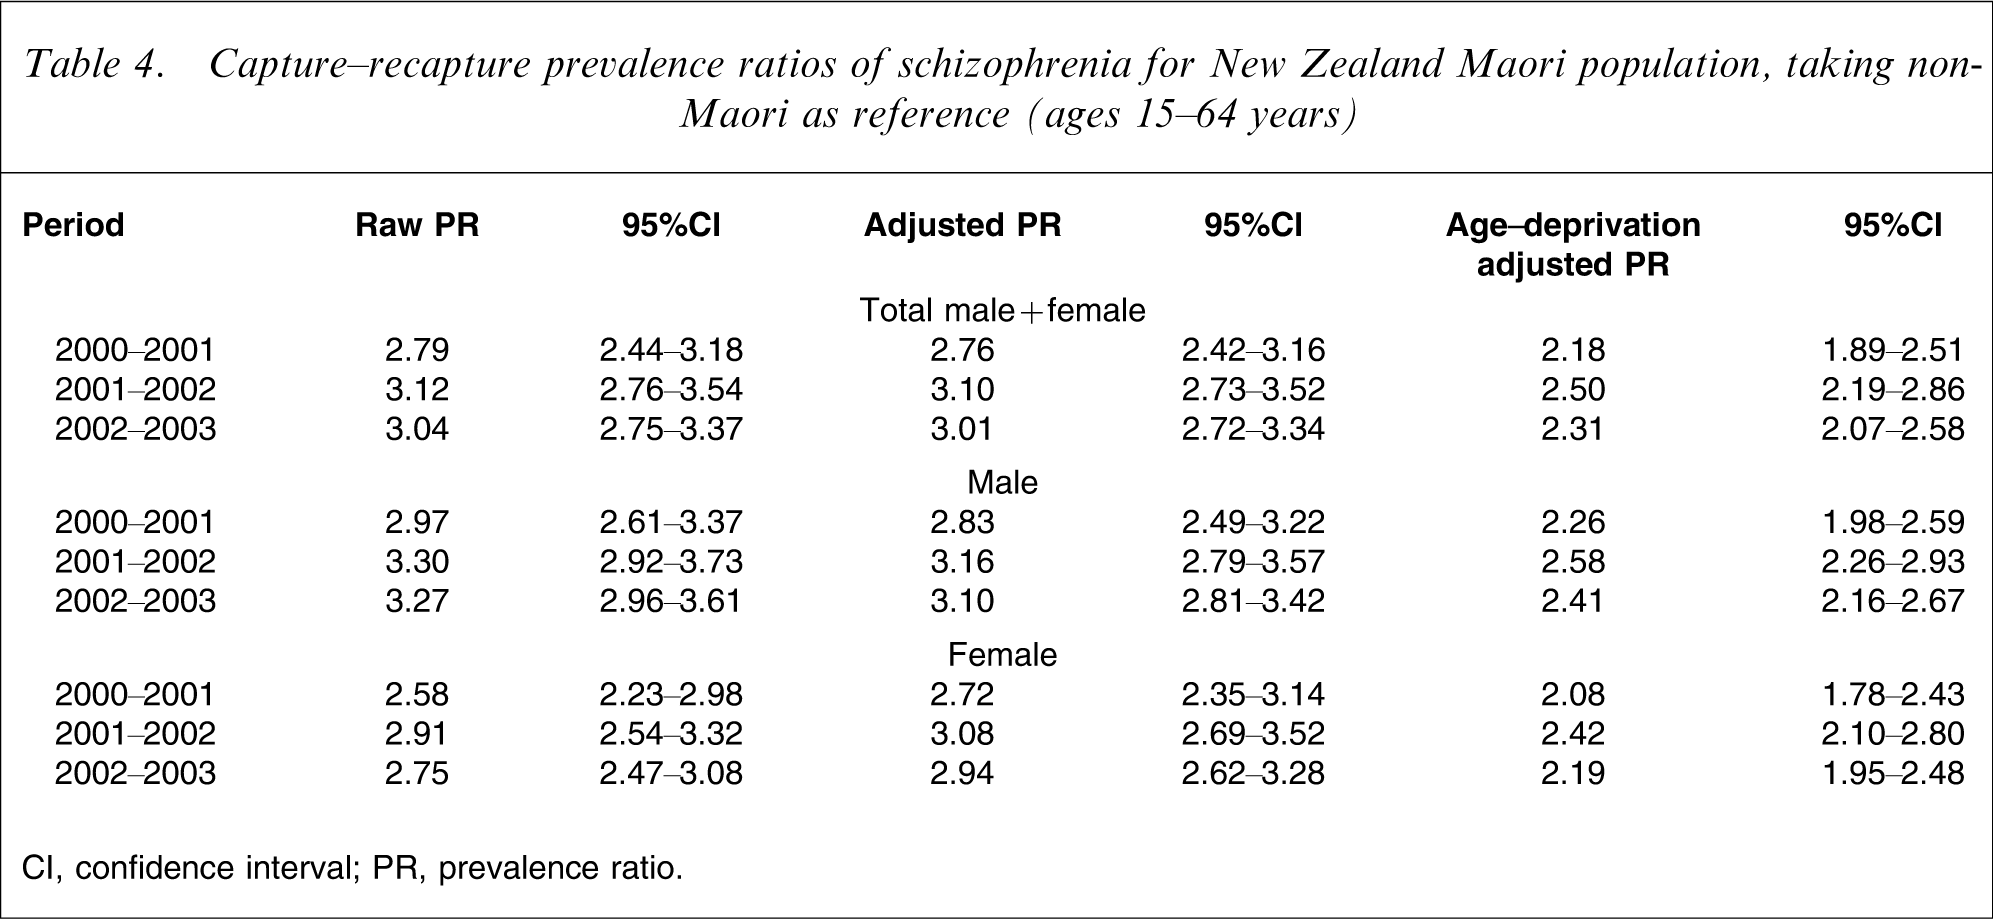
CI, confidence interval; PR, prevalence ratio.
Annual prevalence estimates and PRs by deprivation quintile are given in Table 5. The estimates for both Māori and non-Māori increase from NZDep01 Quintile 1 (least deprived) to 5 (most deprived). There is a significant interaction, however, between ethnicity and deprivation: although the prevalence for non-Māori increases by a factor of 6.1 from quintile 1 to 5, the increase for Māori is a factor of only 2.9. For this reason the PRs decrease with increasing levels of deprivation.
Capture–recapture deprivation-specific prevalence estimates and ratios of schizophrenia in New Zealand during 2002–2003 (age 15–64 years)
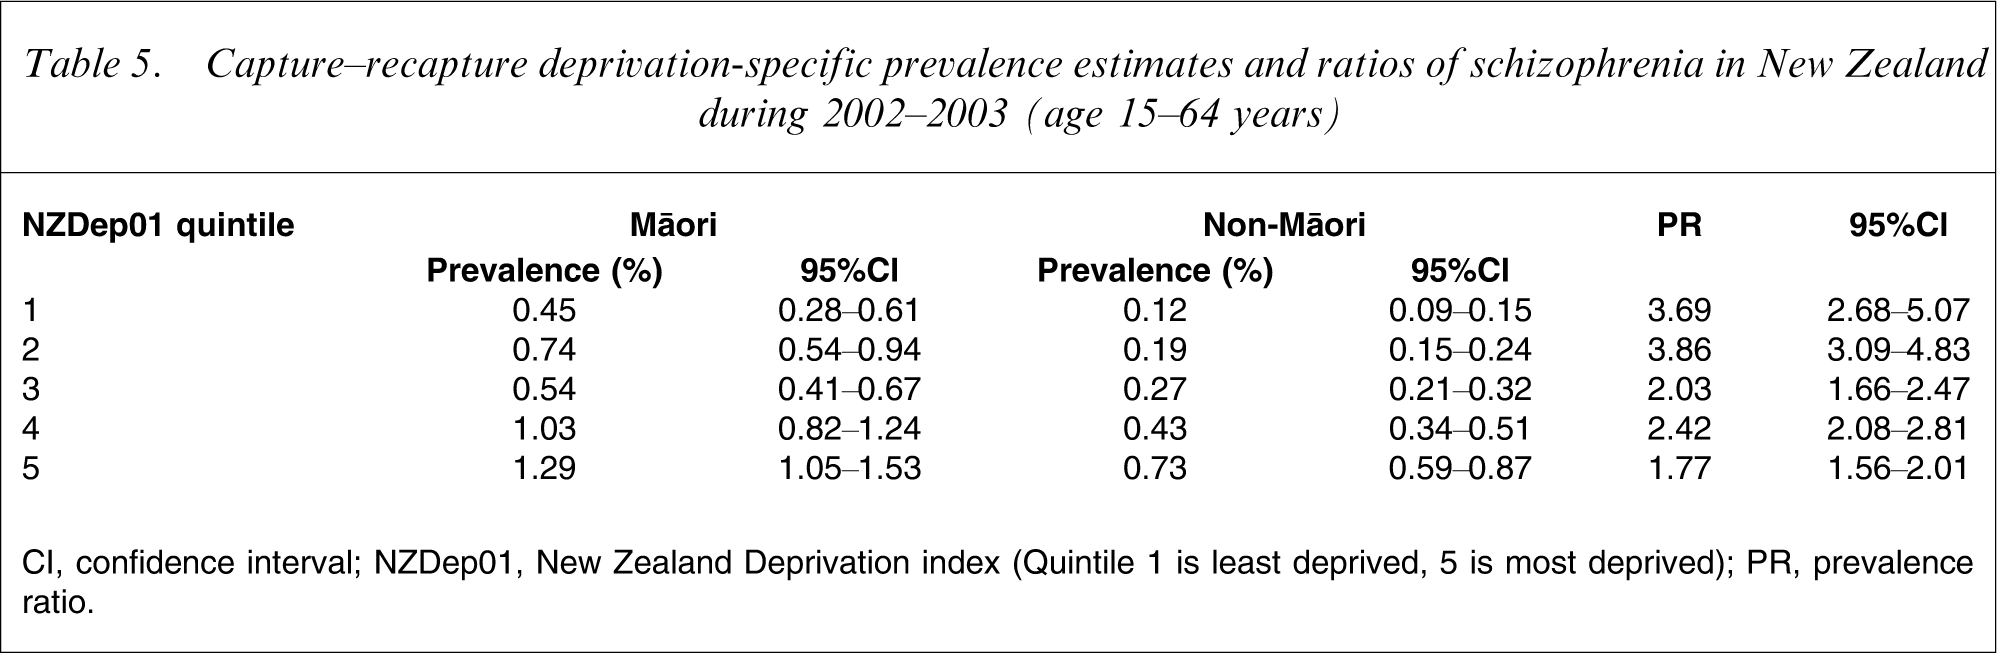
CI, confidence interval; NZDep01, New Zealand Deprivation index (Quintile 1 is least deprived, 5 is most deprived); PR, prevalence ratio.
Contact prevalence/diagnostic recording
The total capture–recapture prevalence estimates for both groups (Table 3) are much higher than those from the simple estimates shown in Table 1, and this remains even when records from MHINC and NMDS are combined. This is probably because service contacts in any given year are <100%. Based on our log-linear model for 2002–2003, we estimate that the annual contact prevalence for both ethnic groups ranged from 45% to 55%. It is important to note, however, that this contact prevalence is the ‘apparent contact prevalence’: individual cases not recorded as seen in a given year may include those who did not make contact with services, as well as those whose diagnosis of schizophrenia was not recorded when they did present. The capture–recapture method fully adjusts for both of these effects simultaneously, but not separately: that is, we cannot tell how much of the non-contact prevalence (45–55%) is due to diagnostic incompleteness and how much is true non-contact.
Discussion
Based on our capture–recapture analysis we estimate the 1 year prevalence (age-standardized) of schizophrenia for the Māori population to be approximately 1%, averaged over the present 3 year study period. This is approximately three times (PR 2.76–3.10) our estimate for non-Māori for this period (approx. 0.32%). Adjusting for socioeconomic deprivation reduced the prevalence estimates for Māori, but they remained more than twice (PR 2.18–2.50) that of non-Māori. The prevalence estimates for non-Māori are very similar to the pooled period estimates of 0.33% [3] and 0.34% [4] in two large international reviews, and the annual prevalence of 0.37% in the Australian Low Prevalence Study [22]. In contrast, the present estimates for Māori are between two- and three-fold these international estimates, and provide further evidence of significant variation in the prevalence of schizophrenia between population groups [3], [4].
We found that Māori men (1.27% in 2002–2003) had the highest prevalence estimates overall, followed by Māori women (0.70%); non-Māori men (0.41%); and lowest of all, non-Māori women (0.24%). This order persisted even after adjustment for socioeconomic deprivation. Men had higher estimates than women within both groups, and in similar ratios. This differs from the aforementioned reviews, which both found, overall, no gender difference for prevalence [3], [4]. Both found, however that there was significant variation between studies in male: female PRs and the present findings may simply reflect this variation.
Limitations
First, both data sources missed some individuals with schizophrenia, partly due to non-contact with services, but also because of incomplete diagnostic reporting in MHINC. This meant that the difference between ‘contact prevalence’ and ‘true population prevalence’ was substantial for both groups. We adjusted for this incompleteness, however, by way of a four-list capture–recapture procedure that simultaneously addressed these two sources of missing cases. In addition, we used multiple sources of diagnostic data to estimate the prevalence of schizophrenia in the Māori and non-Māori populations. Recent evidence suggests that use of multiple data sources maximizes the capacity of a study to estimate population prevalence [1].
Second, the likely violation of the closure assumption means that the present capture–recapture prevalence estimates are overestimates. If we assume, however, that the proportions of both populations replaced each year are ≤10%, then this overestimate is small and approximately 0.03% for non-Māori and 0.1% for Māori. It is also possible that these populations may differ in the proportions of replacements per year. If we assume that this difference is ≤5%, then the PR estimates will be over- or underestimated by no more than 5%. Therefore, the size of this potential effect is within the confidence intervals calculated for our prevalence estimates.
Third, we did not have mental health data from primary care services. It is possible that Māori access primary care services less than non-Māori, and our lower prevalence estimates for non-Māori may reflect our reliance on data from secondary services and hospitals. It is possible that women are more likely to be treated in primary care, because of less severe symptoms of schizophrenia than men. It would then follow that the higher prevalence estimates we observed among men reflects our use of secondary care and hospital databases; but because the capture–recapture method explicitly adjusts for variations in capture probability associated with gender and ethnicity to estimate prevalence, and because we accessed both hospital and community data, we consider it unlikely that the present ethnic or gender estimates are significantly biased because of this potential limitation.
Fourth, we found that Māori ethnicity was not accurately recorded in the mental health data. Therefore the present prevalence estimates may underestimate the true prevalence for this group. Our capture–recapture procedure cannot adjust for this potential bias, and the magnitude of the effect is unclear. The 2001 New Zealand census post-enumeration survey identified an undercount for Māori of 4.4%, and 1.7% for non-Māori, a differential undercount of 2.7% [23]. The census populations used in the present study have been adjusted for this undercount. A worst-case scenario of a 10% misclassification of Māori as non-Māori in the denominator would decrease the age-adjusted PR estimate to 2.70. A more likely scenario is numerator misclassification. Recent work has found misclassification of Māori at rates of 7–30% [17]. If 10% of cases among Māori are misclassified as non-Māori, then the PR increases to 3.49. A 30% misclassification would increase the PR to 4.60. Given recent attempts at data quality improvement in health and census data the numerator bias is likely to be the larger, and no more than 10%, in which case the present prevalence estimates and PRs are conservative underestimates.
Fifth, we relied on diagnostic data from service-based clinicians, which may be less reliable than data from structured diagnostic interviews completed by researchers. Our estimates, however, for both ethnic groups were stable over time, suggesting that service-based clinicians are relatively consistent in their diagnoses of schizophrenia in New Zealand, assuming that the true prevalence of schizophrenia did not change during the present study. Like most international studies of schizophrenia, the present study diagnoses were based on internationally accepted ICD-9/DSM-IV criteria.
Sixth, our range of measures was narrow because our choice of measures was restricted to those available in our routine data sources. This meant that we could not examine the contributions of important contextual factors (e.g. education, marital status, parental socioeconomic status) to the estimates for Māori. Although our area-based composite measure of deprivation provided a measure of socioeconomic context, a measure of individual circumstances may have demonstrated a greater contribution from socioeconomic factors to these estimates. This is a widely acknowledged limitation associated with using area-based socioeconomic measures and routine data [24]. Consistent with international studies, however, we found that the prevalence of schizophrenia increased as deprivation increased, and in both ethnic groups, which supports the validity of our findings [20].
Potential explanations
There is little research on Māori with schizophrenia. The Māori population, however, have been exposed over several generations to several adverse social factors (e.g. earlier cannabis use, lower socioeconomic status, racial discrimination, loss of cultural identity and social cohesion, internal migration) that have been identified as having aetiological significance for increased risk of schizophrenia [25]. The cumulative presence of such adverse social factors is consistent with a ‘social defeat’ explanation [26]. A series of recent studies [27–29] have challenged simplistic interpretations of the original World Health Organization study findings [30] on the epidemiology of schizophrenia and emphasized social support in the aetiology of the illness, irrespective of cultural group or level of national development.
Māori, especially adolescent Māori male, appear to have a higher prevalence of cannabis use than non-Māori [31]. A relationship between cannabis use in adolescence and increased risk of developing symptoms of schizophrenia has been established in New Zealand [32], but no Māori-specific findings were provided. A recent meta-analysis found that cannabis may play a significant role (PR = 2.7) in the development of schizophrenia [33]. It is thus plausible that higher cannabis use could partially explain the higher prevalence of schizophrenia found for Māori, although the contribution is likely to be small.
Historically, Māori have had consistently lower socioeconomic status than non-Māori, with unemployment approximately threefold that of the non-Māori in the decade prior to the present study [34]. We suggest that socioeconomic deprivation may partially explain the higher prevalence for Māori, but we found that estimates for Māori and non-Māori were not uniformly affected by increasing levels of deprivation, suggesting that other factors associated with Māori ethnicity may contribute to the higher prevalence of schizophrenia in this group.
To date no studies have investigated the contribution of racial discrimination, social cohesion, and migration to the prevalence of schizophrenia in the Māori population. A recent large sample survey, however, found that Māori in general were almost 10-fold more likely to report experiences of racial discrimination than European non-Māori [35]. Studies of hospital admissions suggest that the prevalence of schizophrenia for Māori may have been similar to non-Māori in the 1930s but increased following their migration from rural tribal regions to European-dominated cities [12], [36]. Such findings are more consistent with sociocultural, and/or rural–urban explanations [37] than genetic explanations.
It is possible that the higher prevalence estimates of schizophrenia we found for Māori might be due to a longer duration of illness. Thus Māori could have a similar incidence of schizophrenia to non-Māori, but a more severe or less responsive unremitting illness, perhaps due to greater exposure to adverse social factors or poorer engagement with or responsivity from mental health services. This could lead to an accumulation of Māori cases, which could explain the higher prevalence estimates found for this group. Evidence from historical first admissions data, however, albeit to limitations in quality, suggests that the incidence of schizophrenia among Māori is significantly higher than for non-Māori. Thus given the relationship between these parameters (i.e. prevalence = incidence×duration of illness) this explanation does not appear plausible.
The potential for cross-cultural misunderstandings and/or racist attitudes systematically influencing the diagnostic process has led to the hypothesis that higher rates of schizophrenia in ethnic minorities could be due to misdiagnosis [25]. We know of no equivalent New Zealand research. Most clinicians who make such diagnoses in New Zealand, however, are non-Māori, so the possibility remains that misdiagnosis might contribute to the higher prevalence of schizophrenia we found for Māori.
Significance and future research
The present study is the first to provide estimates of the 12 month prevalence of schizophrenia in the Māori population of New Zealand, and provides an important evidence base for planning services for Māori with this illness. Further research into the accuracy of diagnosis of schizophrenia in this group, recording of ethnicity data, and the contribution of adverse social factors is required. These findings contribute to the accumulating evidence that the prevalence of this illness varies significantly between populations [3], [4]. As far as we are aware, the present study is the first to use the capture–recapture procedure to estimate the population prevalence of schizophrenia, and makes an important practical contribution to current techniques for investigating the epidemiology of this illness.
Footnotes
Acknowledgements
This study was funded by a grant from the Mental Health Research and Development Strategy, Ministry of Health, New Zealand.