
Abstract
Quantification of premorbid intellectual functioning is essential in schizophrenia research because patients frequently show neuropsychological decline following the onset of their illness. Premorbid intelligence is typically estimated using various methods, such as the best performance score or two verbal subtests from the Wechsler Adult Intelligence Scale–Revised (WAIS-R) or WAIS-III [1]. Yet another method is based on the assessment of reading abilities. It is argued that the ability to accurately pronounce irregularly spelled words correlates significantly with crystallized intelligence, that is, this ability reflects premorbid, rather than current, intelligence [2]. One of the most widely used reading tests is the National Adult Reading Test (NART) [3], [4]. The NART is considered the gold standard for estimating premorbid IQ in schizophrenia because of its widespread use, brevity and demonstrated reliability in English language speakers [3], [5], [6]. There are occasions, however, when the aforementioned procedures cannot be used, for example in the presence of dyslexia, dysarthria, visual acuity deficits, English as second language, or performance anxiety. Alternatively, estimations of premorbid IQ can be obtained using demographic variables such as education, occupation and age, because these are known to contribute significantly to variance in IQ values. Equations such as that developed by Crawford and Allan [7] provide weights for these variables and the resulting estimates have been found to correlate well with scores on intelligence tests in healthy populations. But equations developed using healthy people may not be suitable for estimating premorbid IQ in schizophrenia, because the illness affects patients’ ability to attain their educational and occupational potential. In the current study we developed a demographically based equation for predicting NART measures of premorbid intelligence, using a large sample of patients with schizophrenia, and compared the accuracy of this new equation for predicting NART scores on a second, independent, schizophrenia sample with predicted scores from the Crawford and Allan equation.
Methods
The study sample consisted of patients recruited for the Western Australian Family Study of Schizophrenia [8], [9]. The patient group included 241 individuals (50 female) aged 17–69 years who met both ICD-10 and DSM-IV criteria for a lifetime diagnosis of schizophrenia disorder and had been recruited from consecutive admissions to a psychiatric hospital. Patients with comorbid organic brain disease or substance abuse disorder that could account for the psychotic symptoms, or with language difficulties, were excluded. Written informed consent was obtained from all participants. The Committee of Human Rights of the University of Western Australia and the North Metropolitan Health Area Ethics Committee (Perth, Western Australia) approved the study.
Premorbid IQ was estimated using the revised NART [4], with scores being converted to WAIS-R Full-Scale, Verbal, and Performance IQ (FSIQ, VIQ, PIQ) [4]. A measure of behavioural lateralization was also included because studies have shown lateralization effects on cognitive functioning in schizophrenia [10], [11]. Lateralization of behavioural preferences was assessed using the Edinburgh Handedness Inventory [12]. Laterality quotients (LQ), computed using the standard expression, LQ=(R − L)/(R + L)×100, ranged from −100 (left-handedness) to +100 (right-handedness).
Using Australian and New Zealand Standard Classification of Occupations (1st edn) [13], each participant's highest-ever-achieved occupation was classified into one of the five broadly defined categories: 1 = professional, 2 = intermediate, 3 = skilled, 4 = semi-skilled and 5 = unskilled, which is comparable to the UK five-level social stratification used in the Crawford and Allan study [7]. Also consistent with that study, participants who never worked were classified as unskilled, and unemployed participants were coded by their prior occupation. UK and Australian national classifications of occupations are similar, which enables a direct comparison with the outcome of the Crawford and Allan study [7].
Statistical methods
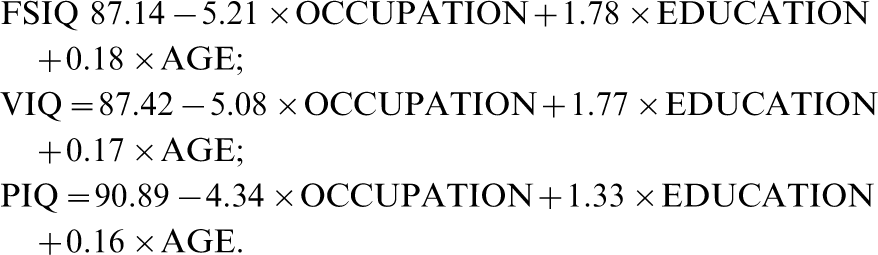
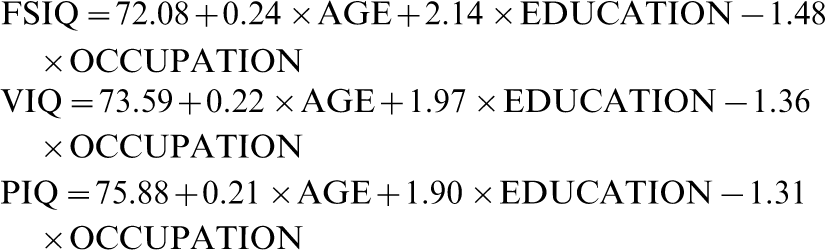
The data were analysed using STATISTICA 7.1 (StatSoft, OK, USA). Using the simple random sample algorithm available in this package, we randomly split our sample into two subgroups (sample A, n = 120; sample B, n = 121), so that we could develop the regression equation in one sample and test its validity in another. The regression equation was developed in sample A using forward stepwise multiple regression assessing the power of the following five variables: age, gender, years of education, occupation, and handedness LQ, in predicting the obtained NART scores. When nominal variables were considered, group differences were examined using χ2 test. Using general linear models, we then compared NART estimates derived from the new regression equation and NART estimates from the Crawford and Allan equation, with the actual sample B NART scores. The Crawford and Allan regression equations are as follows:
Results
The demographic characteristics of the study sample are presented in Table 1 together with the Crawford and Allan sample for comparison. Laterality measures were available for the present sample only. There were statistically significant differences between the two samples on the demographic variables, but there were no significant differences on any measures between sample A and sample B. Occupational variables were not available for the Crawford and Allen sample, but a comparison of the occupational levels distribution for the present patient sample compared to the adult Australian population [14] shows that the patient group was underrepresented in higher, and overrepresented in lower, occupational levels (χ2=38.5, df = 4, p < 0.001), consistent with the sociodemographic features of this psychiatric population.
Demographic variables
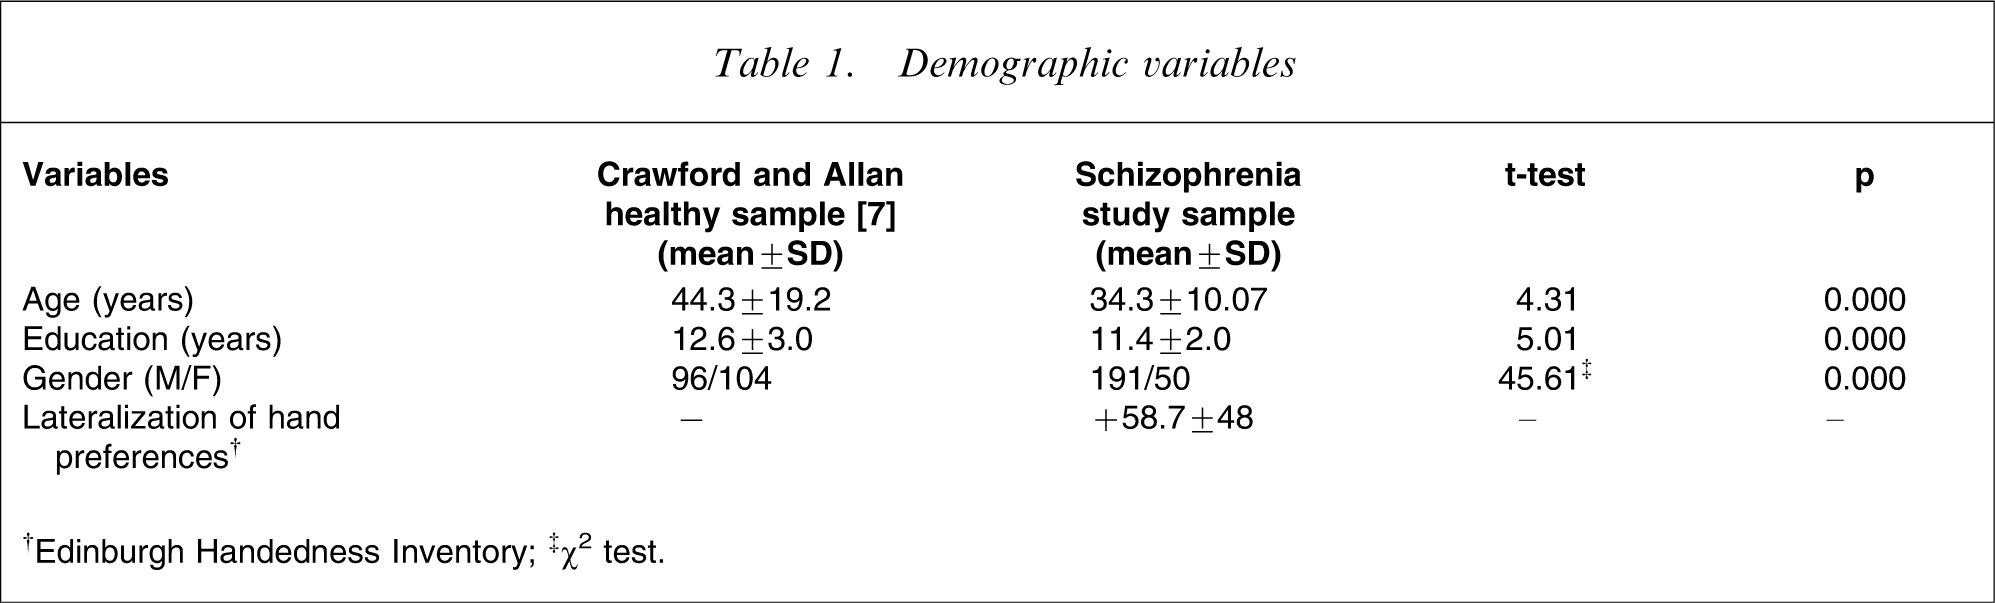
†Edinburgh Handedness Inventory.
‡χ2 test.
A forward stepwise multiple regression analysis in Sample A showed that laterality measures (p = 0.95) and gender (p = 0.20) provided only marginal contributions to the estimation of the dependent measure (e.g. R2 change with adding gender as predictor was negligible, 0.04; and with adding laterality measure almost absent, 0.00), therefore they were dropped from the final regression analyses. The multiple regression correlation of R = 0.579 was significantly different from zero (F(3,116)=19.49), p < 0.001) and the FSIQ estimate was significantly predicted by three out of five predictors entered into the regression: age, years of education, and occupation level. Table 2 shows the correlation between the variables, standardized beta coefficients, the semi-partial correlations (unique sr2), R2 and adjusted R2. The standard error of the estimate was 8.68 for FSIQ. VIQ and PIQ were omitted from the table for simplicity, their results being very similar to FSIQ.
Bivariate correlations and multiple linear regression for patient sample A (n = 120)
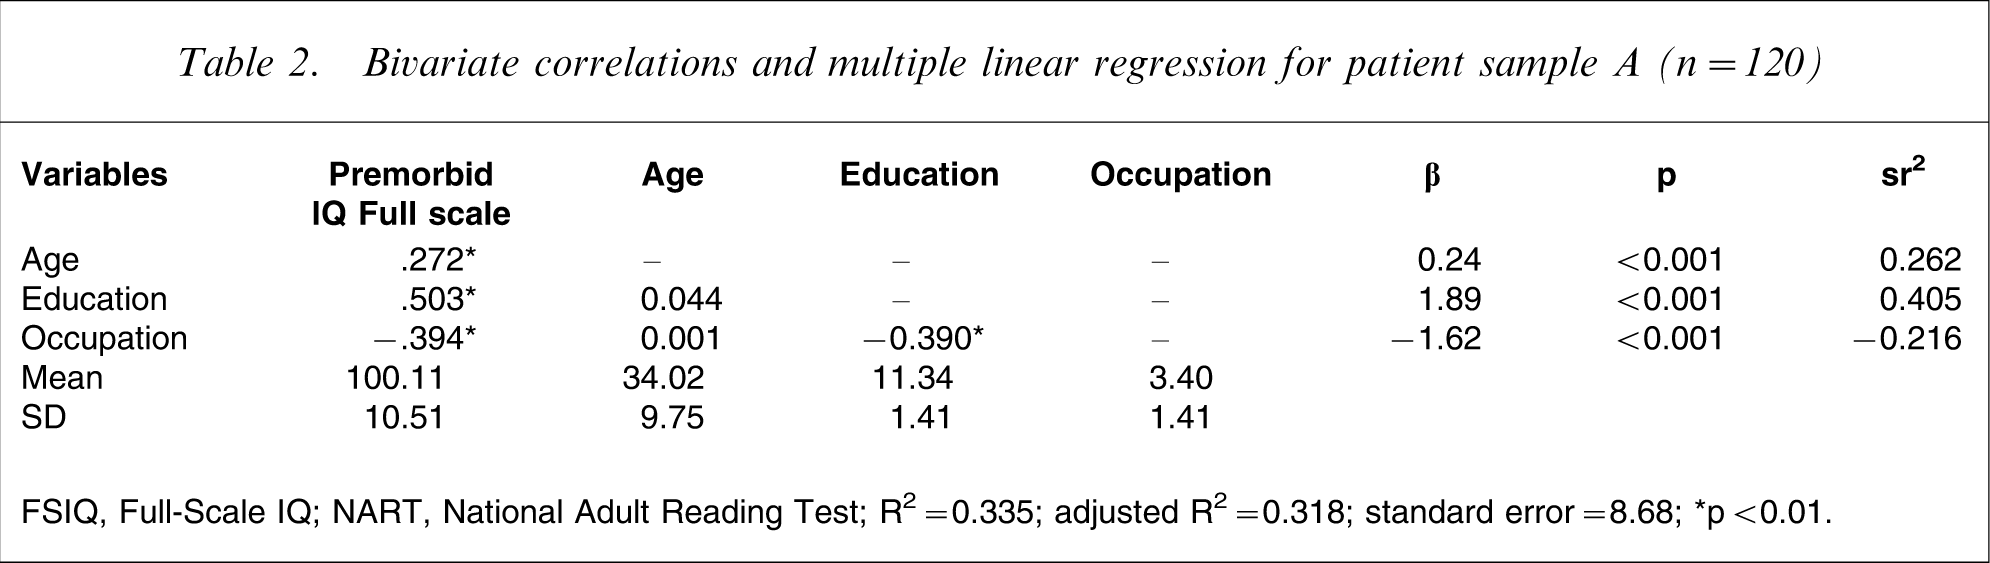
FSIQ, Full-Scale IQ; NART, National Adult Reading Test.
R2=0.335; adjusted R2=0.318; standard error = 8.68.
∗p < 0.01.
To compare the accuracy of the new regression equations with those developed by Crawford and Allan, we calculated predicted scores for each equation, and then compared these with the NART scores obtained from sample B patients. Table 3 presents statistics for predicted and obtained NART scores, and shows that our new equation predicted accurately the NART scores in the independent patient sample. Predicted NART scores had less variability than the obtained NART scores. By contrast, the Crawford and Allan equation produced significantly lower scores for each IQ estimate.
Comparison of mean scores in sample B (n = 121)
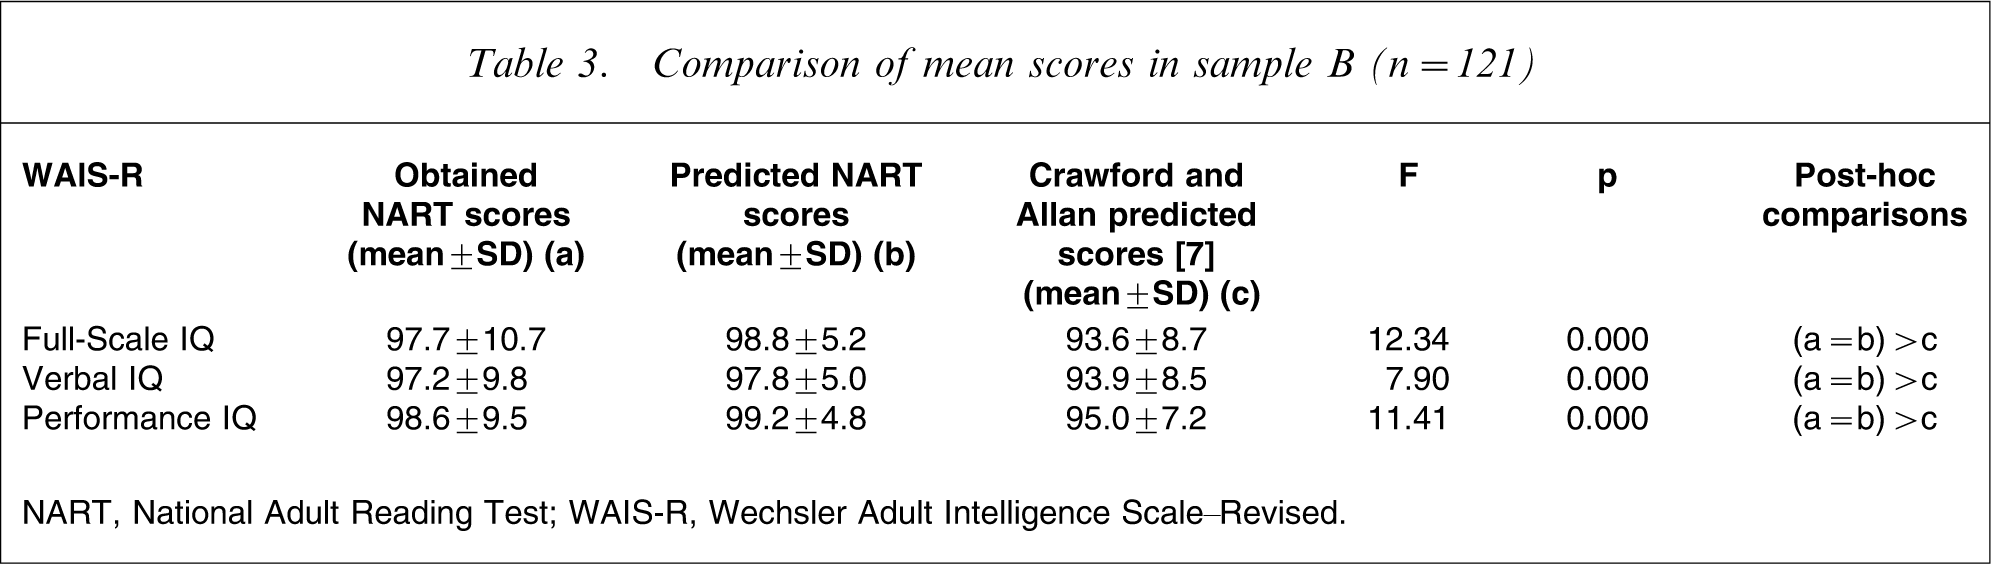
NART, National Adult Reading Test; WAIS-R, Wechsler Adult Intelligence Scale–Revised.
Figure 1 presents a scatterplot of sample B-obtained NART FSIQ scores, against the predicted NART estimates calculated using our equation, and that using the Crawford and Allan equation. Apart from a small numbers of outliers, our distribution consisted of a tight and compact spread of scores. In contrast, the Crawford and Allan equation resulted in a broader distribution across the whole range of estimates. In the majority of cases the Crawford and Allen equation did not accurately predict NART scores, particularly underestimating premorbid intelligence in cases of average-to-high estimated IQ.
Scatter plot of National Adult Reading Test (NART) scores (Full-Scale IQ, FSIQ) estimates) in sample B. ○, cases where the Crawford and Allen equation tended to underestimate premordid intelligence.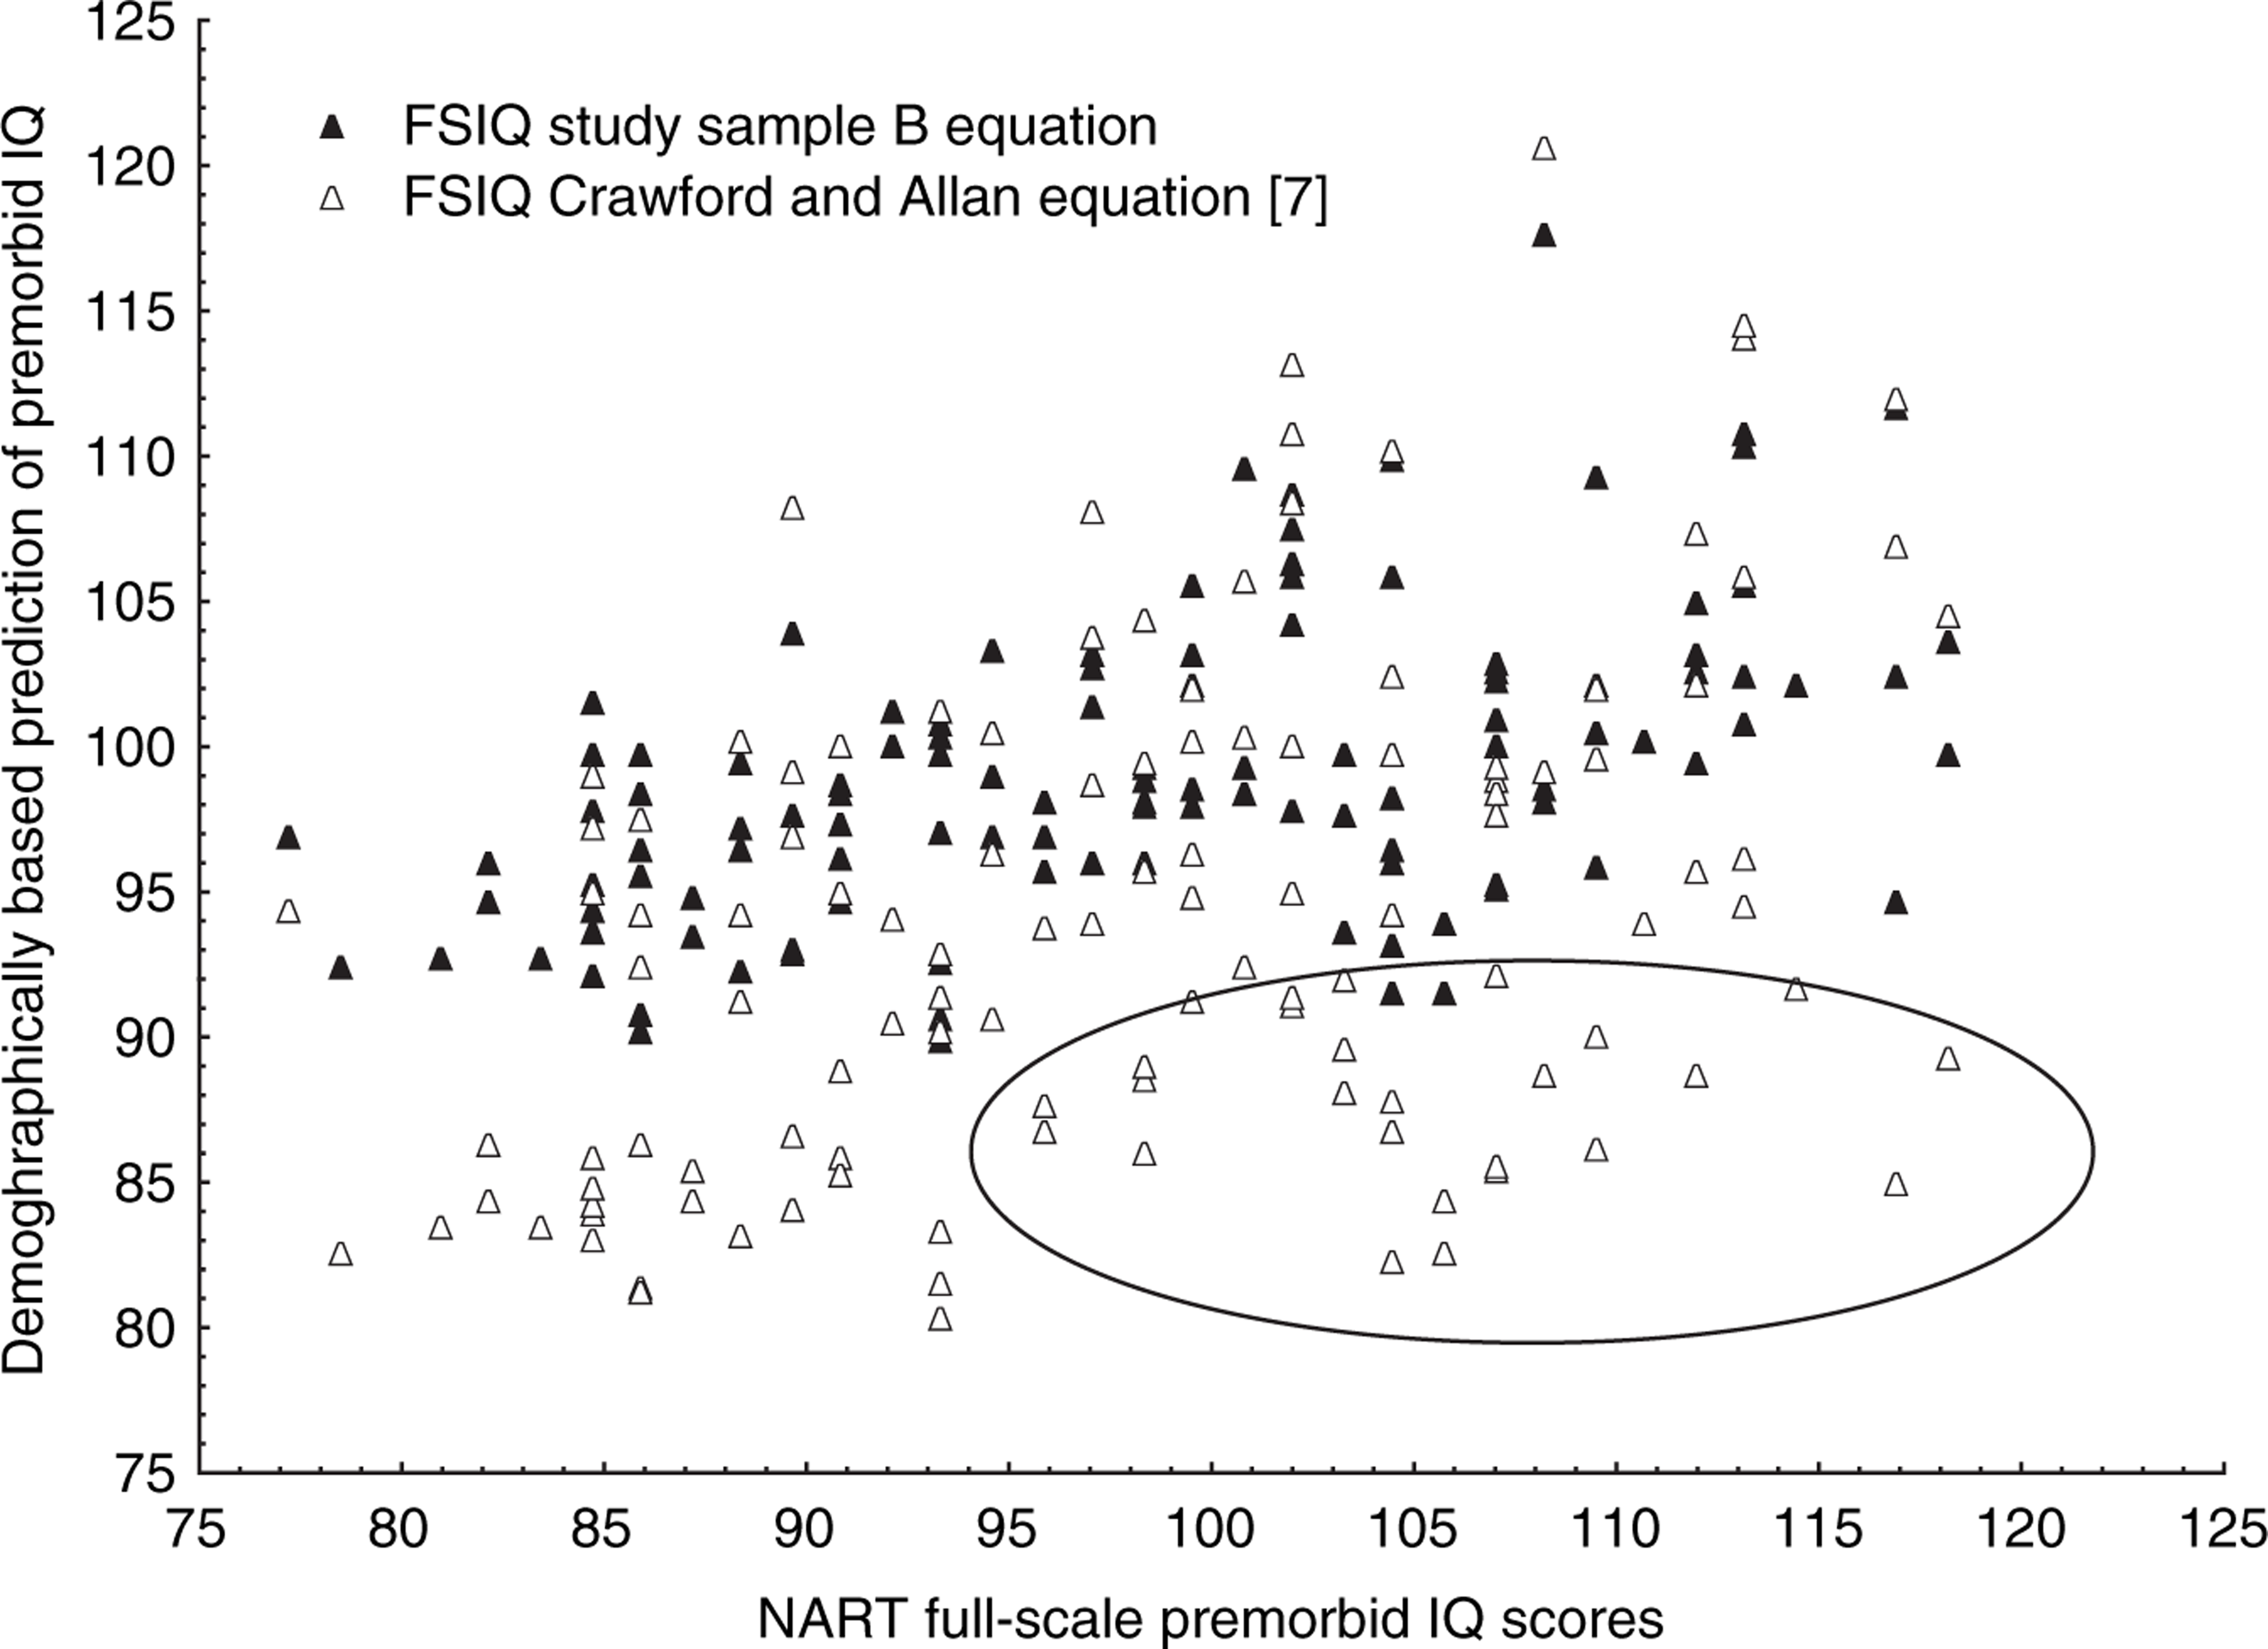
The regression equations for predicting NART scores in schizophrenia are based on the total sample size and are as follows:
A simple software application that calculates premorbid NART scores for individual schizophrenia cases is available for free at http://www.health.wa.gov.au/ccrn.
Discussion
Demographically based equations have a long history and widespread utility as part of neuropsychological assessments of acquired cerebral dysfunction. They are frequently used in clinical practice and occasionally in research [5], [15], [16], because they are considered to provide reliable estimates of premorbid IQ, and correlate highly with measures of intelligence in healthy populations. But demographically based equations are less frequently used in schizophrenia research, possibly because they have been developed using healthy populations and therefore are thought to have limited validity in this clinical group. In developed countries, healthy people generally tend to achieve an occupational and educational level that is commensurate with their intellectual potential. Accordingly, occupation and years of education are a reliable index of their IQ level. The development of schizophrenia, however, often starts in adolescence or during early adulthood, with dire consequences on school completion and reduced employment opportunities. As a result, regression equations based on the educational and occupational features of healthy samples tend to underestimate the patients’ actual premorbid intelligence as reflected in the NART scores. The present results demonstrate that regression equations developed using healthy people [7] are not suitable for accurately estimating premorbid IQ in this psychiatric population, producing consistently and significantly lower IQ estimates for FSIQ, VIQ and PIQ.
We produced a new equation by recalibrating the regression weights to take into account the typical demographic features of the patient population. This equation, developed first in a test patient sample, predicted accurately the NART scores obtained in a second, independent sample, with estimates within 1 IQ point for each FSIQ, VIQ and PIQ. These predictions are necessarily subject to some error, because the effect of the illness on intelligence trajectory is an unknown quantity. For example, the present results showed that there is only 30% shared variance between obtained NART scores and demographically based equations, indicating that 70% of variance in the obtained NART scores still remains unaccounted for by demographic variables alone. Somewhat reduced variability of the predicted NART scores indicates also that predictions for subjects with high and, in particular, with low IQ are expected to be less accurate. One possible contributing factor to the lack of prediction precision for subjects with low IQ is the floor effect in years of education. There is a minimum of 7 years of education, which restricts the range of predicted scores that can be calculated using demographic equations. This suggests that demographically based equations should be used cautiously in clinical and research settings. In healthy people also, studies have shown that psychological testing is a more precise and unbiased estimate relative to demographically based variables that have a large range of errors, particularly at the lower and upper end of the distribution [17]. The use of equations, however, is superior to clinical judgement because of the absence of subjective and biased opinions. Furthermore, while performance on intelligence tests is affected by acquired brain lesions, demographic equations remain unaffected [18]. A strength of the present study is the cross-validation of our equation on a separate patient sample; but independent tests of the present equations are encouraged to assess their predictive accuracy in different settings and patient samples.
In conclusion, we have developed a demographically based equation, taking into account the educational and occupational characteristics typical of clinical populations with schizophrenia, that can be used as a rapid estimate of premorbid intelligence when it is not possible to conduct a cognitive assessment using more traditional approaches, or when time is a factor.
Footnotes
Acknowledgements
FW is recipient of an Australian National Health and Medical Research Council Research Training Fellowship (PT) (ID: 404117).