
Abstract
Over the last decade, research into the quality of life has gained widespread interest. Some researchers focused on the objective component of quality of life, which involved the study of factors external to the individual such as income and health status [1]. Other researchers emphasized that quality of life is a subjective assessment of individual satisfaction with life [2], [3]. The latter concept is also known as ‘subjective well-being’. Health-related questionnaires have been widely utilized to examine subjective well-being [4–6].
The Short-Form Health Survey (SF-12) is one of such questionnaires [7], [8]. The SF-12 was adapted from the SF-36 developed for the Medical Outcomes Study to survey health status [9]. The SF-12 is a multipurpose short-form generic measure of health status that measures eight concepts: physical functioning, role limitations due to physical health problems, bodily pain, general health, vitality, social functioning, role limitation due to emotional problems, and mental health [8]. From these eight concepts two distinct component scores are derived: the physical component score and the mental component score [8].
The Kessler-10 questionnaire assesses global measures of non-specific psychological distress [10]. It was designed to function as a general purpose mental health survey [11]. The Kessler-10 has previously been utilized in a large number of surveys [10–13] and in the 1997 Australian Survey of Mental Health and Well-being study. Other assessments such as the Satisfaction with Life Scale (SWLS) [2] has also been widely utilized to measure quality of life [14], [15]. The SWLS is a multi-item scale that measures global life satisfaction by tapping into the individual's cognitive judgement process [15]. This judgement of how satisfied people are with their life ‘is based on a comparison with a standard that each individual sets for him or herself; it is not externally imposed’ [15].
The aforementioned questionnaires (SF-36, SF-12, Kessler-10 and SWLS) have been said to have adequate validity and reliability [3], [7], [10], [16], but there has been much debate over the method of scoring the SF-36 and its derivative, the SF-12 [6], [17], [18]. The scoring method of both the SF-36 and SF-12, physical and mental component scores were derived utilizing principal component analysis and orthogonal rotation, which produced factor score coefficients. These coefficients (some which are negatively weighted) are then used to compute the physical and mental component scores. This approach assumes that physical and mental health dimensions are uncorrelated [8], [19].
When the standard scoring method is used for the SF-36 and SF-12, isolated improvements in the SF-36 subscales, which contribute to the physical component score, produced worsening overall mental health (lower scores on the mental health component) and vice versa [6]. Treatment leading to large reduction in psychological distress and modest reduction in physical limitation would also produce a score pattern of no apparent change in the physical component summary score [6].
These findings were confirmed by another study in which participants who were taking physical health medication yielded a higher mental health component score and those on mental health medication yielded a higher physical component score [20]. Other research have also highlighted similar problems related to the scoring techniques used in the SF-36 [18], [21].
As an alternative to the SF-36 and SF-12 scoring system, the RAND-36 and RAND-12 Health Status Inventory scoring system was developed [22].
The RAND-36 is an exact replica of the SF-36 and the RAND-12 is an exact replica of the SF-12, but the physical and mental component scores are produced utilizing different scoring algorithms/techniques. The scoring system of the RAND-36 and RAND-12 uses a non-orthogonal rotation or oblique rotation that assumes correlation between the physical and mental health component scores [22]. Differences of results when utilizing the different scoring techniques have been shown in studies examining a sample with physical illnesses [17], [18] and a study examining community survey of mental health [23].
In the present paper we explore the consequences of using the SF-12 and the RAND-12 for estimation of associations between its component scores against levels of well-being and psychological distress.
Methods
Participants and procedures
A survey utilizing stratified random sampling of persons from the year 2000 State Electoral Role was undertaken by the Gippsland Research and Information Services (GRIS), a section with expertise in health surveys within Monash University Gippsland Campus. Introductory letter and questionnaire was mailed out to 23 000 residents in the Gippsland area in late July 2002. Follow-up letters were sent out in mid-August. In November 2002 5641 questionnaires were returned, yielding a response rate of 25%. Ethics approval was granted by the Monash University Standing Committee on Ethics in Research Involving Humans.
Measures
Gippsland community mental health survey
The Gippsland Community Mental Health Survey (GCMH) contains sociodemographic items and questions assessing life satisfaction, psychological distress, mental and physical disability. Explanations of research variables relevant to this study are provided here.
Satisfaction with life scale
The SWLS has seven items scored on a 7-point Likert scale (score anchors of ‘strongly disagree’ through to ‘strongly agree’), which measures global judgement of life satisfaction [2]. Final SWLS score ranged from 5 (low satisfaction) to 35 (high satisfaction) [2]. The scores are classified as follows: 5–9 = extremely dissatisfied, 10–14 = dissatisfied, 15–19 = slightly dissatisfied, 20 = the neutral point, 21–25 = slightly satisfied, 26–30 = satisfied and 31–35 = extremely satisfied [3]. In the present sample the scale had an internal reliability of α = 0.90. Nunnaly and Bernstein indicated 0.7 to be an acceptable reliability [24].
Kessler psychological distress scale
The Kessler-10 has 10 items, each scored on a 4-point Likert scale, which assess populations on psychological distress, specifically anxiety and depressive disorders [10]. To enable comparability the scale was modified to reflect the now commonly used 5-point Likert scale with anchors of ‘all of the time’, ‘most of the time’, ‘some of the time’, ‘a little of the time’ and ‘none of the time’. Score classifications developed by Clinical Research Unit for Anxiety and Depression (CRUFAD) were utilized, whereby scores under 20 indicate that a person is likely to be well, 20–24, likely to have a mild mental disorder, 25–29, a moderate mental disorder, and 30–50, a severe mental disorder [25]. This scale had an acceptable internal reliability of α = 0.90 [24] in the present sample.
Short Form Health Survey
The SF-12 contains 12 items that produce two component scores [7]: Physical Component Score (PCS) and Mental Component Score (MCS), utilized to assess physical and mental health of participants [8]. The component scores are produced via computation involving negative coefficient weights and orthogonal rotation, which assumes no correlation between the physical and the mental health component [8].
RAND-12 health status inventory
The RAND-12 contains 12 items that are identical to the SF-12; it also produces two component scores: Physical Health Component (PHC) and Mental Health Component (MHC) [22]. The component scores are constructed from an oblique factor solution, which assumes correlation between the physical and mental health component scores [22].
Score classifications developed by CRUFAD were utilized for both the SF-12 and the RAND-12. Scores above 50 indicate that a person is likely to be well, scores of 40–49, likely to have a mild disability, 30–39, a moderate disability, and scores below 30, severe disability [25].
Statistical analysis
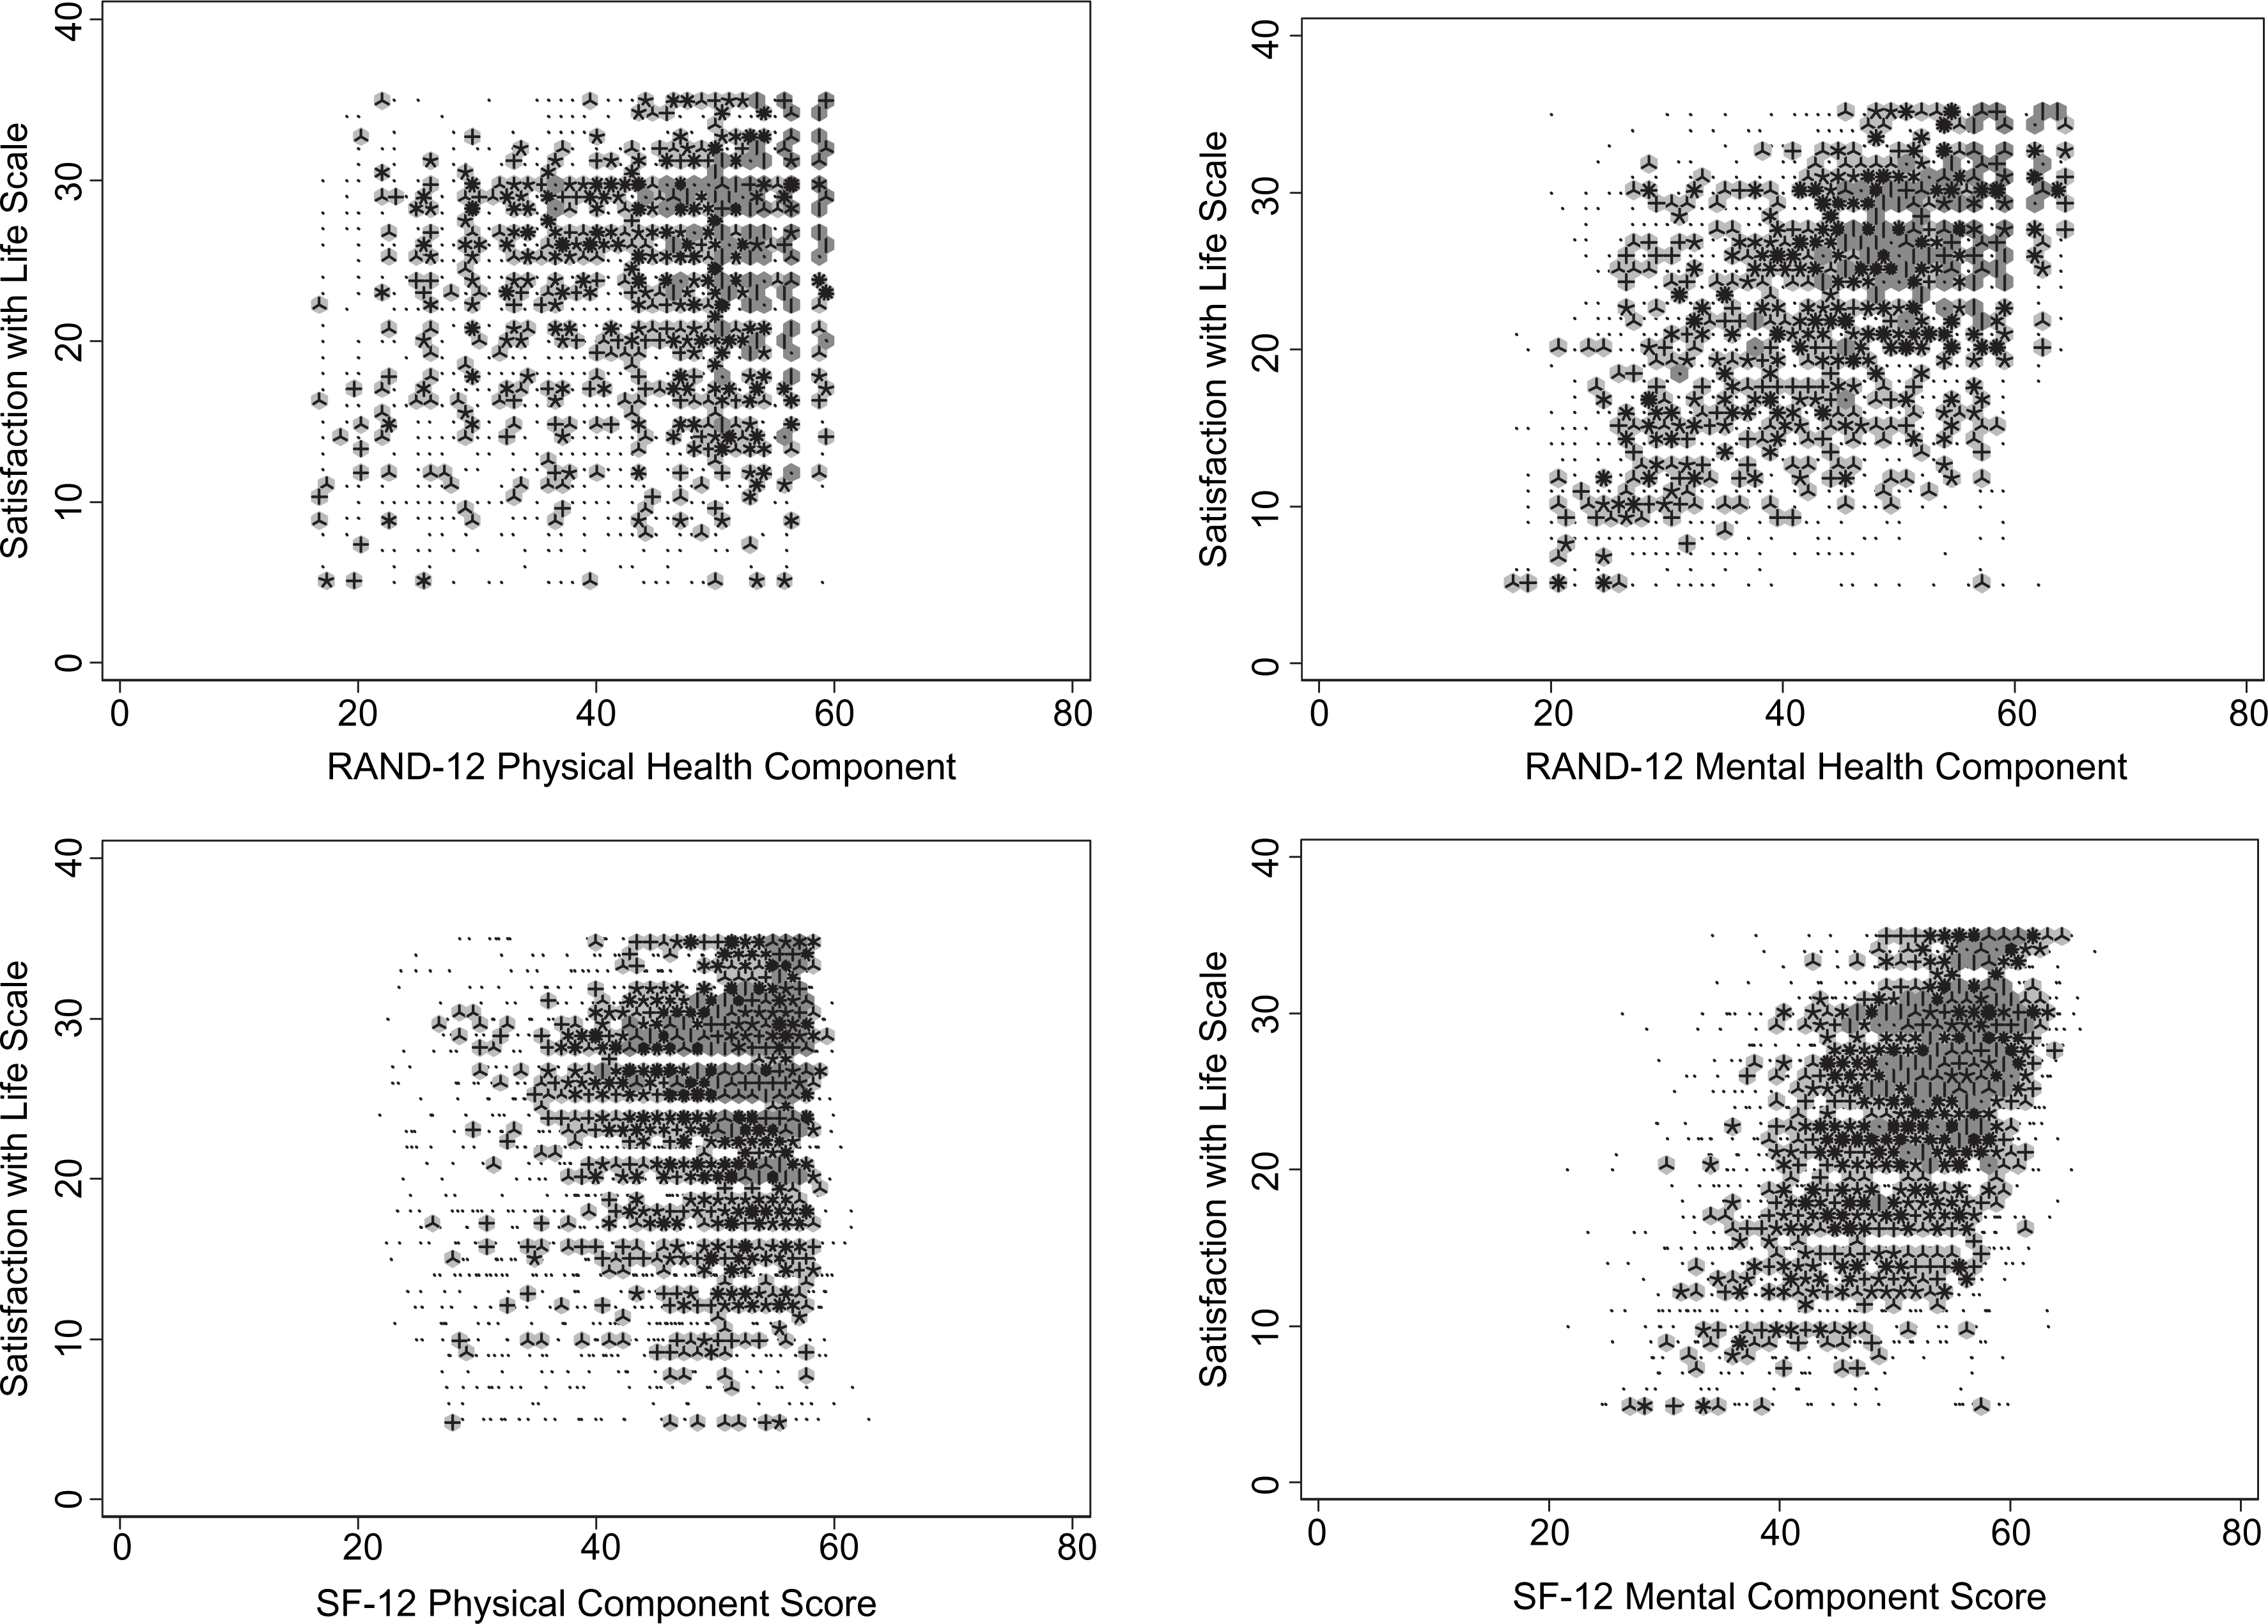
We compared the distributions of the physical and mental component scores based on the two scoring methods (SF-12 and RAND-12) using descriptive graphical methods, which included histograms and density–distribution sunflower plots [26]. The latter are modifications of the traditional scatterplot that allow for the display of bivariate data with areas of high density. ‘Sunflowers’ represent areas of medium- or high-density regions in the graph, while ‘petals’ are line segments of equal length radiating from the central point [26]. Light sunflowers represent areas of medium density and each petal represents one observation. High-density regions are represented by dark sunflowers and each petal represents several observations.
We applied locally weighted regression techniques (locally weighted scatterplot smoothing or LOWESS) [27] to explore the general relationships of well-being and psychological distress scores against SF-12 and RAND-12 component scores. LOWESS provides a graphical representation of non-linear relationships between bivariate data utilizing an iterative process based on weighted least-square regression [27].
We then estimated the quantitative relationship between categorical outcomes of well-being and psychological distress against levels of disability based on SF-12 and RAND-12 component scores, while adjusting for potential putative confounders using a proportional odds model.
We excluded participants with missing information in any of the measures of well-being and in the potential confounding variables (age, gender, living circumstances, education and employment status). Where possible, we present point estimates and 95% confidence intervals. All statistical tests were implemented in Stata/SE 10.0 (College Station, Texas, USA). All p were two-sided and p < 0.05 was defined as statistically significant.
Results
Descriptive statistics
Descriptive characteristics of the participants are presented in Table 1. Approximately two-thirds were female, approximately half were older than 35 years and 58% were in full- or part-time employment (including students). Approximately three-quarters of the subjects expressed satisfaction with life (Table 2), and approximately 80% did not report any symptoms based on the Kessler-10.
Subject characteristics
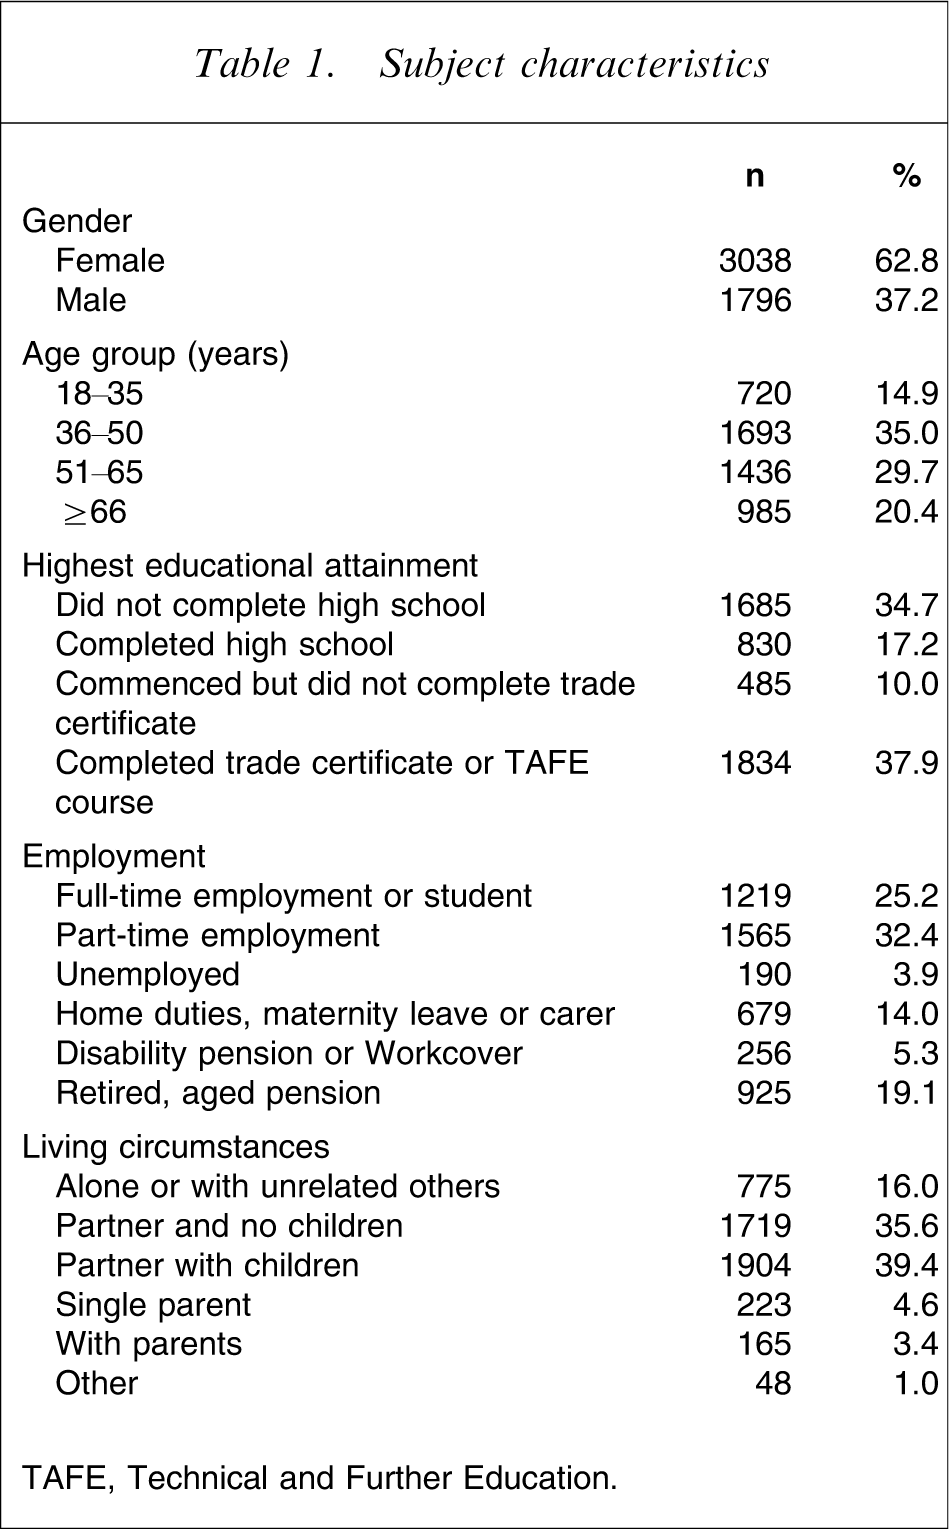
TAFE, Technical Further Educational.
Subject mood and well-being characteristics
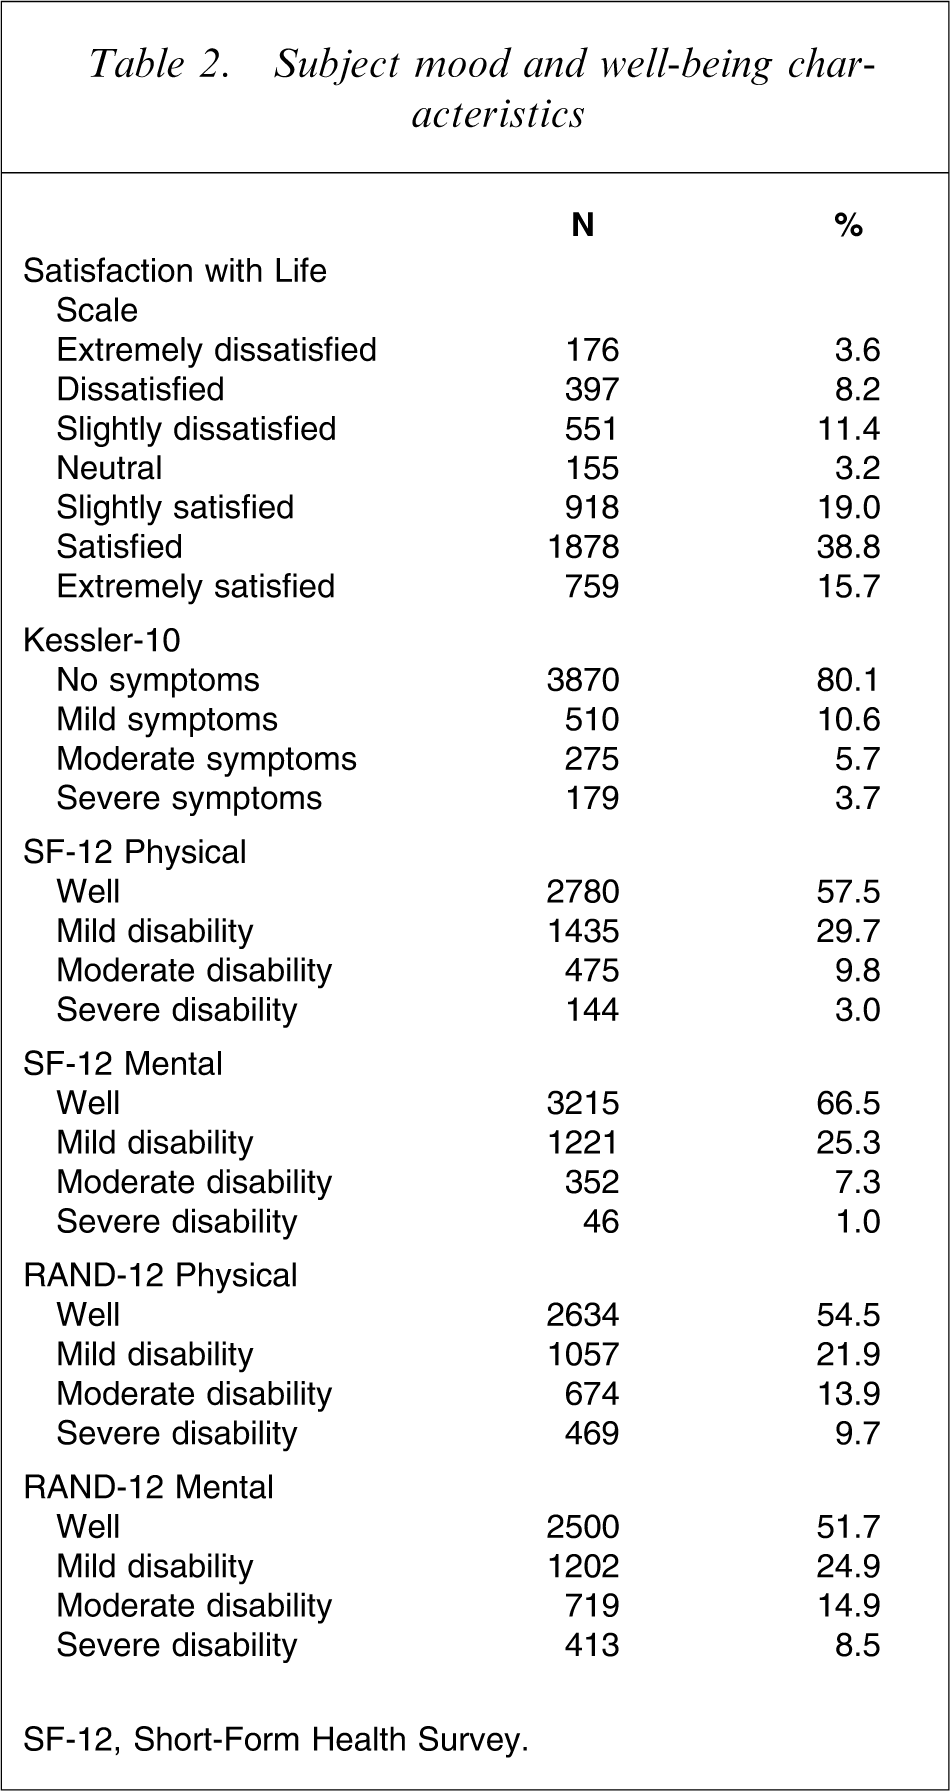
SF-12, Short-Form Health Survey.
Differences between RAND-12 and SF-12 scoring systems
The distributions of SF-12 and RAND-12 component scores in Figure 1, illustrated a wider spread of scores and greater ‘peaked-ness’ under the RAND-12 method. Although the median scores (at approximately 50) were virtually similar regardless of scoring system, longer negative tails of the distributions based on the RAND-12 method demonstrated that a larger proportion of participants were classified as having moderate and severe disability compared to the SF-12 scoring method (Table 2).
Differences in distribution between physical and mental component scores of the Short-Form Health Survey (SF-12) and RAND-12.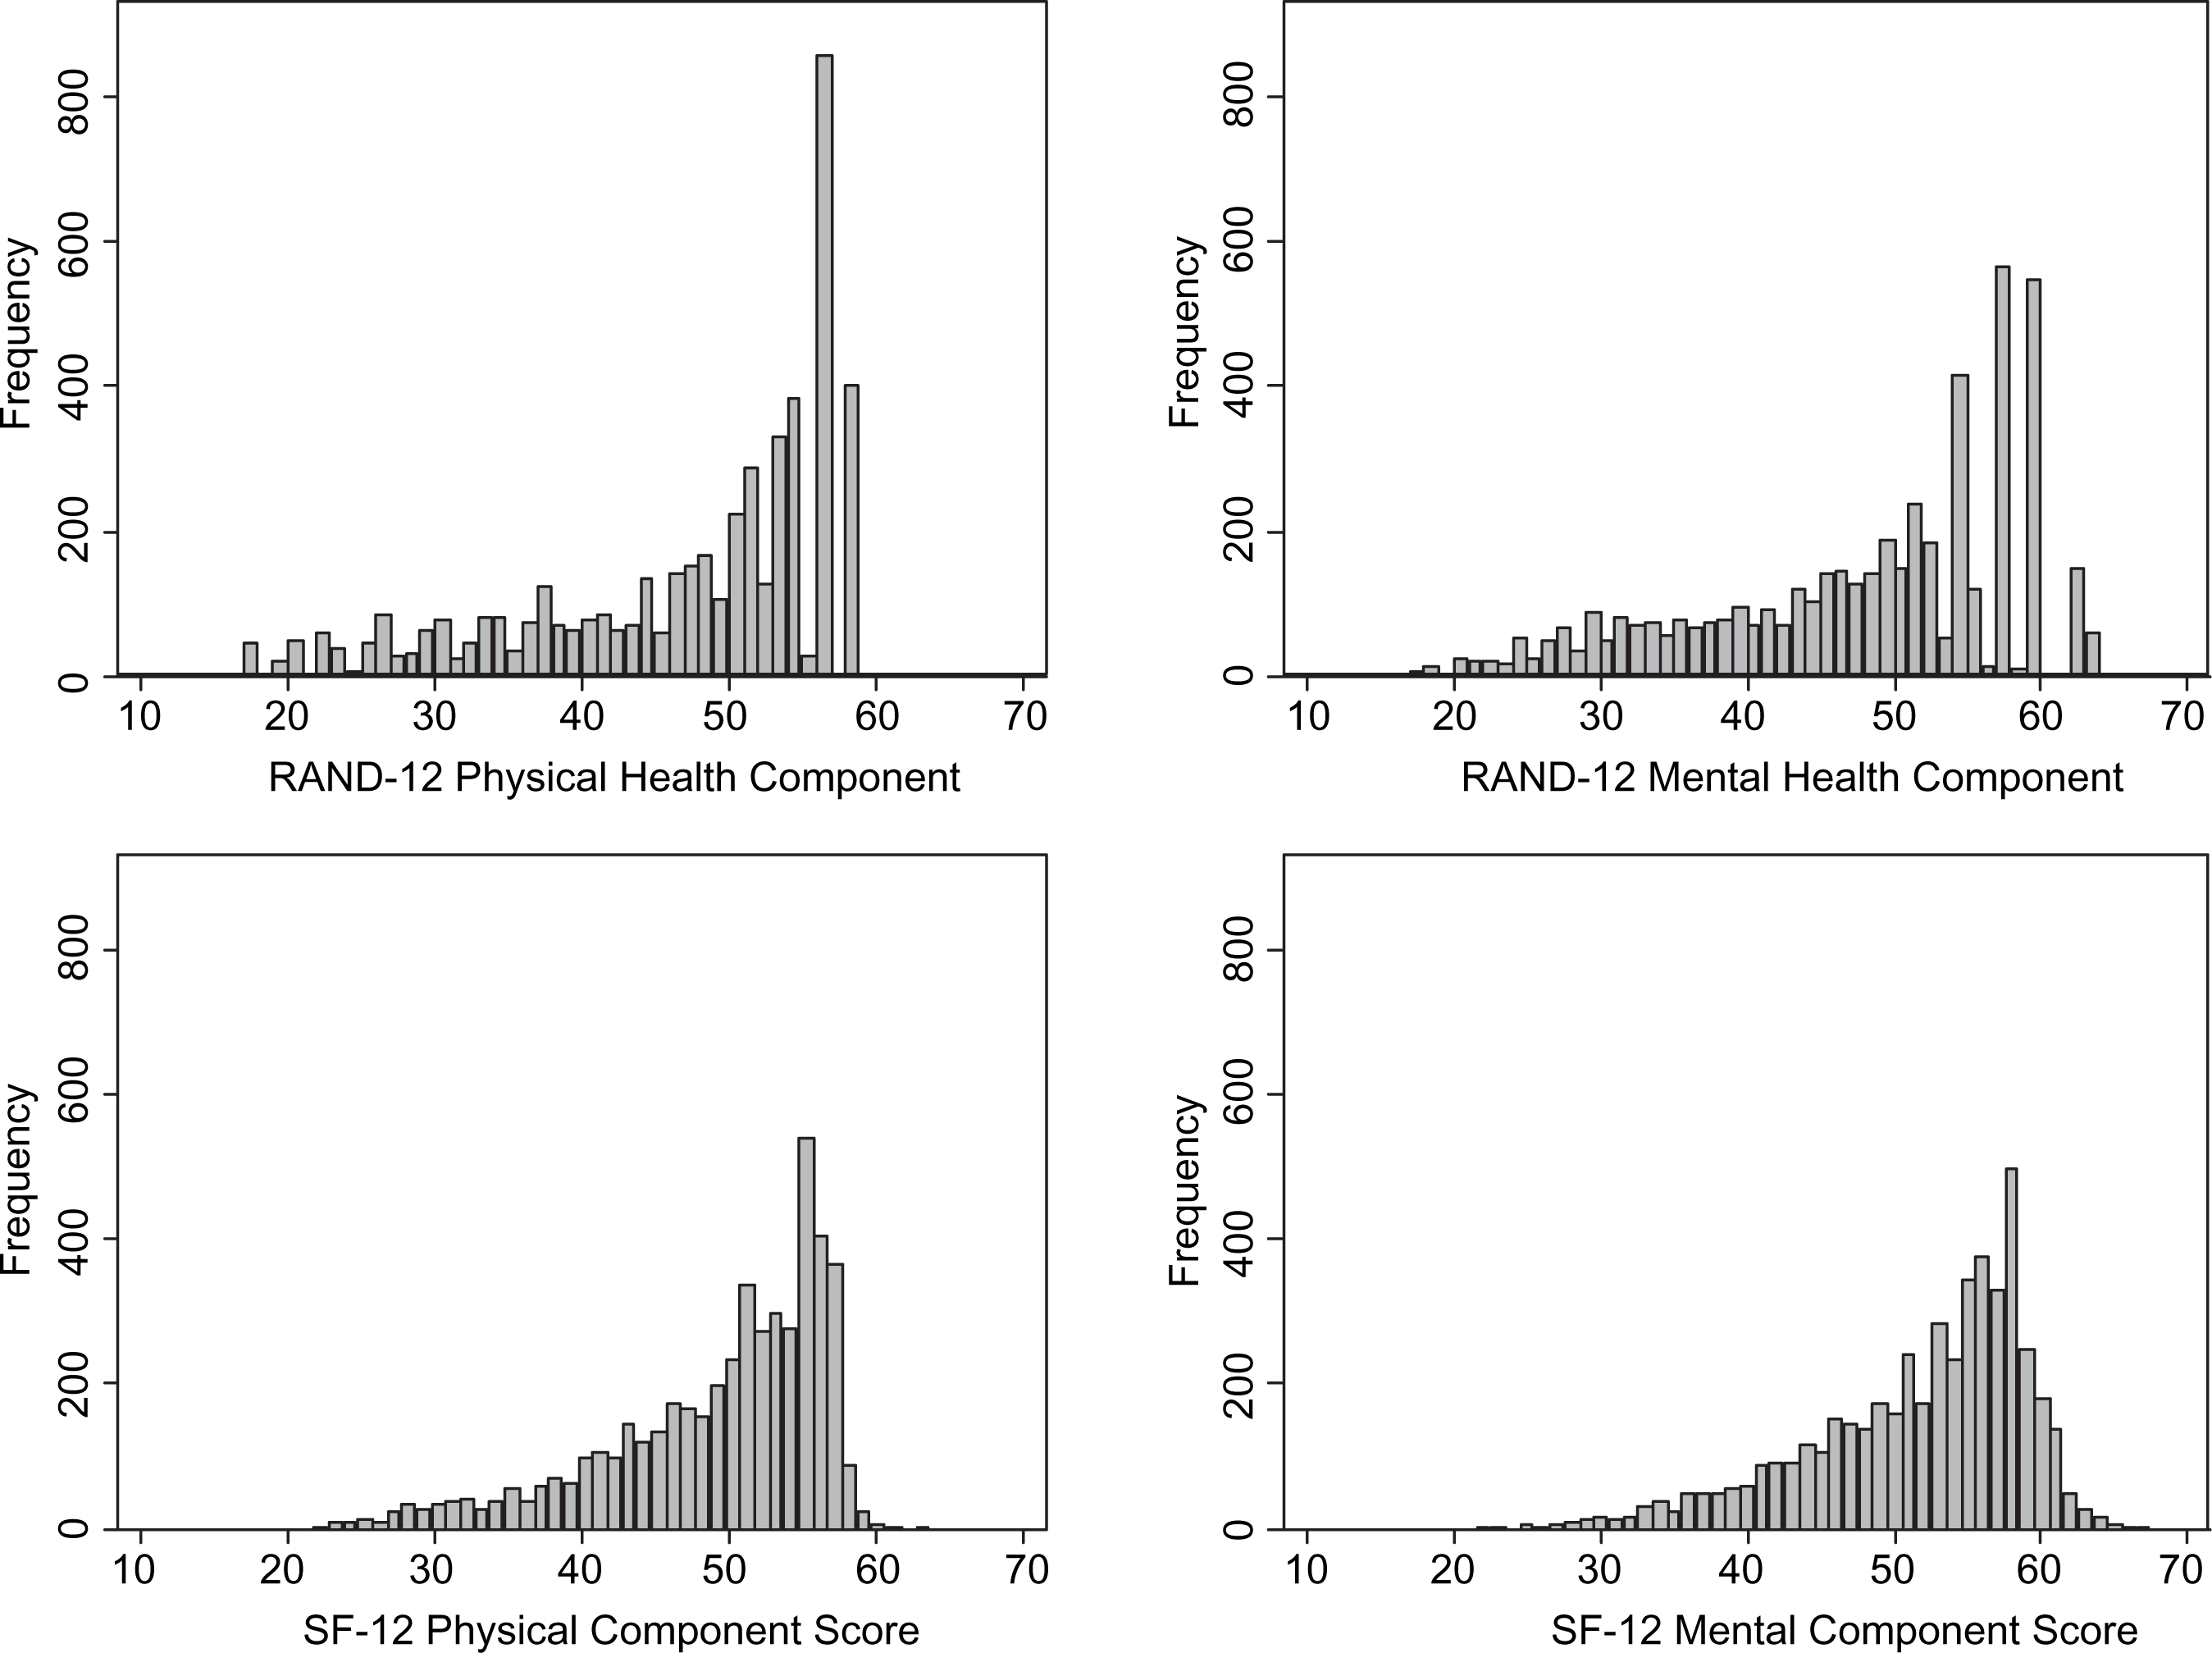
As expected, SF-12 component scores were generally positively associated with SWLS scores and negatively associated with Kessler-10 scores (Figures 2 and 3). The ability of sunflower plots to reduce the concealing effect of dense regions of the scatterplot is obvious. However, a more complex relationship emerges when LOWESS methods were applied to improve the signal-to-noise ratio (Figure 4).
Distribution of physical and mental health scores for Short-Form Health Survey (SF-12) and RAND-12 against the Kessler-10. Distribution of physical and mental health scores for Short-Form Health Survey (SF-12) and RAND-12 against the Satisfaction with Life Scale. (a) Locally weighted scatterplot smoothing (LOWESS) curves of physical and mental health scores for Short-Form Health Survey (SF-12) and RAND-12 against Kessler-10. (b) LOWESS curves of physical and mental health scores for SF-12 and RAND-12 against the Satisfaction with Life Scale.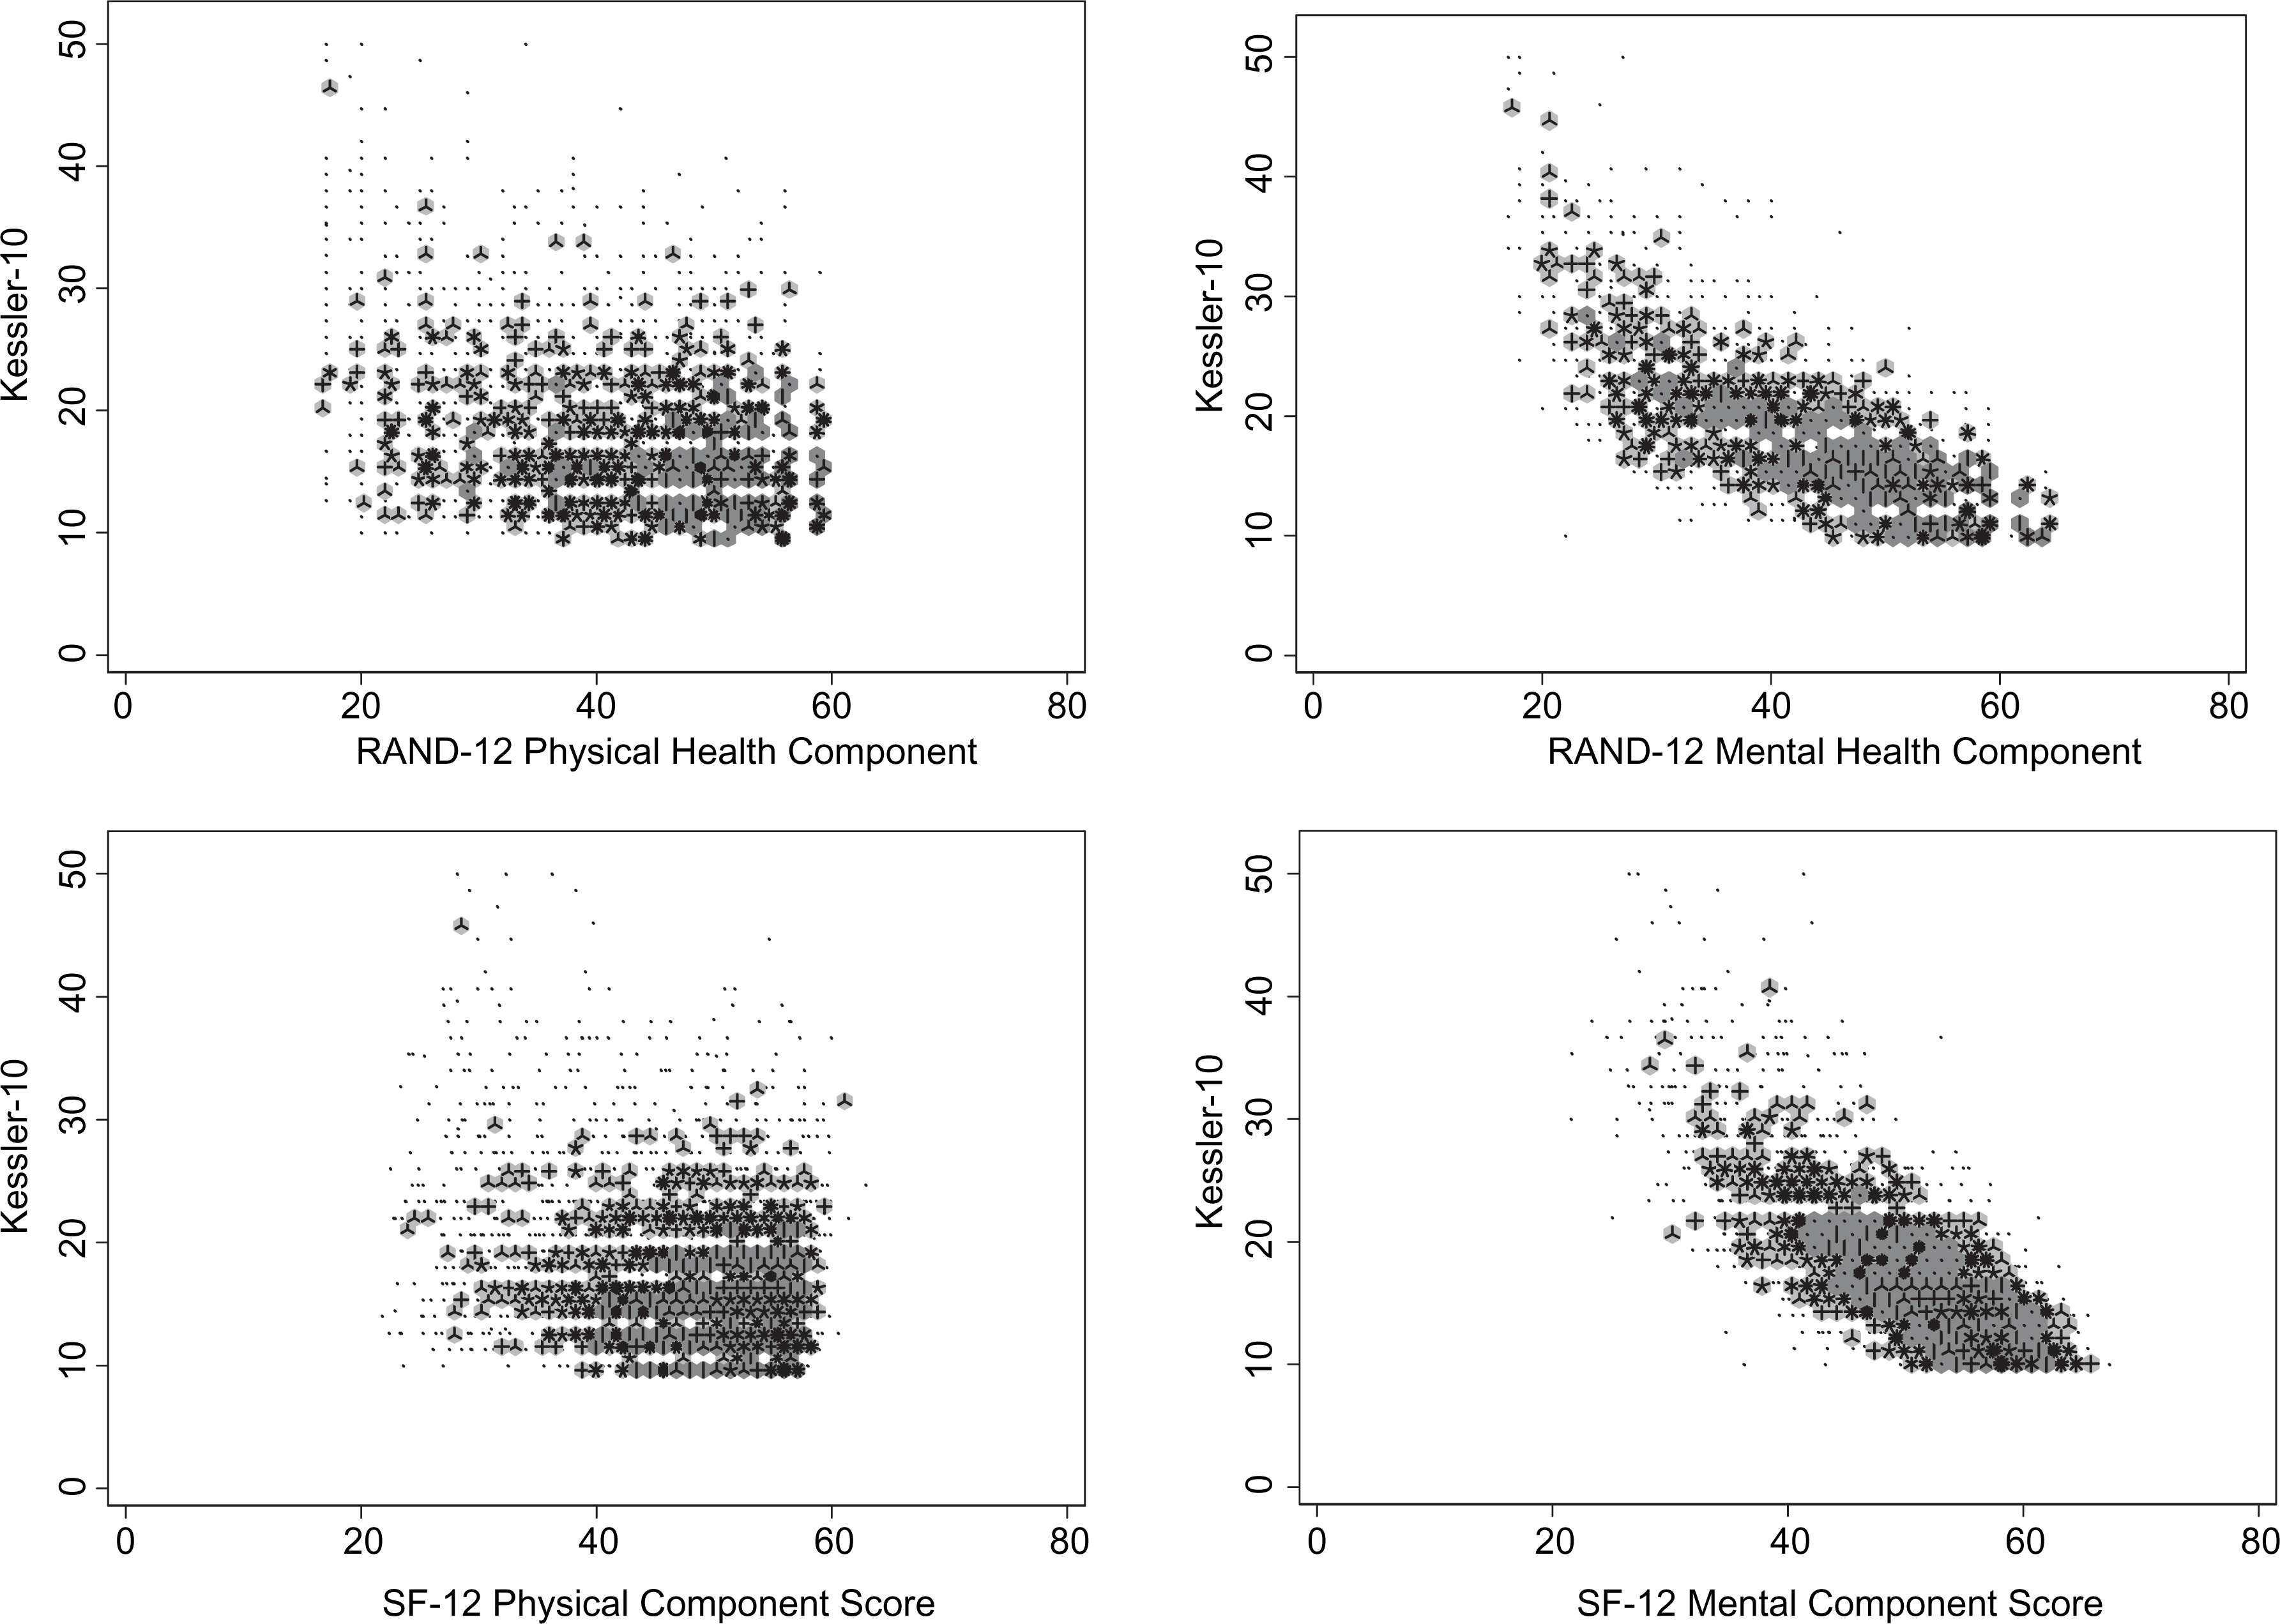
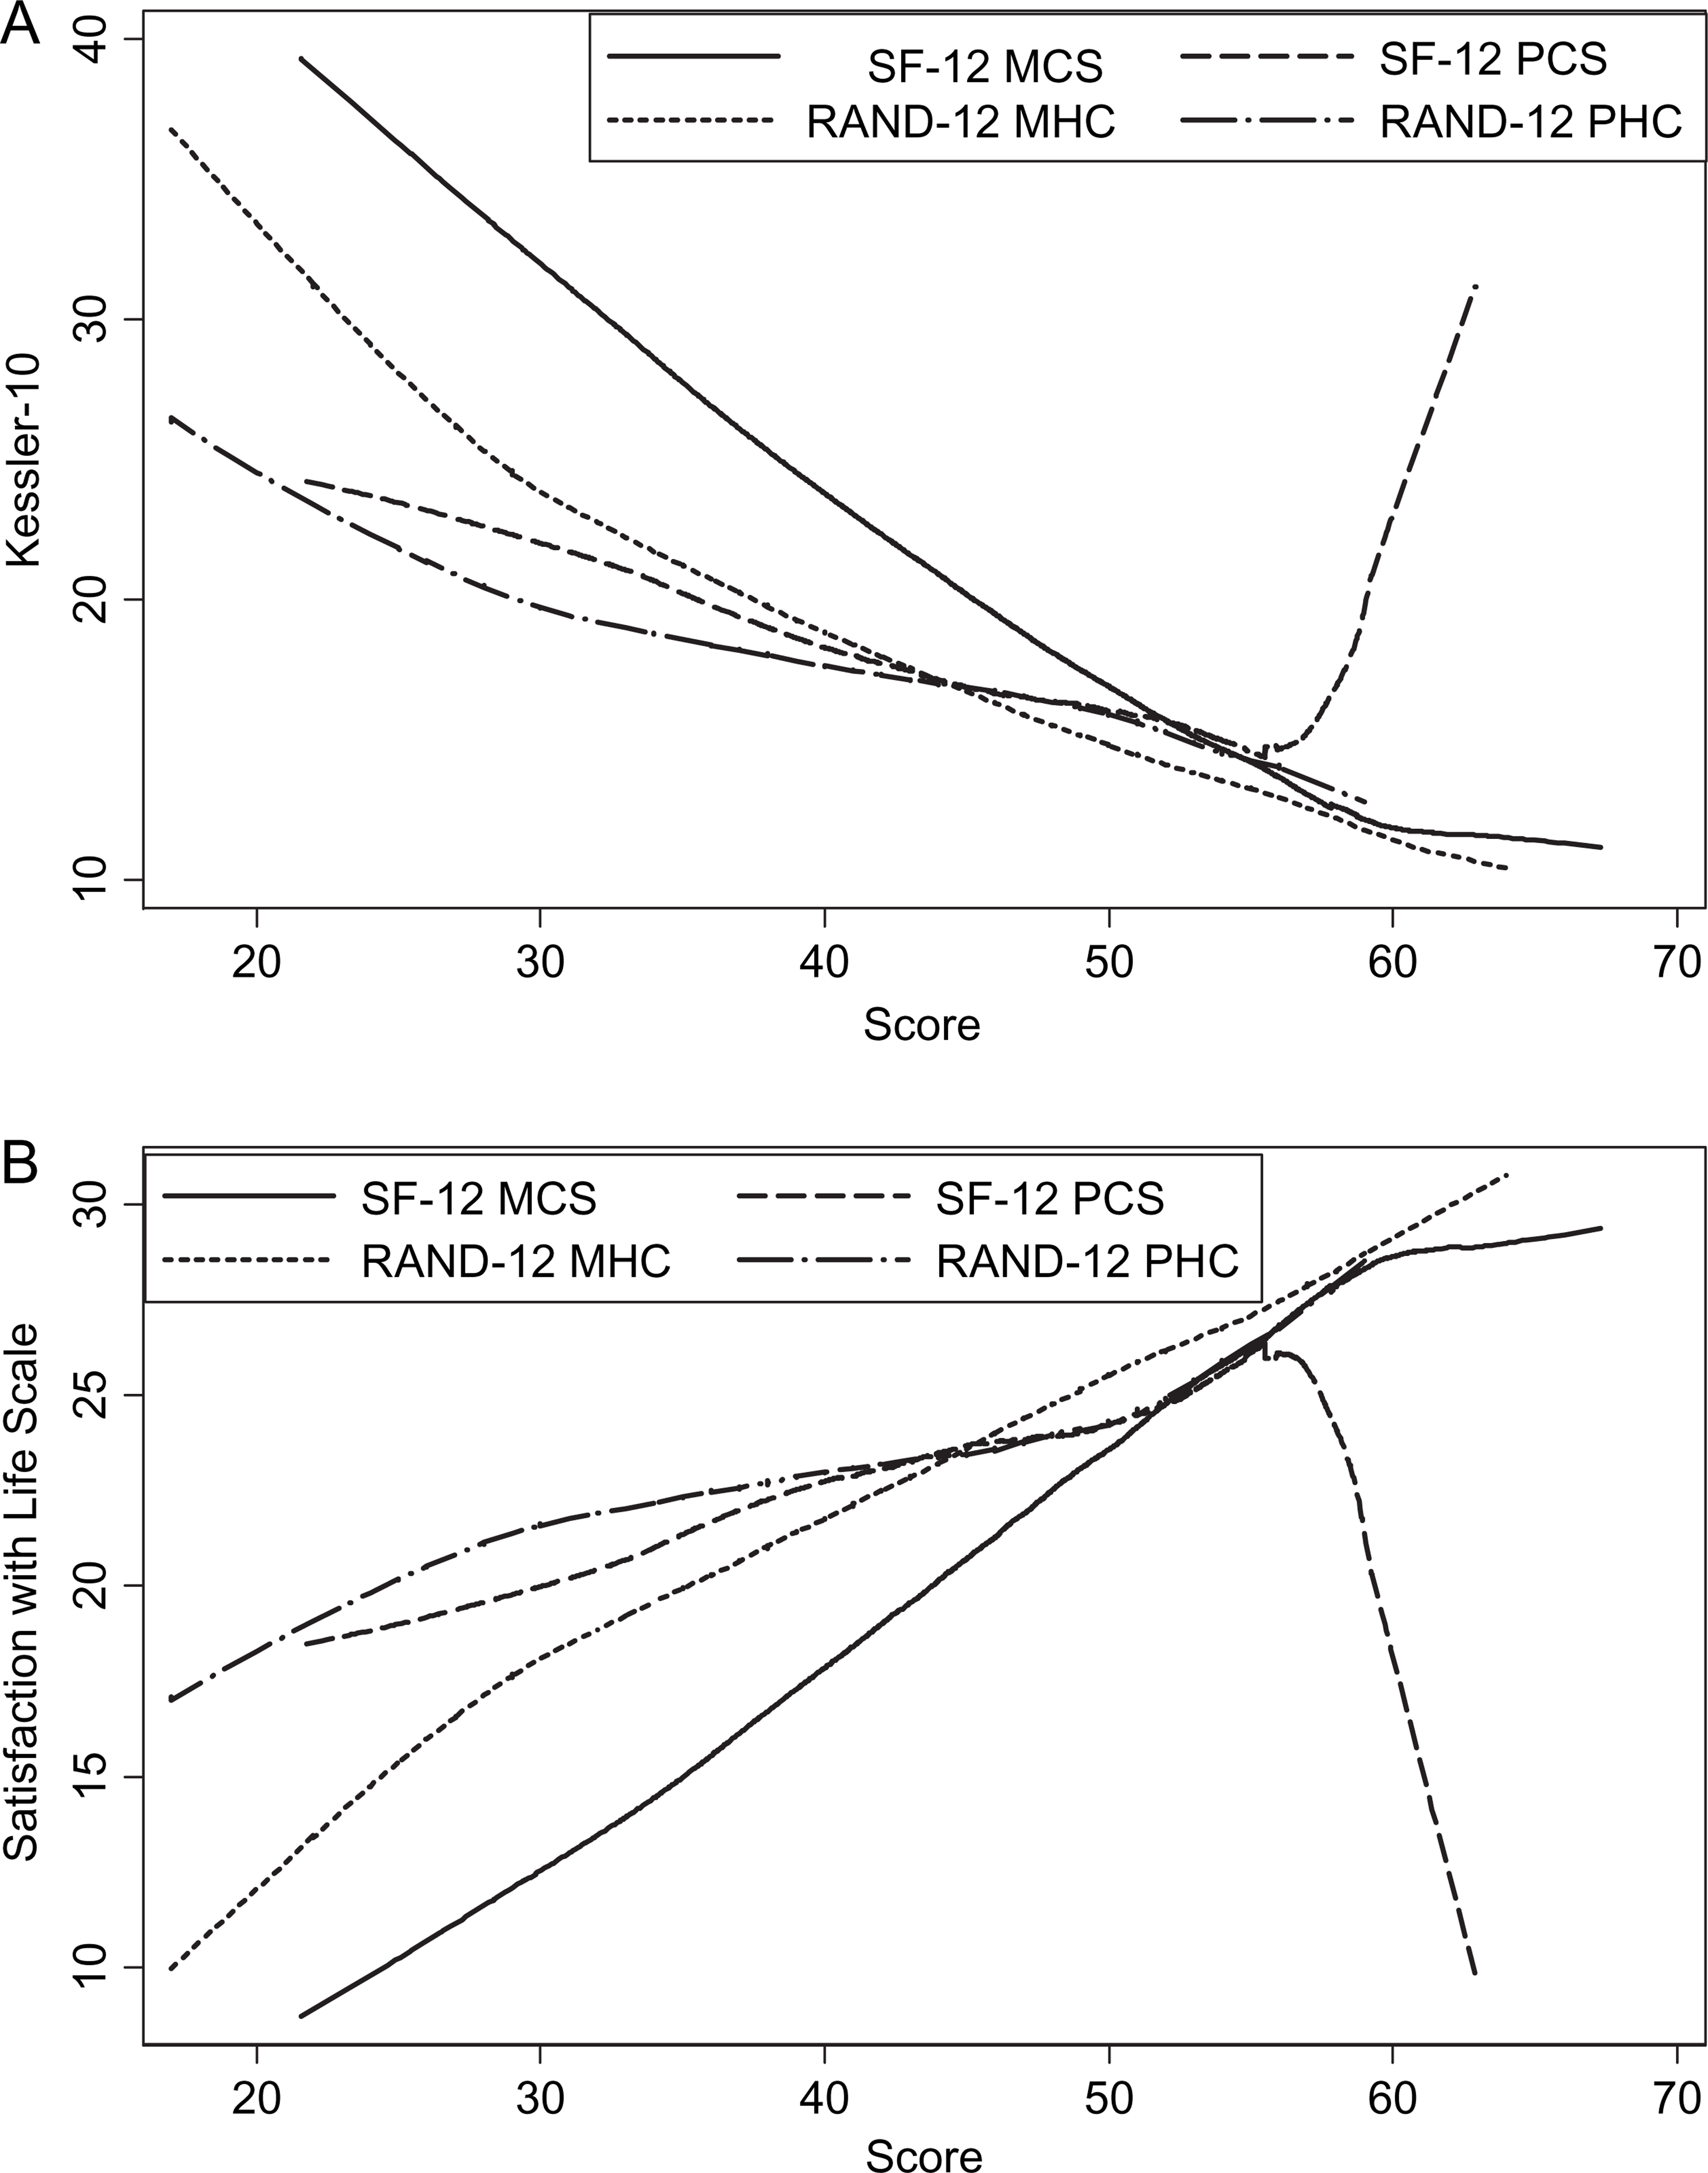
Smoothed curves for mental health component scores generally show parallel courses for both SF-12 and the RAND-12, producing a leftward shift in values. That is to say, for an equivalent SWLS or Kessler-10 score, the RAND-12 MHC score will be lower (higher severity), on average, compared to the SF-12 MCS. In contrast, although this is seen in the SF-12 and RAND-12 scores for the physical component, there are wide areas of overlap for scores <55. For higher scores, a reversal in trend is seen in the SF-12 PCS.
Relationships based on clinical categories
Increasing disability in physical and mental component scores is associated with symptom severity as measured by the Kessler-10 (Table 3). Categories of physical disability based on RAND-12 scores tend to be associated with larger proportional odds of greater symptom severity compared to scores derived from SF-12. In contrast, mental disability categories based on RAND-12 scores are associated with smaller proportional odds of greater symptoms severity compared to SF-12. Generally, similar results are seen for SWLS.
Multivariable adjusted ORs from proportional odds models
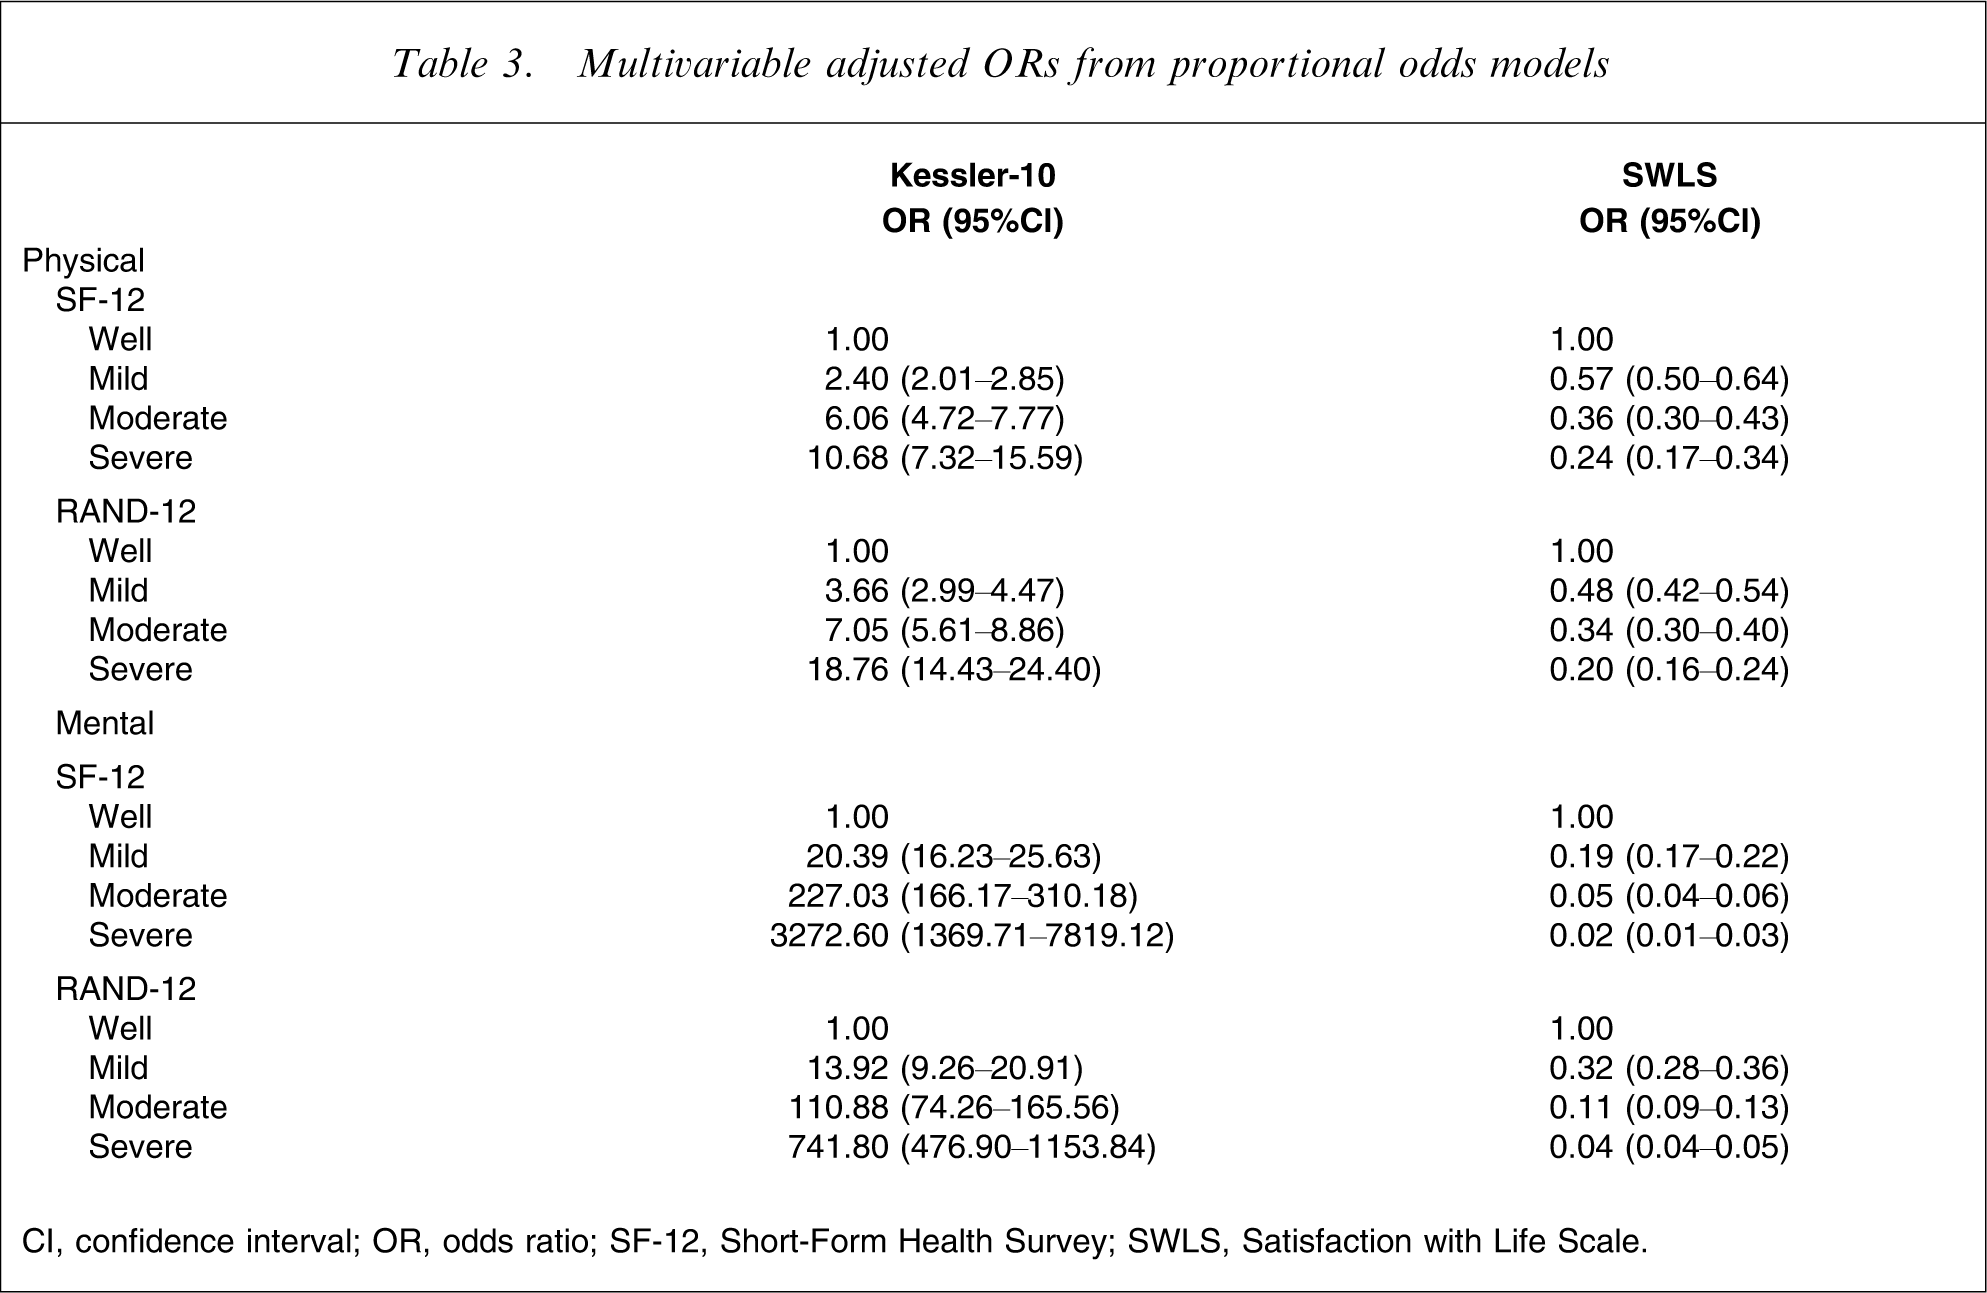
CI, confidence interval; OR, odds ratio; SF-12, Short-Form Health Survey; SWLS, Satisfaction with Life Scale.
Discussion
The aim of the present study was to ascertain the consequences of using the SF-12 and the RAND-12 for estimation of associations between its component scores and the levels of well-being and psychological distress. The present results indicate that both the SF-12 and RAND-12 component scores are generally positively associated with SWLS scores and negatively associated with Kessler-10 scores. But a larger proportion of participants was classified as having moderate and severe mental and physical disability under the RAND-12 compared to the SF-12 scoring method. Exceptions to this were detected for the SF-12 PCS for scores of mid-50s and above.
To our knowledge there has not been a study that specifically looks at the consequences of using the SF-12 and the RAND-12 for estimation of associations between the component scores and the levels of well-being and psychological distress. The present study had a response rate of 25%, which is not uncommon for mail-out surveys. Due to the high non-response rate, there may be a non-response bias, whereby people with low levels of life satisfaction, physical disability, mental disability and high levels of psychological distress may have chosen not to participate. Despite the 25% response rate the present study still had a large sample size of 5641 participants. All scales utilized have previously been validated and have adequate psychometric properties.
The present results, illustrated in Figures 1–3, demonstrate that the utilization of the RAND-12 compared to the SF-12 allowed for more variation in participant scores in both the SWLS and the Kessler-10. That is to say, there may be potential loss of information in the SWLS and the Kessler-10 when utilizing the SF-12, rather than the RAND-12.
The impact of the negatively weighted SF-12 items is illustrated in Figure 4(a). It is most evident in the SF-12 PCS, where the LOWESS line peaked steeply past the score of mid-50s. This sudden change in trend in the SF-12 PCS creates difficulty when interpreting the SF-12 PCS, because it is unclear whether the high SF-12 PCS reflects good physical health or high psychological distress and lower levels of well-being. That is to say, participant in studies identifying as having no physical disability or who scored >55 points on the SF-12 PCS might inaccurately be identifying as having low levels of well-being, higher levels of psychological distress or higher levels of mental health disability.
The differences between the SF-12 and RAND-12 noted here have also been replicated in previous studies [6], [21], [23]. These differences illustrate the implication of applying factor scores based on orthogonal rotation, which assumes no association, to constructs that have actual association [23]. The artificially imposed orthogonal rotation to the physical and mental component of the SF-12 ignores the natural nature of the correlation between physical and mental health, which has been documented in previous studies [6], [21], [23]. The reciprocal effects and negative weights utilized to construct the physical and mental health component of the SF-12 are likely to produce inaccurate results [21] because presence of symptoms in one domain is likely to inflate the scores in another domain.
When examining the clinical categorical cut-off score of the physical disability in the present population sample, the RAND-12 scores tended to be associated with larger proportional odds of lower level of well-being and greater psychological distress compared to scores derived from SF-12. Based on Table 3, the trend scores in the present study for both the SF-12 and RAND-12 are similar and were all statistically significant. The differences in magnitude in the proportional odds are large at the extreme end. Despite the peak in the SF-12 PCS of mid-50s and above, the overall SF-12 PCS still had the same trend as the RAND-12 PHC. That is to say, in the population we sampled, the inferences obtained from the SF-12 and the RAND-12 are similar. In clinical populations it would appear that there are no differences between using the SF-12 and the RAND-12 because in a clinical setting the focus is on patients identifying with severe symptoms, and there were no evident anomalies for those with component scores <50. However, if the SF-12 were to be utilized for a community or population survey with the aim of capturing data on persons with mild and moderate symptoms in order to promote mass behavioural change [28], the differences in magnitude in the proportional odds at the extreme end would be highly notable. The steep dip in levels of well-being of those with no physical disability indicated in the SF-12 PCS will provide an inaccurate population curve. In light of Rose's perspective that the study of a population as a whole attempts to ‘lower the mean level of risk factor’ [28] and remove the underlying causes, an accurate population curve is imperative before strategies can even be introduced to the population to address the issue.
Conclusion
We have discussed two scoring techniques to an instrument that may be utilized to measure health-related quality of life. We explored the consequences of using the SF-12 and the RAND-12 for estimation of associations between component scores and the levels of well-being and psychological distress. Differing outcomes were obtained based on the scoring technique utilized. Negative weights utilized to construct the physical and mental health component of the SF-12 are likely to produce inaccurate results, especially for those who scored above mid-50s in the physical component score.
Given the common use of the SF-12, we recommend that users familiarize themselves with the implications associated with the different scoring techniques. Users of the SF-12 are encouraged to identify the methodology and targeted population of their study prior to deciding on the scoring technique to utilize.
Footnotes
Acknowledgements
This research was funded by Beyond Blue. Researchers retained independent control of all aspects of the study and its submission for publication.