
Abstract
Keywords
Schizophrenia is predicted to manifest in individuals with a genetic predisposition who have been exposed to as yet unidentified environmental factors [1, 2]. The outcomes of such genetic and environmental interactions will be complex and would presumably act to alter central nervous system (CNS) function in a way that causes the distinctive symptoms of schizophrenia [3]. It has long been proposed that changes in gene expression in the CNS are likely to contribute to abnormal brain function in subjects with schizophrenia [4]. Thus, to accelerate the identification of changes in gene expression, a number of studies have measured levels of mRNA in post-mortem CNS from subjects with the disorder using complimentary DNA (cDNA) microarrays. The power of this approach is that levels of thousands of mRNAs can be measured simultaneously.
The first outcome from microarrays studies has been a reinforcement of the hypothesis that schizophrenia is a complex disorder. These studies also suggest that schizophrenia involves changes in presynaptic functioning [5, 6], regulators of G-protein signalling [7, 6], metabolic pathways [8–10], γ-aminobutyric acid neurons [11], ionotropic glutamate receptors [6, 12, 13], myelination [14] and protein turnover [10]. In addition, some studies have focused attention on abnormalities in expression of individual genes such as tyrosine 3-monoxygenase/tryptophan 5 monoxygenase [15] and apolipoprotein L1 [16]. Another finding arising from microarray studies is that changes in levels of individual mRNAs can display both regional [15] and diagnostic [16] specificity. Together, and as more comprehensively reviewed elsewhere [17], these data suggest that there is an ongoing need to continue to use high-throughput methodologies to identify changes in gene expression in schizophrenia.
High-throughput screening techniques for mRNA in tissue can be divided into open and closed system approaches [18]. The closed system approaches, such as the microarrays, utilize information on specific gene sequences to allow the generation of probes that can hybridize to specific mRNA that are transcribed from genes of interest. While the closed system approaches have advantages with regards to reproducibility and speed of gene identification, they are limited by sensitivity (one part in 105 or 104 depending on the nucleotide sequence) and cost (multiple high-intensity arrays per study). The alternative open system approaches, which are polymerase chain reaction (PCR)-based methodologies, detect mRNA based on nucleotide sequence using adaptors that can be attached to multiple DNA fragments, allowing these fragments to be amplified at one time. The open system approach is problematic in controlling for inter-assay variability but has the advantage of increased sensitivity (one part in 106), allowing the study of mRNA with lower copy number.
Given that genes expressed at low abundance have been shown to be important in the pathology of schizophrenia [6], we decided to use an open system approach, restriction fragment differential display (RFDD), to measure levels of mRNA in the dorsolateral prefrontal cortex (DLPFC) from subjects with schizophrenia and age/sex-matched controls. Studies were undertaken in the DLPFC because there is a large body of data showing that the functioning of this CNS region is affected in subjects with schizophrenia [19]. In addition, we have used real-time PCR, PCR and western blot analyses with CNS tissue from relatively large cohorts of subjects, peripheral tissue and CNS from rats treated with antipsychotic drugs to extend our initial findings from RFDD.
Methods
Tissue collection
Human tissue, clinical follow up and diagnosis
Prior to commencement, approval for this study was obtained from the Ethics Committee of the Victorian Institute of Forensic Medicine and the North Western Mental Health Program Behavioural and Psychiatric Research and Ethics Committee. All tissue utilized in the studies were obtained from the Victorian Brain Tissue Repository in the Rebecca L. Cooper Research Laboratories at the Mental Health Research Institute, Melbourne.
Psychiatric diagnoses were made according to DSM-IV criteria [3] by consensus between two senior psychiatrists and a psychologist after an extensive case history review using a structured diagnostic instrument, the Diagnostic Instrument for Brain Studies (DIBS) [20]. Duration of illness (DOI) was calculated as the time from first contact with a psychiatric service to death, and the final dose of antipsychotic drug (FRADD) was converted to chlorpromazine equivalents. In cases where death was witnessed, the time between death and autopsy was taken as the post-mortem interval (PMI). Where death was not witnessed, tissue was taken only from individuals who had been seen alive up to 5 h before being found dead, in these cases PMI was taken as the interval half way between the donor being found dead and last being seen alive. In all cases, cadavers were refrigerated within 5 h of being found and tissue was rapidly frozen to −70oC within 30 min of autopsy. The pH of the CNS tissue was measured as described previously [21] because this measure provides a better indication of mRNA integrity than PMI [22].
For RFDD experiments, tissue was obtained from Brodmann area (BA) 46 from the left hemisphere of 10 subjects with a DSM IV diagnosis of schizophrenia and from the same region from 10 subjects with no history of psychiatric illness (controls; Table 1). To avoid bias, the subjects with schizophrenia were not selected using any predetermined criteria. The control subjects were matched for sex and closely matched for age to the subjects with schizophrenia and thus there was no significant difference in age (p = 0.82), PMI (p = 0.59) or brain pH (p = 0.14) between the diagnostic cohorts (Table 1).
Pooled mRNA cohorts for RFDD
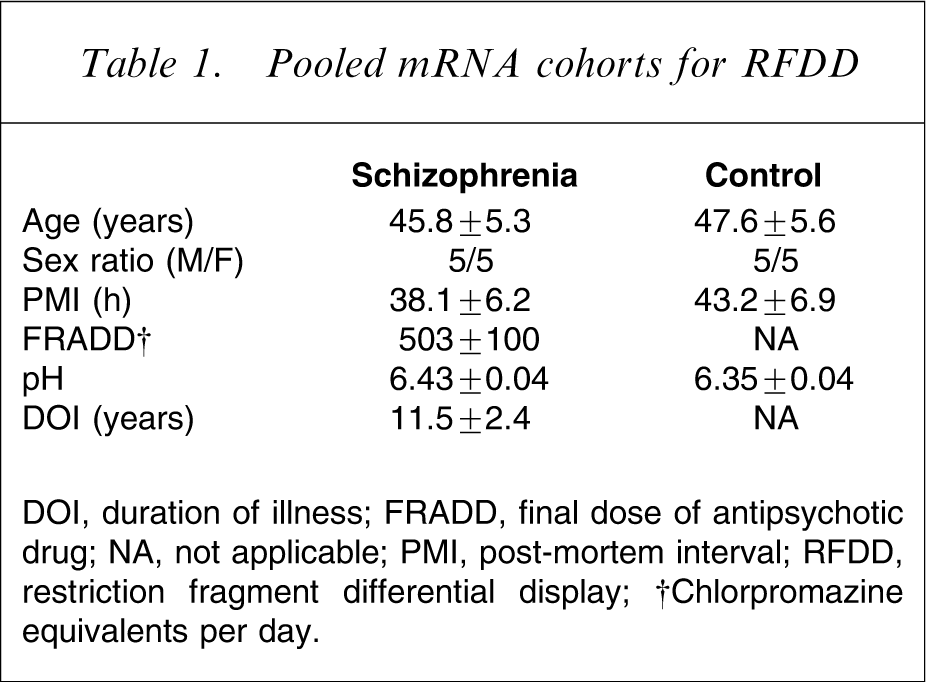
DOI, duration of illness; FRADD, final dose of antipsychotic drug; NA, not applicable; PMI, post-mortem interval; RFDD, restriction fragment differential display
†Chlorpromazine equivalents per day.
Subsequently, for the experiments using real-time PCR, BA 46 and BA 9 were obtained from the left hemisphere of 30 subjects with schizophrenia, eight subjects with bipolar 1 disorder (BPD1) and 30 control subjects matched for age, sex, and PMI (Table 2). Thus, once again there were no significant differences in age (F = 2.33, df = 2,67, p = 0.1), brain pH (F = 0.26, df = 2,67, p = 0.77) or PMI (F = 0.10, df = 2,67, p = 0.90) between the three cohorts of subjects. In addition, for the disease cohorts, there were no significant differences in DOI (p = 0.99) or FRADD (p = 0.84) between subjects with schizophrenia and BPD1 (Table 2). RNA from the subjects used in the RFDD experiments were included in the cohorts used for real-time PCR.
Differential display validation study cohorts
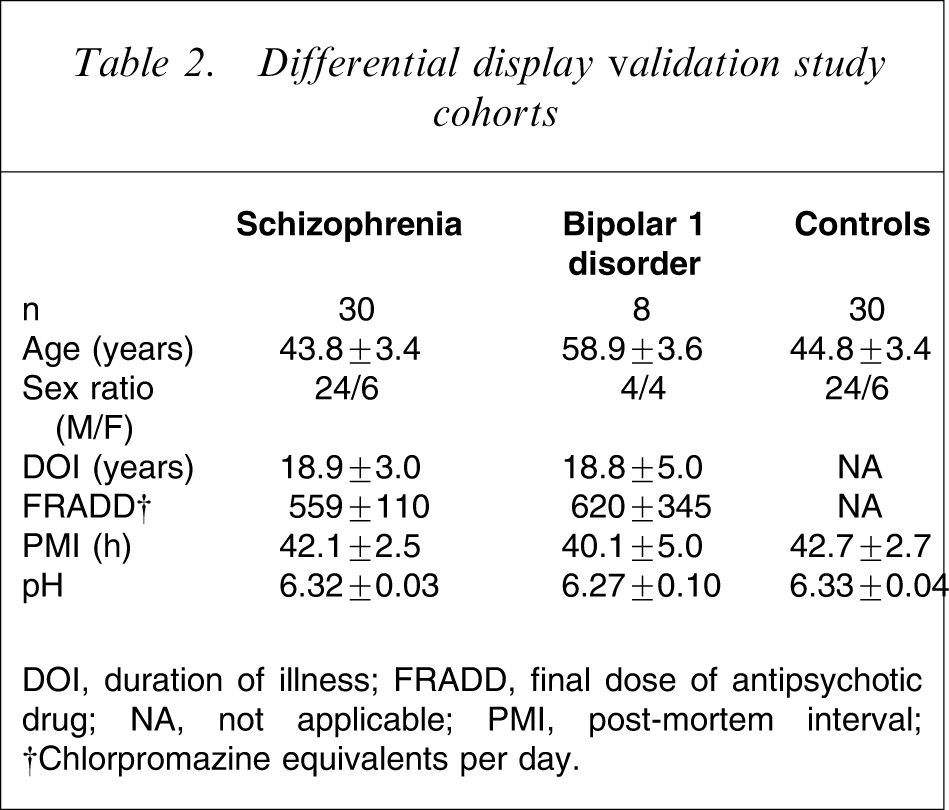
DOI, duration of illness; FRADD, final dose of antipsychotic drug; NA, not applicable; PMI, post-mortem interval
†Chlorpromazine equivalents per day.
The cohorts of subjects with schizophrenia used for real-time PCR were made up of individuals with a short (<7 years) and long (>22 years) DOI (Table 3). Dividing the schizophrenia subjects and their matched controls according to DOI of the schizophrenia subjects (short-duration schizophrenia + their age- and sex-matched controls, SDOI; long-duration schizophrenia + their age- and sex-matched controls, LDOI) resulted in there being a significant variance in age between the subjects with SDOI and LDOI (F = 97.1, df = 1, 56, p < 0.0001) but not between the diagnostic cohorts (F = 0.1, df = 1,56, p = 0.85) and there was no interaction between the variables (F = 0.03, df = 1,56, p = 0.86; Table 3). Predictably, the variation with age was due to the SDOI subjects (29.6±2.2 years) being significantly younger than the subjects with LDOI (59.0±1.9 years, p < 0.0001). In the case of PMI, there was significant variance associated with SDOI and LDOI (F = 5.3, df = 1,56, p < 0.05) but not with diagnosis (F = 0.02, df = 1,56, p = 0.87) and there was no interaction between the variables (F = 0.06, df = 1,56, p = 0.81). The variance in PMI was due to the subjects with SDOI (46.6±2.2 h) having longer PMI than the LDOI subjects (38.3±2.7 h, p = 0.02). There was no significant variance in brain pH with either DOI (F = 1.5, df = 1,56, p = 0.23) or diagnosis (F = 0.05, df = 1,56, p = 0.82). For the subjects with schizophrenia, there was no significant difference in FRADD (p = 0.26) between SDOI and LDOI subjects.
Duration of illness study cohorts
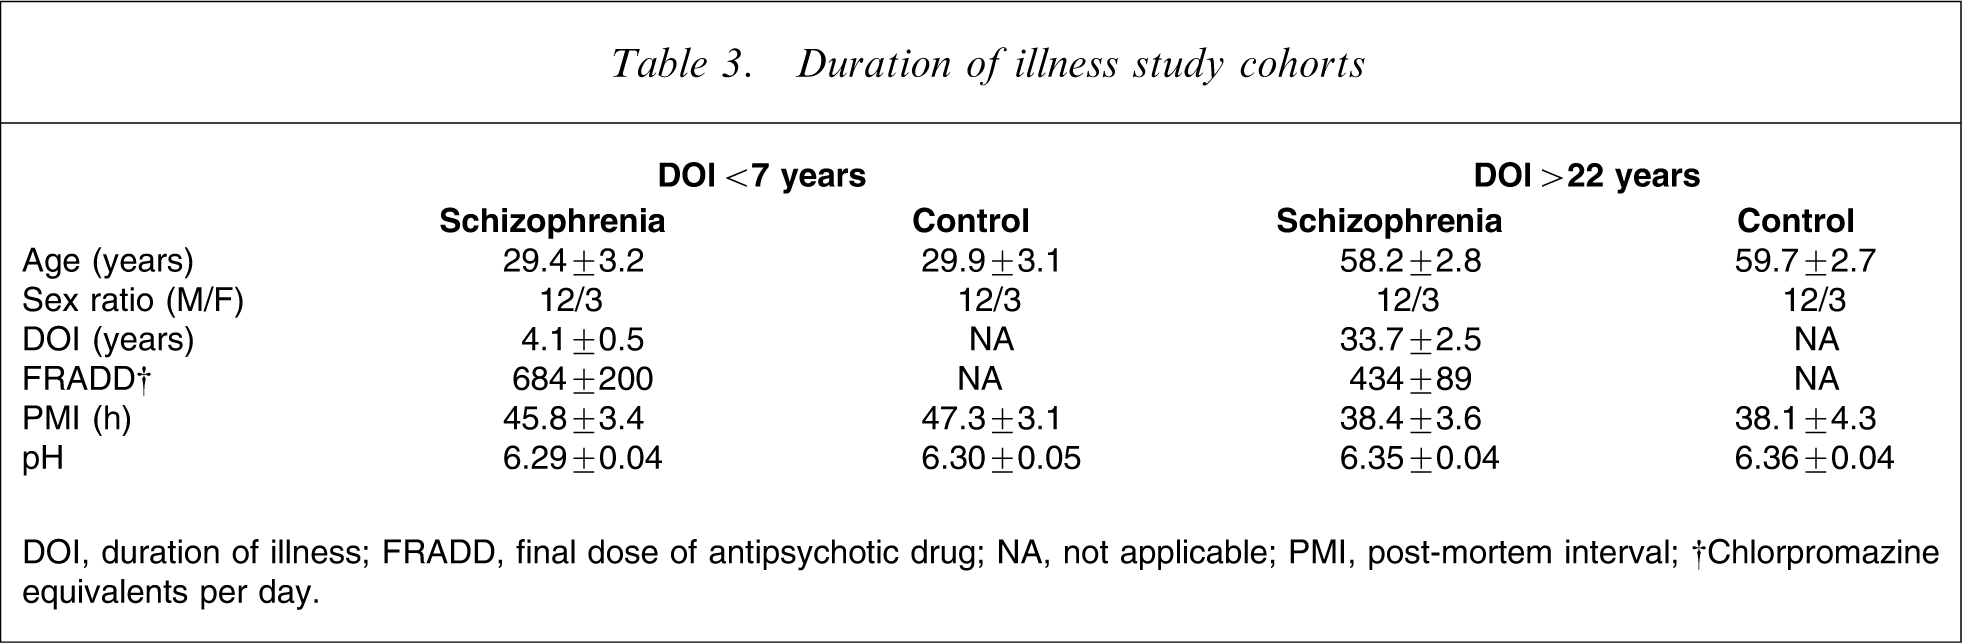
DOI, duration of illness; FRADD, final dose of antipsychotic drug; NA, not applicable; PMI, post-mortem interval
†Chlorpromazine equivalents per day.
Post-mortem CNS from various regions from three other subjects with no history of psychiatric or neurological history was also collected for the study of the muscleblind protein 1 (MBNL1) expression in the human brain.
Rat tissue
Cortical tissue was obtained from male rats that had been treated for 3 months with vehicle, or the antipsychotic drug chlorpromazine, at a range of doses (0.1, 1.0 and 10 mg kg−1 day−1: five rats per treatment group), in drinking water for 3 months. This treatment duration was to ensure that rats had received antipsychotic drugs for a time greater than the minimum duration required for the drugs to have clinically significant effects in humans [23]. For tissue expression studies, tissues were collected from three male and three female rats between 6 and 10 weeks weighing between 200 and 250 g. In both cases, the tissue was rapidly frozen in isopentane in dry ice prior to storage at −70oC until required.
RNA purification and cDNA template preparation
For RFDD, real-time PCR and PCR, total RNA was extracted using Trizol reagent (Invitrogen Australia Pty Ltd, Mount Waverley, VIC, Australia).
For RFDD, RNA samples from 10 schizophrenia and 10 control subjects were pooled to give two samples, one for each diagnostic cohort. First-strand cDNA from each of the two pools was synthesized using 1 g total RNA, an oligo-dT25 primer (12.5 µmol L−1) and displayTHERMO reverse transcriptase (100 U; Display Systems Biotech, Inc., Vista, CA, USA) in 25 µL volume by incubating at 42°C for 2 h. Second-strand cDNA was synthesized at 16°C for 2 h. The resulting cDNA was digested with a restriction endonuclease (TaqI) at 65°C for 2 h. Specific adaptors were then ligated to the ends of the cDNA fragments at 37°C for 3 h to give cDNA templates for use in the RFDD assay.
Restriction fragment differential display
The RFDD analysis was carried out as described in detail in the displayPROFILE kit (Display Systems Biotech). Briefly, the cDNA templates were amplified in 64 PCR reactions consisting of a fluorescently labelled 5′ primer and one of 64 specific display PROBE 3′ primers (Display Systems Biotech) that anneal to the junction between the linker and cDNA fragment. Three bases (N1N2N3, where N = A, C, T or G), distinct for each 3′ primer, extend into the cDNA sequence allowing for specific amplification of cDNAs. Each PCR reaction amplifies a different subset of cDNA products and to amplify all of the 43 variations, 64 different primers were required with each set of primers being run in a separate PCR reaction. All cDNAs generated in a given PCR reaction are referred to as making up an ‘expression window’ and PCR products were generated within 64 expression windows. Notably, the primer design ensured that each cDNA fragment was amplified in two separate expression windows, and the experimenter was blind to the expression windows in which these duplicate amplifications were performed.
For each PCR reaction, an aliquot (0.2 µL) of cDNA template was mixed with 2.0 µL of displayTAQ FL 10× reaction buffer (Display Systems Biotech), 0.8 µL dNTP mix (5 µmol L−1 each), 1.0 µL fluorescently labelled 5′ primer (4 µmol L−1), 0.3 µL displayTAQ FL polymerase and 4.0 µL of displayPROBE3′ primer (1 µmol L−1). Sterile H2O was added to give a final volume of 20 µL. Each reaction was amplified with touchdown PCR using the following profile: initial denaturing 94oC for 5 min; and 10 cycles: denaturing, 94°C for 1 min; annealing, 60oC for 30 s; extension, 72oC for 30 s during which the annealing temperature is reduced by 0.5°C after each cycle so that the final annealing temperature is 55°C. An additional 35 cycles were performed at a constant annealing temperature (55°C) with a final extension of 72°C for 5 min. Electrophoresis was used to resolve each amplified cDNA so that the length and relative abundance of each DNA fragment could be measured.
Fold changes in levels of each DNA fragment in schizophrenia were calculated as follows:
Increases in expression: (schizophrenia=control) × 100=% increase
Decreases in expression: (control=schizophrenia) ×100=% decrease
This approach meant that the magnitude of increases and decreases in gene expression could be expressed as percent changes without constraining one variable between 0 and 100%. Experiments (data not shown) examining the reproducibility of the system suggested that levels of amplified DNA fragments had to differ by >300% between diagnostic cohorts in one expression window to give a high probability that differential expression had been detected. However, analysis of the completed RFDD data showed that a change in mRNA levels in schizophrenia of 400 or 500% in one experimental window gave a 57 and 64% prediction, respectively, of a change in the second window being >300%. By contrast, a change >600% in one window was >99% predictive of an expression difference of >300% in the second window. Thus, we used two criteria to identify differentially expressed genes. These were that a gene had to be detected in both predicted expression windows and there had to be a >600% difference in mRNA levels between diagnostic cohorts in one expression window. The identity of the genes meeting these criteria involved entering the fragment size and expression window number (the specific trinucleotide sequence used for amplification) in Display Systems Biotech's displayFIT program. This program accesses a proprietary database via the internet to determine gene identity.
Real-time polymerase chain reaction
Real-time PCR was performed using the LightCycler thermal instrument (Roche Diagnostics, Mannheim, Germany). Reactions were performed in 20 µL volume with 0.5 µmol L−1 primers and MgCl2 concentration optimized between 2 and 5 mmol L−1. Nucleotides, Taq DNA polymerase and buffer were included in the LightCycler DNA Master SYBR Green I mix (Roche Diagnostics). The cDNA from each subject was diluted to 1 in 20 prior to PCR amplification. A typical run consisted of a 10 min denaturation step at 95oC followed by 40 cycles of 95oC for 10 s, 55–64o (primer dependent) annealing for 5 s, and 72oC extension for 8 s. Detection of the fluorescence was carried out either at the end of the 72oC extension period or after an additional 3 s step at 2oC below the product melting temperature. To confirm amplification specificity, the PCR products from each primer pair were subjected to a melting curve analysis as well as subsequent agarose gel electrophoresis and sequence verification. The quantification data were analysed with the LightCycler analysis software.
To normalize expression from real-time PCR, the levels of expression of β-actin mRNA was measured in BA 9 and BA 46 in all samples. Levels of β-actin mRNA did not differ between diagnostic cohorts (F = 1.30, df = 2,130, p = 0.28) or between regions (F = 1.78, df = 1,130, p = 0.18) and therefore could be used as the housekeeping gene for the present study. Thus, gene amplification levels were normalized against β-actin measured against a β-actin standard curve using serial 10-fold dilutions ranging from 10 ng to 0.001 pg by amplification of a 203 bp β-actin fragment, against a template that was prepared by excising from a gel, purifying and sequencing. In normalizing to β-actin the capacity to compare absolute levels of specific mRNA between regions was lost.
MBNL1 expression localization studies
Primer sets to amplify human MBNL1 (forward sequence 5′-GAGATGAATGTGCCAAGCAA–3′; reverse sequence 5′–AGAATGGTGCCCTTTGACTG-3′) and rat (forward sequence 5′-GGCCTTGTTATAAATAAGCTGCAT-3′; reverse sequence 5′-GACTATATACAGAAGTGCAAAAAGTCA-3′) were synthesized by Invitrogen.
PCR reaction was performed in a final volume of 50 µL, using Red Hot Taq DNA Polymerase, 1.25 U, in the buffer supplied by the manufacturer (Invitrogen Australia), 1.5 mmol L−1 MgCl2, primer mix (forward and reverse) 0.5 µmol L−1 each, 0.8 mmol L−1 dNTP mix, 2 µL from a 1 in 10 dilution of the first-strand cDNA template synthesized as aforedescribed, and one cycle of initial denaturation at 94oC for 2 min followed by 30 cycles consisting of denaturation (94oC for 30 s), annealing (60oC for 30 s) and elongation (72oC for 30 s), followed by a final elongation period of 5 min at 72oC. PCR products were separated on an agarose gel and imaged using a BioRad gel doc system (BioRad, Regents Park, NSW, Australia).
MBNL protein analysed using western blotting
Protein homogenates (20 µg) from BA 46 were loaded onto a 4% dodecyl sulfatepolyacrylamide gel electrophoresis (SDS-PAGE) stacking gel and separated in a 10% SDS-PAGE resolving gel along with BioRad broad range biotinylated standards (molecular weight MW markers: two lanes), a sample of bovine serum albumin (one lane: independent check for molecular weight) and internal control (two lanes: see following). The proteins were separated by maintaining a constant voltage of 150 V until dye moved to the bottom of the gel.
The proteins on each gel were transferred overnight onto Hybond-ECL (GE Health Life Sciences, North Shore, NSW, Australia) at constant 40 mA. The proteins on the nitrocellulose membrane were visualized using a Ponceau S stain to ensure that the transfer had been effective; the nitrocellulose membranes were de-stained by washing in distilled water and the lanes containing the MW markers removed prior to the nitrocellulose membrane being blocked in 0.1% tween-20 in Tris-buffered saline (TTBS) for 1 h at room temperature. After blocking with TTBS, the nitrocellulose membrane were incubated with TTBS containing 1:2000 dilution of a monoclonal anti-MBNL antibody (kind gift from Professor Maurice S. Swanson, Department of Molecular Genetics and Microbiology, University of Florida) in TTBS for 2 h at room temperature. Each nitrocellulose membrane was then washed 3×5 min in TTBS and incubated with a Dako goat anti-mouse Ig antibody (Dako, Botany, NSW, Australia) diluted 1:2000 in TTBS for 2 h at room temperature. At the completion of this incubation each nitrocellulose membrane and the corresponding MW standard strips (that had been removed earlier) were incubated for 2 h at room temperature with avidin–horseradish peroxidase conjugate (diluted 1:3000 in TTBS). All nitrocellulose membranes and MW strips were then washed for 3×5 min in TTBS and then exposed to Amersham ECL (GE Health Life Sciences, North Shore, NSW, Australia) for 1 min at room temperature. The MW strips and nitrocellulose membranes were realigned on the image plate of a Kodak 440CF image station and images captured for 30 s. Image analysis first involved ensuring that the MW standards had been correctly aligned by confirming the MW of the bovine serum albumin on each gel. The density of the MBNL protein in each sample was then measured and expressed as a ratio of the density of the MBNL protein in the internal control (ratio IC) to control for gel-to-gel variation.
Internal control sample
Prior to measuring MBNL in BA 46, sufficient protein homogenate (internal control: IC) was prepared from the cerebellum of a control subject to allow samples to be run on every gel containing BA 46 from the schizophrenia and control subjects. Initially, this homogenate was run in each of 12 wells on four gels (48 samples over all) and the optical density (OD) of each immunopositive MBNL band measured as aforedescribed. Using these data the intra-gel variation was shown to be 9% and the between-gel variation to be 12%. A sample of IC was included in two lanes of each subsequent gel in which protein from BA 46 were separated and the OD of each sample was expressed as a ratio of the IC to control for gel-to-gel variation in our analyses.
Statistics
One-way ANOVA within CNS-region diagnoses was used to identify disease-specific variation with a post-hoc Dunnett's test to identify differences between schizophrenia and control subjects. Two-way ANOVA with post-hoc Bonferroni post-tests were used to identify changes in levels of MBNL protein, age, PMI and brain pH between diagnosis and DOI. t-Tests were utilized to identify possible significant differences in the DOI and FRADD between the cohorts of subjects with schizophrenia and BPD1. Relationships between experimental parameters and potential confounding factors were analysed using Pearson single product moment correlations calculated using an assumed straight line fit. All analyses were completed using GraphPad Prism version 4.0 (GraphPad Software Inc., San Diego, CA, USA).
Results
Studies in human central nervous system
Restriction fragment differential display
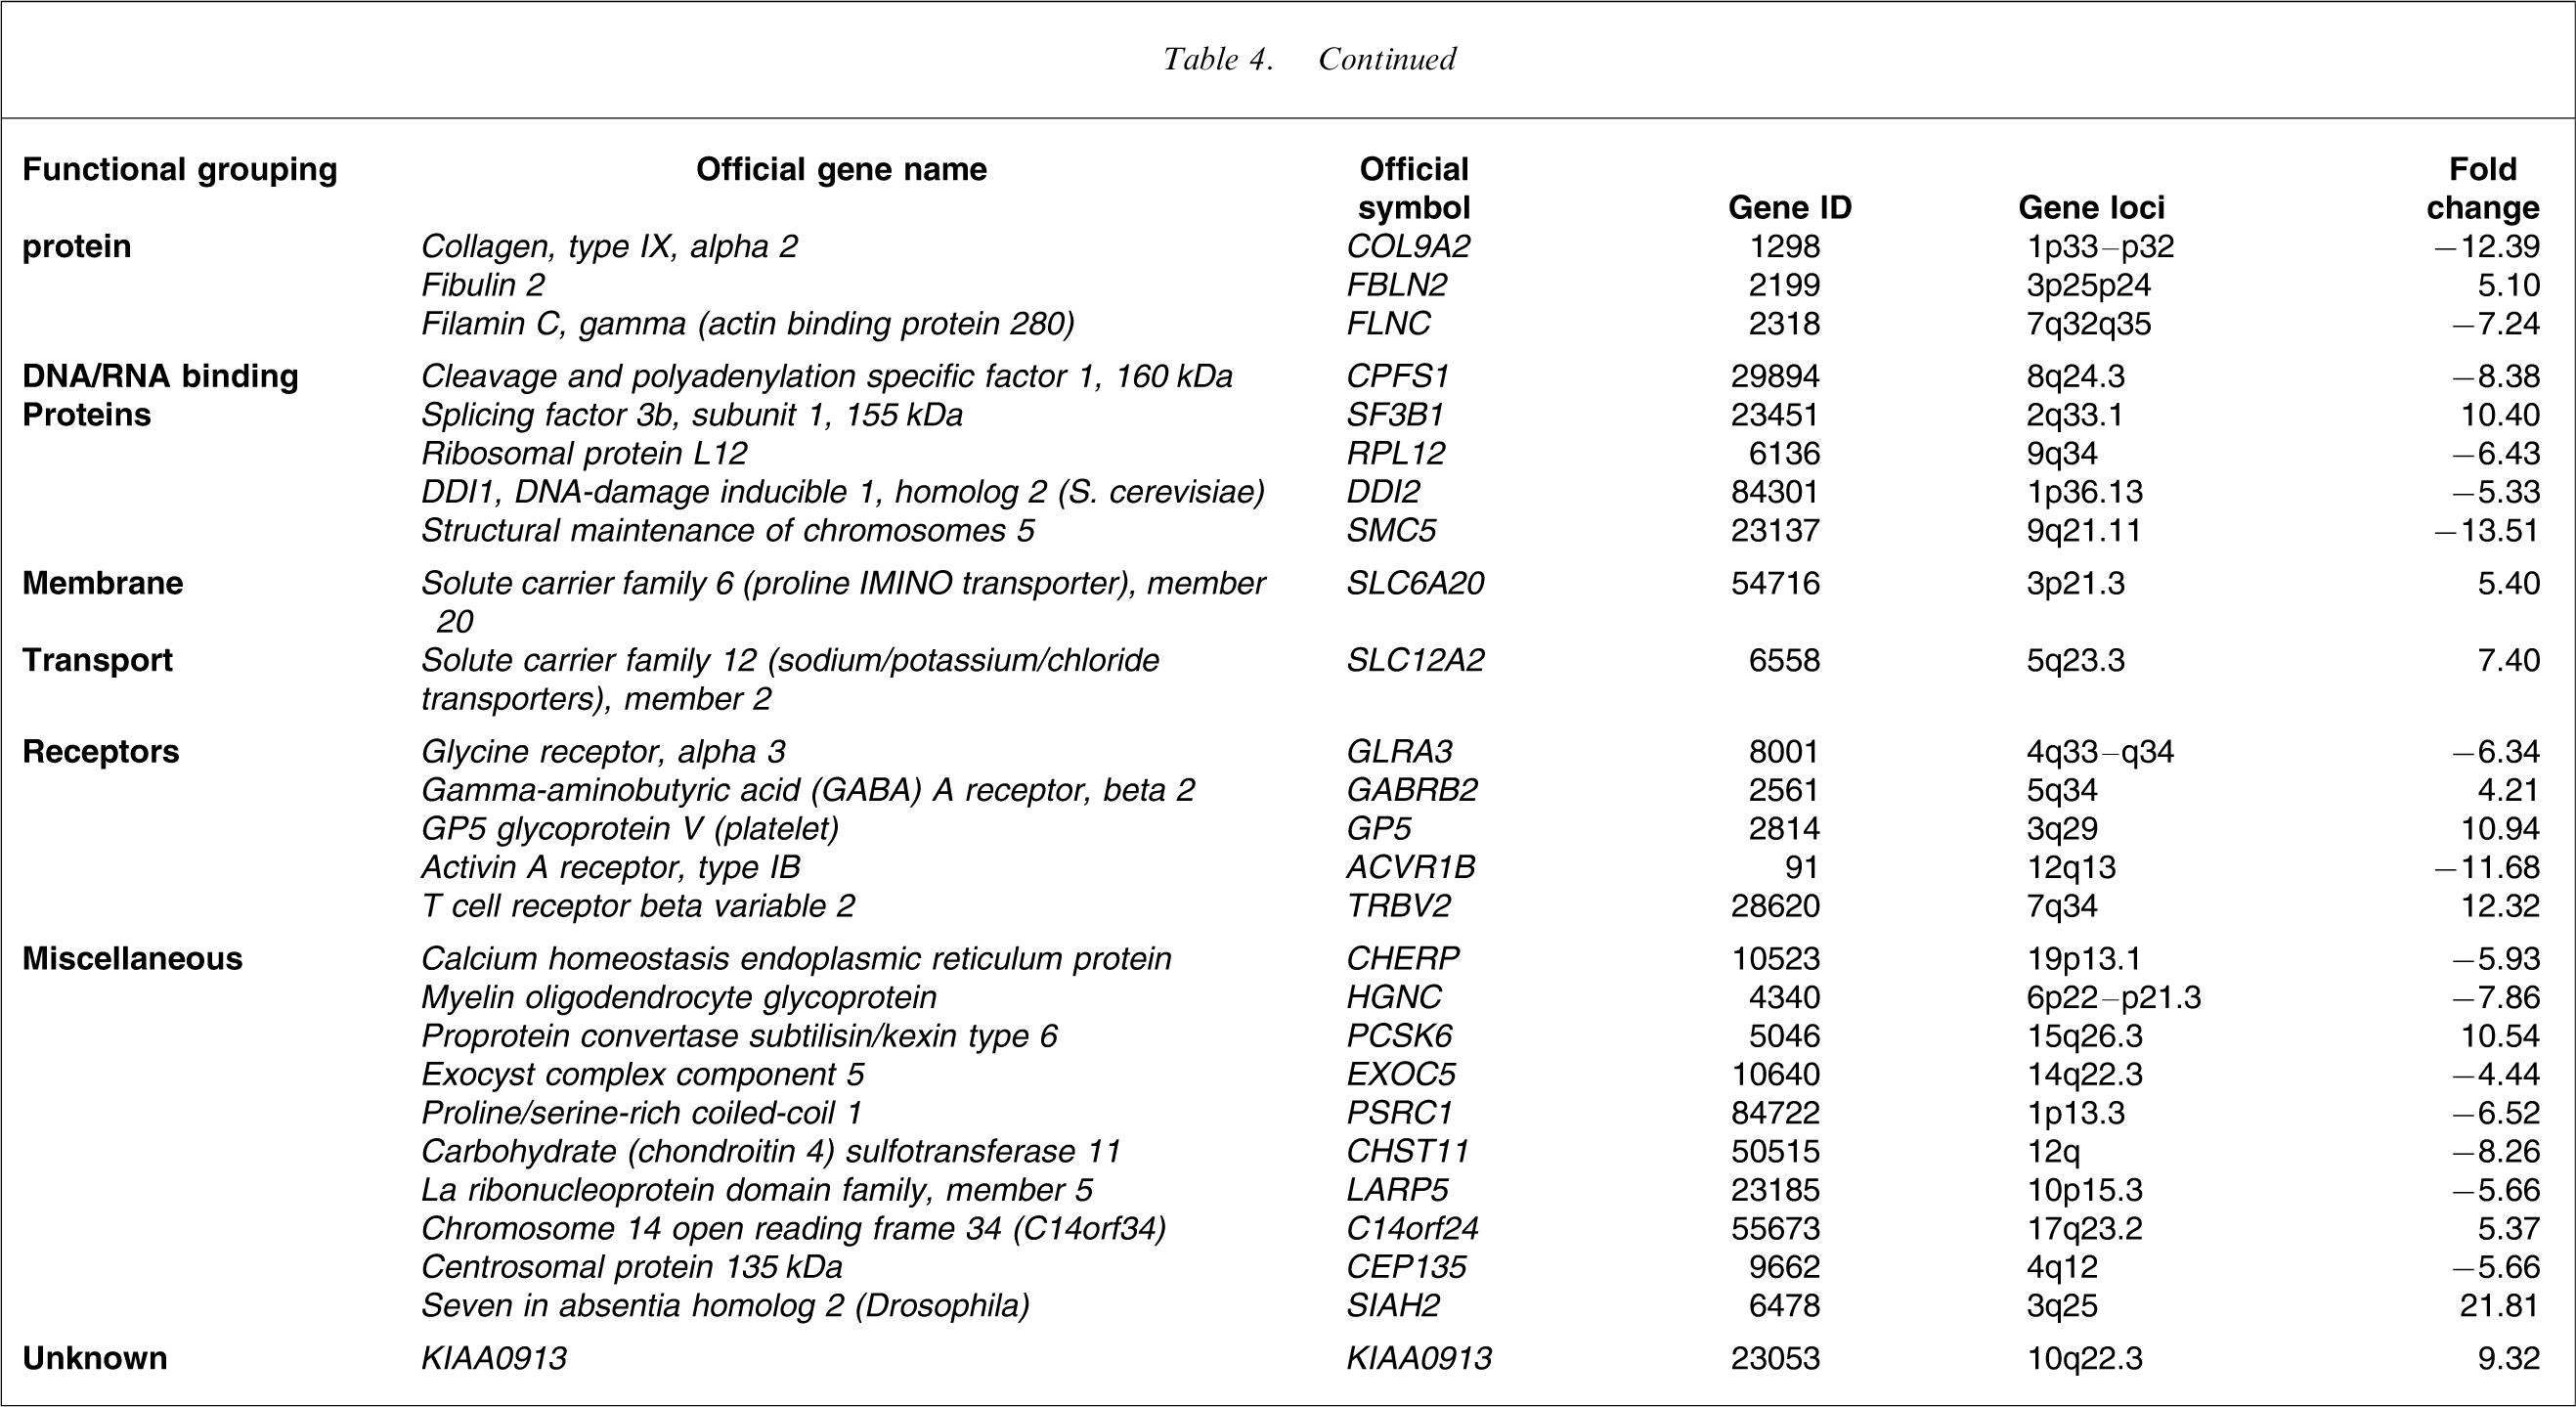
RFDD allowed the visualization of approximately 12 500 gene fragments in the pools of mRNA prepared from BA 46 from 10 schizophrenia and 10 control subjects. Using our stated criteria, 62 mRNAs were shown to be present at altered levels in tissue from subjects with schizophrenia (Table 4), with mRNA from 26 genes (41.9%) being present at higher levels. On dividing the differentially expressed genes in BA 46 into families, based on broad functional relationships, genes encoding receptors and membrane transport proteins as well as those involved in signal transduction, cell adhesion, development, transcription, DNA/RNA binding, energy/metabolism and cell structure/matrix seemed particularly affected in schizophrenia. The 62 genes were distributed across most chromosomes (1–19, 21 and X) and the function of one gene is yet to be defined (Table 4).
Genes with altered levels of expression in BA 46 from subjects with schizophrenia
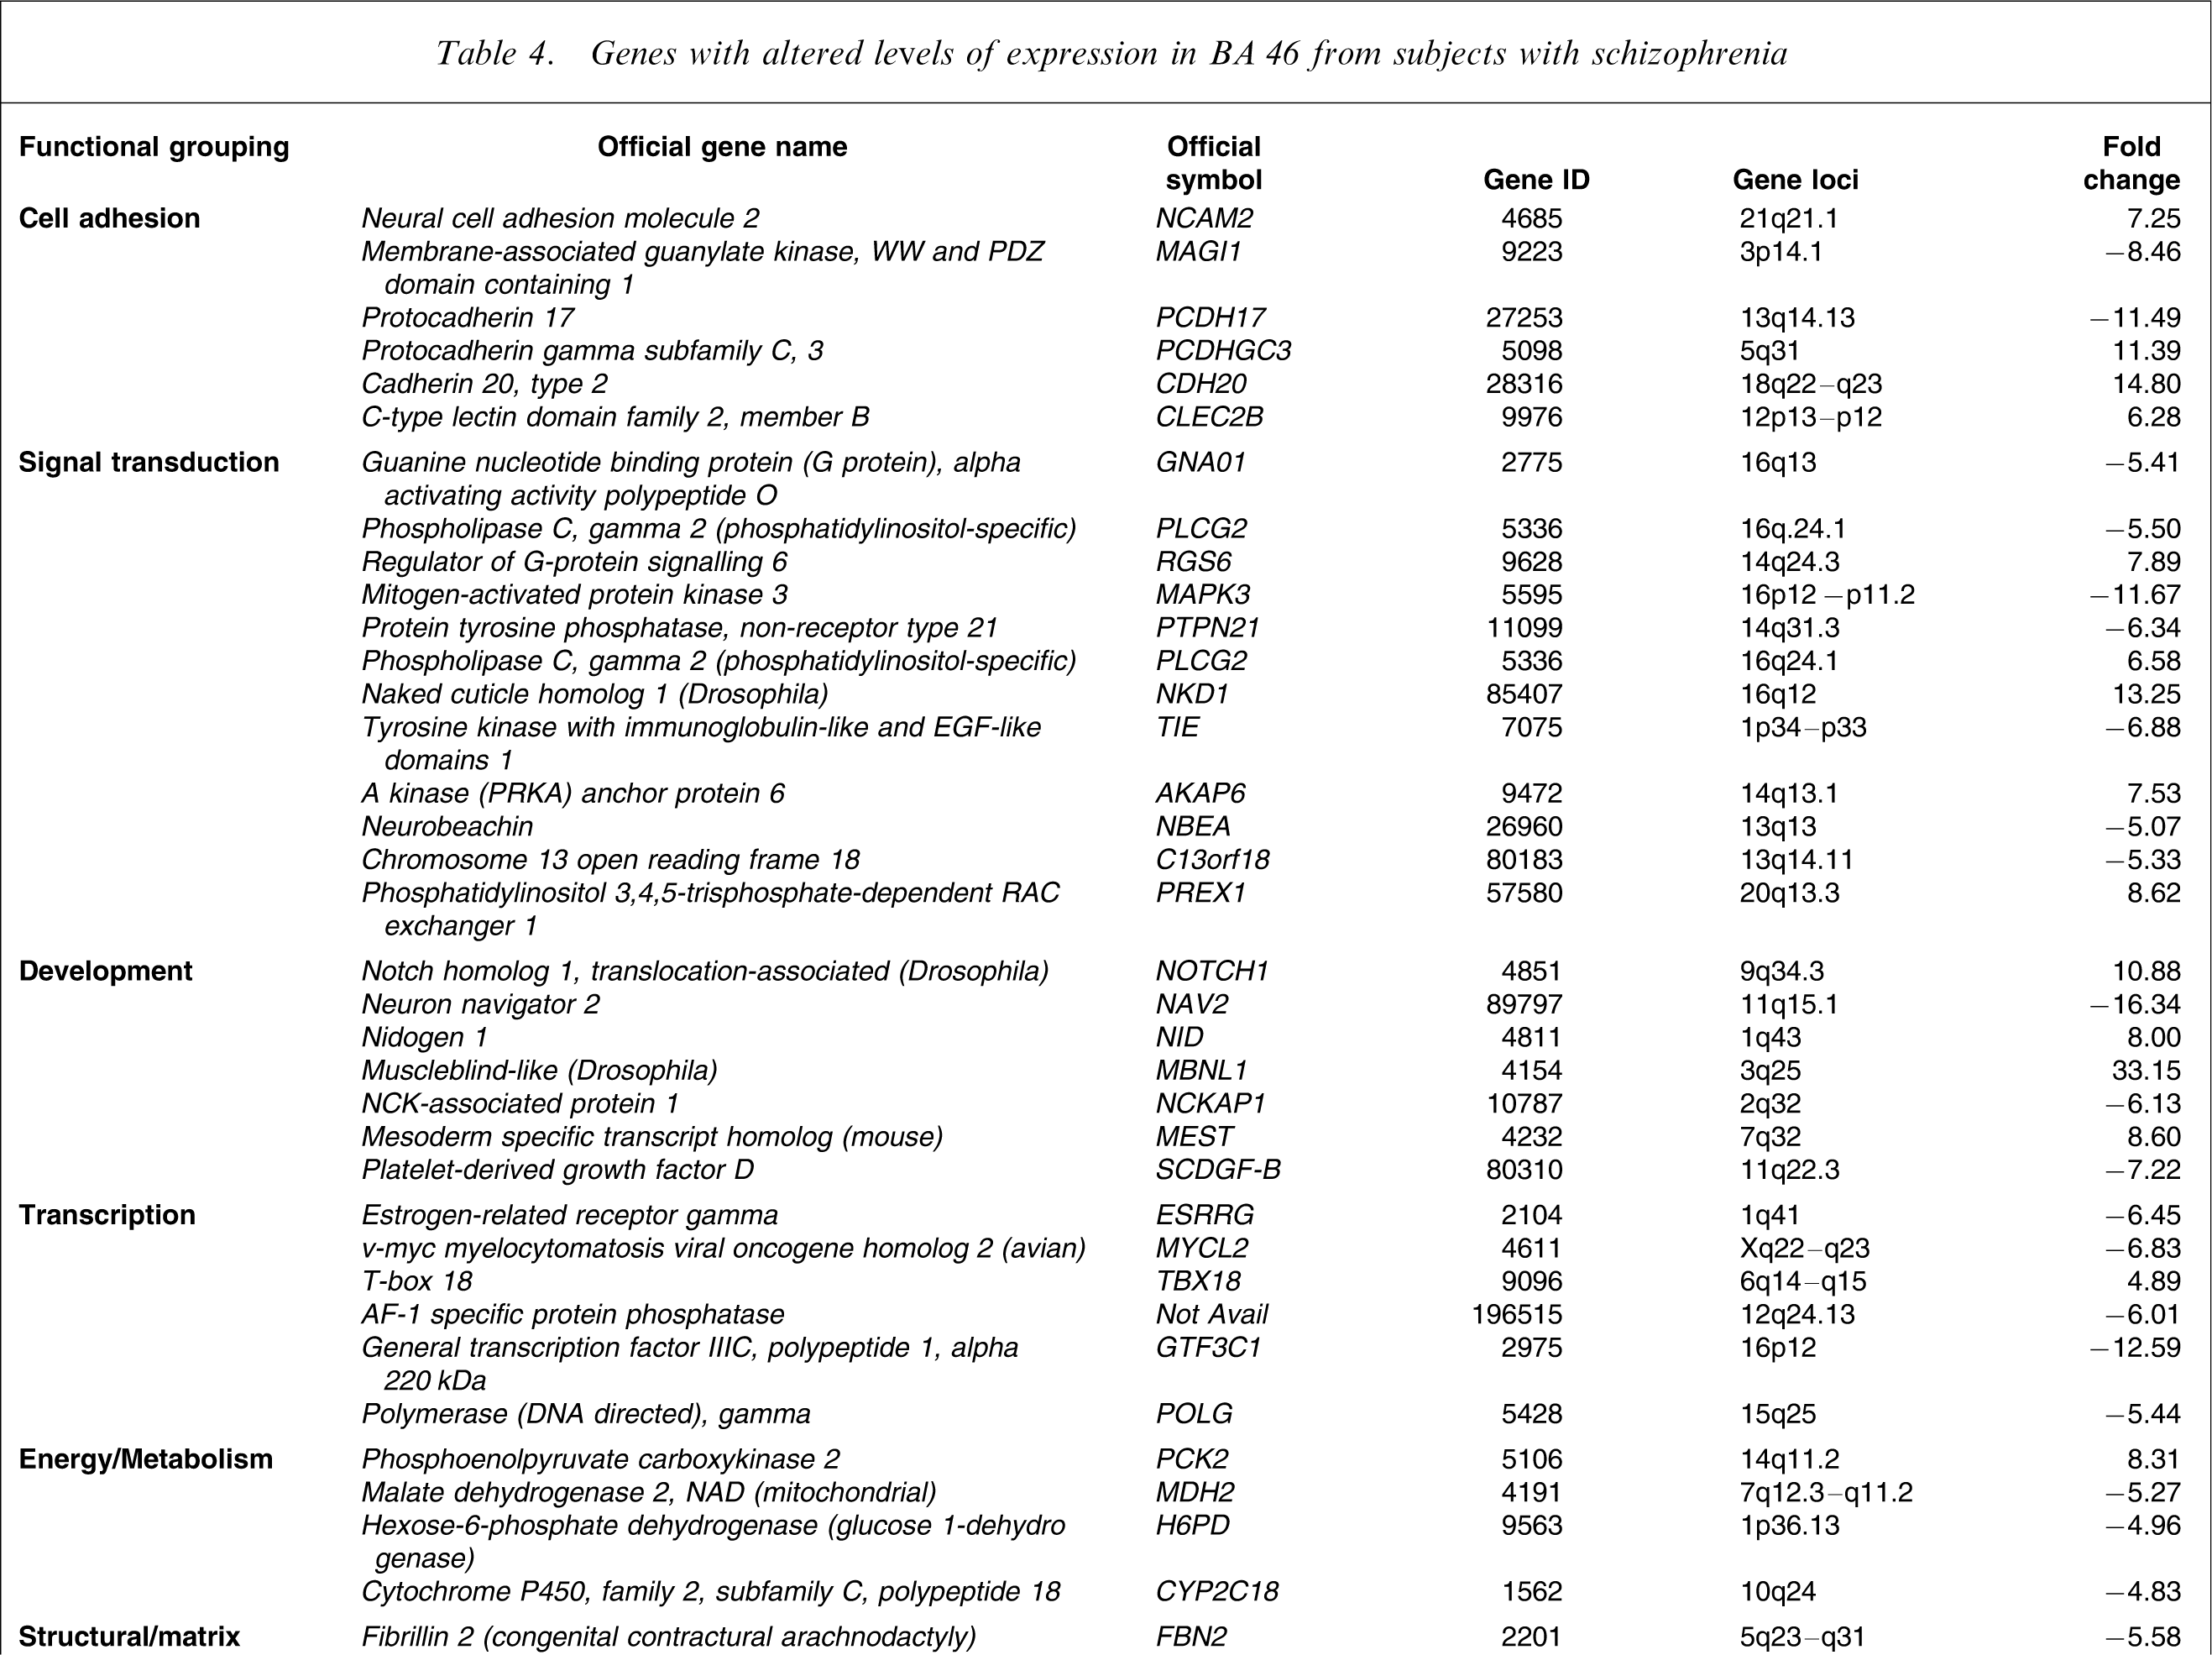
On completion of RFDD three genes were selected for further investigation. Two of these genes, MBNL1 and protocadherin 17 (PCDH17), were chosen because the mRNA from these genes was shown to be robustly increased and deceased in schizophrenia, respectively. The third gene, dissociated in schizophrenia 1 (DISC1), was chosen because it appears to be a strong candidate gene for schizophrenia and because mRNA levels for that gene were not changed according to RFDD [24].
Real-time polymerase chain reaction
There was significant variation in the level of MBNL1 mRNA in BA 46 (F = 9.82, df = 2,67, p = 0.0002) but not in BA 9 (F = 0.74, df = 2,67, p = 0.48) with diagnosis (Figure 1a). Post-hoc analysis showed that the variance in BA 46 was due to a significant increase in the level of MBNL1 mRNA in schizophrenia (mean±SEM: 0.78±0.05 MBNL1/β-actin ratio) compared to that in control subjects (mean±SEM: 0.53±0.04 MBNL1/β-actin ratio, p < 0.01). There was no difference in levels of MBNL1 mRNA in BA 46 from subjects with BPD1 (mean±SEM: 0.41±0.07 MBNL1/β-actin ratio). Further analyses comparing results from SDOI and LDOI subjects showed that there was a significant increase in levels of MBNL1 mRNA in BA 46 from SDOI subjects compared to their matched controls (mean±SEM: 0.87±0.08 vs 0.48±0.06 MBNL1/β-actin ratio, p < 0.0001; Figure 1b). By contrast, MBNL1 mRNA did not differ in BA 46 from LDOI subjects and their age- and sex-matched controls (mean±SEM: 0.69±0.06 vs 0.58±0.07 MBNL1/β-actin ratio, p = 0.26). There were no relationships between levels of MBNL1 mRNA and any subject demographic or tissue collection variables.
Expression levels (mean±SEM), determined using real-time polymerase chain reaction and normalized to β-actin, of muscleblind protein 1 (MBNL1) in (a) Brodmann area (BA) 46 and BA 9 from 30 subjects with (▪) schizophrenia, eight subjects with bipolar 1 disorder and 30 (□) control subjects and in (b) BA 46 from 15 subjects with schizophrenia short duration of illness (SDOI) <7 years and 15 subjects with schizophrenia long duration of illness (LDOI) >22 years with their appropriately matched controls. ∗∗p < 0.01; ∗∗∗p < 0.001.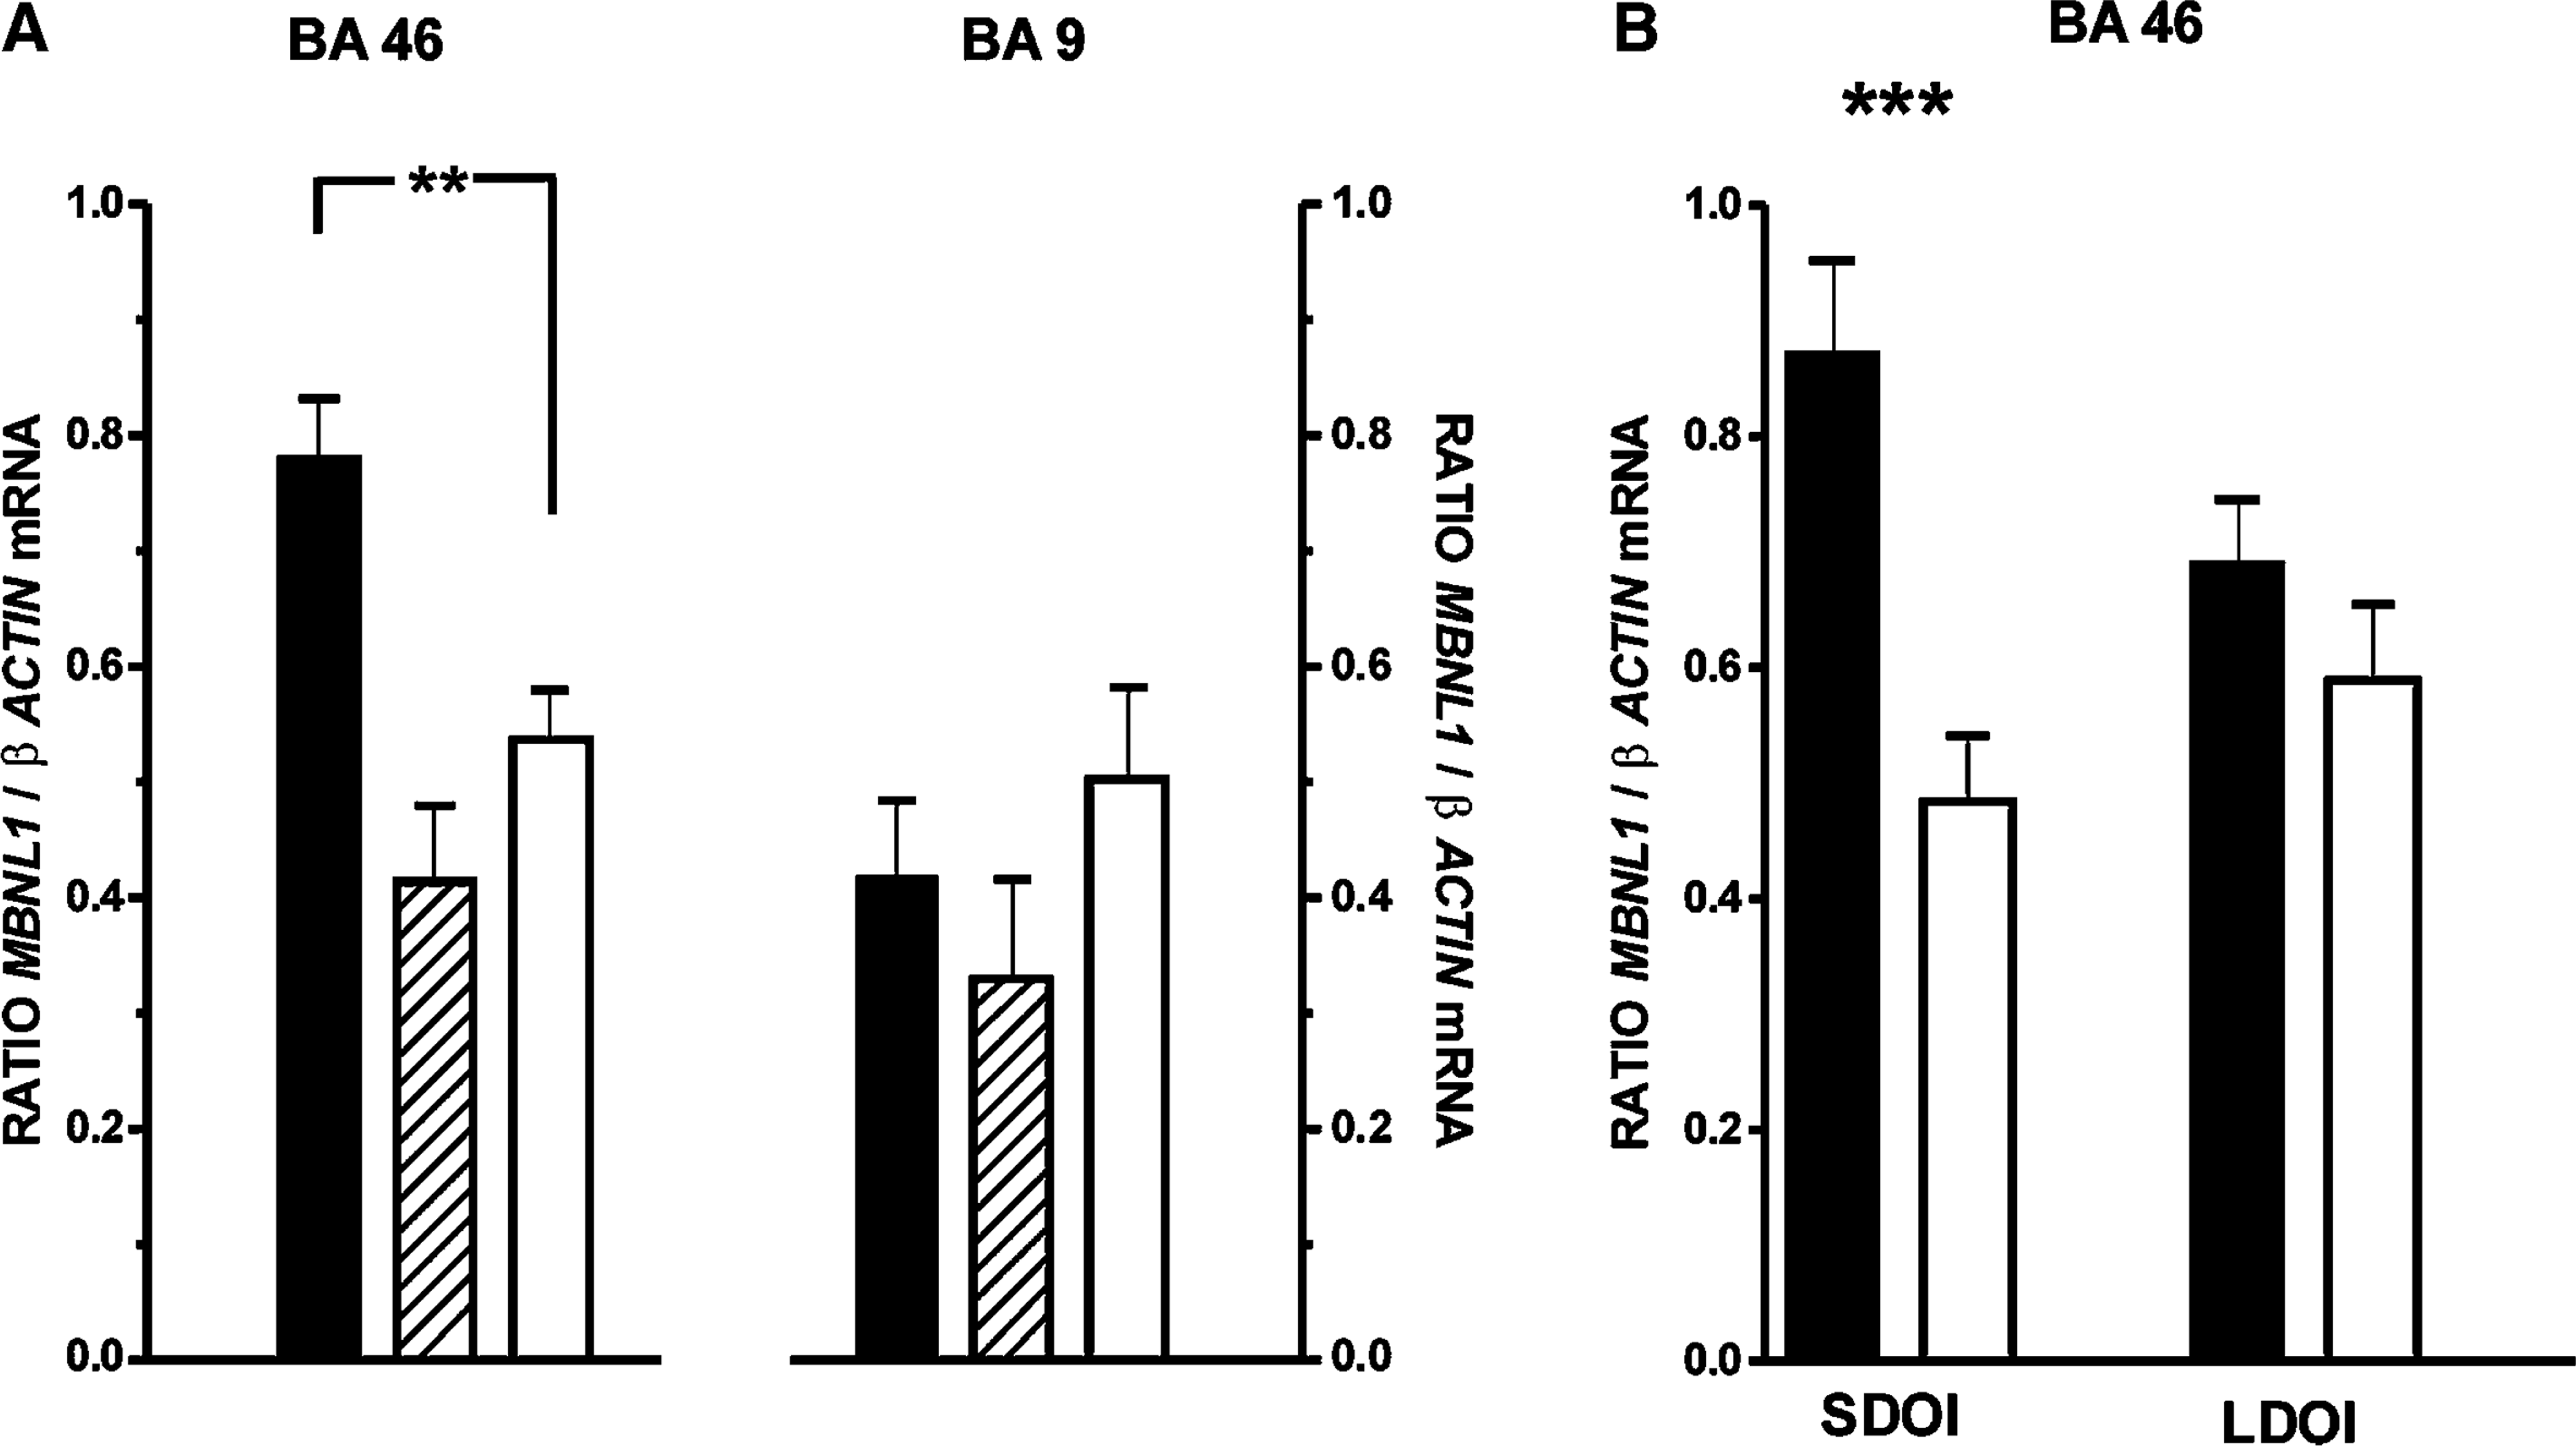
Levels of PCDH17 mRNA showed significant variation with diagnosis in BA 46 (F = 5.70, df = 2,67, p = 0.005) and BA 9 (F = 3.74, df = 2,67, p = 0.03; Figure 2a). Post-hoc analysis showed that the variance in BA 46 was due to a significant increase in the level of PCDH17 mRNA in the tissue from subjects with schizophrenia (mean±SEM: 2.25±0.32 PCDH17/β-actin ratio) compared to that in tissue from the control subjects (mean±SEM: 1.77±0.19 PCDH17/β-actin ratio: p < 0.05). Despite a lower mean, levels of PCDH17 mRNA did not differ significantly in BA 46 from subjects with BPD1 (mean±SEM: 0.79±0.18 PCDH17/β-actin ratio; p > 0.05) compared to controls. Although global analysis showed that levels of PCDH17 mRNA varied with diagnosis in BA 9, post-hoc analysis did not identify any significant variation between levels of mRNA in tissue from the three cohorts of subjects (mean±SEM: controls = 0.20±0.02 PCDH17/β-actin ratio; schizophrenia = 0.33±0.04 PCDH17/β-actin ratio and BPD1 = 0.15±0.04 PCDH17/β-actin ratio). Hence the global variance in mRNA reflected trends to increased PCDH17 mRNA in schizophrenia and decreased PCDH17 mRNA in BPD1. Significantly, the results from real-time PCR were in the opposite direction to what was predicted from RFDD, in which levels of PCDH17 mRNA were shown to be decreased.
Expression levels (mean±SEM), determined using real-time polymerase chain reaction analysis and normalized to β-actin, of protocadherin 17 (PCDH17) in (a) Brodmann area (BA) 46 and BA 9 from 30 subjects with (▪) schizophrenia, eight subjects with bipolar 1 disorder and 30 (□) control subjects and in (b) BA 46 from 15 subjects) with schizophrenia short duration of illness (SDOI) <7 years and 15 subjects with schizophrenia long duration of illness (LDOI) with their appropriately matched controls. ∗p < 0.05; ∗∗p < 0.01.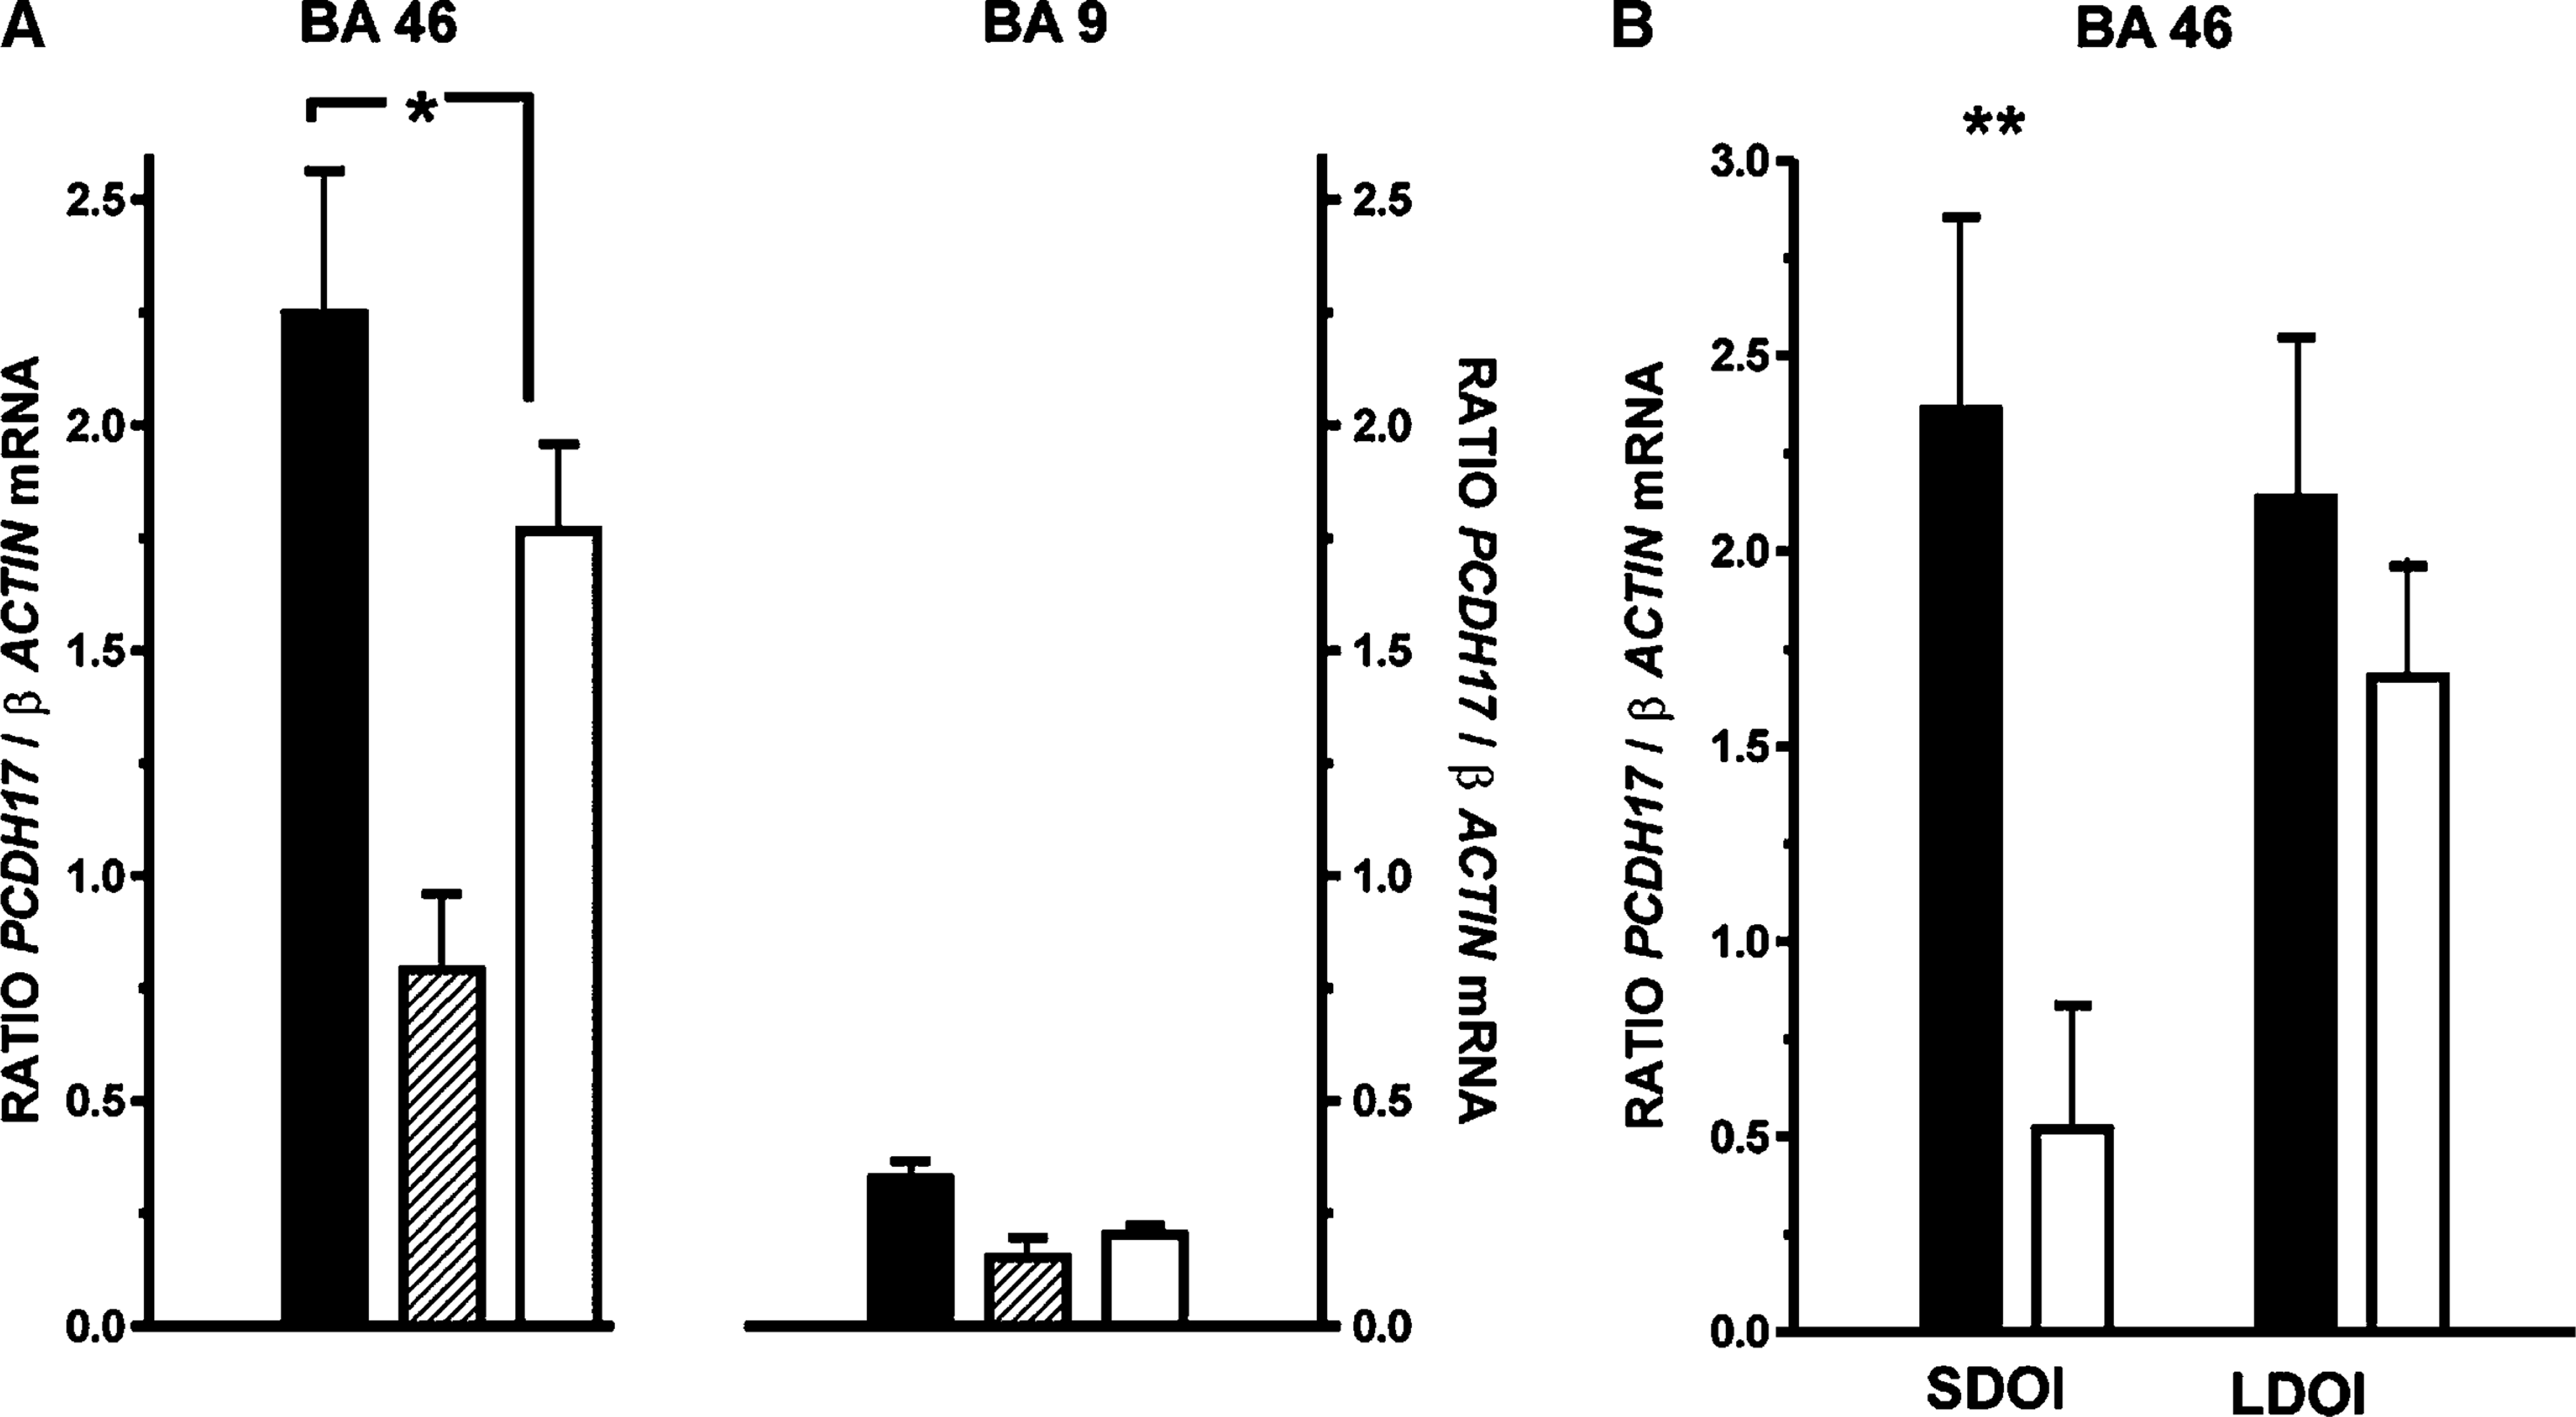
Further analyses, examining the potential temporal effects of DOI, showed that there was a significant increase in levels of PCDH17 mRNA in BA 46 from SDOI subjects compared to their matched controls (mean±SEM: 0.42±0.06 vs 0.21±0.03 PCDH17/β-actin ratio, p < 0.01; Figure 2b). In contrast, levels of mRNA in BA 46 from LDOI subjects (mean±SEM: 0.24±0.03 PCDH17/β-actin ratio) did not vary significantly (p = 0.38) from that in control tissue (mean±SEM: 0.20±0.02 PCDH17/β-actin ratio). There were no relationships between levels of PCDH17 mRNA and any demographic or tissue collection variables.
DISC1 mRNA was measured only in BA 46, where there was no significant variation in the levels of mRNA with diagnosis (mean±SEM: controls = 0.67±0.14 vs schizophrenia = 0.62±0.2 vs BPD1 = 1.1±0.37 DISC1/β-actin ratio, F = 0.66, df = 2,67, p = 0.52). A comparison of DISC1 mRNA in DOI did not show any variance with diagnosis in the SDOI (F = 0.04, df = 1,56, p = 0.83) or LDOI (F = 0.14, df = 1,56, p = 0.7) cohorts. There were no relationships between levels of DISC1 mRNA and possible confounding variables.
MBNL1 mRNA distribution in humans and rats
Studies using PCR and human post-mortem CNS showed abundant levels of MBNL1 mRNA in BA 46 and BA 40 in tissue from three control subjects (Figure 3). At a qualitative level, MBNL1 mRNA was less abundant in BA 9, hippocampus, caudate, putamen, thalamus and amygdala from the same donors. In addition, a qualitative study using RNA prepared from three male and three female rats showed MBNL1 mRNA in CNS, kidney, muscle, stomach, lung, heart, ovary, testis, liver and spleen.
Distribution of muscleblind protein 1 (MBNL1) in tissue from various regions of the (a) human central nervous system (CNS) and (b) different rat tissues; the data shown are from one human subject and one rat but are typical of data from all human subjects and rats studied. Polymerase chain reaction (PCR) was performed on first-strand cDNA prepared from human caudate, putamen, thalamus, amygdala, hippocampus, Brodmann area (BA) 40, 9 and 46 as well as in rat kidney, muscle, stomach, ovaries/testis, lung, heart, liver, spleen and CNS. PCR products were separated on an agarose gel and imaged on a BioRad gel doc system.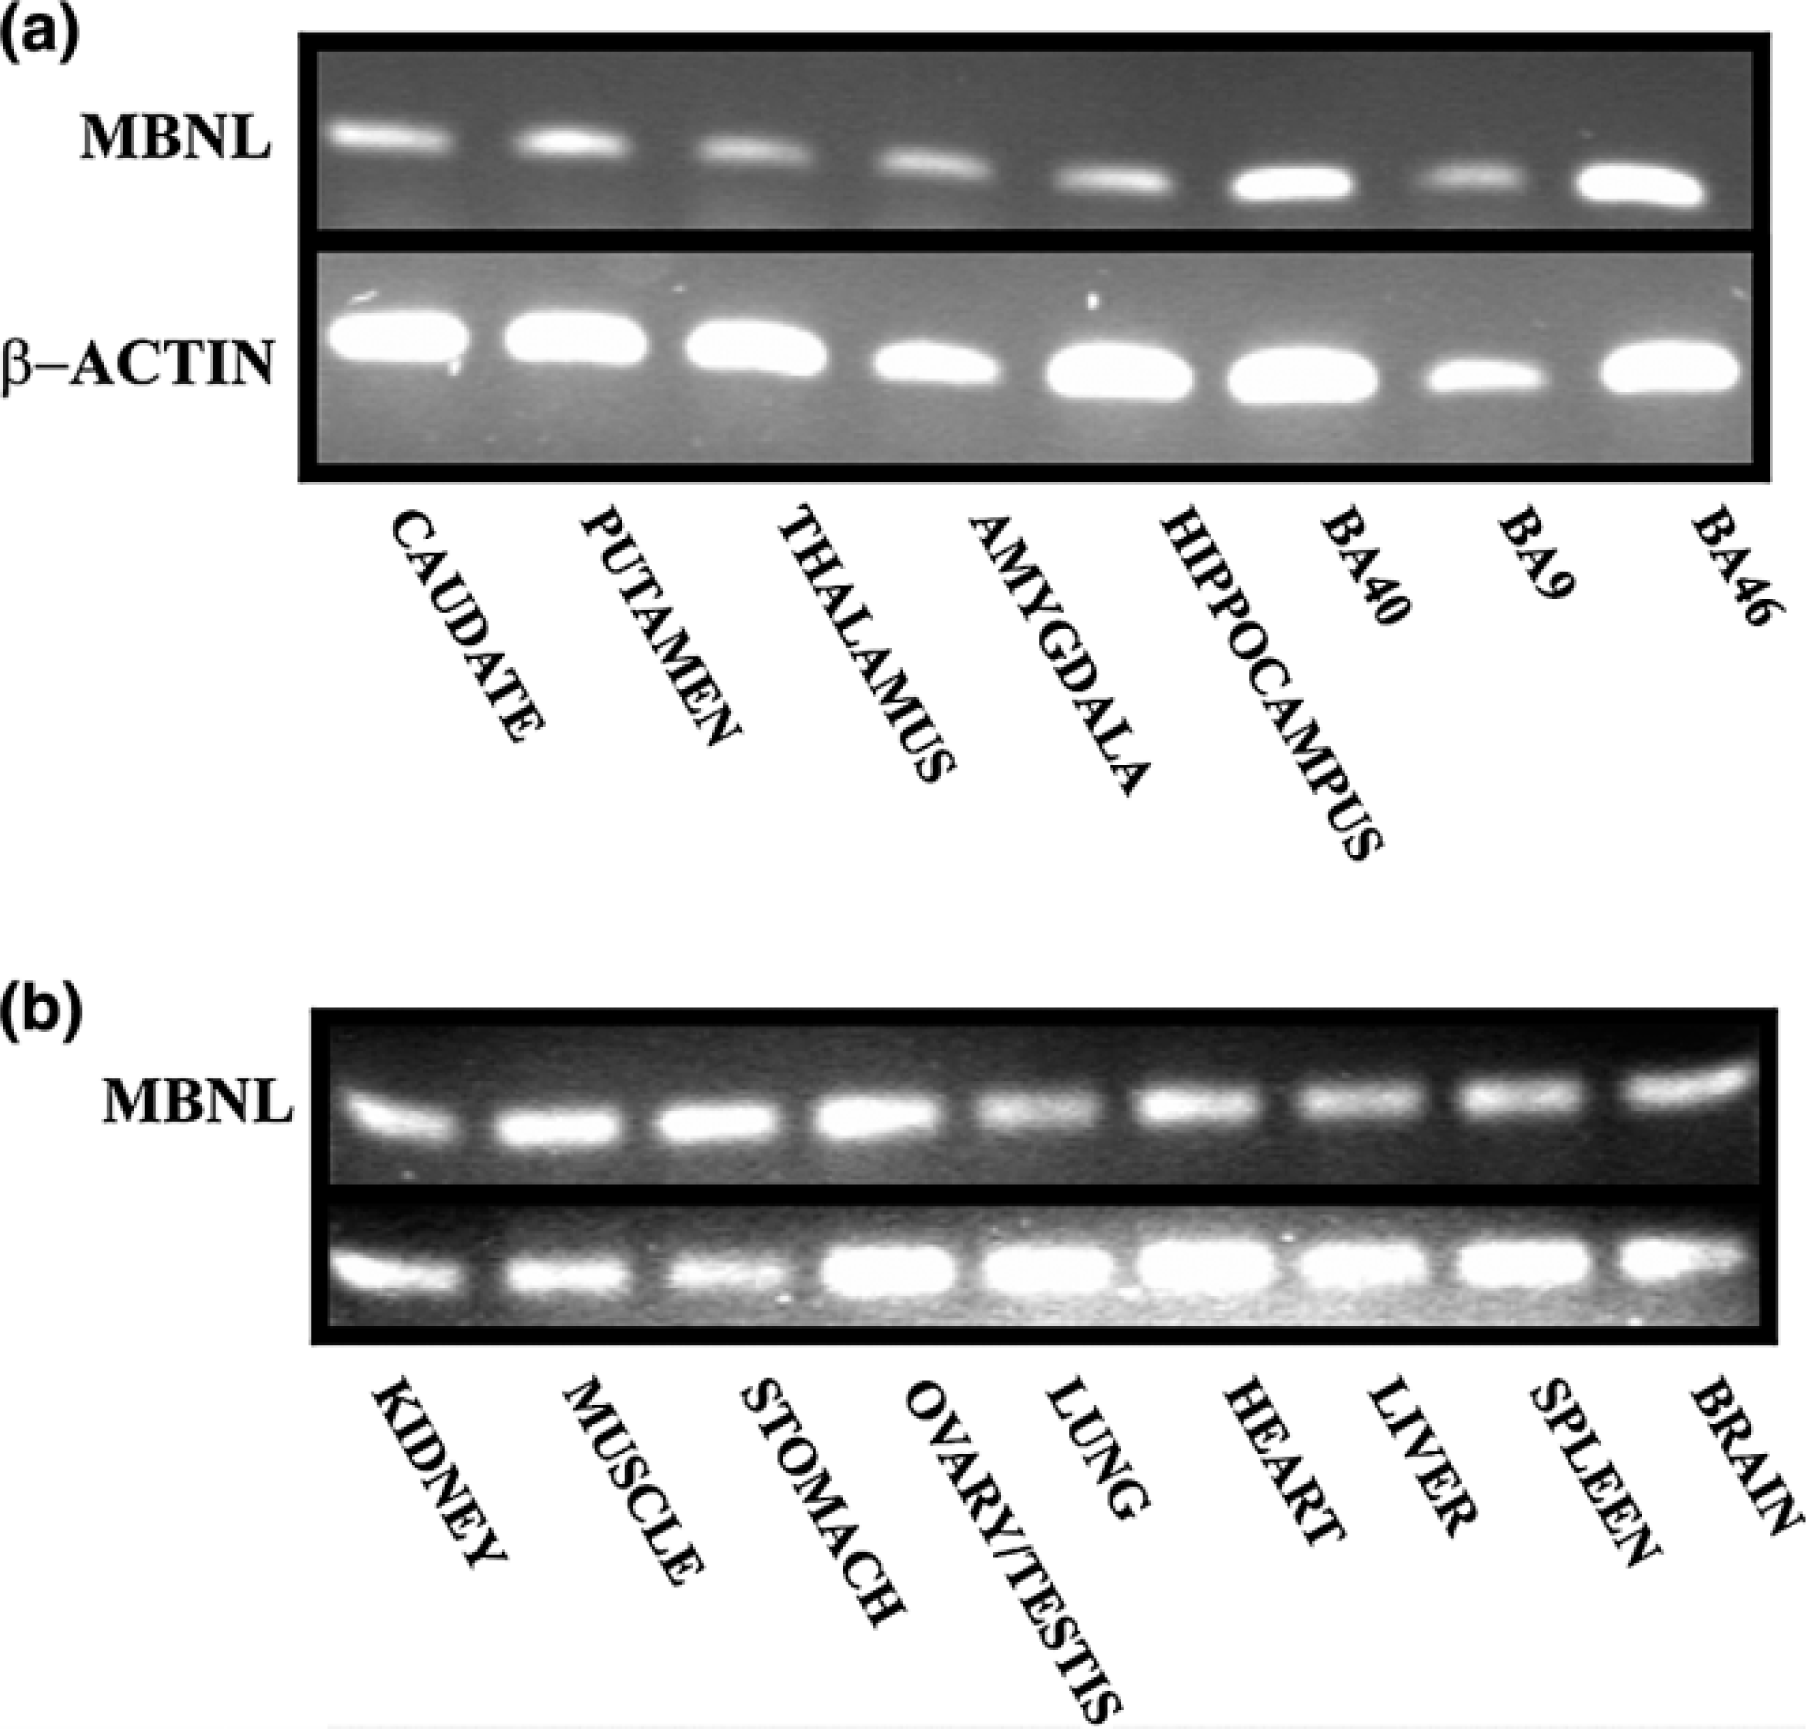
Antipsychotic drug effects on MBNL1 expression
Levels of β-actin did not vary in the cortex of rats that received vehicle or chlorpromazine at different doses (F = 1.08, df = 3,19, p = 0.38). Moreover, levels of MBNL1 mRNA normalized to β-actin did not differ significantly in the cortex of rats treated with vehicle or chlorpromazine (F = 0.86, df = 3,19, p = 0.48; MBNL1 mRNA (mean±SEM), vehicle = 0.06±0.008 vs chlorpromazine 0.01 mg kg−1 day −1
MBNL protein
There was no significant difference in the levels of MBNL protein in BA 46 from subjects with schizophrenia compared to controls (MBNL protein (mean±SEM): schizophrenia = 1.04±0.05 vs controls = 1.04±0.06 ratio IC; p = 0.99) measured using western blot analyses. Moreover, two-way ANOVA showed that there was no significant variance in MBNL levels with diagnosis (F < 0.001, df = 1,56, p = 0.99) or with DOI (F = 0.55, df = 1,56, p = 0.46) and there was no interaction between the variables (F = 0.07, df = 1,56, p = 0.78; MBNL protein (mean±SEM): SDOI schizophrenia = 1.06±0.07 vs controls = 1.08±0.09 ratio IC and LDOI schizophrenia = 1.020.07 vs controls = 1.000.09 ratio IC).
Discussion
We have utilized RFDD to measure the relative expression of approximately 12 500 mRNAs in BA 46 obtained after death from subjects with schizophrenia and in tissue from control subjects. Of these genes, 63 were shown to be differentially expressed in subjects with schizophrenia. This study suggests that genes involved in cell adhesion, signal transduction, development, transcriptional regulation, energy/metabolism and DNA/RNA binding proteins as well as genes encoding receptors, membrane transporters and structure/matrix proteins may be important in the pathology of schizophrenia.
Any comparison between our studies and those completed with microarrays needs to acknowledge the potential impact of methodological differences, differences in CNS regions studied and potentially different genetic backgrounds of the cases studied. However, even with the potential impact of these variables, our study supports previous findings that signal transduction [6, 7], energy/metabolism [8–10] and receptors [6, 12, 13] are all affected in schizophrenia. In addition, we did identify a key myelination gene as having altered expression levels in schizophrenia, supporting the notion that the disorder may involve abnormalities of myelination [14]. Our studies did not identify mRNA from genes involved in presynaptic function [5] or genes in the apolipoprotein family [5] as being abnormally expressed in schizophrenia but such discrepancies could be due to these genes not being amplified by the adaptors used in RFDD. In addition, our data highlight cell adhesion, development, control of structure/matrix and transcription as being particularly affected by the pathology of the disorder. Thus overall, our study using an open mRNA screening system has consolidated existing findings from studies using microarrays but has also expanded knowledge on key CNS systems that might be involved in the pathology of schizophrenia.
Studies on MBNL1
We focused our initial validation studies on the MBNL1 gene partly because of the availability of an antibody that allowed protein measurements. Our initial studies using real-time PCR confirmed that levels of MBNL1 mRNA were increased in BA 46 from subjects with schizophrenia. In addition they showed that this increase had both diagnostic (not different in BPD1) and regional (not altered in BA 9) selectivity. Of equal interest was the finding that the increased level of MBNL1 mRNA was subsequently detectable only in BA 46 from SDOI subjects. While it cannot be totally excluded that these differences are due to the duration of exposure to antipsychotic drugs per se, it would seem that altered levels of MBNL1 mRNA in SDOI schizophrenia is not simply due to exposure to antipsychotic because (i) MBNL1 mRNA was not altered in LDOI subjects or BD subjects who have been exposed to similar levels of antipsychotic drugs; (ii) levels of MBNL1 mRNA did not correlate with the FRADD in SDOI subjects; (iii) there was regional specificity (an outcome difficult to explain as a reaction to antipsychotic drug treatment); and (iv) it was not altered in the cortex of rats treated with an antipsychotic drug. Thus, overall, our finding suggests that the differential expression of genes in the CNS of subjects with schizophrenia may vary with the progression of the illness. Whether such changes in gene expression may in some way correlate with the changing symptom profile, which is suggested to occur with disease progression [25–29], is an important question that needs further investigation.
MBNL1 is one of three muscleblind proteins in the mammalian genome [30], all of which bind to double stranded CUG (dsCUG) RNA. The MBNL1 gene, first identified in Drosophila, was initially shown to be critical in photoreceptor differentiation [31] and subsequently in muscle development [32]. In studies of mammalian cells, the expression of MBNL1 has been shown to be increased in response to growth hormone in a murine 3T3-F442A pre-adipocyte/adipocyte differentiation model [33] and in follicular lymphoma biopsies in which the parent tumour had subsequently differentiated into an aggressive lymphoma [34]. Both these findings are consistent with mammalian MBNL1 playing a role in cellular differentiation. Extrapolating from data on mammalian MBNL1, increased levels of RNA from the MBNL1 gene in BA 46 from subjects with schizophrenia could be a marker of abnormal cellular differentiation or development, either outcome could cause the symptoms associated with the disorder. Significantly, abnormal expression of MBNL1 occurs in myotonic dystrophy [30]. This raises the possibility that abnormalities in muscle function that have been reported in subjects with schizophrenia [35] could be an outcome of abnormal expression of MBNL1 in the periphery. More pertinent to our findings is that subjects with myotonic dystrophy have significant cognitive impairment [36]. This suggests that abnormal expression of MBNL1 in the CNS from subjects with schizophrenia could be involved in the cognitive deficits associated with the disorder [37].
Our studies failed to show a change in MBNL protein in BA 46 from subjects with schizophrenia, making interpretation of the mRNA more difficult. Simplistically, the protein data could be interpreted as showing that changes in MBNL1 expression have not impacted on levels of encoded protein and hence MBNL function. However, an increasing understanding of the complexities involved in the generation of protein from genes [38] and the ability of RNA to modulate cellular function [39] makes such a conclusion both dated and presumptive. A more comprehensive understanding of the possible impact of overexpressing MBNL1 gene will be required to understand what role that gene may play in schizophrenia, particularly because MBNL1 has recently been shown to be important in the processes of regulating alternative splicing [40], a process critical in regulating normal protein expression [41].
Studies on DISC1
Both RFDD and real-time PCR showed that DISC1 mRNA was not altered in BA 46 from any diagnostic cohort. These findings support a previous study that showed that levels of DISC1 mRNA is not altered in the DLPFC or hippocampus from subjects with schizophrenia [42]. Because antipsychotic drug treatment in mice has complex effects on DISC1 expression [43] it is possible, but unlikely, that the absence of changed DISC1 mRNA in the CNS of subjects with schizophrenia and BPD1 could be due to antipsychotic drug treatment reversing changes in DISC1 expression in drug-naïve individuals. Importantly, the DISC1 gene has been proposed as a candidate gene for schizophrenia [44]. The notion that the DISC1 gene could be a candidate gene for schizophrenia arose from the discovery of a gene translocation in a Scottish family that affected both the DISC1 and DISC2 gene and that the presence of this translocation increased the risk of a family member having a psychiatric illness [24]. Subsequently, a number of studies have shown an association between this chromosomal abnormality and an increased risk of psychiatric illness, two of these studies being focused on the Scottish population as a whole [45, 46]. Other findings supporting DISC1 as a candidate gene for schizophrenia are the demonstration of a linkage between DISC1 and schizophrenia in a Finnish population [47] and haplotype association between the DISC1 gene and schizophrenia in a Taiwanese population [48].
The most obvious mechanism by which a gene mutation might cause some of the symptoms of schizophrenia would be by changing expression levels of the protein encoded by that gene. The present study would suggest that changes in DISC1 expression do not contribute significantly to changes in the molecular cytoarchitecture of the DLPFC in schizophrenia. However, the absence of a change in apparent DISC1 gene expression could be due to a number of factors. For example, there was no apparent association between the DISC1 gene and schizophrenia in a polygenetic population [49], which is more likely to be reflective of the polygenetic background of the cases used in our RFDD study. It has also been suggested that the translocation of DISC1 does not directly affect the expression of that gene but does affect the expression of other genes affected by the translocation [42], an hypothesis in line with the data on DISC1 in this study.
Studies on PCDH17
Unlike the agreement obtained between RFDD and real-time PCR on the expression of MBNL1 and DISC1, RFDD suggested that levels PCDH17 mRNA was decreased in schizophrenia but real-time PCR showed levels of mRNA to be increased in BA 46 and not changed in BA 9 from subjects with the disorder. These data show that, as with microarrays [6, 50], not all findings using high-throughput screening are readily translatable to other technologies. However, in the present study it is important to note that PCDH17 mRNA was first amplified in the RFDD methodology with non-specific primers whereas the real-time PCR primers were designed to amplify all PCDH17 mRNA. Therefore, because the PCDH17 gene is expressed in multiple splice forms [51], our data could indicate that there are differential changes in expression of the spliced variants of the PCDH17 gene in schizophrenia.
PCDH17 is a member of a family of approximately 80 proteins; the protocadherins being the largest group in the cadherin superfamily [52]. The exact role of PCDH17, formally PCDH 68, is yet to be elucidated [53]. However, the protocadherin family are known to be involved in the segregation of neuronal precursor populations, axonal outgrowth and synaptic formation [53] and clearly alterations in any of these functions could contribute to the onset of schizophrenia. Our study is focused on measuring levels of gene expression in the mature human CNS, where it is most likely the protocadherins are involved in synaptic formation, and therefore our findings would support the hypothesis that schizophrenia is a disorder of the synapse [4, 54].
In conclusion, the use of RFDD has identified changes in gene expression in BA 46 from subjects with schizophrenia and hence reinforced the argument that screening of the transcriptome in schizophrenia will identify new candidate markers for the disorder [55]. In addition, our validation studies have shown that understanding the role of such new candidate markers in schizophrenia is a major challenge that follows the creation of transcriptomic data sets for schizophrenia. Finally, a significant outcome from our early validation studies is that gene expression may change significantly with advancing duration of illness, as typified by our data on MBNL1 and PCDH17 in tissue from SDOI and LDOI subjects. This hypothesis deserves further exploration because it suggests that a critical period for changes in gene expression may be early after the onset of the disorder.
Footnotes
Acknowledgements
BD is an NHMRC Senior Research Fellow (400016). ES is the Ronald Phillip Griffith Research Fellow at the University of Melbourne and NARSAD Young Investigator. This research was supported by NHMRC Project Grant 192399, NIH R01 grant MH069691-01A1 and a Stanley Research Centre Grant.