
Abstract
Keywords
The Strengths and Difficulties Questionnaire (SDQ) is a brief questionnaire used to assess the psychological adjustment of children and youth [1]. The SDQ includes versions for parents, teachers, and child self-report. It was developed and tested in the United Kingdom on a large sample of 10,438 children aged 5–15 years [1] The SDQ is now used in a number of countries and has been extensively evaluated in epidemiological, developmental, and clinical studies internationally [2]. In Australia, the SDQ is routinely used in Child and Adolescent Mental Health Services (CAMHS) as a pre-treatment, post-treatment and follow-up measure.
The SDQ as a clinical tool has shown the capacity to identify psychiatric illness with a specificity of 94.6% and a sensitivity of 63.3% when data are collected from multiple informants of parent, teacher and child [3]. Mathai et al.[4] examined the agreement between clinical diagnoses for clients attending CAMHS in Melbourne with SDQ data from parents and teachers and found agreement was moderate to high, ranging from 0.39 to 0.56. While the capacity to predict psychiatric disorders using the SDQ is increased when measures are collected from multiple informants [3]. However, Goodman has noted that if this is not feasible, parent and teacher reports are roughly of equal predicative value [3]. Information from teachers is slightly more useful for predicting conduct or hyperactivity disorder, while parent reports are slightly more useful for predicting emotional disorders [3]. In Australia, studies providing representative norms from community and clinical populations are needed.
Some differences in the SDQ factor structure have been shown across different cultures. The SDQ has a five-factor structure measuring problems across the domains of emotion, conduct, hyperactivity, prosocial, and peer behaviours. The SDQ also provides a total difficulties score and an impact score reflecting the effect that difficulties are having on the child's home and school life. Exploratory factor analysis of the SDQ completed in Sweden, Britain and Germany have confirmed independent scores for each of the five subscales of the SDQ [1, 5, 6]. Recent analyses of normative data on a large US sample of 9574 children revealed some variation in factor loadings and the authors have suggested that interpretation of some items might be different for American respondents than for European respondents [7]. Specifically, being disobedient, lacking a good friend, and being unpopular were more closely related to prosocial problems than to conduct or peer problems [7]. Dickey and Blumberg [7] used exploratory factor analysis to reveal three correlated factors on the SDQ of externalizing behaviour, internalizing behaviour, and positive behaviour. While they supported the use of the SDQ in the US, they also concluded that British scales may not be appropriate for an American sample. It follows that the appropriateness of international norms for Australian children requires examination and verification.
Australian parent-reported data on the SDQ have been assessed using a large community sample of children aged 4–9 years [8]. Analyses supported normative data with clinical cut-off scores, and banding provided for scores representing the top 5% and 10% of children. The results supported the five-factor structure and demonstrated significant correlations between diagnostic interviews and the SDQ subscales published by Goodman [8]. Analyses of parent and teacher reports of 917 people/children aged 7–17 years recruited from 127 schools revealed significant differences between subscales for boys and girls, particularly with greater problems in conduct and hyperactivity scales shown for boys [9]. While these studies have provided good evidence to support the SDQ in Australia, broad-based community norms are still incomplete.
The current study improves community representativeness by providing normative data from an Australian community sample of children in early primary school. This study provides normative data using the teacher-reported version of the SDQ, with teachers completing the questionnaires for the majority of their class.
Method
Participants
Participants in the current study were 1928 primary school students in grades Prep, 1 and 2 (hereafter P–2). This is the first 3 years of primary school in Victoria. The data were collected from 88% of all P–2 students in the 31 participating schools. The schools were located within regional and rural areas of Victoria, Australia. There were 905 (46.9%) female participants and 1023 (53.1%) male participants. The mean age was 7.70 years (SD = 0.89), with the age range from 5 years to 10 years. The ages of the sample were distributed as follows: 5–5.9 years, 2.8%; 6–6.9 years, 17.6%; 7–7.9 years, 38.9%; 8–8.9 years, 34.9%; and 9–10.0 years, 6.7%.
Measures
The instrument used was the teacher-report version of the Strengths and Difficulties Questionnaire (SDQ) for children aged 4–10 years [3, 10, 11]. The SDQ is a brief behavioural screening questionnaire. It has 25 items on three-point Likert scales. The items are loaded onto five domains of: Emotion symptoms, Conduct problems, Hyperactivity/inattention problems, Peer relationship problems, and Prosocial behaviour, with five items in each domain. Items are summed to create a Total Difficulties score. Teachers also complete five questions on the impact that problem behaviours are having on the child, the chronicity, distress, social impairment on peers and the class, and the burden these difficulties represent to the whole class.
Procedure
The data were collected as part of the CAMHS and School Together (CAST) early intervention program, funded by the Mental Health Branch of the Victorian Department of Human Services. The project provides early intervention services to high-needs children and includes group programs for children, parenting programs for parents as well as professional development and support to the children's teachers. This present screening was conducted to establish the level of behaviour difficulties and strengths across the geographic region. Permission to conduct the screening was obtained from the Ballarat Health Services Human Research Ethics Committee and the Department of Education and Training Research Committee. Teachers were asked to obtain written permission from parents of P–2 students. Teachers were then asked to complete an SDQ on each child in their class. The SDQs were completed during the final term of 2004.
Results
Internal consistency
Data were analysed by first comparing the Australian data set with the published United Kingdom norms for 4801 children aged 5–10 years (evenly distributed for age). The coefficient alphas for the SDQ subscales ranged from 0.65 to 0.91 for each of the subscales (see Table 1) and were within the range of alpha scores reported in the UK sample (0.70 to 0.88) [1]. The distribution of scores was then compared with normative scores provided from the United Kingdom using one-sample t-test comparisons [1]. The total difficulty scores for schools within the Grampians region did not differ significantly with the UK norms. There were some significant differences in gender comparisons between the present and UK samples, as shown in Table 1.
Descriptive statistics for SDQ subscales from UK and Australia
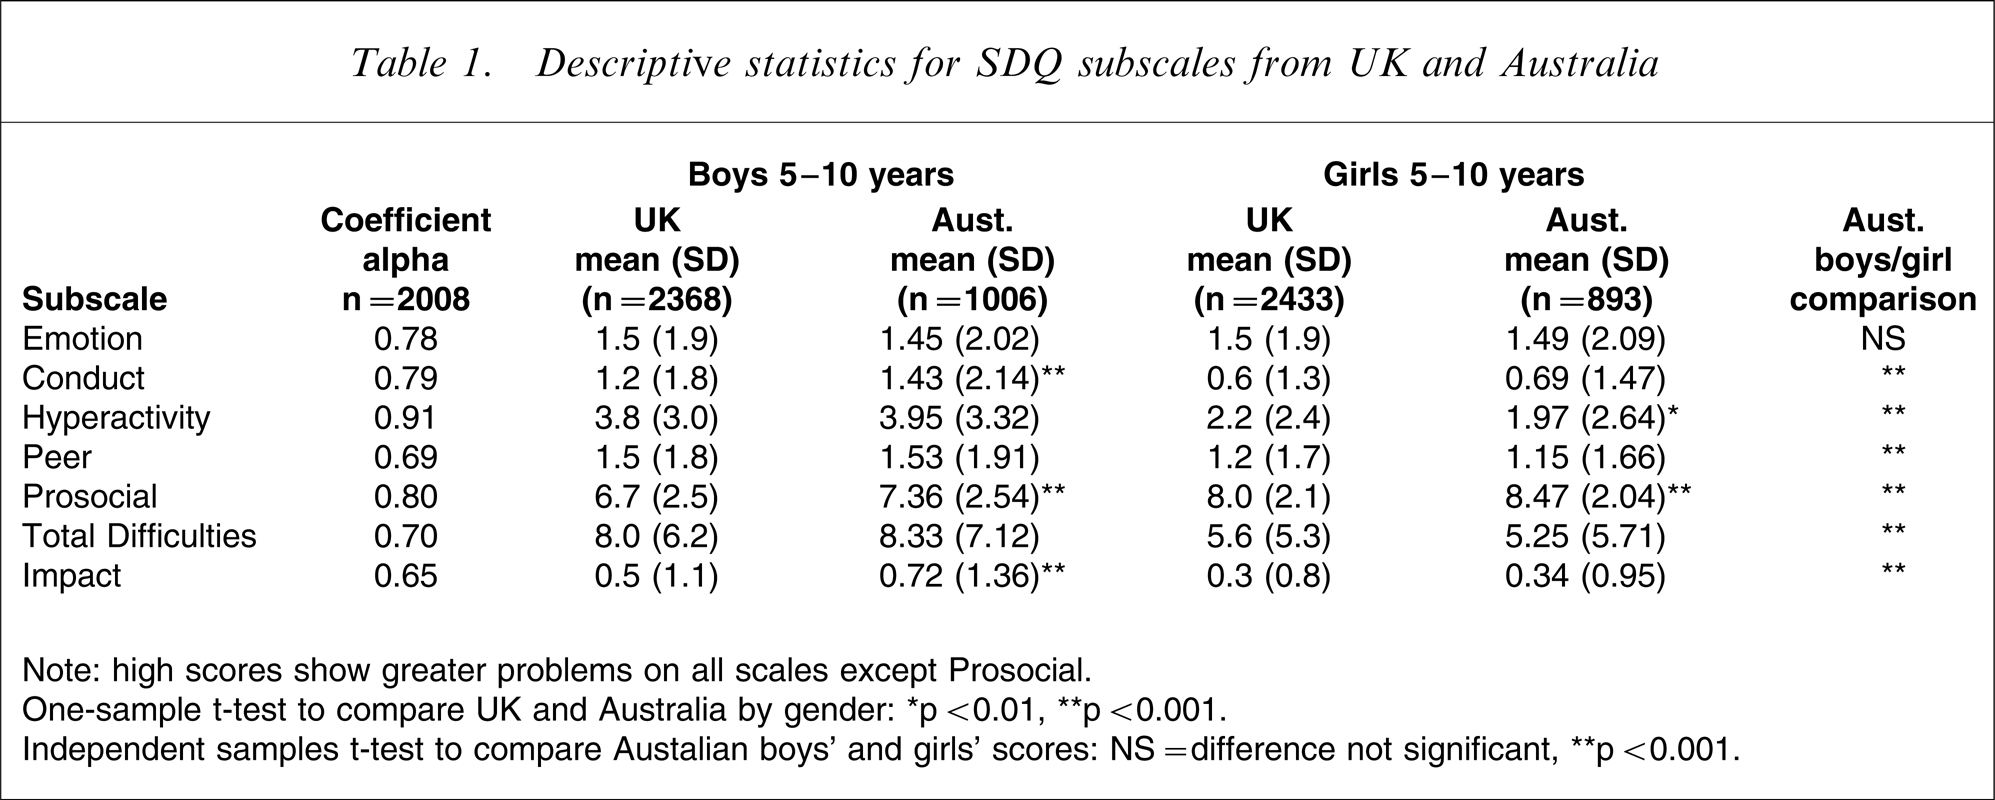
Note: high scores show greater problems on all scales except Prosocial.
One-sample t-test to compare UK and Australia by gender: ∗p < 0.01, ∗∗ p < 0.001. Independent samples t-test to compare Austalian boys’ and girls’ scores: NS = difference not significant, ∗∗p < 0.001.
Clinical scores and comparisons
Comparisons of subscale scores for boys and girls using one-way ANOVA found there was no significant difference between the mean score on Emotional Problems for boys and girls. However, the mean score on the four remaining subscales were significantly higher for boys than for girls (Table 1). For boys, the Conduct subscale mean score showed twice the level of difficulty than girls (boys, mean = 1.43, SD = 2.14; girls, mean = 0.69, SD = 1.47), and this difference was statistically significant when compared using a two-tailed independent samples t-test (t [1894] = 9.02, p < 0.001, 95% CI = 0.59–0.92). Scores on Hyperactivity were also higher for boys (mean = 3.95, SD = 3.32) than girls (mean = 1.97, SD = 2.64) and this was statistically significant (t [1895] = 14.15, p < 0.001, 95% CI = 1.69–2.23). There were also significant differences between boys and girls on the Peer Problems scale (p < 0.001), the Prosocial scale (p < 0.001), the Total Difficulties scale (p < 0.001), and the Total Impact scale (p < 0.001).
Scores on the SDQ were then compared with the clinical cut-off scores provided by Goodman and colleagues on the SDQ website (see www.sdqinfo.com) and also published norms [12]. These scores reflect clinically elevated levels of difficult behaviour in the UK population. The UK clinical cut-offs were derived using three ranges of scores: normal, borderline and clinical (referred to as abnormal in SDQ literature). The normal score represents those scores falling below the 80th percentile. The borderline range represents those scores falling between the 80th and 90th percentile, and the clinical range represents those scores falling between the 90th and 100th percentile (top 10%). As Goodman and colleagues [1] have reported, the SDQ scores are not discrete and therefore sometimes the division approximates the 80th and 90th percentile; for example, the scale might be split at 91% and 9%.
Australian scores on the SDQ at the borderline and clinical cut-off levels and the bandings showing the SDQ scores that fall above the clinical range are shown in Table 2 (top 10% and top 5%). Comparisons between Australian and UK borderline and clinical cut-offs derived from these percentiles show that UK cut-offs approximate the top 20% of scores in this Australian sample, but there are some differences. On the Emotion subscale, Australian teachers reported lower levels of emotional problems than the UK teachers’ scores. On this Emotion scale, the UK scores for the top 20% of borderline/clinical range scores begins at a cut-off score of 5, whereas at this cut-off score only 8.9% of Australian children are represented (3% and 5.9%, respectively). This implies that Australian teachers make different interpretations of emotional symptomatology in young children, and a more representative borderline cut-off could be set at 3, with the clinical cut-off at 4–10 rather than 6–10. For the Hyperactivity scale, 17.1% of the Australian sample fell within the UK clinical range (top 10%), and this represents a one-point change to the clinical cut-off score for Australian children.
Comparison of clinical cut-off scores for Australian and United Kingdom samples
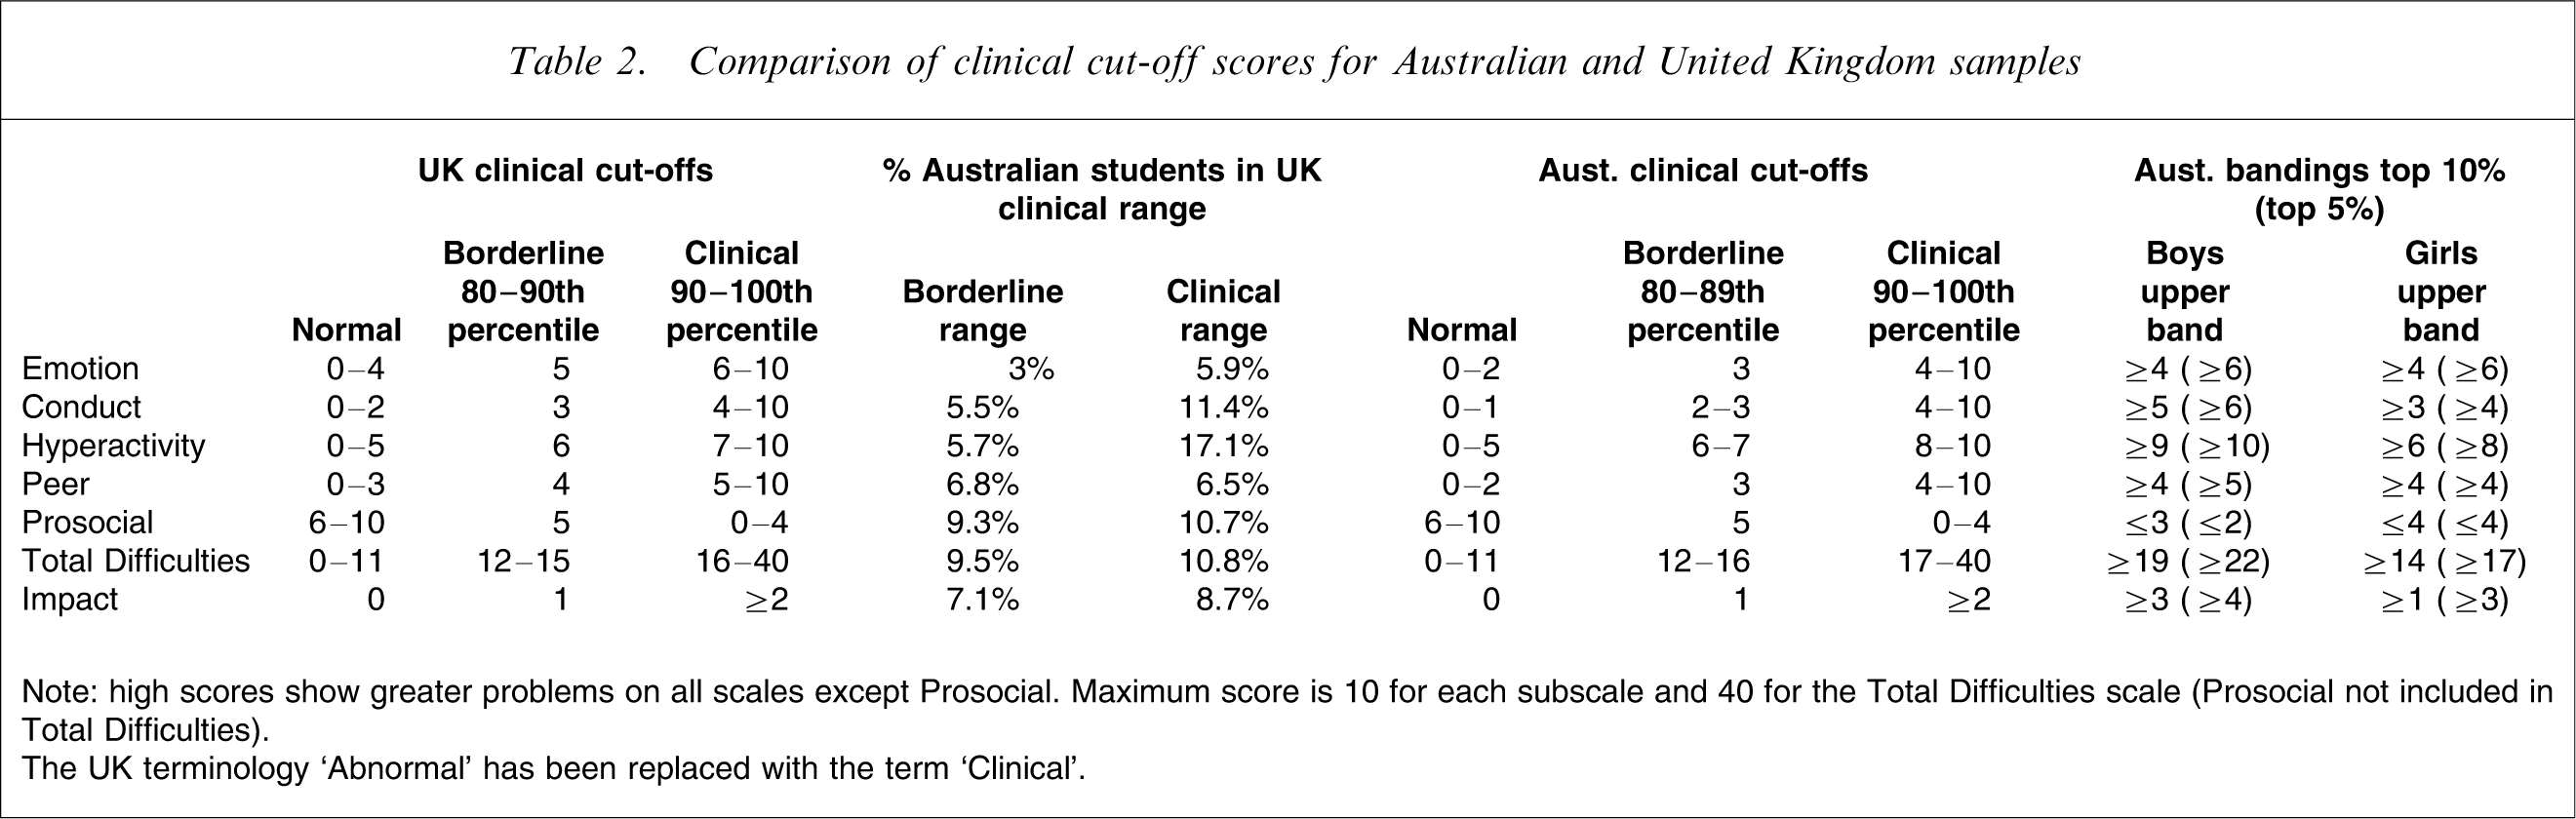
Note: high scores show greater problems on all scales except Prosocial. Maximum score is 10 for each subscale and 40 for the Total Difficulties scale (Prosocial not included in Total Difficulties).
The UK terminology ‘Abnormal’ has been replaced with the term ‘Clinical’.
Following the convention of Hawes and Dadds [8], the banding scores shown in Table 2 provide clinicians with information on extreme scores for boys and girls. Of note are the upper band scores for boys compared with girls on Conduct, Hyperactivity, Total Difficulties and Impact. These bandings reflect a high rate of boys experiencing behavioural difficulty within the school system as reported by teachers.
Factor structure
An analysis of the factor structure underlying this data set was completed using principal component analysis, with varimax rotation, and with separate analyses for boys and girls. The factor structure is shown in Table 3, with correlations of variables listed in Appendix A. There are some differences in item loadings from the factor structure of the UK sample and these differences are noted in the table.
Australian factor analysis for SDQ subscales for girls and boys
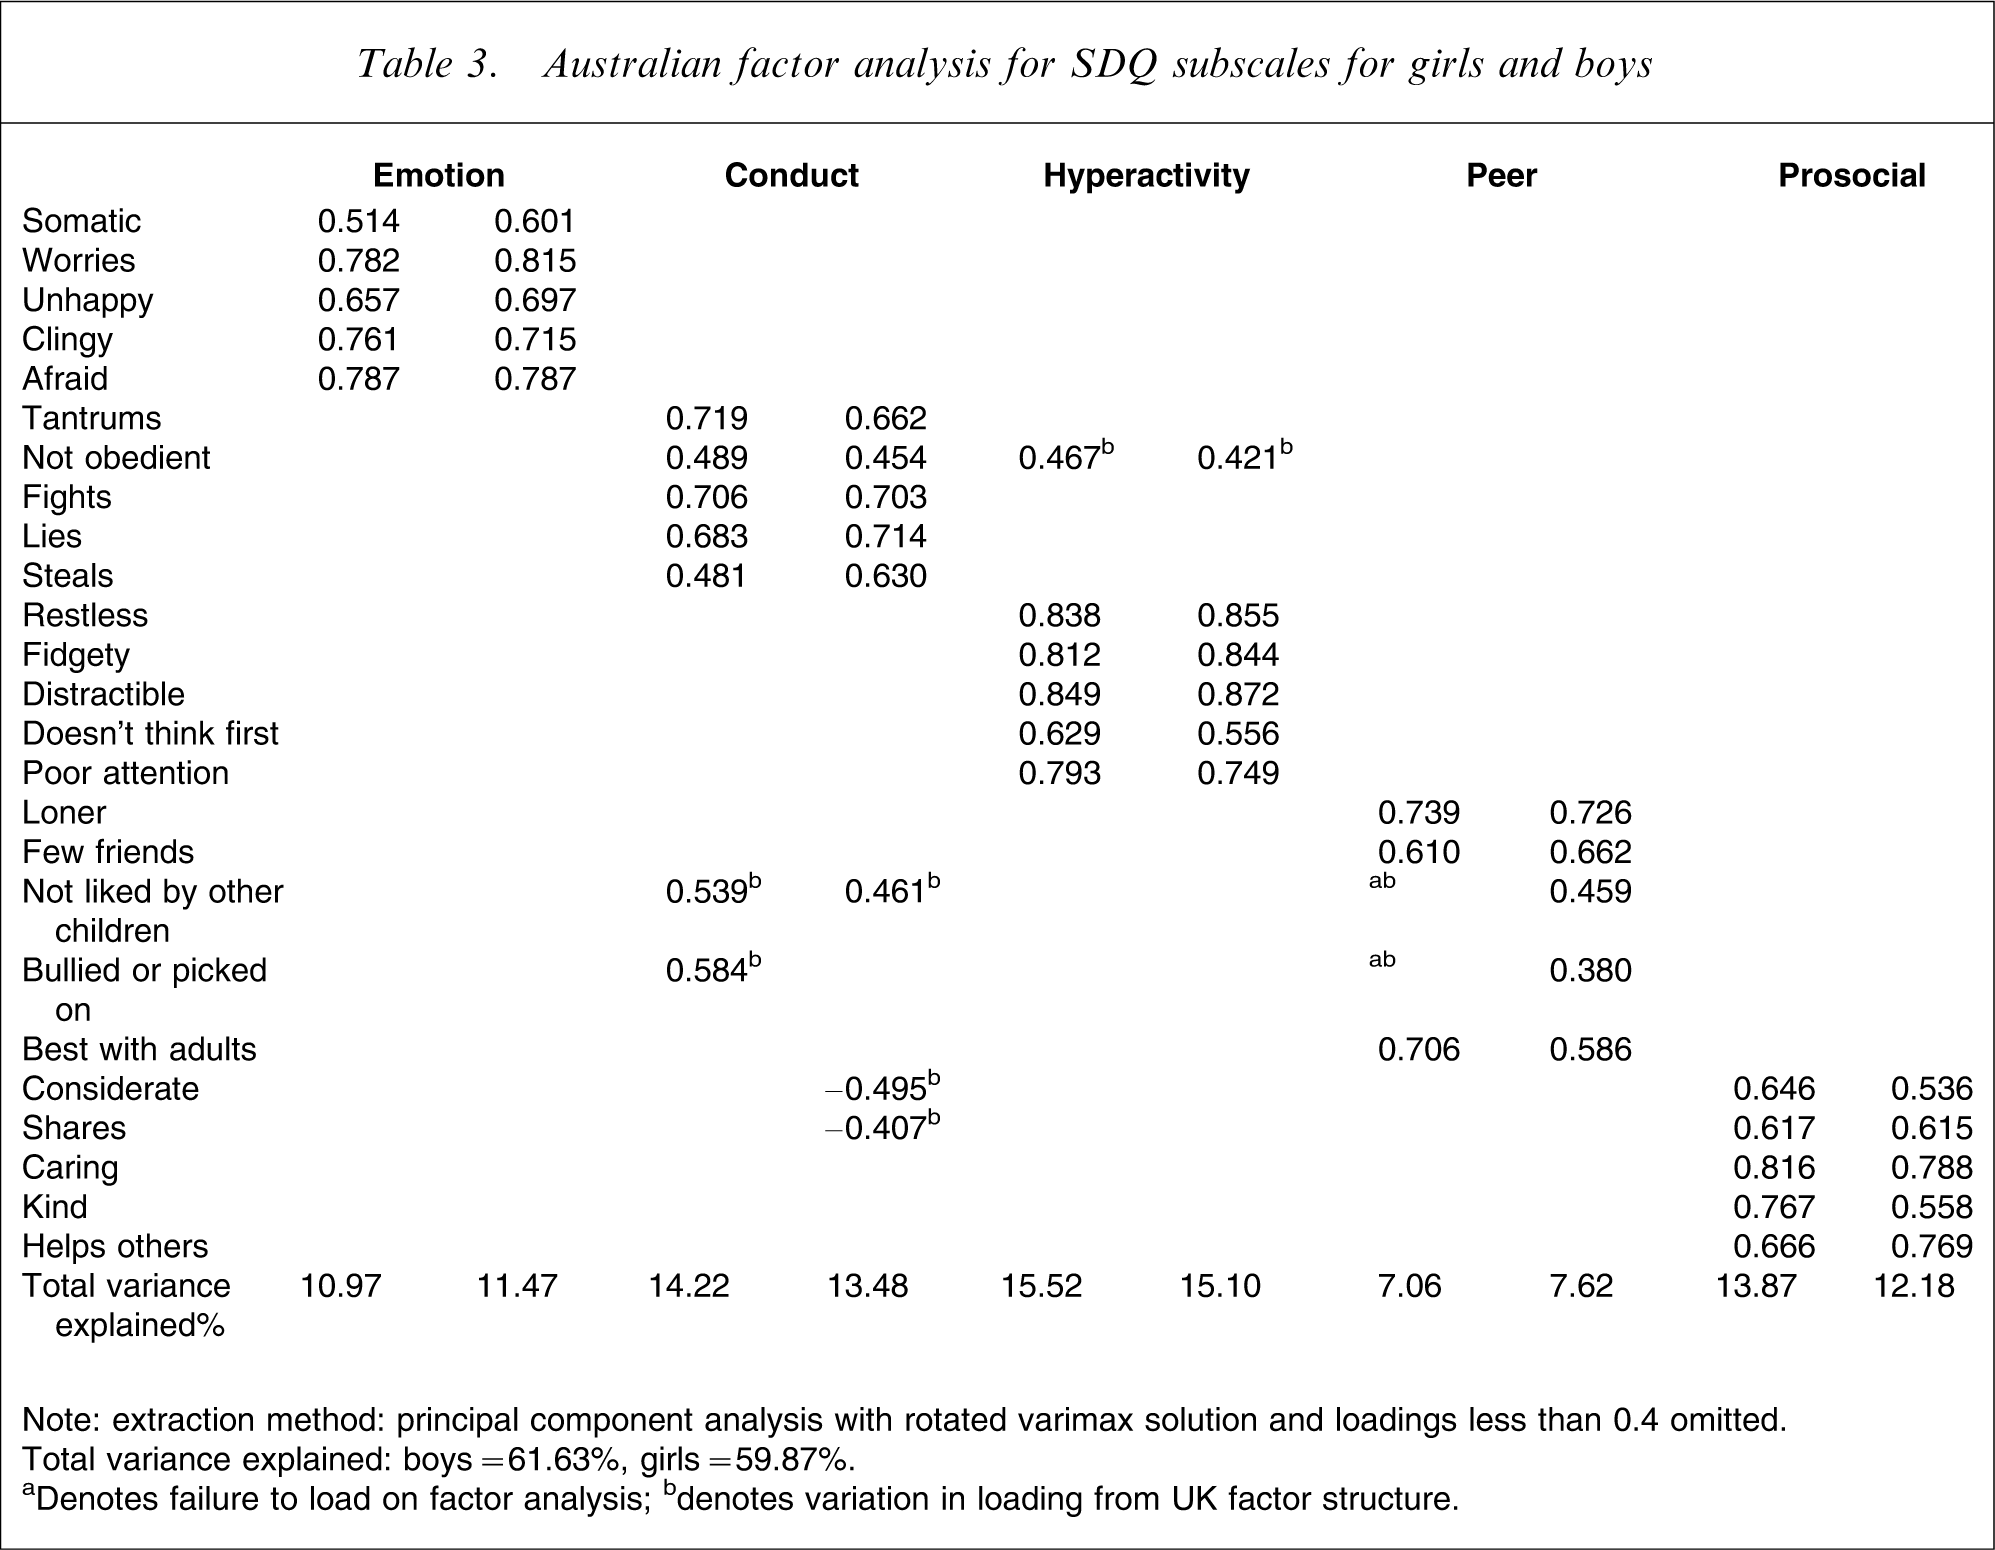
Note: extraction method: principal component analysis with rotated varimax solution and loadings less than 0.4 omitted.
Total variance explained: boys = 61.63%, girls = 59.87%.
aDenotes failure to load on factor analysis; bdenotes variation in loading from UK factor structure.
For boys there were some noteworthy differences in the Conduct scale. First, two items loaded on the Conduct subscale rather than the Peers subscale. This indicates that children between the ages of 5 and 8 years with high levels of conduct problems are more likely to be ‘not liked by other children’ and also, interestingly, to be ‘picked on or bullied by others’. In this sample of boys, these two items appear to be independent of other poor peer-relating skills such as being a loner, having few friends, or preferring the company of adults. Second, the Conduct scale item representing ‘not obedient’ loaded moderately on both Conduct (0.489) and Hyperactivity (0.467), suggesting this item has a relationship with both subscales; that is, boys are very likely to be ‘not obedient’ when they have high conduct problems and/or if they have high hyperactivity.
There were also some important points of convergence for girls on the Conduct scale. First, as shown in Table 3, two items from the Prosocial scale also loaded moderately on the Conduct Scales. These loadings show that girls with conduct problems are also ‘less considerate’ and more likely to ‘not share’. Finally, girls with high Conduct scores are also more likely to be ‘not liked by other children’, which is an item from the Peers subscale.
The strength of these relationships across the subscales is shown in the table of correlations for girls and boys (Table 4). For boys, problems with conduct, hyperactivity, peer problems, and prosocial behaviours are highly correlated. Overall, 5.3% (n = 53) of the boys had scores above the borderline range (80th percentile) on all four externalizing and social subscales of Conduct, Hyperactivity, Peer and Prosocial. As a comparison, less than 0.01% of girls had high scores across all four subscales.
Correlation between SDQ subscales for boys and girls
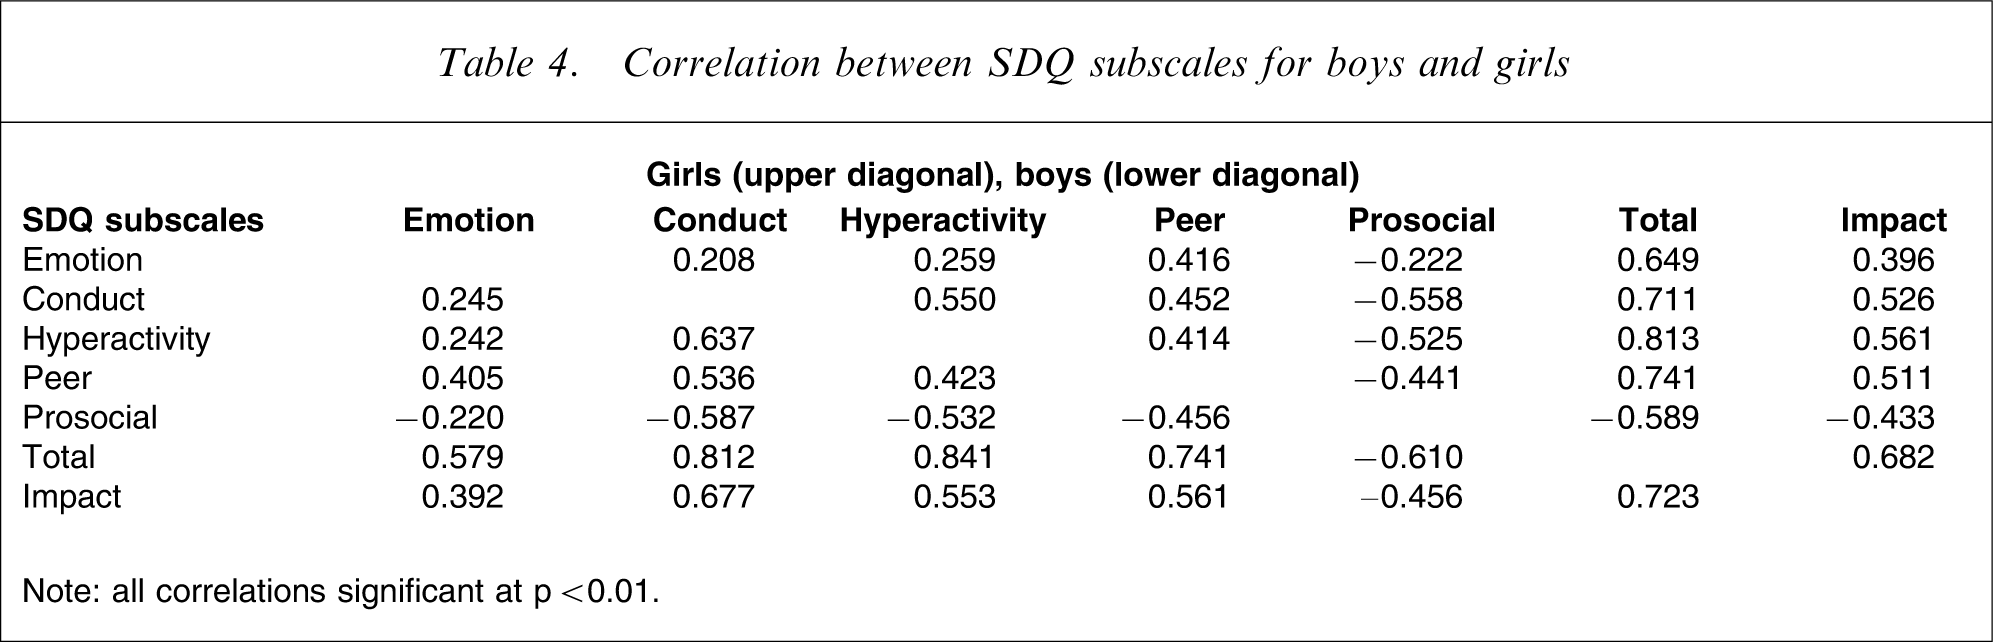
Note: all correlations significant at p < 0.01.
Discussion
As expected, the SDQ scores revealed that boys had almost twice the level of difficulty in hyperactivity and conduct problems than girls. Boys were also more likely to experience greater difficulty with peers and prosocial behaviours. The Emotion subscale was the only factor that showed no differences between boys and girls. A large proportion of the boys in this sample (5.3%) scored above the 80th percentile on all four subscales of the SDQ.
Comparisons between these scores and the UK clinical cut-offs revealed few differences for this Australian sample. The exception was the Emotion subscale where Australian teachers were less likely to report a high score than their UK counterparts. Although Goodman and colleagues [3] reported that teacher reports are slightly less useful for predicting emotional problems, this study compares UK teacher data with Australian teachers and differences were not expected. The present results suggest that Australian teachers have a tendency to ascribe problems to externalizing scales rather than emotionality, or that there is a subtly different interpretation of the items.
The factor analysis revealed some differences between this sample and the UK factors for boys and girls. For boys, two items from the Peer scale loaded on the Conduct scale instead. The two Peer items that were more strongly associated with conduct problems showed the boys with conduct difficulties were ‘not liked by other children’ and ‘picked on or bullied by other children’. Also, one item measuring misbehaviour from the Conduct subscale loaded on both Hyperactivity and Conduct to a similar degree showing that general misbehaviour is similarly associated with hyperactivity and conduct problems.
For clinicians using the SDQ with young boys between 5–8 years, the convergence of these items is high enough to suggest a clear interpretation of the existing Conduct, Hyperactivity, or Peer subscale scores may be misleading and individual interpretation of the items may be needed. Specifically, Peer problems may be hypothesized when instead the items contributing to a high Peer score are more related to conduct problems. It is proposed that the Peer scale for boys has two interpretations: (i) those boys who score high on the two items of ‘not being liked by other children’ and ‘being picked on or bullied by other children’ may be unpopular because of their abrasive behaviours; and (ii) boys who score high on the remaining three items on the Peer scale indicating they are ‘loners’, ‘have few friends’ and ‘seek adult company’ may have peer problems that relate to an inability to socialize and, importantly, they may not be unpopular or picked on at this young age. Finally, for boys at this young age ‘not being generally well behaved’ is likely to be a higher scoring item if there are high scores on either hyperactivity or conduct problems. In summary, the differences in the factor structure for boys indicate that independent analysis of the items on the Hyperactivity, Conduct, and Peer scales is necessary. There is a risk that at this young age the behaviour of some boys may be misinterpreted or overlooked as a consequence of this overlap. It would be interesting to observe if this pattern of peer and conduct difficulty alters with increasing age and the development of peer groups, particularly a deviant peer group.
For girls, there was a similar overlap of the Conduct item ‘not generally well behaved, does not usually do what adults request’ with the Hyperactivity subscale. There was also a strong association between conduct problems and items on the Prosocial scale. Girls with conduct problems were likely to have poorer prosocial behaviours, this includes being less willing to share and being inconsiderate of other peoples feelings.
Taking the analyses for boys and girls together, the data reveal that for children of this young age there is considerable overlap into the Conduct subscale. Of interest is that the overlap of conduct problems for boys shows as greater peer problems, while the overlap for girls shows as poorer prosocial skills. These results contrast with the findings from Dickey and Blumberg [2], who reported that being disobedient, unpopular, and lacking a good friend were more closely related to prosocial problems than conduct or peer problems. It seems from the US normative data and this present Australian data that local interpretation of items should be considered.
The strength of this study is the large sample with responses from the majority of children in each teacher's classroom (88%). Although the study would have been strengthened with reports from teachers on other aspects of the children's functioning, Goodman and colleagues [3] have argued that teachers provide valuable predictive information in relation to conduct disorder. Teachers provide information that is not always available to parents and this can make a valuable contribution to psychiatric interventions. The data provided by teachers in this study provides normative levels of behaviour for early primary school children that can be used by Australian CAMHS and mental health service providers. Future research is required to investigate if the high scores are an indicator of ongoing difficulty or valuable markers for identification into early intervention programs. Additional studies providing normative data from teachers on older children would provide valuable information on the changes in subscales that occur with increasing age.
Footnotes
Acknowledgements
Thank you to Kate Richardson, CAST Program Leader – Services, for her contribution to the data collection. Thank you also to all staff of the Department of Education in Victoria and Catholic Education Victoria. This research was conducted as part of the CAST program and was supported by Ballarat Health Services and the Mental Health Branch of the Department of Human Services, Victoria.
Appendix
Appendix A. Correlations among observed variables
| Item | Question | 1 | 2 | 3 | 4 | 5 | 6 | 7 | 8 | 9 | 10 | 11 | 12 | 13 | 14 | 15 | 16 | 17 | 18 | 19 | 20 | 21 | 22 | 23 | 24 |
| Considerate | 1 | ||||||||||||||||||||||||
| Restless | 2 | −0.499 | |||||||||||||||||||||||
| Somatic | 3 | −0.087 | 0.134 | ||||||||||||||||||||||
| Shares | 4 | 0.622 | −0.362 | −0.118 | |||||||||||||||||||||
| Tantrums | 5 | −0.450 | 0.378 | 0.125 | −0.393 | ||||||||||||||||||||
| Loner | 6 | −0.146 | 0.143 | 0.139 | −0.151 | 0.112 | |||||||||||||||||||
| Worries | 7 | −0.132 | 0.130 | 0.410 | −0.171 | 0.179 | 0.219 | ||||||||||||||||||
| Caring | 8 | 0.607 | −.326 | −0.031a | 0.547 | −0.297 | −0.164 | −0.126 | |||||||||||||||||
| Fidgety | 9 | −0.491 | 0.828 | 0.139 | −0.392 | 0.382 | 0.154 | 0.134 | −0.349 | ||||||||||||||||
| Fights | 10 | −0.577 | 0.446 | 0.108 | −0.484 | 0.589 | 0.063 | 0.147 | −0.389 | 0.451 | |||||||||||||||
| Unhappy | 11 | −0.254 | 0.206 | 0.357 | −0.255 | 0.353 | 0.210 | 0.556 | −0.216 | 0.230 | 0.286 | ||||||||||||||
| Distractible | 12 | −0.479 | 0.723 | 0.131 | −0.369 | 0.312 | 0.141 | 0.159 | −0.333 | 0.725 | 0.406 | 0.231 | |||||||||||||
| Clingy | 13 | −0.088 | 0.099 | 0.257 | −0.118 | 0.070 | 0.215 | 0.472 | −0.157 | 0.120 | 0.025a | 0.358 | 0.158 | ||||||||||||
| Kind | 14 | 0.600 | −0.317 | −0.04 6b | 0.562 | −0.285 | −0.104 | −0.096 | 0.653 | −0.330 | −0.431 | −0.197 | −0.315 | −0.119 | |||||||||||
| Lies | 15 | −0.501 | 0.418 | 0.152 | −0.447 | 0.443 | 0.126 | 0.135 | −0.343 | 0.445 | 0.552 | 0.264 | 0.412 | 0.083 | −0.385 | ||||||||||
| Bullied or picked on | 16 | −0.226 | 0.222 | 0.189 | −0.213 | 0.303 | 0.174 | 0.207 | −0.154 | 0.240 | 0.324 | 0.295 | 0.229 | 0.157 | –0.167 | 0.292 | |||||||||
| Considerate | 17 | 0.466 | −0.287 | 0.012a | 0.423 | −0.219 | −0.124 | −0.121 | 0.610 | −0.297 | −0.271 | −0.213 | −0.318 | −0.178 | 0.495 | −0.241 | −0.079 | ||||||||
| Steals | 18 | −0.258 | 0.215 | 0.104 | −0.194 | 0.204 | 0.095 | 0.090 | −0.157 | 0.211 | 0.270 | 0.160 | 0.214 | 0.037a | −0.192 | 0.475 | 0.218 | −0.105 | |||||||
| Best with adults | 19 | −0.154 | 0.117 | 0.160 | −0.157 | 0.165 | 0.231 | 0.0197 | −0.104 | 0.140 | 0.157 | 0.176 | 0.110 | 0.165 | −0.076 | 0.138 | 0.162 | −0.067 | 0.080 | ||||||
| Afraid | 20 | −0.047b | 0.050b | 0.249 | −0.097 | 0.071 | 0.188 | 0.539 | −0.127 | 0.070 | 0.039a | 0.409 | 0.090 | 0.584 | −0.087 | 0.038a | 0.204 | −0.114 | 0.063 | 0.159 | |||||
| Not obedient | 21 | −0.583 | 0.548 | 0.072 | −0.504 | 0.462 | 0.133 | 0.116 | −0.463 | 0.549 | 0.542 | 0.250 | 0.497 | 0.070 | −0.425 | 0.515 | 0.247 | −0.355 | 0.270 | 0.133 | 0.043 | ||||
| Few friends | 22 | −0.397 | 0.306 | 0.151 | −0.414 | 0.300 | 0.378 | 0.278 | −0.358 | 0.319 | 0.313 | 0.290 | 0.309 | 0.185 | −0.340 | 0.328 | 0.320 | −0.282 | 0.204 | 0.303 | 0.195 | 0.359 | |||
| Not liked by other children | 23 | −0.580 | 0.407 | 0.174 | −0.551 | 0.404 | 0.275 | 0.235 | −0.480 | 0.437 | 0.526 | 0.364 | 0.415 | 0.145 | −0.498 | 0.530 | 0.377 | −0.339 | 0.297 | 0.245 | 0.153 | 0.533 | 0.608 | ||
| Doesn't think first | 24 | −0.585 | 0.577 | 0.128 | −0.462 | 0.399 | 0.129 | 0.137 | −0.475 | 0.579 | 0.485 | 0.245 | 0.600 | 0.155 | −0.455 | 0.444 | 0.252 | −0.447 | 0.237 | 0.099 | 0.116 | 0.564 | 0.326 | 0.453 | |
| Poor attention | 25 | −0.496 | 0.640 | 0.132 | −0.396 | 0.289 | 0.157 | 0.151 | −0.403 | 0.629 | 0.385 | 0.221 | 0.760 | 0.182 | −0.386 | 0.401 | 0.209 | −0.400 | 0.217 | 0.098 | 0.106 | 0.506 | 0.340 | 0.434 | 0.627 |
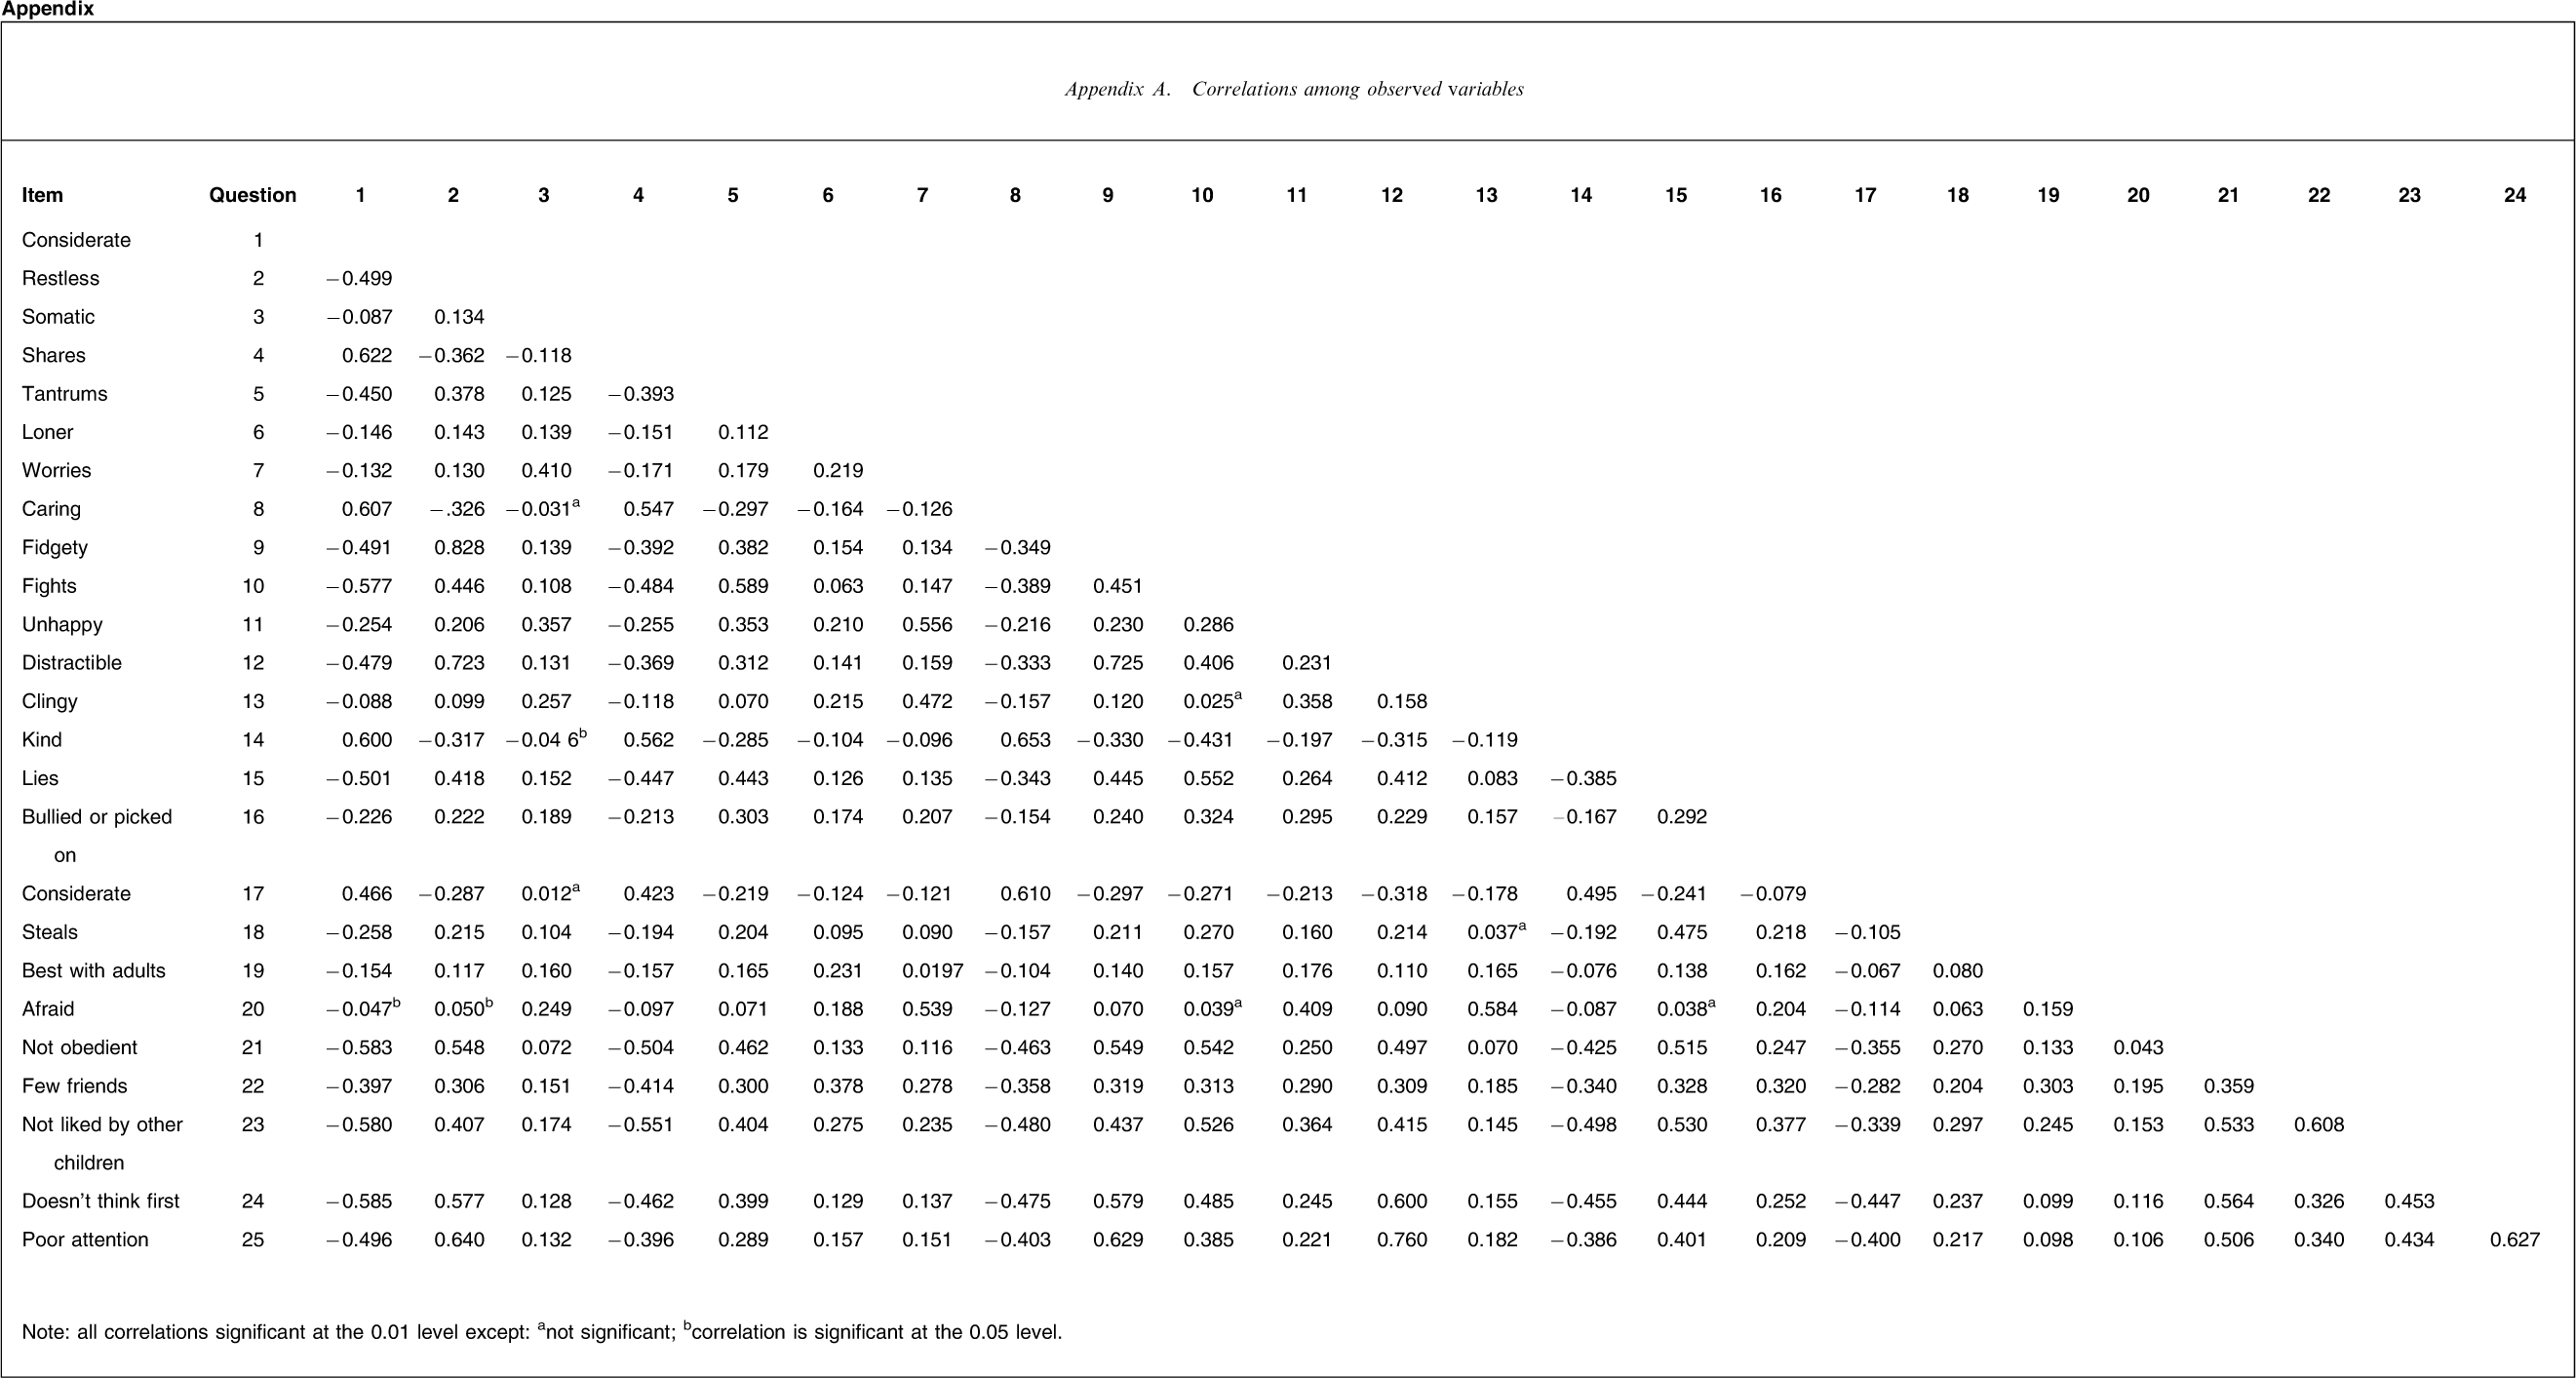
Note: all correlations significant at the 0.01 level except: anot significant; bcorrelation is significant at the 0.05 level.