
Abstract
Study Design
Retrospective cohort controlled study.
Objective
To determine quality-of-life (QOL) outcomes for patients with lumbar spinal stenosis (LSS) treated with membrane-stabilizing agents (MSAs).
Methods
Patients with LSS and concordant neurogenic claudication treated with MSAs (n = 701) or conservatively without MSAs (n = 2104) at a single tertiary care hospital were identified. Patient QOL measures (Patient Health Questionnaire-9 [PHQ9], EuroQOL-5 Dimensions [EQ-5D], Pain Disability Questionnaire [PDQ]) were recorded pretreatment and then 4 months following treatment. Propensity score matching was used to account for baseline demographic differences between the two groups. The primary outcome measure was posttreatment improvement in these QOL measures.
Results
Patients in both groups had statistically significant improvements in the EQ-5D. However, the EQ-5D improvement in the MSA group was significantly greater than the improvement in the control group (0.11 versus 0.06; p = 0.0494). The EQ-5D change in the MSA group also exceeded the minimum clinically important difference, thereby suggesting a clinical significance. Both groups had significant pre- to posttreatment improvements in PDQ and PHQ-9, but these changes were not significantly different between the groups.
Conclusion
The results of this study suggest that patients with LSS and neurogenic claudication can have greater QOL improvements when treated with MSAs compared with other forms of conservative management without MSAs.
Introduction
Lumbar spinal stenosis (LSS) occurs when there is a narrowing of the lumbar spinal canal, most commonly caused by age-related degenerative disease. The incidence of lumbar stenosis has been shown to increase with age from 20 to 47% between ages 40 and 60. 1 Patients with LSS can present with radicular pain or weakness. The treatment for LSS traditionally has involved surgical decompression and/or instrumented fusion. Given the numerous surgical risks including infection, blood loss, nerve damage, and death, an effective conservative treatment alternative for LSS is imperative. These conservative treatment options may include physical therapy, interventional procedures such as epidural steroid injections, and membrane-stabilizing agents (MSAs) including gabapentin (Neurontin; Pfizer, New York, New York, United States) and pregabalin (Lyrica; Pfizer).
Gabapentin and pregabalin have been studied as part of the conservative treatments for LSS. Gabapentin was initially approved by the U.S. Food and Drug Administration (FDA) for the treatment of seizures in 1994, and in 2002 it was approved for the treatment of postherpetic neuralgia. In a randomized control trial, Backonja et al demonstrated the effectiveness of gabapentin for the off-label treatment of neuropathic pain. 2 Currently, although still not FDA approved, gabapentin is frequently utilized in the treatment of neuropathic pain resulting from LSS. The impact of MSAs on pain and walking distance has been evaluated in previous studies, 3 , 4 but to date, the impact of MSAs on quality-of-life (QOL) outcomes has not been explored.
LSS is prevalent in the general population but treatment with spine surgery can lead to associated complications. 5 Because LSS impacts both function and QOL, identifying the conservative measures that can improve QOL outcomes is important. Among the conservative treatments available, membrane stabilizers have been shown to improve pain symptoms and function. Gabapentin has been found to be an effective treatment for managing neuropathic pain of various etiologies. A randomized control study by Yaksi et al examined the efficacy of gabapentin therapy in patients with LSS by comparing a control group that received physical therapy, a lumbosacral corset, and/or nonsteroidal anti-inflammatory drugs and a treatment group that received the aforementioned with the addition of gabapentin. 3 The study revealed longer walking distance and improved pain scores on the visual analog scale after 2, 3, and 4 months in the gabapentin group. Similarly, a prospective study by Kasimcan and Kaptan examined the efficacy of gabapentin in patients with radicular pain from LSS or lumbar disk herniation. 4 They found that 3 months after treatment, the visual analog scale scores were improved in the treatment group. The Odom criteria scores were excellent or good in 36 of 45 patients, but there was no comparative control group in this study.
Given the evidence supporting the use of MSAs to treat LSS-related neurogenic pain, we sought to retrospectively investigate the QOL outcomes following the use of MSAs.
Methods
Study Sample
A retrospective study was performed of all patients who were diagnosed with LSS at a single tertiary care institution between September 2010 and March 2013. Patients were categorized into those who received a membrane-stabilizing medication (MSA group) versus those who did not (no MSA group). All patients received additional conservative management based on the discretion of the health care provider (including medication, acupuncture, exercise, etc.).
The electronic medical records were queried to retrieve patient data that fit our criteria. Inclusion was based on age greater than 45 and a diagnosis of LSS, which would be made based on criteria such as gluteal and/or lower extremity pain and/or fatigue with or without back pain; symptoms aggravated by upright exercise such as walking or positionally induced neurogenic claudication; symptomatic relief with forward flexion, sitting, or recumbency; and occasional confirmatory diagnostic imaging in ambiguous cases. Inclusion was also dependent on participation in the institutional prospectively maintained database collecting QOL outcomes measures. The exclusion criteria included previous spinal surgery, previous treatment with an MSA for any disease, spinal tumors, cauda equina syndrome, foot drop, spinal fracture, epilepsy, and renal failure. Other treatments such as nonsteroidal anti-inflammatory drugs, participation (or lack thereof) in physical therapy or chiropractic care, management with opioids, and other nonsurgical treatments were not used as inclusion or exclusion criteria.
No grant, technical, or corporate support was received in conducting this study or writing this manuscript. No relevant conflicts of interest exist. Institutional Review Board approval (study no. 12-192) was obtained prior to the start of the study.
Quality-of-Life Outcomes
QOL outcomes data included Pain Disability Questionnaire (PDQ), 6 Patient Health Questionnaire-9 (PHQ-9), 7 , 8 , 9 and EuroQOL-5 Dimensions (EQ-5D) 10 , 11 , 12 ; the data was acquired via the institutional Knowledge Program, which is a patient-derived outcome assessment tool that is embedded in our electronic medical record. For all measures except the EQ-5D, a decrease in score represents improvement. The data has been systematically collected in the Spine Center since 2009, in a prospective fashion, at the time of the patient visits. The data was collected at baseline and at 4-month follow-up (visits between 2 and 6 months). For the MSA-treated patients, the pretreatment scores were taken from the closest visit before starting the MSA, as long as the visit was within 1 month before starting the MSA. Patients who did not have a visit within 1 month before starting the MSA were removed. For the patients who were not treated with MSAs, the “pretreatment” visit was the first visit where the patient was diagnosed with LSS. (More than 80% of MSA-treated patients started their medication on the first visit when the diagnosis of LSS was made.)
The PHQ-9 is a self-administered assessment for depression in patients that evaluates the nine criteria in the Diagnostic and Statistical Manual of Mental Disorders, 4th edition, for major depressive disorder. Each of the nine questions is scored from 0 (“not at all”) to 3 (“nearly every day”), making the total score range from 0 to 27. The total score is commonly categorized into one of five groups: minimal (score = 0 to 4), mild (score = 5 to 9), moderate (score = 10 to 14), moderate to severe (score = 15 to 19), and severe (score = 20 to 27). The diagnostic validity of the PHQ-9 has been established in large multicenter analyses. 7 , 8 The PDQ evaluates chronic disabling musculoskeletal and spinal disorders, focuses on disability and patients’ ability to perform activities of daily living, and ranges from 0 (optimal function) to 150 (total disability). Finally, the EQ-5D contains five dimensions of health state: Mobility, Self-Care, Usual Activities, Pain/Discomfort, and Anxiety/Depression. Each dimension is scored from 1 to 3. The minimum clinically important difference (MCID) used for each questionnaire was: PDQ (16), PHQ-9 (5), and EQ-5D (0.1).13,14, 15 , 16 Specifically, the MCID values for PDQ and EQ-5D were based on the calculation first described by Norman and colleagues (one-half the standard deviation of the baseline score), 16 as well as other confirmatory studies,13,14 and the MCID for PHQ-9 was based on a study by Löwe et al. 15
Statistical Methods
Summary statistics were computed for all the patients using R version 2.15.13 (R Core Team, 2013, University of Auckland, New Zealand). To account for the baseline demographic differences between the groups, we used propensity score matching. All the demographic variables listed in Table 1 were included in the propensity model with the continuous variables treated as linear. To create the propensity model, we used mixed-effects logistic regression where a random effect for provider was included, which accounted for the potential confounding effect of the practice patterns of individual surgeons. To measure the covariate balance in the two groups, we computed the standardized difference for each variable, 17 both before and after propensity matching. Standardized differences less than 0.1 in absolute value were considered balanced. For each continuous variable, we further compared density plots to ensure similar overall distributions in each group. We determined a priori that if the variables remained imbalanced after matching using the initial propensity model, we would add nonlinear terms and interaction terms; however, all the measured baseline variables appeared adequately balanced after matching using the initial propensity model. The propensity scores were considered a match as long as they were within 1 unit of each other on the logit scale. Matches were made utilizing the optmatch package in R, 18 where the ratio of control patients to treated patients was allowed to vary from 3:1 to 1:2. We removed MSA-treated patients who had propensity scores larger than the largest propensity score in the untreated group. 19 Due to the nature of our electronic health record, we anticipated varying amounts of missing data on the variables of interest. For the purpose of creating the propensity score model, we used multiple imputation to create and analyze 10 imputed data sets.20 Incomplete variables were imputed under fully conditional specification. 21 The model parameters were estimated with mixed-effects logistic regression applied to each imputed data set separately. The predicted values on the logit scale were averaged over the 10 analyzed data sets to obtain the propensity scores. Utilizing these methods, we greatly reduced the possibility of bias and confounding from the baseline differences in the two groups. To account for any baseline differences in QOL score, mixed-effects linear regression model analysis was performed and adjusted for the baseline score. 22 The response variable in these models was the 4-month follow-up score.
Summary statistics for treated and untreated patients
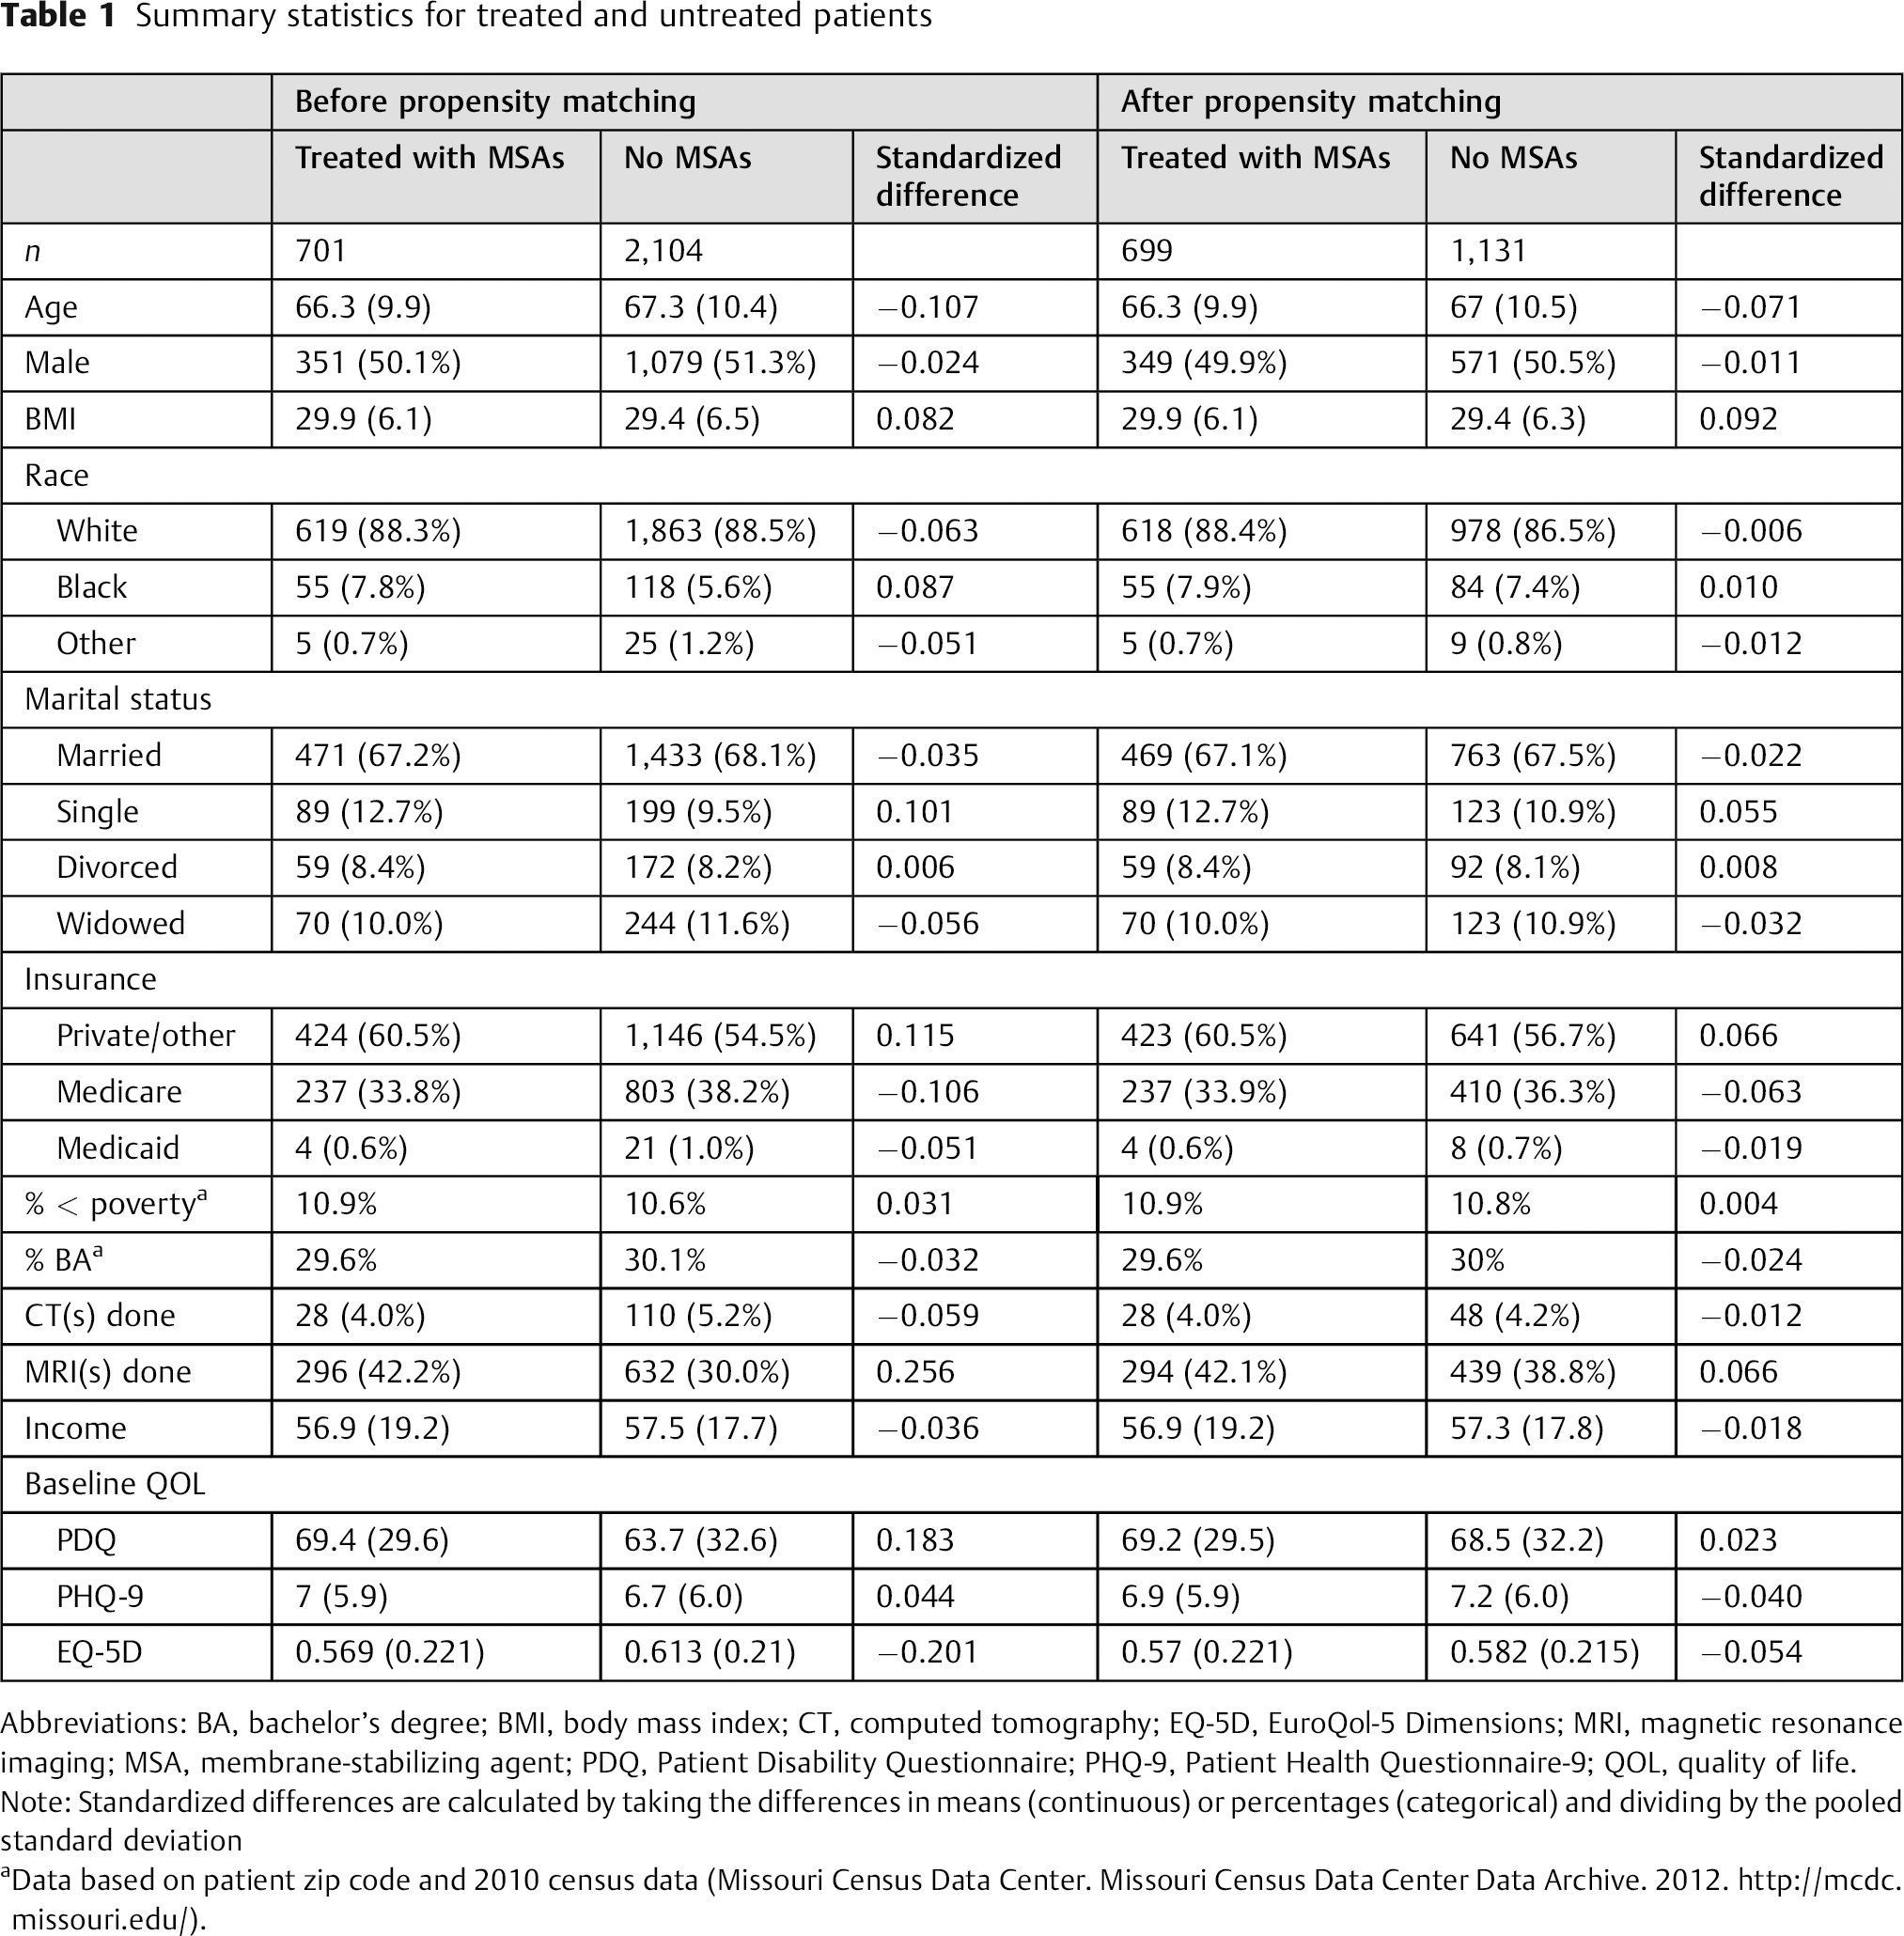
Abbreviations: BA, bachelor's degree; BMI, body mass index; CT, computed tomography; EQ-5D, EuroQol-5 Dimensions; MRI, magnetic resonance imaging; MSA, membrane-stabilizing agent; PDQ, Patient Disability Questionnaire; PHQ-9, Patient Health Questionnaire-9; QOL, quality of life.
Note: Standardized differences are calculated by taking the differences in means (continuous) or percentages (categorical) and dividing by the pooled standard deviation
Data based on patient zip code and 2010 census data (Missouri Census Data Center. Missouri Census Data Center Data Archive. 2012. http://mcdc.missouri.edu/).
Results
A total of 2,805 patients were identified based on the inclusion/exclusion criteria, including 701 in the MSA group and 2,104 patients in the non-MSA group. Before propensity score matching, there were a total of 54 providers represented. The median number of patients treated per physician was 7 (range = 1 to 628). After propensity matching, 52 providers were represented, and the median number of patients treated per physician was 6 (range = 1 to 350). Among the providers who treated 10 or more patients, the MSA prescription rate varied between 5 and 84% before propensity score matching. Substantial variability remained after propensity matching as well. After propensity score matching, 699 and 1,131 patients remained for the MSA-treated and untreated groups, respectively. Of the MSA-treated patients, 228 had a visit between 2 and 6 months after starting the MSA, and the number of patients completing questionnaires both pretreatment and 4 months posttreatment were 98, 112, and 157 for the PDQ, PHQ-9, and EQ-5D, respectively. Of those untreated patients, 438 had a visit between 2 and 6 months after their baseline visit. The number of patients completing questionnaires at both the baseline and 4 month follow-up visit were 185, 134, and 199 for the PDQ, PHQ-9, and EQ-5D, respectively. Although many patients did not have a 4-month follow-up visit, all patients’ baseline visit information was used for the purposes of creating the propensity score model.
Summary statistics for the two groups are provided in Table 1 for both before and after propensity score matching. Before propensity matching, the variables that had substantial imbalance (standardized difference greater than 0.1) included age, single marital status, private insurance, Medicare insurance, magnetic resonance image(s) done, PDQ total score, and EQ-5D index. After propensity matching, all standardized differences were less than 0.1, and the density plots indicated adequate balance among all the baseline continuous variables.
Table 2 displays the results for 4-month change in PDQ, PHQ-9, and EQ-5D. The average change in score was statistically significant for all the scales, regardless of whether patients were treated with MSAs or not (all p < 0.05). For PDQ we used an MCID of one-half of a standard deviation of the baseline questionnaire score, 16 or 16 points. Of the 98 MSA-treated patients, 58 (59.2%) had any improvement in PDQ score, and 94/185 (50.8%) control patients had improvement (p = 0.2229). A smaller percentage exceeded the MCID, 31/98 (31.6%) of the MSA-treated patients and 45/185 (24.3%) of the untreated patients (p = 0.2384).
Summary statistics for PDQ, PHQ-9, and EQ-5D before and 4 months after beginning treatment
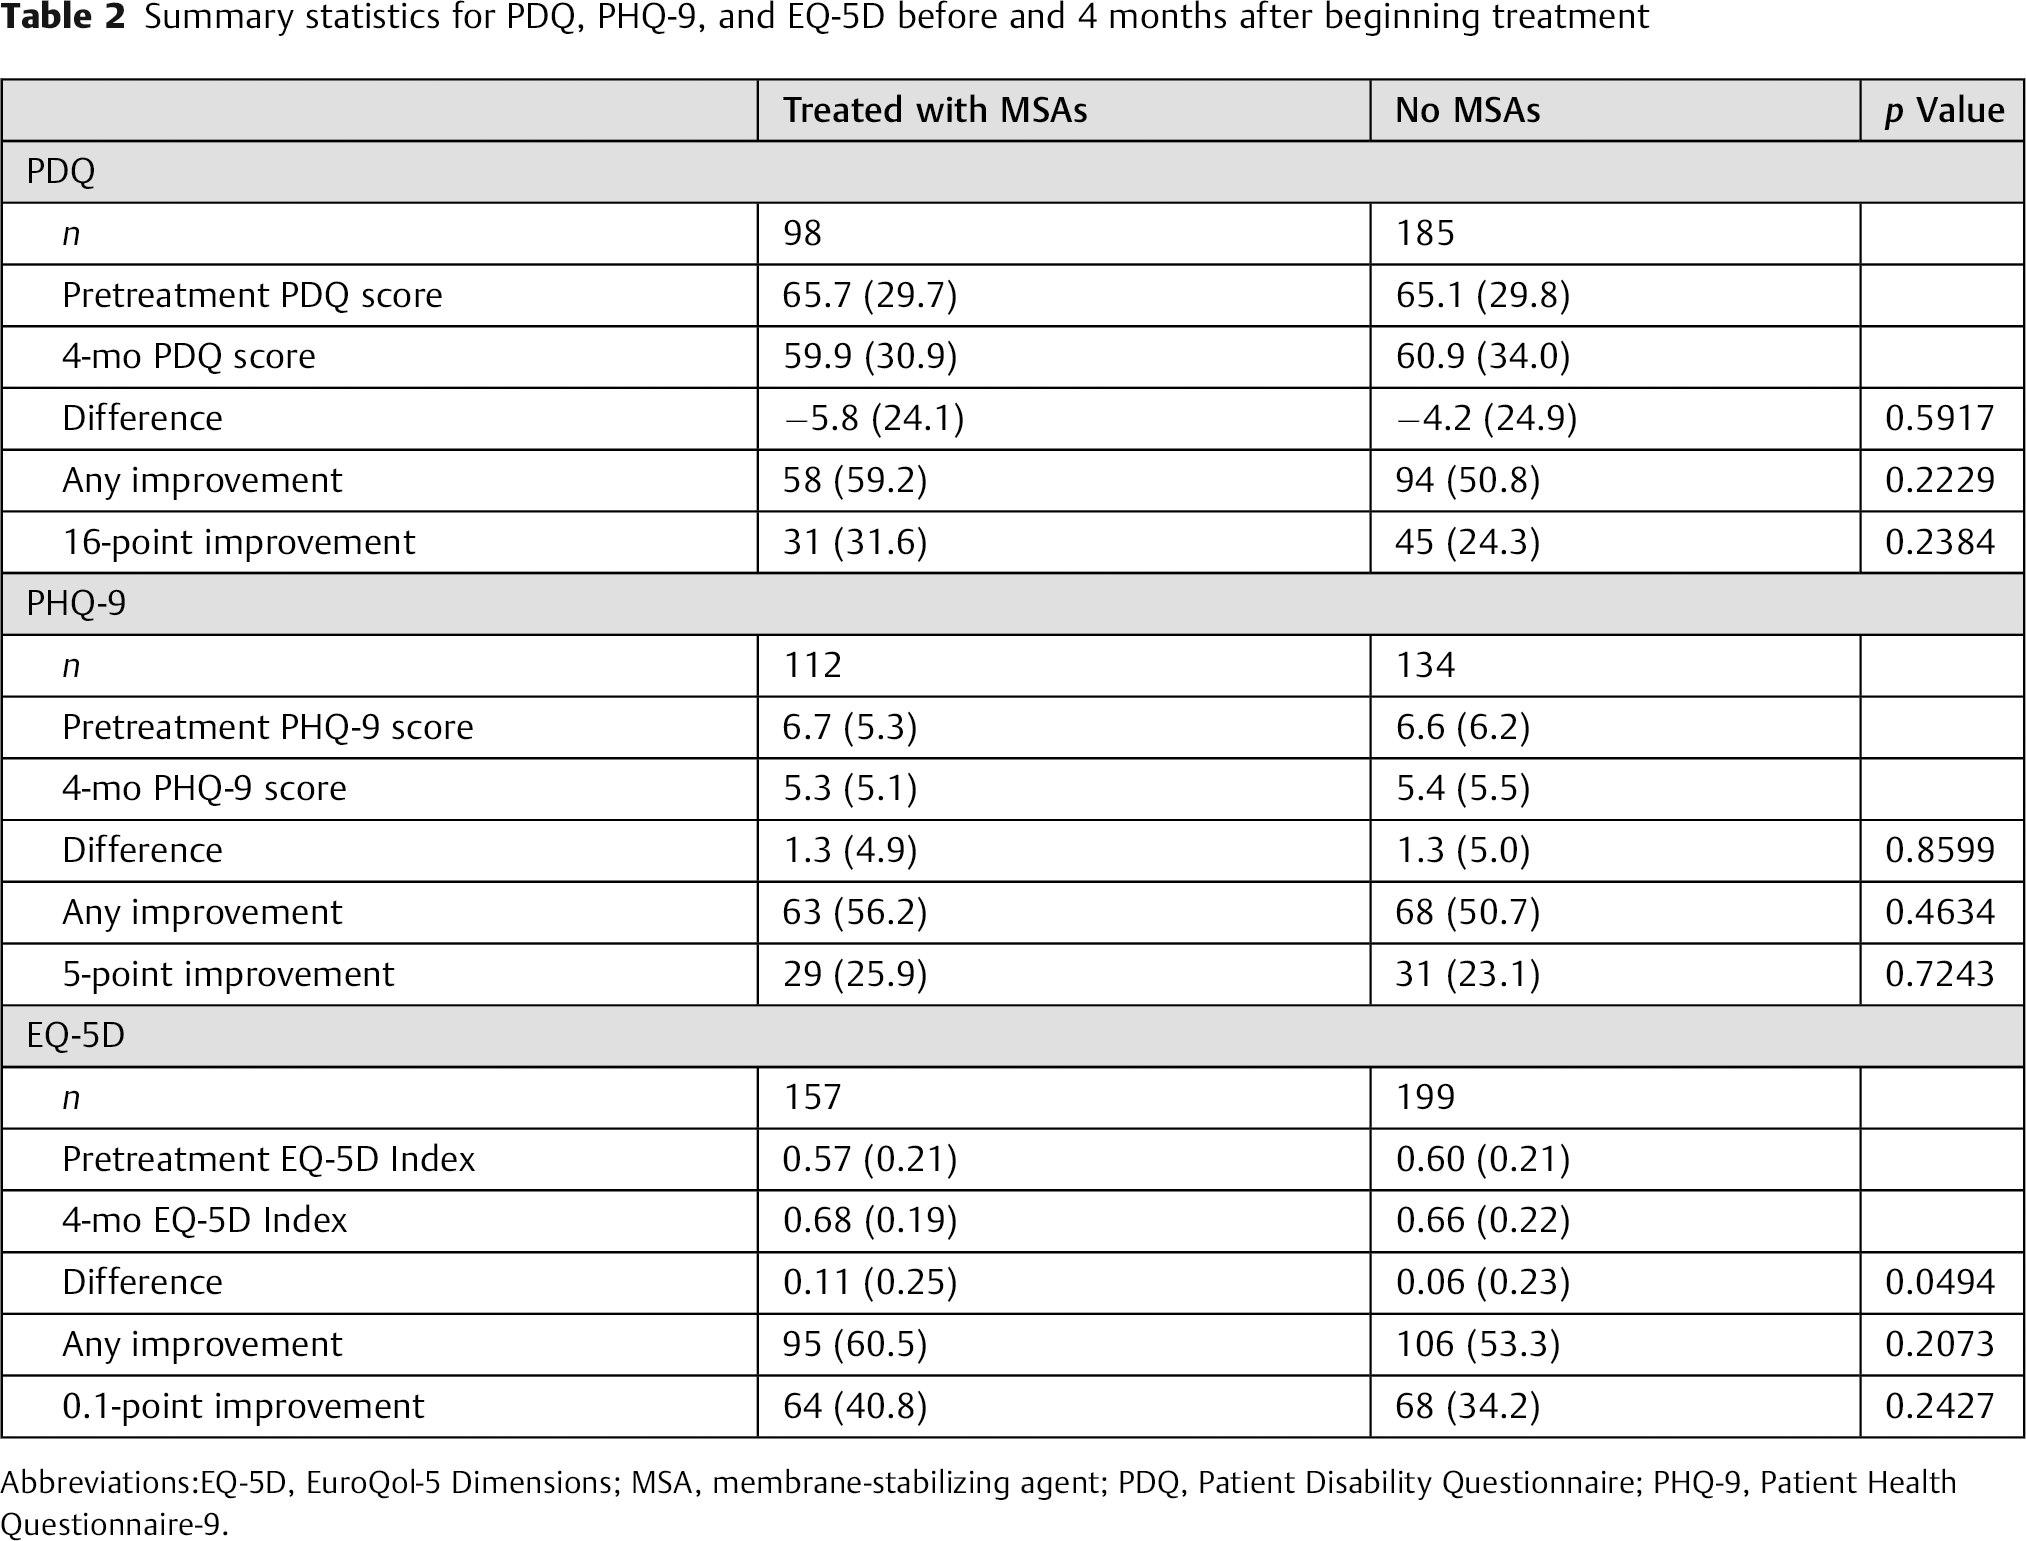
Abbreviations:EQ-5D, EuroQol-5 Dimensions; MSA, membrane-stabilizing agent; PDQ, Patient Disability Questionnaire; PHQ-9, Patient Health Questionnaire-9.
Fig. 1 displays the density plots of propensity scores for MSA-treated and untreated patients both before and after propensity score matching. The solid line indicates treated patients and the dashed line indicates untreated patients. The plots indicate a substantial difference in distributions of propensity scores in the two groups before matching and more similar distributions after matching.
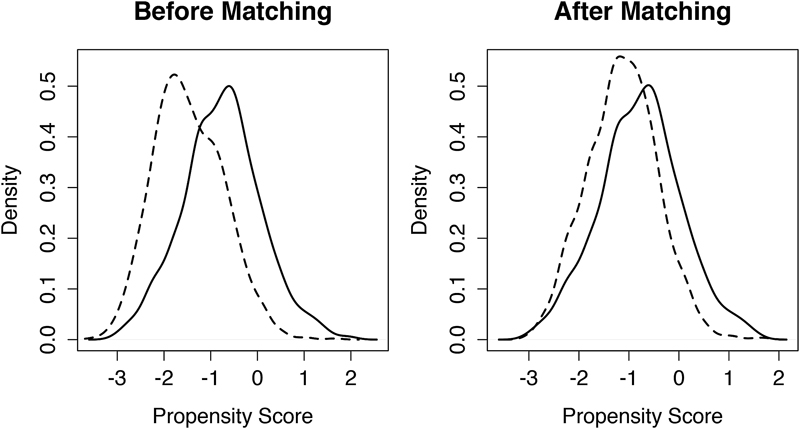
Density plots of propensity scores before and after propensity score matching. Patients treated with membrane-stabilizing agent (MSA) are represented by the solid line. Patients not treated with MSAs are represented by the dashed line.
Fig. 2 displays a plot (based on the results of the mixed-effects linear regression model) of pretreatment PDQ total score versus the PDQ total score 4 months after starting treatment, separated by treated patients and untreated patients. In both groups, the patients with higher baseline PDQ total scores had a greater decrease in PDQ total score 4 months after starting treatment. Using our model, MSA-treated patients with baseline scores of 102 or higher would be expected to show clinically important improvement (at least 16-point drop in score) at 4 months posttreatment. Patients not treated with MSAs would be expected to have clinically important improvement if their initial PDQ score was 125 or higher.
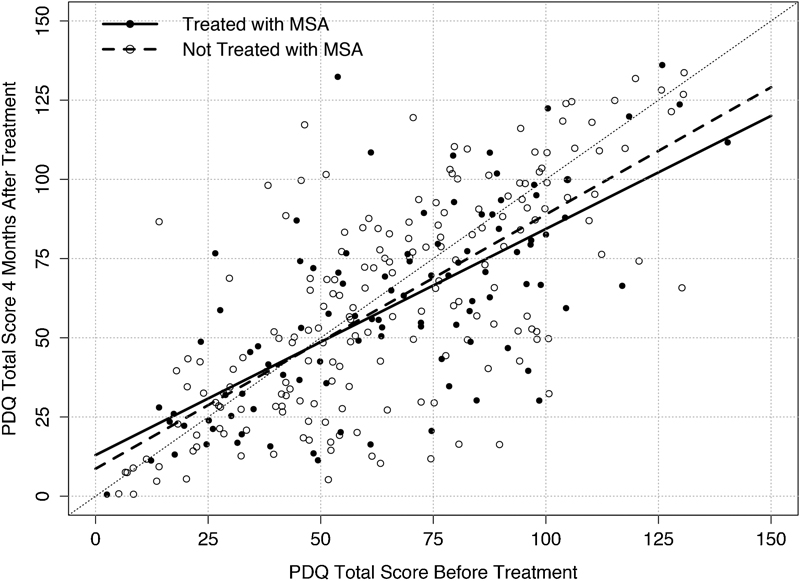
Plot of pretreatment Pain Disability Questionnaire (PDQ) total score versus 4-month posttreatment PDQ total score. Patients treated with membrane-stabilizing agent (MSA) are represented by the black dots and solid line. Patients not treated with MSAs are represented by the white dots and broken line. The dashed diagonal line represents no change in score.
The average change in the EQ-5D Index for MSA-treated patients was 0.11 (Table 2, p < 0.0001). Patients not treated with MSAs also had a significant mean improvement of 0.06 units (p = 0.0001). Furthermore, the mean change of 0.11 in the MSA-treated patients was significantly different from the mean change of 0.06 in the patients not treated with MSAs (p = 0.0494). Using an MCID for the EQ-5D of 0.1, MSA-treated patients had a mean improvement in EQ-5D that was clinically significant, and untreated patients did not. The percentages of patients improving at all and improving greater than the MCID in the two groups were not significantly different.
Fig. 3 shows predicted 4-month follow-up EQ-5D Index values based on the regression model. MSA-treated patients had more improvement in the EQ-5D Index than untreated patients. For example, consider two patients, one treated and one not treated, who had a baseline EQ-5D Index of 0.2. According to our model, the MSA-treated patient would be expected to have a follow-up EQ-5D Index of 0.59, and the untreated patient would be expected to have a follow-up EQ-5D Index of 0.46. Thus, the treated patient would be expected to improve by ∼0.39 units, and the untreated patient would be expected to improve by ∼0.26 units.
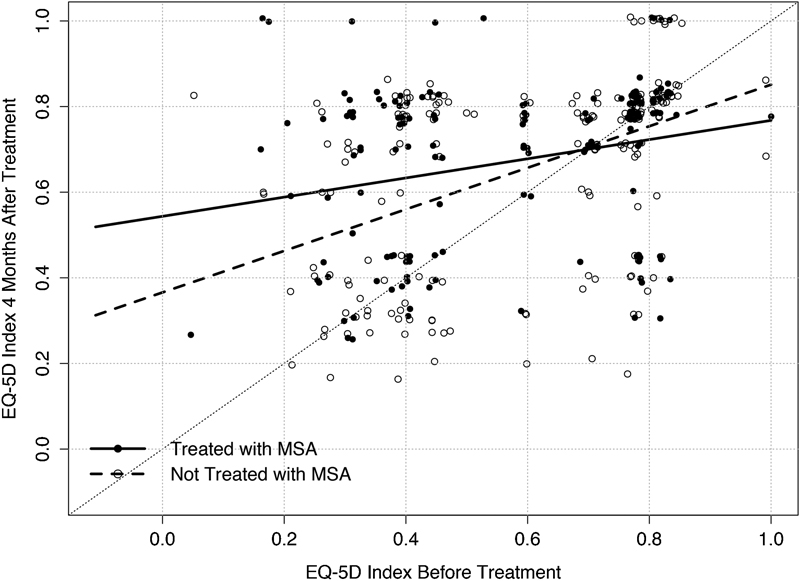
Plot of pretreatment EuroQOL-5 Dimensions (EQ-5D) Index versus 4-month posttreatment EQ-5D Index. Patients treated with membrane-stabilizing agent (MSA) are represented by the black dots and solid line. Patients not treated with MSAs are represented by the white dots and broken line. The dashed diagonal line represents no change in score.
MSA-treated patients had a statistically significant improvement in PHQ-9 score at 4 months, with a mean change of −1.3 points (p = 0.0476). Untreated patients also had a significant improvement of −1.3 points (p = 0.0043). These mean changes were not significantly different from one another (p = 0.8599). Using an MCID threshold of 5 points, neither group was found to have a clinically significant improvement in PHQ9.
Discussion
Previous studies have identified several functional and pain improvement benefits with MSAs, but none have investigated QOL outcomes. In the present study, we investigated the QOL outcomes in patients with LSS and claudication using the PDQ, EQ-5D, and PHQ-9. These questionnaires have been validated in the spine patient population in numerous studies. 23 , 24 , 25 We compared the outcomes in 228 patients with LSS treated with MSAs to 438 control patients. All the outcome measures demonstrated statistically significant improvement in QOL following treatment in both groups. The overall improvement in QOL outcomes is likely demonstrative of the benign clinical course in the majority of patients with LSS. 26 When comparing the two groups, however, we found that the EQ-5D had greater improvement in the MSA-treated group compared with the control group, which exceed the MCID of 0.1 for EQ-5D. Although no statistically significant differences were found when comparing PDQ and PHQ-9 scores between MSA-treated and untreated groups, the statistically significant improvement in EQ-5D scores between these groups implies that MSAs may improve QOL and functional ambulation in patients treated with MSA.
The results of this study indicate that medical and surgical providers who are involved in the treatment of patients with LSS and neurogenic claudication should consider MSAs not only for the relief of pain and improvement in ambulatory status, but also for the treatment of associated depression and decline in QOL.
There are several limitations that should be acknowledged when considering the results. This study was a retrospective review and accordingly had the associated inherent limitations. Several treating physicians were included in the present study, which increases the variability, but also improves the generalizability. The increased variability, which may affect the types of conservative treatments prescribed, was adjusted for using the random effect in the regression models. Many patients were also lost to follow-up at the 4-month evaluation. Our analysis is only valid for patients who did follow up at these times. Another limitation associated with the retrospective design was that several patients completed only some of the questionnaires (due to lack of time, sometimes patients only completed Eq-5D and not the others). The analysis was performed by matching MSA and control patients using propensity scores. These propensity scores were based on the demographic and clinical variables that were available. Although this analysis is the gold standard for retrospective matched cohort-controlled studies, it is possible that the two patient groups still differed on variables that we did not collect. Factors such as participation in physical therapy, treatment with nonsteroidal anti-inflammatory medications, opioid medications, and other nonsurgical treatments varied significantly depending on practitioners. Another possible confounding factor was the individuals with lumbar stenosis and neurogenic claudication that were not given MSAs. The ability to tolerate MSA (given the possible side effects of drowsiness, mood changes, etc.) varies between patients, and so it would be impossible to place every patient on an MSA. Although propensity score matching helped to narrow the bias, the elimination of this bias is virtually impossible. When these numerous factors could not be accounted for, they were all assumed to be potential nonsurgical treatments with the only varied factor being the presence or absence of treatment with MSAs. Finally, another limitation is the potential of patients with concordant lower extremity neuropathy in addition to their lumbar stenosis with neurogenic claudication. Future prospective studies could certainly utilize electromyogram/nerve conduction study to detect those patients with peripheral neuropathies; however, if this same patient group has evidence of lumbar stenosis with neurogenic claudication, such exclusion may not be necessary.
Despite these limitations, no prior studies have directly examined the impact of membrane stabilizers on QOL. The uniqueness of this particular study only further outlines the need for future prospective studies to further examine QOL following conservative management for LSS. Although changes in QOL between the MSA-treated group and untreated group were not statistically significant when using PDQ and PHQ-9 as indicators, the EQ-5D data did demonstrate statistically significant improvement. Although not all scales demonstrated statistically significant improvement, the statistically significant improvement in EQ-5D certainly indicates that MSAs may be helpful in accelerating recovery in some patients and warrants further investigation.
Conclusion
The results of this study suggest that patients with LSS and neurogenic claudication can have greater short-term QOL improvements when treated with MSAs compared with other forms of conservative management without MSAs. Both physicians and surgeons who treat patients with lumbar stenosis should consider prescribing MSAs as they can lead to short-term improvements in ambulation, pain, and QOL. Future prospective studies with longer follow-up intervals and more homogenous patient populations will be useful in further evaluating the QOL outcomes in this patient population.
Disclosures
Sachin Bansal, none
Daniel Lubelski, none
Nicolas R. Thompson, none
Ali A. Shah, none
Daniel J. Mazanec, none
Edward C. Benzel, none
Tagreed Khalaf, none