
Abstract
Study Design
Retrospective case series.
Objectives
The kinematics of the cervical spine has been investigated by many researchers. However, the occupancy of the disk bulges, spinal cord, ligamentum flavum, and the rest of the canal as well as the changes of these structures with motion have not yet been investigated. The goal of this study is to investigate these dynamic changes.
Methods
The kinetic magnetic resonance images of 248 patients (124 men and 124 women) were evaluated, and the occupancy of each structure for each cervical level at neutral, flexion, and extension were calculated.
Results
Whole canal anteroposterior (AP) diameters showed significant differences between neutral-extension and flexion-extension at the C4–C5 and C5–C6 levels (p < 0.05). The mean disk bulges showed significant differences between neutral-flexion and flexion-extension at the C4–C5, C5–C6, C6–C7, and C7–T1 levels (p < 0.01). The mean spinal canal AP diameter showed significant differences between flexion-extension and neutral-extension at the C3–C4, C4–C5, C5–C6, and C6–C7 levels (p < 0.05). There were significant differences between neutral-flexion at the C4–C5, C5–C6, and C6–C7 levels (p < 0.05). The mean thickness of the ligamentum flavum showed significant differences between flexion-extension at the C3–C4, C4–C5, C5–C6, and C6–C7 levels (p < 0.001). There were significant differences between neutral-extension at the C3–C4 and C5–C6 levels (p < 0.05). There were significant differences between neutral-flexion at the C5–C6 and C6–C7 levels (p < 0.05). The mean thickness of the spinal cord showed significant differences between neutral-flexion at the C2–C3 and C3–C4 levels (p < 0.05). There were significant differences between flexion-extension at the C3–C4 and C4–C5 levels (p < 0.01). The rest of the canal showed significant differences between neutral-extension and flexion-extension at the C3–C4, C4–C5, C5–C6, and C6–C7 levels (p < 0.005). There were significant differences between neutral-flexion at the C5–C6 and C6–C7 levels (p < 0.01).
Conclusions
The occupancy of each structure in the cervical spine for each level was revealed by this study. In addition, the dynamic changes in the cervical spine with flexion and extension were seen to have different characteristics for each level.
Introduction
Spinal canal diameter, disk bulges, and ligamentum flavum thickness contribute to cord compression that triggers radiculopathy and myelopathy. 1 The thickness of all these components and their occupation in the whole spinal canal change not only with motion, but also by level. It was shown that the axial loading increased the severity of lumbar canal stenosis. 2 An average person moves his or her neck many times during a routine day. These movements affect the components of the cervical spine as well.
Although no relationship has been found between the magnetic resonance imaging (MRI) findings and clinical complaints so far, 3 conventional MRI of the cervical spine provides useful information about disk bulges, cord abnormalities, and stenosis. However, the static and non-weight-bearing imaging of the spine is a major disadvantage in understanding the dynamic changes that occur with motion. This limitation could be reduced by using kinetic MRI (kMRI). 4
Thus far, no studies have investigated the occupancy of disk bulges, the spinal cord, and the ligamentum flavum in the whole cervical spinal canal. The purpose of this study is to evaluate the proportions of these structures to the cervical spinal canal and the change in the proportions with flexion and extension for each level. In addition, we investigated the changes in the cervical spinal canal anteroposterior (AP) diameters, disk bulges, and spinal cord and ligamentum flavum thickness with regard to level and motion.
Materials and Methods
We reviewed the kMRI database of Ronald Reagan Hospital at the University of California–Los Angeles (Los Angeles, California, United States), and the kMRI results of 248 patients (124 men and 124 women) were included in this study. The mean age was 53.37 (range between 19 and 98). Any patients with scoliosis, kyphosis, or previous spinal surgery were excluded.
MRI analyzer Version 3 software (Truemetric Corp., Bellflower, California, United States) was used to make measurements on MRIs. Three different midsagittal images (neutral, flexion, and extension) of the cervical spine were evaluated to measure each structure (the whole canal, disk bulges, the spinal cord, the ligamentum flavum, and the rest of the canal) for each level from C2–C3 to C7–T1 at disk levels. The distance between the posterior border of the vertebrae and the posterior border of the ligamentum flavum was measured to obtain the whole canal midsagittal AP diameter. The posterior parts of disks that exceeded the posterior border of vertebrae were accepted as disk bulges. The midsagittal AP diameter of the spinal canal from the posterior border of the disk to the anterior border of the ligamentum flavum for each level were also noted. These measurements were made by the method that Sayit and his colleagues described in a previous study. 5
The occupation of each structure within the spinal canal for every level and position was calculated separately. The changes in each structure with position were calculated and compared. The relationships between each structure's measurements at different positions and each structure at different levels were assessed and compared separately.
The statistical analyses were performed by using a SPSS-derived MRI Analyzer Version 3 (Truemetric Corp.) program, which calculated the relative levels of statistical significance. Mann–Whitney test and Bonferroni adjustment were used, and p < 0.05 was considered statistically significant.
Results
Figs. 1,2,3,4,5,6 show the occupation of the bulging disk, the spinal cord, the ligamentum flavum, and the rest of canal at neutral, flexion, and extension positions from the C2–C3 level to the C7–T1 level.
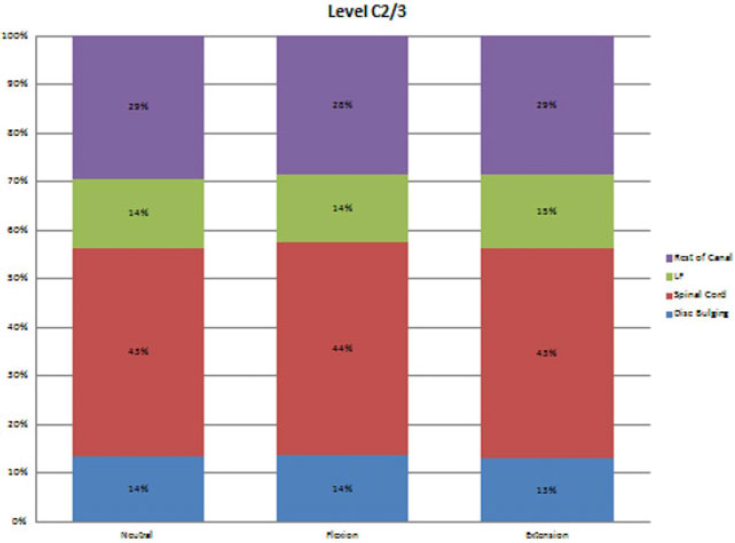
The occupation of each structure within the spinal canal at the level C2–C3.
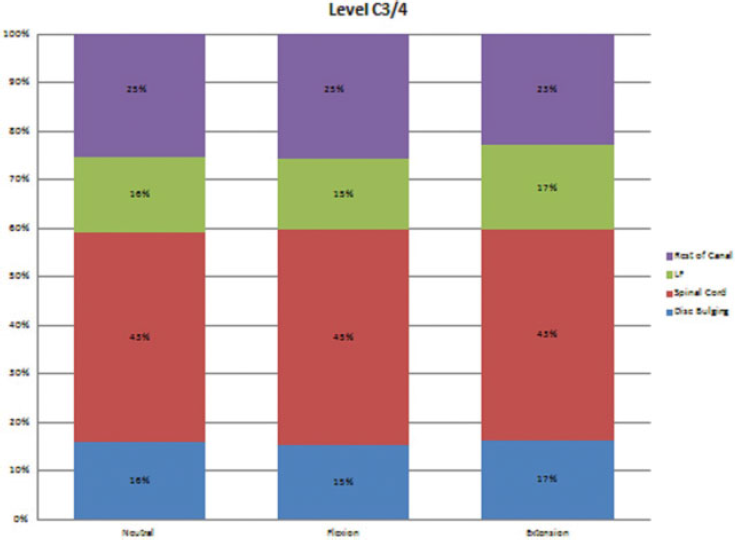
The occupation of each structure within the spinal canal at the level C3–C4.
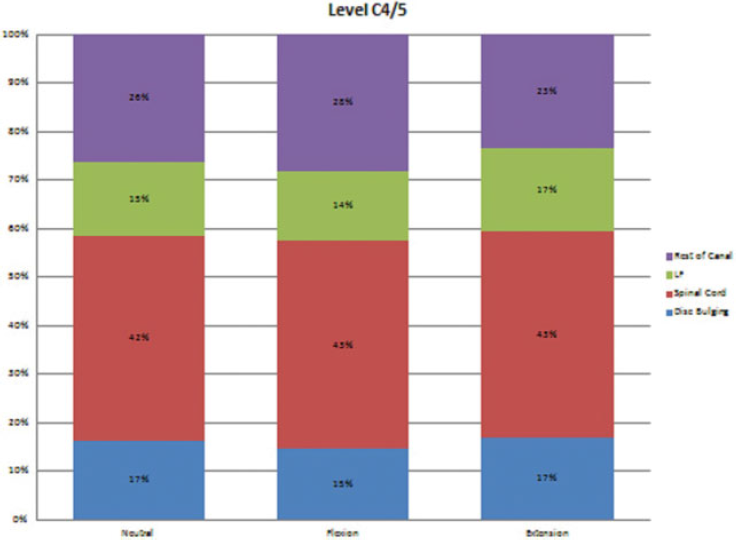
The occupation of each structure within the spinal canal at the level C4–C5.
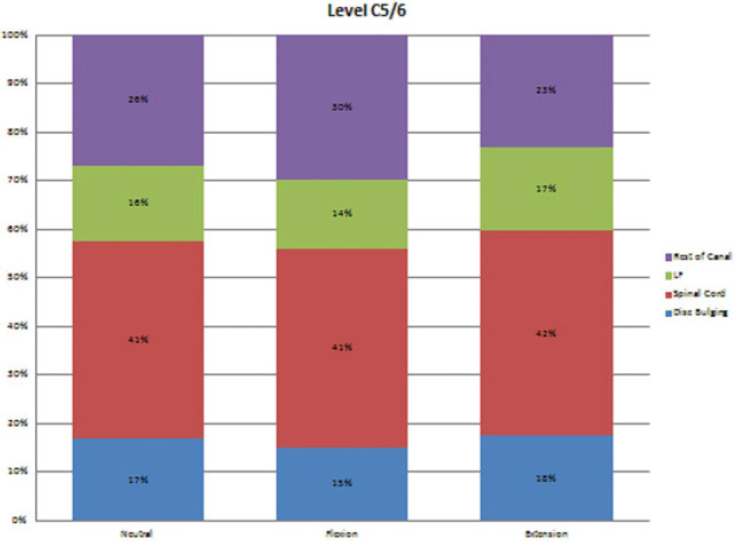
The occupation of each structure within the spinal canal at the level C5–C6.
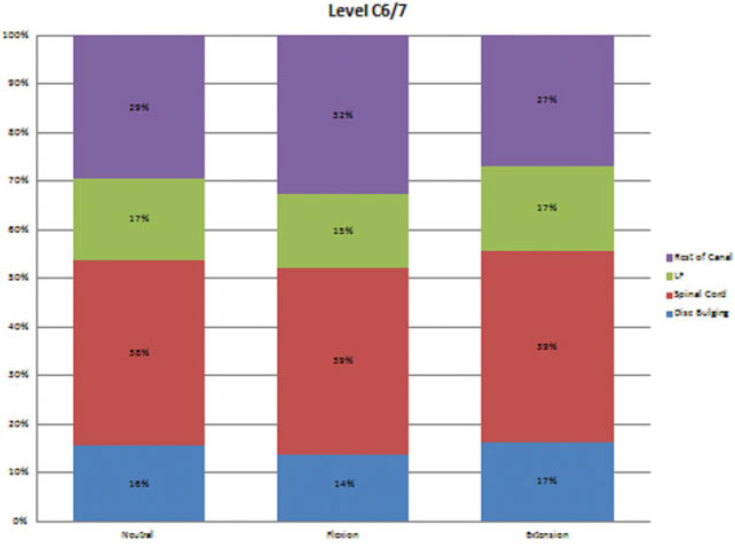
The occupation of each structure within the spinal canal at the level C6–C7.
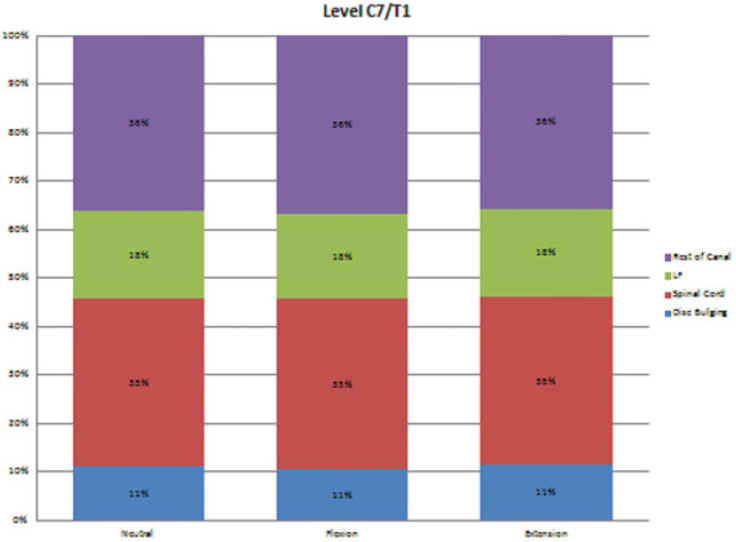
The occupation of each structure within the spinal canal at the level C7–T1.
Whole canal AP diameters at all three positions narrowed from C2–C3 to C5–C6, started widening at this level, and were widest at C7–T1. The C4–C5 and C5–C6 levels, especially at extension positions, were the narrowest parts of spinal canal from the posterior border of vertebral body to the posterior end of ligamentum flavum. The significant differences are indicated with red stars in Fig. 7.
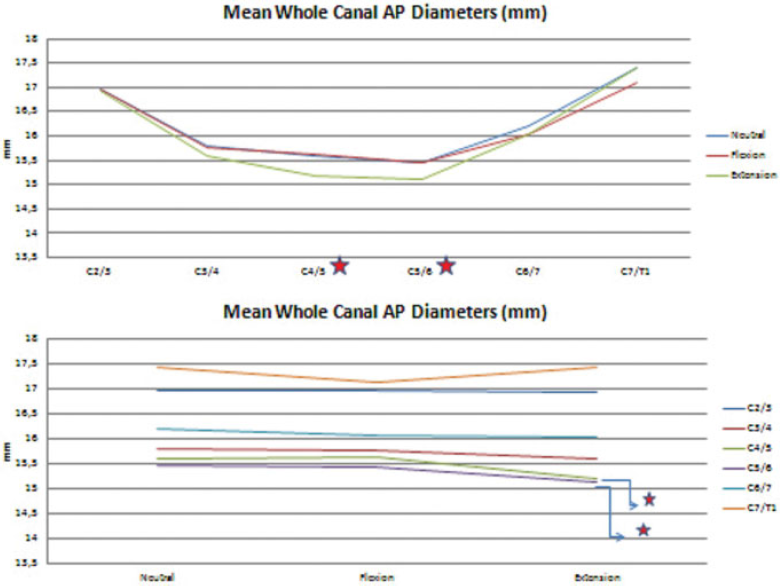
The mean anteroposterior diameters of whole spinal canal for all levels at different positions. (Top) According to the level. (Bottom) According to the position. The red stars indicate statistically significant differences.
The mean disk bulges at neutral and extension positions increased from C2–C3 to C5–C6 and started decreasing at this level, which was remarkable at C7–T1. At the flexion position, it had a fluctuating pattern and had a bottom at the C7–T1 level, too. The mean disk bulges were greater at extension than at neutral and flexion positions, respectively, except the C2–C3 level, at which bulging increased with flexion and decreased with extension. The significant differences are indicated with red stars in Fig. 8.
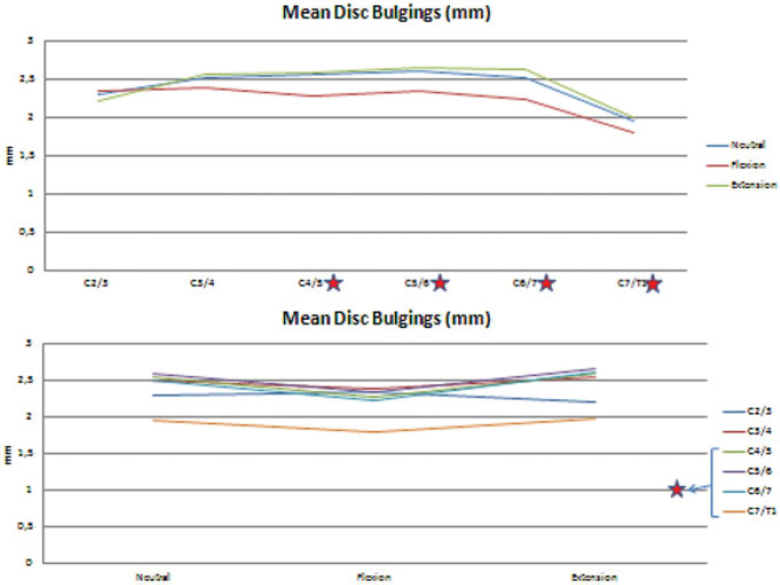
The mean values of disk bulges for all levels at different positions. (Top) According to the level. (Bottom) According to the position. The red stars indicate statistically significant differences.
The mean spinal canal AP diameter had two peaks at the C2–C3 and C7–T1 levels at all three different positions. From C2–C3 to C6–C7, it had greater values at flexion than neutral and extension. However, at the C7–T1 level, it had greater values at neutral than flexion and extension. The significant differences are indicated with red stars in Fig. 9. The percentages of the mean spinal canal AP diameters between the disks and ligamentum flavums in the whole canal showed similar patterns except C7–T1. Although the values were greater at neutral than flexion and extension, the percentages were greater at flexion than neutral and extension, just as the other levels.
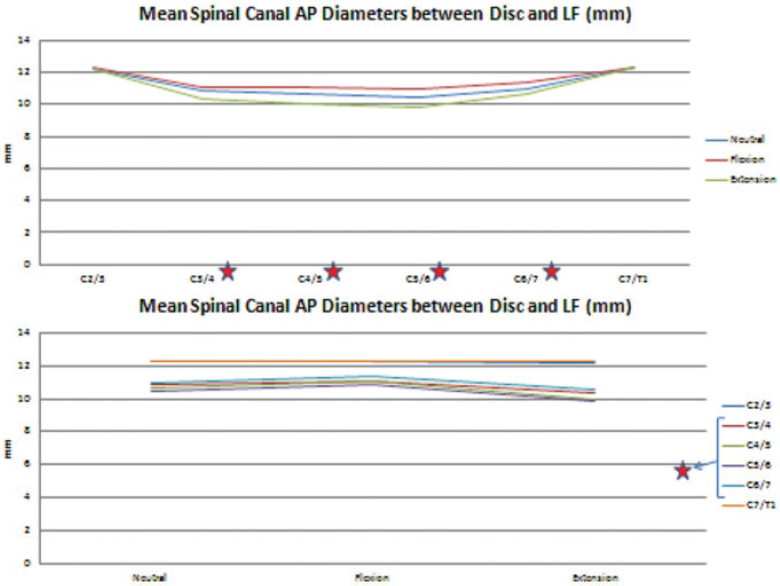
The mean values of spinal canal anteroposterior diameters between disks and ligamentum flavums (Lf) for all levels at different positions. (Top) According to the level. (Bottom) According to the position. The red stars indicate statistically significant differences.
The mean thickness of the ligamentum flavum had a horizontal course from C2–C3 to C5–C6, started increasing at C6–C7, and reached a maximum value at C7–T1. It had the same course for all positions except the peak at the C3–C4 level at extension. The ligamentum flavum was thicker at extension than neutral and flexion for all levels. The significant differences are indicated with red stars in Fig. 10. The ligamentum flavum occupied minimum space in the whole spinal canal at the C2–C3 level and occupied maximum space at the C7–T1 level. Although its thickness was apparently greater at C6–C7 when compared with the levels from C3–C4 to C5–C6, the percentage in the whole spinal canal was not remarkable. The percentages of the thickness of the ligamentum flavum in the whole canal were greater at extension than neutral and flexion for all levels.
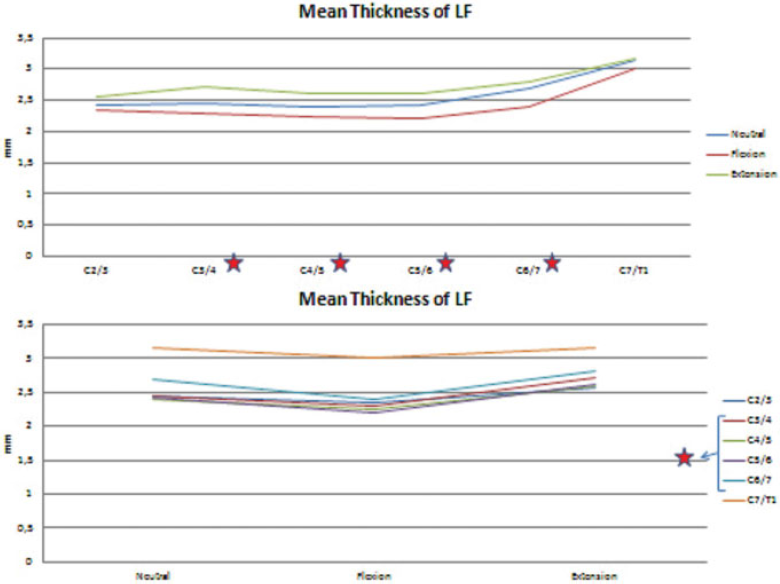
The mean thickness of ligamentum flavum (LF) for all levels at different positions. (Top) According to the level. (Bottom) According to the position. The red stars indicate statistically significant differences.
The mean thickness of the spinal cord declined constantly from C2–C3 to C7–T1 at all positions. Although it was thicker at flexion from C2–C3 to C4–C5, it became thicker at extension from C5–C6 to C7–T1. The significant differences are indicated with red stars in Fig. 11. The percentages of the spinal cord in the whole spinal canal had similar patterns for all positions except C3–C4, where it occupied more space than C2–C3. The percentages were greater at flexion for the C2–C3, C3–C4, C4–C5, C7–T1 levels and were greater at extension for the C5–C6 and C6–C7 levels. Interestingly, the spinal cord occupied nearly 45% of the whole spinal canal at the C3–C4 level, whereas it occupied only ∼35% of the whole spinal canal at the C7–T1 level. The percentages of the spinal cord in the spinal canal between the disk and the ligamentum flavum showed similar courses for all positions. The percentages were greater at extension from C2–C3 to C7–T1 and were greater at flexion for the C2–C3 level.
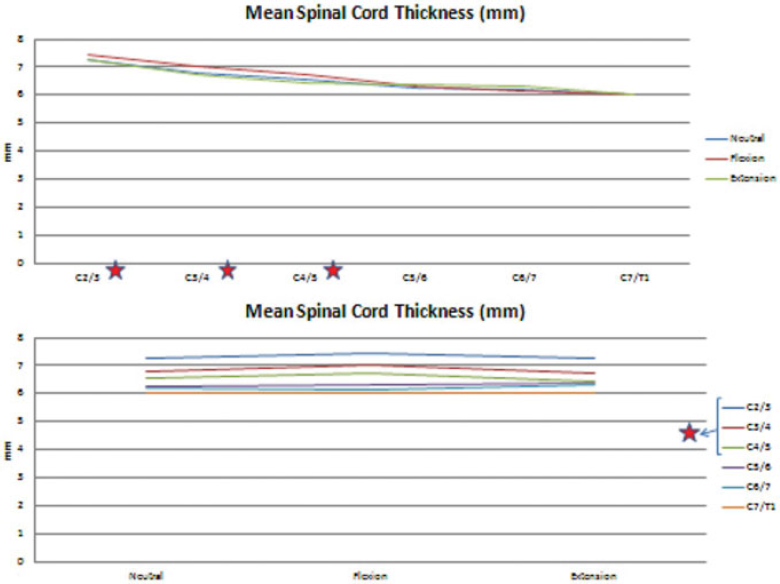
The mean spinal cord thickness for all levels at different positions. (Top) According to the level. (Bottom) According to the position. The red stars indicate statistically significant differences.
The rest of the canal was the part other than the spinal cord between the posterior border of the disk and the anterior border of the ligamentum flavum. It had three peaks at the C2–C3, C6–C7, and C7–T1 levels. It enlarged with flexion from C3–C4 to C6–C7. The significant differences are indicated with red stars in Fig. 12. The occupancy of the rest of the canal in the whole spinal canal had similar courses.
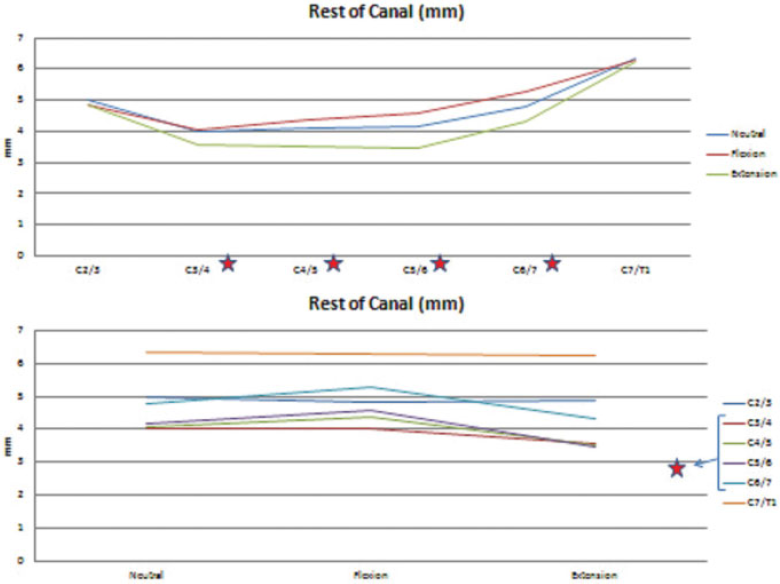
The mean values for the rest of the canal for all levels at different positions. (Top) According to the level. (Bottom) According to the position. The red stars indicate statistically significant differences.
Discussion
The cervical spine is a dynamic structure, and its components display different characteristics depending upon the movements of the head. Conventional magnetic resonance images only allow clinicians to evaluate the neutral position of the cervical spine and its components, whereas kMRIs reveal additional information about these structures. Our study revealed the dynamic changes of the cervical spine that occur with the flexion and extension of the neck.
This study investigated the following components of the cervical spine: the entire spinal canal, the spinal cord, the ligamentum flavum, the bulging disk, and the rest of the spinal canal. With flexion and extension, each structure displayed unique characteristics. For example, the ligamentum flavum was thicker at all levels when extended than at a neutral position or at flexion. However, the mean spinal canal AP diameter had a greater value at flexion than when neutral or extended. The cervical spine displayed different characteristics at each level. For example, the whole canal AP diameters at all three positions narrowed from C2–C3 to C5–C6, then began to widen. They reached their widest point at C7–T1, but the mean thickness of the spinal cord declined constantly from C2–C3 to C7–T1 at all positions. Some of these changes were statistically significant, as indicated above.
Previous studies revealed that flexion and extension of the neck changed the cervical spinal canal diameter and its components. 6 , 7 Our study obtained more accurate results by using kMRI, unlike previous studies that used conventional roentgenography or non-weight-bearing MRI.
Li-Ping et al showed that extension, flexion, and lateral bending of the cervical spine resulted in morphologic changes of the vertebral canal and its components. 8 Our study supported these findings and the effects of motion on cervical canal morphology. This study also showed that the changes in the components of the cervical spinal canal had some different characteristics according to the level. The diameter of the whole canal was expected to go wider with flexion and narrowed with extension. However, it narrowed with flexion at the C6–C7 and C7–T1 levels and enlarged with extension at the C7–T1 level. The kinematics of the C7–T1 level seems to have different characteristics according to other cervical levels.
Zhang et al found that the cervical cord sagittal diameter at each level in extension was greater than in flexion or the neutral position. 9 However, this study revealed that the spinal cord did not have a regular course with motion for the cervical spine. The spinal cord became thicker with flexion at all levels except C6–C7. With extension, it got thinner at the C3–C4 and C4–C5 levels, whereas it got thicker at the other levels.
The mean spinal canal AP diameter between the posterior end of each disk and the anterior part of the ligamentum flavum might be considered the most important part due to the spinal cord it contained. Morishita et al indicated that a cervical spinal canal diameter of less than 13 mm may be associated with an increased risk for developing pathologic changes in the cervical intervertebral disks. 10 The AP diameter of the spinal canal had a distinct course, which narrowed from C2–C3 to C5–C6 and enlarged from C5–C6 to C7–T1. The ligamentum flavum and disk bulges showed very little change, but the rest of the spinal canal had the same course as the whole spinal canal. These changes made the C3–C4, C4–C5, and C5–C6 levels more susceptible to spinal cord compression. In a study by Yukawa and his colleagues, the AP diameter of the spinal canal at each disk level was at a minimum at the C5–C6 and a maximum at the C2–C3 level. 11 In our study, the AP diameter at the spinal canal was at a maximum at the C7–T1 level and a minimum at the C5–C6 level. The C5–C6 had a minimum canal diameter in both studies. Our study also revealed that the mean disk bulge was at a maximum at the C5–C6 level and a minimum at the C7–T1 level, which explains why C5–C6 is the most commonly affected level of all cervical levels for neuropathy.
Sayit et al described the changes in the ligamentum flavum thickness by flexion and extension. 5 In this study, there was an increase in the occupancy of the ligamentum flavum and disk bulges for all three positions at the C3–C4 level when compared with C2–C3. The occupancy of the ligamentum flavum increased nearly 4% in C7–T1 compared with C2–C3.
Interestingly, the rest of the canal narrowed for nearly all levels with flexion and extension. The only exceptions were the C3–C4, C4–C5, C5–C6, and C6–C7 levels with the move from neutral to flexion. At the C4–C5 level, the rest of the canal thickness changed nearly 50% from neutral to flexion, which was greater than any others. The remarkable enhancement of the ligamentum flavum and the rest of the canal thickness and the whole canal AP diameter at the C7–T1 level revealed that this segment behaved like a thoracic rather than a cervical segment.
Kato et al investigated the average spinal cord occupation rate in the dural tube and proposed a spinal cord occupation rate of more than 75% in the dural tube as the criterion for the diagnosis of developmental stenosis of the cervical spinal canal. 12 We calculated the proportion of the spinal cord to the spinal canal between the disk and ligamentum flavum and found a peak value at the C3–C4 level for all positions.
All the changes indicated by this study may vary according to age, gender, and many other parameters. One limitation of this study was that it did not account for these variables. The measurements were done by a single surgeon, which may have affected the accuracy and repeatability of the measurements. Also, the study did not reveal any information about the relation between the occupancy of the components and clinical symptoms. More studies should be done to understand whether those changes have any effect on clinical symptoms and treatment options.
This study revealed that in extension, from C4 to C6, the spinal canal is smallest, the disk bulging is greatest, and the ligamentum flavum is thickest. Therefore, the spinal cord may be more susceptible to compression at these levels. Analyzing these changes may increase our understanding of cervical spine injuries, especially those resulting from car crashes and others consisting of sudden flexion and extension of the neck. Also, such analysis may contribute to the research of the cervical disk diseases and cervical spinal stenosis.
This study investigated the occupancy of each structure, for each level, in the cervical spine. Also, the dynamic changes in the cervical spine at positions of flexion and extension were shown to have unique characteristics at each level.
Disclosures
Emrah Sayıt, none
Bayan Aghdasi, none
Michael D. Daubs, Board membership: AO North America; Consultancy: DePuy-Synthes; Royalties: DePuy-Synthes
Jeffrey C. Wang, Royalties: Biomet, Armedica, Osprey, Aesculap, Synthes, Seaspine, Stryker, Alphatec; Personal investments: Fziomed, Promethean Spine, Paradigm spine, Benevenue, NexGen, Pioneer, Amedica, Vertiflex, Electrocore, Surgitech, Axiomed, VG Innovations, Corespine, Expanding Orthopaedics, Syndicom, Osprey, Bone Biologics, Curative Biosciences, Pearldiver, Pioneer; Reimbursement for travel: Board meeting/activities for AOSpine, NASS, CSRF, CSRS; Fellowship support: AO Foundation; Editorial board: Global Spine Journal, The Spine Journal, JAAOS, The Journal of Spinal Disorders and Techniques, Journal of Orthopaedic Trauma