
Abstract
This study quantifies the effects of marked weight gain on glucose and insulin metabolism in 16 cats which increased their weight by an average of 44.2% over 10 months.
Significantly, the development of feline obesity was accompanied by a 52% decrease in tissue sensitivity to insulin and diminished glucose effectiveness. In addition, glucose intolerance and abnormal insulin response occurred in some cats.
An important finding was that normal weight cats with low insulin sensitivity and glucose effectiveness were at increased risk of developing impaired glucose tolerance with obesity. High basal insulin concentrations or low acute insulin response to glucose also independently increased the risk for developing impaired glucose tolerance.
Male cats gained more weight relative to females and this, combined with their tendency to lower insulin sensitivity and higher insulin concentrations, may explain why male cats are at greater risk for diabetes.
Results suggest an underlying predisposition for glucose intolerance in some cats, which is exacerbated by obesity. These cats may be more at risk of progressing to overt type 2 diabetes mellitus.
Impaired tissue sensitivity to the action of insulin (insulin resistance) is one of the major metabolic abnormalities in obesity and type 2 diabetes in humans (DeFronzo et al 1978, Kolterman et al 1980). In humans, the onset of type 2 diabetes is preceded and predicted by defects in insulin sensitivity, glucose tolerance, and glucose disposal (Warram et al 1990, Martin et al 1992). These defects are evident a decade or more before clinical signs occur and there is evidence that they are genetically determined (Warram et al 1990, Martin et al 1992). Environmental factors such as excess caloric intake, physical inactivity and obesity decrease insulin sensitivity and add to the underlying genetic influence on insulin sensitivity and glucose metabolism, ultimately leading to the development of diabetes mellitus.
In cats, obesity is a significant risk factor for diabetes, as it is in humans (Panciera et al 1990, Scarlett & Donoghue 1998). Although suspected, insulin resistance has not yet been documented in obese cats using accepted measures for determining insulin sensitivity. Diabetic cats are insulin resistant, with insulin sensitivity values six times lower than normal cats (Feldhahn et al 1999). In an insulin resistant state, higher than normal insulin concentrations are required to achieve a given amount of glucose uptake and utilisation (Porte 1991). Insulin resistance leads to compensatory hyperinsulinaemia to maintain blood glucose (Porte 1991). Prolonged, excessive demand on beta cells to produce insulin is postulated to eventually lead to beta cell ‘exhaustion’ and the development of overt diabetes mellitus (Porte 1991, Sasaki et al 1991).
Previous studies in cats have only assessed glucose tolerance and insulin concentrations during a glucose tolerance test. The purpose of our study in cats was to evaluate the effect of weight gain on indices of insulin sensitivity and glucose effectiveness; to investigate relationships between glucose and insulin indices with obesity and gender; and to identify risk factors for insulin resistance and impaired glucose tolerance. To determine the consequences of impaired glucose tolerance in a more physiological setting, glucose and insulin concentrations were measured after a test meal in obese cats.
Materials and methods
Indices of glucose disposal and insulin sensitivity were compared before and after weight gain. These were calculated from serial glucose and insulin concentrations obtained during the glucose tolerance and insulin sensitivity tests. Glucose and insulin concentrations during a meal response test were compared in obese cats with normal or impaired glucose tolerance, and in obese male and female cats.
Animals and dietary treatments
Sixteen research cats (six castrated males and 10 spayed females), were used in the study. Accurate ages were unknown, however all were estimated by visual assessment and examination of dentition to be between one and five years of age. All cats were assessed as healthy by clinical examination and routine haematological and serum biochemical analyses. The cats were part of a concurrent study investigating the effect of weight gain on feline plasma leptin concentrations, and some of the methods have been previously reported (Appleton et al 2000). The protocol for this study and the care and handling of cats were approved by the Animal Experimentation Ethics Committee of the University of Queensland.
Cats were individually housed and acclimatised to the facilities for a minimum of 2 weeks prior to the commencement of testing. Baseline glucose tolerance and insulin sensitivity were determined prior to weight gain. Cats were then transferred to a group housing facility and offered a combination of two commercially available, extruded foods of high energy density (450 Kcal and 480 Kcal metabolisable energy per 100 g). The diets were composed of 33% protein, 22.3% fat, and 30.2% carbohydrate; and 40% protein 26.6% fat and 17.2% carbohydrate, respectively. To promote weight gain, the diets were fed ad libitum for an average of 10.5 ± 1.1 months (range, 9–12 months). After weight gain, the cats were transferred to individual housing for a minimum of 4 weeks, prior to undergoing glucose tolerance, insulin sensitivity and meal response tests.
Assessments of bodyweight and body composition
Bodyweight, body mass index and body condition scores were recorded in all cats prior to, and after gaining weight. Body condition scores were determined from the Iams Body Condition Score Chart using a scale of one to five (Sunvold & Bouchard 1998a). Body mass index was determined in cats using the formula:

Lean body mass, fat mass and body fat per cent were measured in cats after weight gain by dual energy X-ray absorptiometry (DEXA) with a fan beam X-ray bone densitometer (Hologic QDR-4500A; Hologic Inc.), using human adult software version 9.1 (Sunvold & Bouchard 1998a). Cats were sedated with medetomidine HCL (Domitor; Novartis Animal Health Australasia) at a dose rate of 50–100 μg/kg intramuscularly, based on estimated lean bodyweight. Whole-body scans were done with cats placed in ventrodorsal recumbency. Scans were performed on the day immediately following the final metabolic test in obese cats. Cats were classified as overweight or obese based on having a body condition score of 4 or 5 respectively, and a DEXA-derived percentage fat content above 30% (Butterwick 2000).
Metabolic testing
Methodologies for the glucose tolerance and insulin sensitivity tests have been previously reported (Appleton et al 2001). At least 24 h prior to testing, jugular catheters (18 gauge × 8 cm, Cook Veterinary Products) were placed under general anaesthesia with propofol (Diprivan; Zeneca) and patency maintained with dilute, heparinised saline.
Insulin sensitivity tests and intravenous glucose tolerance tests were performed on separate days prior to, and after approximately 10 months of weight gain. Meal response tests were performed only after weight gain. Each cat underwent a maximum of one test per 24 h period. Food was removed a minimum of 12 h prior to commencement of the glucose tolerance and insulin sensitivity tests and 36 h prior to the meal response test. Cats were fed immediately after the end of each test.
During the glucose tolerance test, plasma glucose and insulin concentrations were measured at baseline and at 2, 5, 10, 15, 30, 45, 60, 90, and 120 min after a glucose infusion. The rate of disappearance for glucose (Kglucose) and the glucose half-life (T1/2) were calculated by linear regression analysis of the semilogarithmic plot of glucose concentration vs time between 15 and 90 min after glucose administration (Link & Rand 1998). Areas under the glucose and insulin curves were calculated by the trapezoidal method for the entire 120-min test period (Rowland & Tozer 1989). The curves were calculated from above the lower limit of detection for the individual assays which was 3 mg/dl for glucose, and 3 μU/ml for insulin (Yellow Springs Instrument Co., Lutz & Rand 1993). Insulin response was determined from the area under the insulin curve, for the first 10 min after glucose infusion, the first 60 min, the second 60 min and for the entire 120 min test period, after subtracting baseline values. Insulin response was also expressed as the absolute peak insulin concentration, the modal time to peak and the incremental insulin peak response (difference from fasting insulin concentration to peak insulin concentration) (Rottiers 1981).
After weight gain, cats were divided into two groups based on the presence or absence of impaired glucose tolerance. Impaired glucose tolerance was defined as being present when one or more of the values for T1/2 or plasma glucose concentrations at 0, 60, 90 or 120 min during a glucose tolerance test, exceeded the upper limit of the population 95% tolerance intervals. The tolerance intervals for these values were determined previously using the same protocol in 32 clinically healthy, normal weight cats, 16 of which were used in the current study (Appleton et al 2001). The upper limit of the normal reference range for T1/2 was 74 min, and for glucose concentrations at 0, 60, 90 and 120 min were 104, 223, 163, and 108 mg/dl respectively (Appleton et al 2001).
Insulin sensitivity was determined using Bergman's MINMOD computer program where a mathematical model of glucose disappearance is used to estimate insulin sensitivity (Bergman et al 1979). This method is based on the frequently sampled intravenous glucose tolerance test, modified to include an injection of both glucose and insulin (Finegood et al 1990, Welch et al 1990). In summary, the model provides an index of insulin sensitivity (SI), defined as the dependence of fractional glucose disappearance on plasma insulin (Bergman et al 1979). This index is a measure of how a given change in plasma insulin can increase the clearance of plasma glucose (Beard et al 1986). A decreasing index value indicates that the subject is less sensitive to insulin. Other indices calculated from the model include glucose effectiveness (SG), glucose estimated at zero insulin G(0), the acute insulin response to glucose (AIRg) and parameters p2 and p3 (Bergman et al 1985).
In preparation for the meal response test, obese cats underwent a 2-week adaptive period during which their daily dietary intake was altered from free-access to meal feeding. This was achieved initially by limiting access to their feed bowls to daylight hours only for 4 days, then limiting access to 4 h per day for 4 days, then 2 h per day for 4 days, until finally limiting access to only 1 h per day for 2 days. The diet fed during the meal response test was an extruded food consisting of 33% protein, 22.3% fat, and 30.2% carbohydrate. Ingredients in the diet included chicken, chicken by-product meal, rice flour, ground corn, chicken fat, dried egg product, dried beet pulp, chicken digest, fish meal, brewers dried yeast, dl-methionine, minerals and vitamins. Food was withheld for 36 h prior to the test. Two baseline samples were collected (4 ml each), approximately 5 min apart. Immediately following the last baseline sample, cats were fed a meal equal to half their average daily intake as calculated from their average food intake over the two weeks prior to commencement of the adaptive feeding program. Cats were allowed approximately 15 min to consume their meals. Additional 4 ml blood samples were collected at 1, 2, 4, 6, 8, 10, 12, 15 and 18 h after the food was consumed.
Areas under the glucose and insulin curves were calculated by the trapezoidal method for the entire 18-hour test period (Rowland & Tozer 1989). The curves were calculated from above the lower limit of sensitivity for the individual assays. Results of glucose and insulin assays from the two baseline samples were averaged as one baseline value. Average glucose and insulin concentrations during the meal response test were calculated as the average of baseline, 1, 2, 4, 6, 8, 10, 12, 15 and 18 h samples (Sunvold & Bouchard 1998b).
Sample handling and analysis
Blood samples from each of the tests were handled similarly. Samples were placed into sterile EDTA vacuettes containing the proteinase inhibitor, aprotinin (Trasylol; Bayer), at 0.05 ml per ml of blood. After collection, samples were kept on ice for 15–30 min until centrifugation for 8 min at 1500 g. After separation, each plasma sample was split, placed into a 500 μl vials, and stored at −70°C until assayed for glucose and insulin.
To maintain red blood cell mass, any red cells remaining in EDTA tubes after plasma was removed, were washed and autotransfused as previously described (Appleton et al 2001).
Glucose was measured in plasma using a YSI glucose analyser (YSI 2300 Stat Plus; Yellow Springs Instrument Company). Insulin was measured using a commercially available kit which has been validated for the detection of feline insulin (Phadeseph Insulin Radioimmunoassay; Pharmacia and Diagnostics AB) (Lutz & Rand 1993).
Statistical analysis
Statistical analysis was performed using a statistical software package (Sigmastat version 2.0 for windows; SPSS Inc.). For normally distributed data, variables were compared before and after weight gain, with analysis of variance (ANOVA) for repeated measures. When significant differences were detected, comparisons of the mean responses to the different treatment groups were made using the Tukey test. For non-normally distributed data, a Friedman repeated measures ANOVA on ranks was performed.
Pearson product moment correlation tests and linear regression analysis were used to measure the strength of association between variables. When comparing variables between cats with impaired or normal glucose tolerance and in gender comparisons, Student's t-tests were performed.
To evaluate which factors placed cats at higher risk for the development of glucose intolerance, relative risk and 90% confidence intervals were calculated according to standard formulas (Altman 1991). When evaluating relative risk, we defined indices as being either above or below the second quartile, or median value of the reference range previously determined by our laboratory in 32 clinically normal cats (Appleton et al 2001). Using this definition, the median value for basal insulin concentration in normal cats was 7.22 μU/ml, the insulin sensitivity index (SI) was 2.37×10⁻⁴/min/μU/ml, glucose effectiveness (SG) was 2.48 ×10²/min, acute insulin response (AIRg) was 247 μU/ml and glucose at zero insulin G(0) was 301 mg/dl.
A P value <0.05 was considered significant. All data are reported as mean ± 1 standard deviation (SD), followed by range in parenthesis.
Results
Body weight and body condition profiles
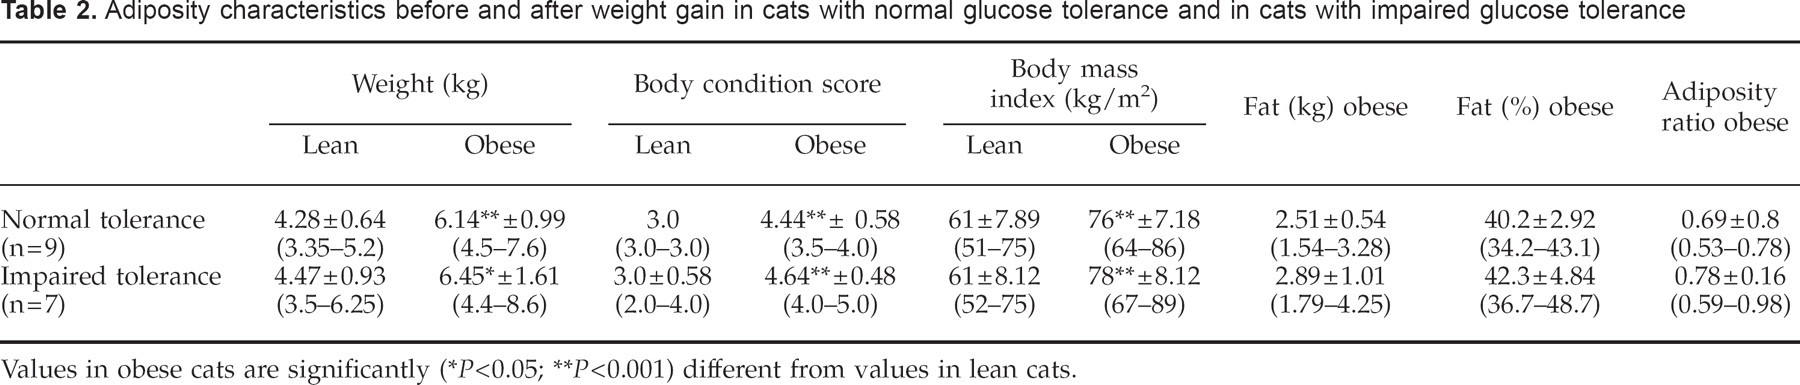
Highly significant increases in body weights, body mass indexes and body condition scores occurred following an average weight gain of 1.91 kg or 44% (Appleton et al 2000). Mean body weight of the cats increased from 4.37 kg (range, 3.35–6.25 kg) before weight gain, to 6.28 kg (range, 4.4–8.6 kg) after weight gain (P<0.001). Based on body condition scoring, six cats became overweight (score=4) and 10 became obese (score=5). Based on DEXA, obesity has been defined as more than 30% body fat (Butterwick 2000). All cats had more than 30% body fat (range, 34.2–48.7%) and thus could be classed as obese.
As previously reported, male cats gained more weight (54% vs 39% body weight) and were significantly heavier after weight gain than female cats, although their initial weights were not significantly different (Appleton et al 2000). Before weight gain, the mean body weight for male cats was 4.78 kg and for females was 4.12 kg. After weight gain, the mean body weight for male cats was 7.26 kg and for females was 5.69 kg (P<0.001). Male cats also had a significantly higher fat mass (3.2 kg vs 2.3 kg) and lean body mass (4.1 kg vs 3.4 kg) compared to female cats, reflecting their higher weight gain. Body condition scores and body mass indexes were not significantly different before or after weight gain in male cats compared with female cats.
Glucose tolerance test
Glucose and insulin. During the glucose tolerance test, glucose concentrations were significantly higher after weight gain at all time points with the exception of baseline (fasted) glucose (Table 1, Fig 1A). Insulin concentrations were significantly higher after weight gain at most time points including baseline (Table 1, Fig 1B). Likewise, area under the glucose and insulin curves were significantly (P<0.001) greater after weight gain (Table 1, Fig 1).
Glucose and insulin parameters during an intravenous glucose tolerance test in 16 cats before and after gaining weight

Within a column, values in obese cats are significantly different
(P<0.05
P<0.001) from values in lean cats.
T1/2, glucose half-life; Kglucose, glucose disappearance coefficient; AUC, area under the curve.

Mean plasma glucose (1A) and insulin (1B) concentrations during a glucose tolerance test in 16 cats before and after becoming obese. Values in obese cats (—□—) are significantly (* P <0.05 and ** P <0.001, respectively) different from values in lean cats (—♦—).
After weight gain, the modal time for the absolute insulin peak concentration was delayed from 10 min to 60 min and was also significantly higher (Table 1, Fig 1B). In contrast to normal-weight cats, mean insulin concentrations in cats after weight gain had not returned to baseline by 120 min after glucose infusion (Fig 1B).
Insulin response during the first 10 min after glucose infusion, representing first phase insulin response, was 28% lower in obese cats compared with when they were lean, although the difference was not significant (P=0.08), (Fig 2). In the first hour after glucose infusion, insulin response was similar before and after weight gain (Fig 2). In the second hour, insulin response in lean cats decreased towards baseline but remained high in the obese cats, so that obese cats had significantly (P <0.001) higher insulin response to glucose in the second half of the test (Fig 2).

Mean area under the insulin response curve during the first 10 min, the first hour and the second hour after clucose administration in 16 cats before and after becoming obese. Values in obese cats (▪) are significantly (* P<0.05) different from values in lean cats (□).
Based on significant correlation analyses in obese cats, cats with the highest baseline insulin concentrations gained the most weight (r=0.49, P=0.05), weighed the most (r=0.56, P=0.02) and had the greatest total fat mass when obese (r=0.59, P=0.02). Similarly, cats that had the greatest increase in their baseline insulin concentrations gained the most weight (r=0.7, P=0.003) and had the largest total fat mass when obese (r=0.53, P=0.04). Finally, obese cats with the largest area under the insulin curve also had the greatest fat mass (r=0.64, P=0.008).
Adiposity characteristics before and after weight gain in cats with normal glucose tolerance and in cats with impaired glucose tolerance
Values in obese cats are significantly
(P<0.05;
P<0.001) different from values in lean cats.
Glucose and insulin parameters in cats with normal (n=9) and impaired (n = 7) glucose tolerance after gaining weight

Within a column, values in cats with impaired glucose tolerance are significantly different
(P<0.05;
P<0.001) from values in cats with normal glucose tolerance.
Across a row, lean and obese values which do not have a common superscript letter are significantly (P<0.05;
P<0.001) different.
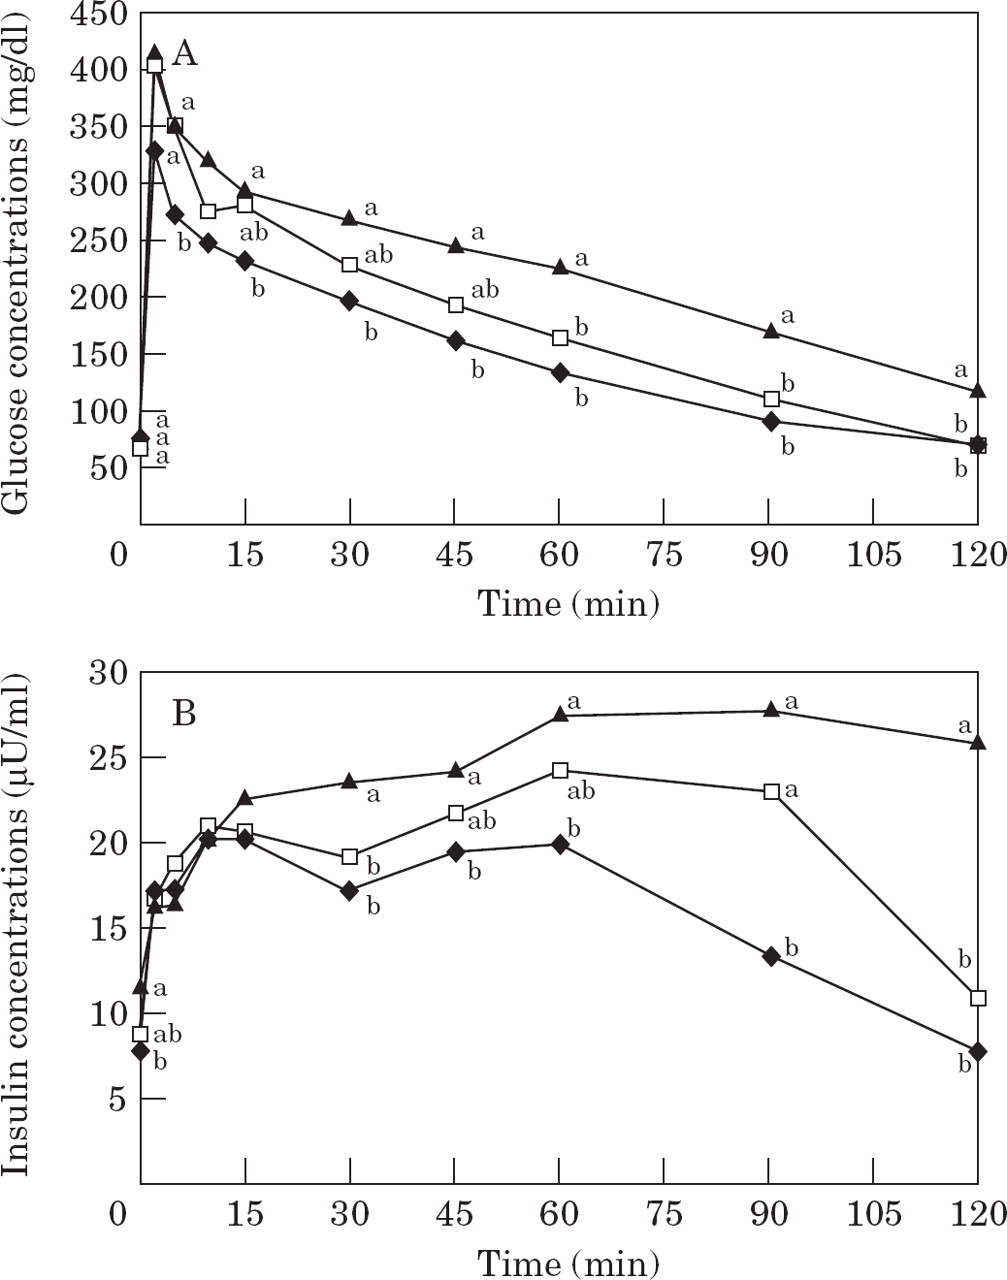
Mean plasma glucose (3A) and insulin (3B) concentrations in 16 lean cats (—♦—), in nine obese cats which maintained normal glucose tolerance after weight gain (NGT; —□—), and in seven obese cats which developed impaired glucose tolerance after weight gain (IGT; —▴—). Values which do not have a common superscript letter differ significantly.
Baseline insulin concentrations were significantly higher after weight gain only in cats that developed glucose intolerance with obesity. These cats also tended to have a lower first phase insulin response (P=0.09), compared with their lean values (Table 3, Fig 3B).
Even when lean, cats which developed glucose intolerance with obesity tended to have higher (27%) baseline insulin concentrations, higher (20%) area under the insulin curve, and lower (15%) first phase insulin response, compared to cats which maintained normal tolerance after weight gain. However, these results were not significant (Table 3). Importantly, lean cats with basal insulin concentrations above the reference range median, were 4.7 times (90% CI, 1.0–22.5) times more likely to become glucose intolerant after gaining weight, compared to those cats with concentrations below the median.
Insulin parameters during an intravenous glucose tolerance test, and the minimal model-derived insulin sensitivity index in male cats (n=6) and in female cats (n = 10), before and after gaining weight
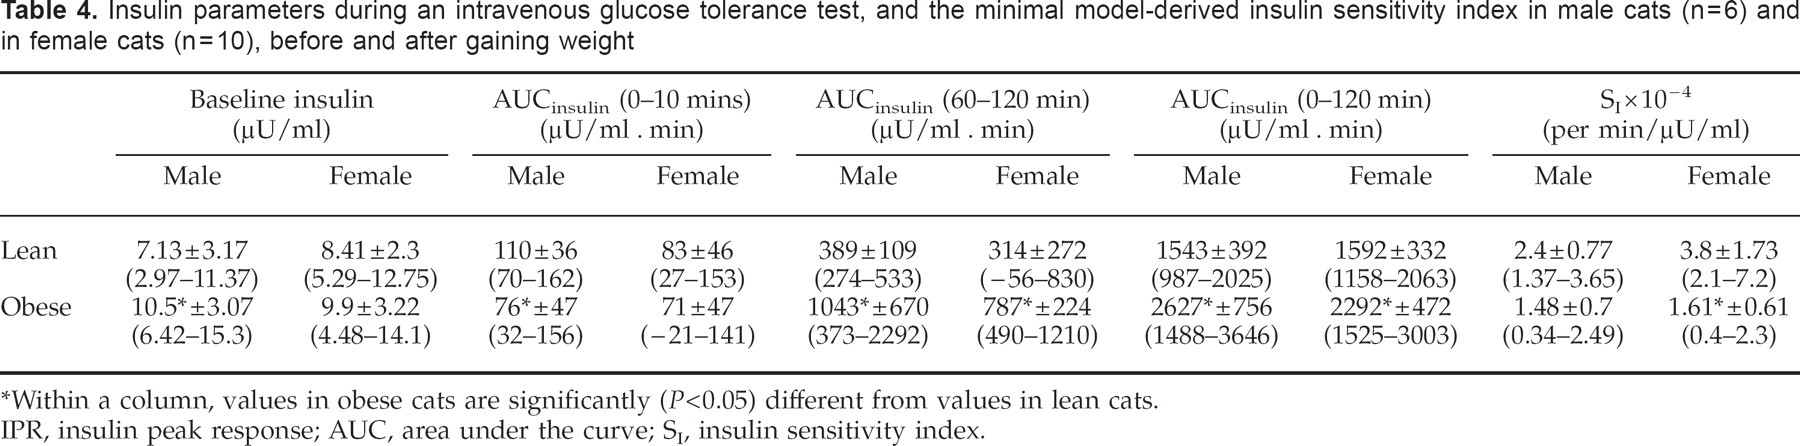
Within a column, values in obese cats are significantly (P<0.05) different from values in lean cats.
IPR, insulin peak response; AUC, area under the curve; SI, insulin sensitivity index.
Glucose parameters during an intravenous glucose tolerance test in male cats (n=6) and in female cats (n = 10) before and after gaining weight

Within a column, values in obese cats are significantly (P<0.05) different from values in lean cats.
T1/2, glucose half-life; Kglucose, glucose disapearance rate constant; AUC, area under the curve.
Insulin sensitivity test
The mean insulin sensitivity index (SI) was reduced (P < 0.001) by half in cats after weight gain (Table 6). Based on significant correlations in obese cats, cats with the lowest sensitivity to insulin, had the highest baseline insulin concentrations (r = −0.55, P = 0.03). Cats with the largest percentage of body fat were the most insulin resistant (r = −0.52, P = 0.04).
Insulin sensitivity and glucose effectiveness indices after an insulin sensitivity test in 16 cats before and after gaining weight

The parameter fractional standard deviations (FSD) provide estimates of the precision with which each parameter has been estimated, and should not exceed 100% for acceptable analysis.
Within a column, values in obese cats are significantly different
(P<0.05;
P<0.001) from values in lean cats.
SI, insulin sensitivity index; SG, glucose effectiveness; G(0), theoretical plasma glucose at time zero as extrapolated from the minimal model; AIRg, the acute insulin response to glucose.
Parameter p2 is the disappearance rate constant of the insulin effect and parameter p3 relates to the ability of insulin to cross the capillary endothelium and its subsequent effects to both increase peripheral glucose disposal and inhibit net hepatic glucose production.
Glucose effectiveness (SG) is a measure of the ability of glucose to promote its own disposal at basal insulin concentrations, and is an important contributor to glucose tolerance (Bergman et al 1985). Glucose effectiveness was reduced (P<0.05) by 26% after weight gain (Table 6). Glucose concentration predicted at time zero G(0) represents the expected plasma glucose level immediately after glucose injection, if there were instantaneous mixing in the extra-cellular fluid compartment (Finegood et al 1984). Glucose concentration predicted at time zero was significantly greater (P=0.004) in obese cats, compared to when they were of normal weight (Table 6).
The ratio of the two parameters determined from the model which define insulin sensitivity (ie p3/p2), represents the total effect of infused insulin to enhance net glucose disappearance (Bergman et al 1985). Hence, a decrease in the parameter p3 will diminish insulin sensitivity, whereas a decrease in the parameter p2 will result in an increased sensitivity (Bergman et al 1985). Because parameter p3 was significantly (P=0.01) decreased after weight gain (Table 6C), this indicates that the distribution and binding kinetics of insulin were significantly less efficient after weight gain, and also implies a decreased coupling with receptor and post-receptor events at the cell (Bergman et al 1985). Parameter p2 however, was unchanged, suggesting that weight gain does not effect insulin-receptor complex internalisation and degradation (Bergman et al 1985).
Insulin sensitivity variables before and after gaining weight in cats with normal glucose tolerance and in cats with impaired glucose tolerance
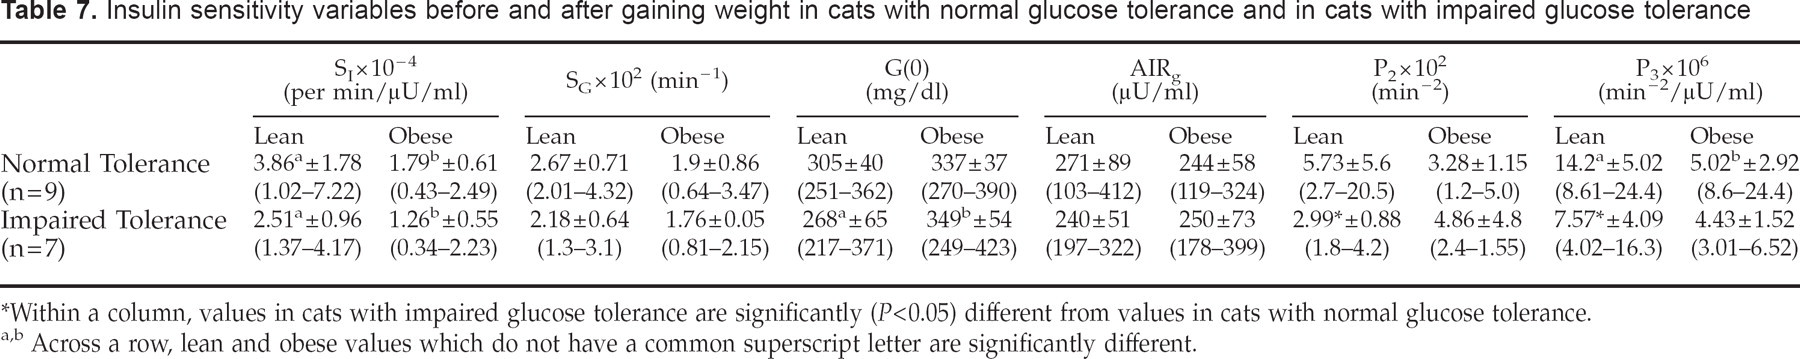
Within a column, values in cats with impaired glucose tolerance are significantly (P<0.05) different from values in cats with normal glucose tolerance.
Across a row, lean and obese values which do not have a common superscript letter are significantly different.
Meal response test
The meal response test evaluates the effect of food on blood glucose and insulin concentrations, and is a more physiologic test than the glucose tolerance test. It was only performed after cats gained weight.
Glucose and insulin parameters during a meal response test in obese male (n=6) and female (n = 10) cats and in cats with normal (n = 9) or impaired (n=7) glucose tolerance after gaining weight

Within a column, values in cats with impaired glucose tolerance are significantly (P<0.05) different from values in cats with normal glucose tolerance.
Within a column, differences between male and female cats approach significance.
AUC, area under the curve; Average=average of baseline, 1, 2, 4, 6, 8, 10, 12, 15 and 18 h samples.

Mean plasma glucose (4A) and insulin (4B) concentrations during a meal response test in obese cats with normal glucose tolerance (NGT;——) and in obese cats with impaired glucose tolerance (IGT; —□—). †Values in cats with impaired glucose tolerance are significantly (P<0.05) different from values in cats with normal glucose tolerance. *Values significantly different from baseline.
Area under the glucose and insulin curves were not significantly different between glucose tolerant and intolerant cats, although the area under the insulin curve tended to be greater in glucose intolerant cats (P=0.07) (Table 8, Fig 4). Both glucose and insulin concentrations generally tended to be higher in glucose intolerant cats (Table 8, Fig 4). Compared to obese cats with normal glucose tolerance, modal time for the absolute peak glucose concentration was delayed from 10 h to 18 h and was also significantly higher in cats with impaired glucose intolerance (Fig 4A). Average glucose and insulin concentrations during the meal response test tended to be higher in glucose intolerant cats, however the difference was not significant (Table 8).

Mean plasma glucose (5A) and insulin (5B) concentrations during a meal response test in obese male and female cats. Values in obese male cats (—♦—) are significantly (* P<0.05) different from values in obese females (—□—).
Discussion
This paper confirms what has previously been suspected based on glucose tolerance tests, that obese cats are insulin resistant (Nelson et al 1990, Biourge et al 1997). Our study shows that the glucose lowering effect of a given amount of insulin, that is insulin sensitivity, is reduced by more than half when body weight is increased by 44% in cats. These results concur with studies in humans, which report a decrease in insulin sensitivity of between 44% and 72% in obese subjects compared with normal weight controls (DeFronzo et al 1978, Bergman et al 1981, Bergman et al 1987, Taniguchi et al 1995).
With weight gain, the insulin sensitivity index of two-thirds of the cats in our study fell below the range previously reported in normal cats (Feldhahn et al 1999). This reported mean and range (mean 3.22 ± 1.16×1004 per min/μl/ml; range 1.71 to 5.73×10⁻⁴ per min/μl/ml) was very similar to that found in the 16 normal weight cats in our study (3.27 ± 1.58×10⁻⁴ per min/μl/ml; range 1.37 to 7.22×10⁻⁴ per min/μl/ml). Importantly, after weight gain 25% of the cats in our study had an index which lay within the range previously reported for diabetic cats (0.14 to 0.88×10⁻⁴ per min/μl/ml) (Feldhahn et al 1999).
Obesity induces insulin resistance by decreasing insulin receptor sites and by decreasing the responsiveness to insulin via receptor and post-receptor defects in glucose metabolism (Olefsky & Kolterman 1981). The primary abnormality in an insulin resistant state is that higher insulin concentrations are required to maintain glucose homeostasis. Basal hyperinsulinaemia and an exaggerated insulin response to glucose occur, and may compensate for obesity-induced insulin resistance so glucose homeostasis is maintained (Porte 1991). These compensatory mechanisms to insulin resistance were evident in our obese cats. In fact, obese cats with the largest body fat percent also had the lowest insulin sensitivity and the greatest increase in basal insulin concentrations with weight gain. This relationship has also been demonstrated with weight gain in humans (Bagdale et al 1967). Eventually, insulin fails to keep pace with deteriorating insulin sensitivity. Long-term demand on beta cells to produce excess insulin is postulated to eventually lead to beta cell ‘exhaustion’ with failure of insulin secretion, resulting in the development of overt diabetes mellitus (Porte 1991). Obesity is a significant risk factor for diabetes in cats (Panciera et al 1990, Crenshaw & Peterson 1996, Scarlett & Donoghue 1998). This increased risk may be explained by obesity-induced insulin resistance and hyperinsulinaemia (Porte 1991). Interestingly, fasting hyperinsulinaemia in lean cats was the greatest single risk factor for the development of impaired glucose tolerance with obesity.
Importantly, our study has also shown that lean cats with underlying low insulin sensitivity are at greater risk of developing impaired glucose tolerance with obesity. In fact, having an insulin sensitivity below the reference range median resulted in a 2.9-fold increased risk of developing impaired glucose tolerance with weight gain. In humans, resistance to glucose-stimulated insulin uptake is present in approximately 25% of non-obese individuals with normal glucose tolerance suggesting there is a wide range of insulin sensitivity in the normal population (Hollenbeck & Reaven 1987). It is the ability of the pancreatic beta cells to increase their rate of insulin secretion that enables these individuals to maintain glucose tolerance despite reduced insulin sensitivity (Reaven 1988). If these individuals gain weight, some may no longer be able to secrete enough insulin to compensate for the further deterioration in insulin resistance accompanying weight gain. In this situation, decompensation of glucose metabolism occurs and impaired glucose tolerance develops. However, not all overweight and obese individuals become glucose intolerant or diabetic. Their ability to compensate for inherent and obesity-induced defects in insulin resistance by secreting more insulin will largely determine whether their glucose tolerance can be prevented from deteriorating (Reaven 1988). Impaired glucose tolerance is a known risk factor for the development of diabetes mellitus in humans (Sasaki et al 1982, Kadowaki et al 1984). Humans with impaired glucose tolerance progress to type 2 diabetes at a rate of up to 6% per year (Sasaki et al 1982, Saad et al 1988, Harris 1989). In our study, nearly half the cats developed impaired glucose tolerance after gaining weight, and these cats may also be more at risk for diabetes.
Glucose effectiveness (SG), indicates the effect of glucose itself, at basal insulin levels, to promote its own disposal (Bergman et al 1986). This glucose effect accounts for a large proportion of glucose uptake, and is a major contributor to overall glucose tolerance status (Bergman et al 1985). Although glucose effectiveness was significantly reduced after weight gain, the magnitude of the decrease was approximately half that of the decrease in insulin sensitivity, suggesting the latter was a greater contributor to the pathogenesis of reduced glucose tolerance. When insulin insensitivity and diminished glucose effectiveness are both present, their deleterious effects have been shown to be strongly synergistic in humans (Bergman et al 1985). Human subjects with both diminished SI and SG, have been shown to be at risk of later developing type 2 diabetes (Warram et al 1990, Martin et al 1992). The same may be true for cats, as the risk of impaired glucose tolerance increased when both insulin sensitivity and glucose effectiveness were diminished.
In humans, insulin resistance is largely genetically determined but is worsened by environmental factors (Porte 1991, Harris 1995). It is interesting to speculate whether the underlying low insulin sensitivity in our lean cats, which increased their risk of impaired glucose tolerance with obesity, was also genetically determined. Studies involving larger numbers of cats are needed to determine whether underlying low insulin sensitivity and elevated insulin concentrations have a genetic basis in cats.
The glucose tolerance test gives a large, non-physiological dose of glucose to stimulate insulin secretion, while the meal response test examines the increase in plasma glucose and insulin levels in response to a meal and is thus a more physiological challenge. The results of the meal response test were similar to the glucose tolerance test, but were less pronounced. Importantly, obese cats with impaired glucose tolerance tended to have higher insulin concentrations throughout the 18-hour study, demonstrating prolonged hyperinsulinaemia in a physiological setting. This prolonged hyperinsulinaemia is a major predisposing factor for diabetes in humans and is postulated to result in cellular ‘exhaustion’ and eventually beta cell failure. The increased occurrence of diabetes in older humans and cats (Panciera et al 1990, Rand et al 1997) is consistent with this ‘beta-cell exhaustion’ hypothesis.
Male cats have a greater risk for developing diabetes than female cats (Panciera et al 1990, Crenshaw & Peterson 1996, Rand et al 1997). The reason for this increased risk may be related to two factors. Firstly, male cats are predisposed to obesity (Walker et al 1977, Scarlett et al 1994, Robertson 1999). In our study, males gained more weight than females, and when obese, had a significantly higher fat mass than female cats. Our study showed that the greater the fat mass, the less effective insulin is in reducing plasma glucose. Both decreased insulin sensitivity and obesity increase the risk of diabetes in humans.
The second factor likely to increase the risk for diabetes in male cats is their tendency to have lower insulin sensitivity values than females when lean, which deteriorated further with weight gain. Only male cats had significantly increased basal insulin concentrations after weight gain, and the absolute concentration tended to be higher than in obese female cats. Reduced insulin sensitivity and hyperinsulinaemia increases the risk for developing diabetes in humans with a family history of the disease (Warram et al 1990). If this trend for lower insulin sensitivity and higher insulin concentrations in male cats is true for the general population, it may explain why male cats have a 1.5 times greater risk of developing diabetes than female cats (Panciera et al 1990). Excess caloric intake, obesity and inactivity may contribute to, or interact with these underlying defects, ultimately leading to the development of diabetes.
In humans, insulin resistance is frequent in indigenous populations with a high incidence of diabetes (Schraer et al 1988, King & Rewers 1993). The ‘thrifty gene’ and ‘carnivore connection’ theories have been proposed to explain this high incidence of insulin resistance and diabetes (Neel 1962, Brand Miller & Colagiuri 1994). According to the ‘thrifty gene’ theory, cycles of famine and abundance of food during human evolution promoted genetic selection for individuals with mechanisms to increase body fat deposition for subsequent use during periods of famine (Neel 1962). Selection for individuals with resistance to the glucose lowering effect of insulin, but not to the fat-forming effect of insulin, would decrease glucose metabolism in muscle and promote fat deposition from glucose when food was plentiful. This potentially conferred a survival advantage in times of reduced food availability (Neel 1962). The carnivore connection theory expanded on this theory to propose that insulin resistance was also advantageous with traditional indigenous diets, which were high in protein (Brand Miller & Colagiuri 1994). Resistance to insulin's glucose lowering effect but not the fat forming effect, allowed blood glucose to be maintained when insulin was secreted after a high protein meal, thus promoting insulin's anabolic effects such as fat deposition while maintaining blood glucose concentrations (Brand Miller & Colagiuri 1994). In both theories, the advent of plentiful food resulted in lack of exercise and obesity, which compounded the hyperinsulinaemia of insulin resistance. Additionally, the carnivore connection theory proposed that the change to a diet containing high levels of highly processed carbohydrates further compounded the hyperinsulinaemia and increased the demand on beta cells to produce large amounts of insulin throughout life. In both theories, long-term hyperinsulinaemia is postulated to result in beta cell failure and type 2 diabetes mellitus.
Cats are obligate carnivores and as such, have evolved to survive and reproduce on a low carbohydrate intake (McDonald et al 1984). However, modern domestic cats are relatively physically inactive and are fed energy dense commercial diets containing high levels of processed carbohydrate. In this situation, insulin resistance is no longer advantageous. If the ‘thrifty gene’ theory is correct, low sensitivity to insulin's effect on glucose may predispose cats to obesity by shunting glucose into fat deposition. Because male cats tended to have lower insulin sensitivity than females, it may explain why male cats gained more weight than females and why more male cats are obese in the general population (Sloth 1992, Scarlett et al 1994, Robertson 1999).
Conclusion
Our study is the first to quantify the degree of insulin resistance in obese cats and show that insulin sensitivity was halved with obesity.
Forty-four percent of cats developed impaired glucose tolerance with obesity. In these cats, insulin concentrations were higher both before and after an intravenous glucose dose and consuming a meal, compared to obese cats which maintained normal glucose tolerance. In humans, impaired glucose tolerance and hyperinsulinaemia are major predisposing factors to type 2 diabetes.
Importantly, we have shown that lean cats with insulin sensitivity below the population median for clinically healthy cats, are at increased risk of impaired glucose tolerance with obesity. Reduced glucose effectiveness further increased this risk. Significantly, fasting hyperinsulinaemia in lean cats was the single greatest risk factor for impaired glucose tolerance with obesity. This is consistent with the theory that impaired glucose tolerance and diabetes develop after long-term, excessive insulin secretion leading to eventual failure of pancreatic beta cells (Porte 1991, Hoenig 1998).
Male cats tended to have approximately 37% lower insulin sensitivity than females. A larger study is needed to determine if this difference is a significant finding in the general feline population. If male cats are found routinely to have lower insulin sensitivity than females, it may in part, explain the predisposition of male cats to obesity and diabetes.
Importantly, our study suggests that some cats have an underlying predisposition to develop glucose intolerance, and if these cats become obese, they may be at greater risk of developing overt type 2 diabetes over time. Further studies are required to determine whether low insulin sensitivity is genetically determined, as it is in humans. Preventative programs aimed at reducing body weight and improving insulin sensitivity would be most effective if directed at cats with underlying low insulin sensitivity. A prospective study is necessary to determine whether factors identified in this study, such as low insulin sensitivity and elevated basal insulin concentrations, are useful predictors for type 2 diabetes in cats. This may lead to the development of simpler methods, useful in clinical practice, of identifying which cats have increased risk of becoming diabetic.
Footnotes
Acknowledgements
Appreciation is expressed to Rachael Price, Rebekah Wilson and Debbie Laws for their assistance with animal care and data collection, to Lyn Knott for her help with sample analysis, to Jan Priest for her statistical advice, to Dr David Carey and Janet Ames for their advice and assistance in performing DEXA scans, Greg Martin for his technical assistance and to The Iams Company for funding this project.