
Abstract
Comparing therapeutic agents in a drug class can be difficult. This article examines the ways in which the triptans can be and have been compared and evaluates the advantages and disadvantages of the approaches. Direct comparative trials are clearly the best method for evaluating the triptans, however, there is a scarcity of this type of data on the currently available compounds. Indirect comparison such as meta-analysis is a second method of comparing these agents but only serves as an estimate of relative efficacy or safety based on a comparison of pooled data derived from a number of different trials for each agent. Comparison of the data found in the regulatory documents represents another type of indirect comparison that can be done so long as the data is presented in a consistent format across products.
Introduction
Sumatriptan has been available in most countries since the early 1990s and was the only triptan on the market until zolmitriptan, rizatriptan, and naratriptan began entering the market in 1997. With the advent of the newer triptans came the need to compare the agents in order to have the necessary information to allow clinicians to make informed decisions on the proper medication for the individual patient.
A number of methods have been tried to compare triptans but unfortunately, each of these methods has its own unique set of pitfalls that include design issues and biases. The purpose of this review is to examine some of the methods and discuss the advantages and disadvantages of each approach. When one reviews the evidence for migraine-specific medicines, efficacy, speed of onset, consistency of response and tolerability are the four key factors that are considered. This discussion is limited primarily to the comparison of efficacy across the triptan class.
Methods to compare the efficacy of the triptans can be divided into two broad groups: direct and indirect comparisons. Meta-analyses and comparison of information supplied to regulatory authorities (i.e. information found in the product labelling) are two examples of indirect comparisons. These methods will be discussed below.
Direct comparative trials
As would be expected, well-designed direct comparative trials provide the strongest evidence for any therapy. Unfortunately, these types of studies, particularly for the newer agents coming to the market, are very scarce, and sometimes incorrect or overstated conclusions are based on very small differences in the results.
A number of issues associated with direct comparative trials make it necessary to examine carefully the data before making decisions on therapy.
Patient randomization: effect on placebo response
Data from two direct comparative trials comparing sumatriptan and zolmitriptan have been published thus far and provide the opportunity to discuss two of the issues that make evaluating the evidence so challenging. The first study by Geraud et al. (1) was a double-blind, placebo-controlled trial comparing the efficacy and safety of sumatriptan and zolmitriptan in the acute treatment of migraine. The primary efficacy endpoint was complete response rate, defined as improvement in migraine headache from moderate or severe pain to mild or no pain after 2 h with no recurrence within 24 h. Secondary endpoints of the study included efficacy in treating headache at 1, 2 and 4 h postdose, headache recurrence rates, and adverse events.
Patients were randomized in an 8:8:1 fashion to receive either sumatriptan 100 mg, zolmitriptan 5 mg, or placebo, respectively, to treat a single acute migraine attack. The large imbalance in the randomization ratios may have contributed to a very high placebo response (1, 2). The high placebo response coupled with low numbers in the placebo group meant that no difference was seen between the placebo group and the active treatments for the primary endpoint (Fig. 1). After an initial look at the primary endpoint data, one might quickly conclude that neither active treatment is better than placebo. However after the randomization scheme is identified and the data carefully evaluated, it becomes clear that the actual individual response rates for the active compounds are very comparable to other trials. The headache response rates at 2 and 4 h were better than placebo (P < 0.05) despite the high placebo rates. In addition, after careful evaluation of the data in this trial it becomes clear that the two active treatments are equal in terms of complete response at 24 h as well as headache response at 2 and 4 h. Adverse events were also similar for both active treatment groups.

Potential bias from prior exposure to one of the study drugs
The second direct comparison of sumatriptan and zolmitriptan was the Zomig Comparative Trial (ZOMCO) (3). This was a multicentre, double-blind, parallel-group clinical trial designed to compare zolmitriptan 2.5 mg or 5 mg and sumatriptan 25 mg or 50 mg in the acute treatment of migraine. A total of 1445 patients were randomized in a 1:1:1:1 fashion into each treatment group. The primary efficacy endpoint was headache response at 2 h. The 2-h response rates were 59.6% for sumatriptan 25 mg, 63.8% for sumatriptan 50 mg, 67.1% for zolmitriptan 2.5 mg and 64.8% for zolmitriptan 5 mg (Fig. 2). The numerical results for 2-h response rates of the ZOMCO study are very similar to those seen in the Geraud study (1). However in the Geraud study, there was no statistical difference between the active treatment groups whereas in the ZOMCO study, zolmitriptan 2.5 mg was statistically better than sumatriptan 50 mg. In addition, zolmitriptan 2.5 and 5 mg were both statistically better than sumatriptan 25 mg.
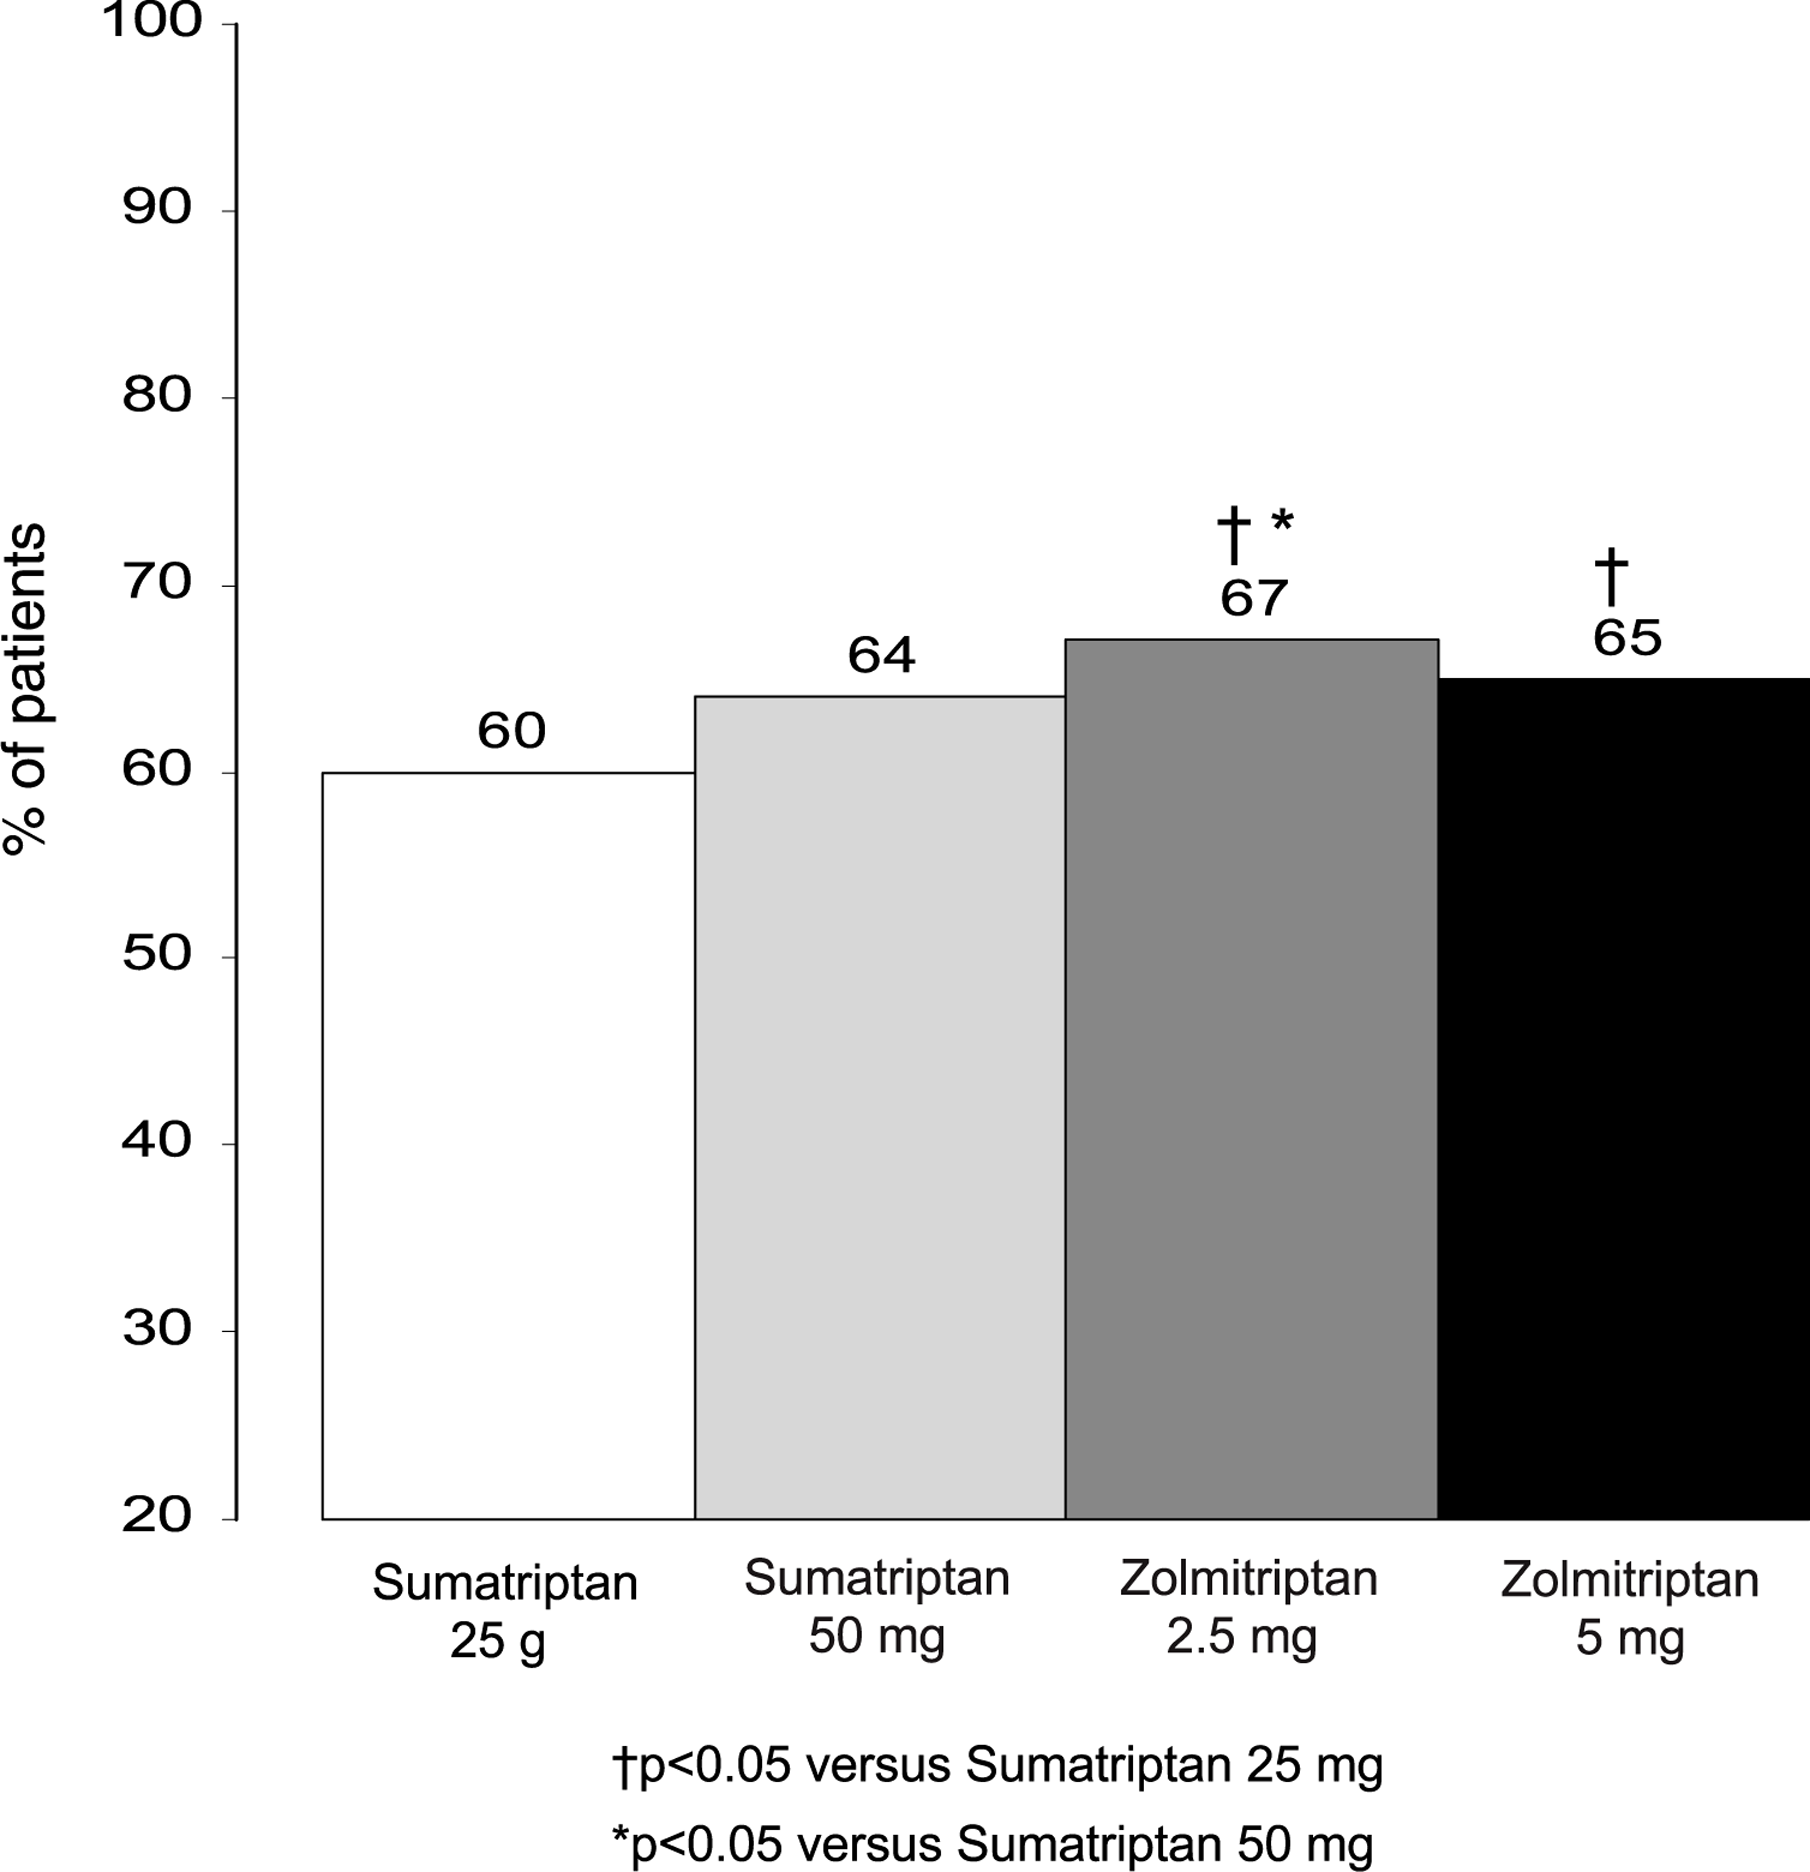
Headache response rate at 2 h in the Zomig Comparative Trial (ZOMCO) (3).
Why did the ZOMCO study show a statistical difference in treatment groups while the Geraud study did not? First, the ZOMCO study was a very large trial with approximately 300 patients (range 295–306) per treatment arm, who treated up to six migraine attacks. All of these data were put into one analysis that provided enough power to show a statistical difference between treatments even in light of the small numerical differences. A second possible explanation is the fact that this study did not use sumatriptan-naive patients. Using non-sumatriptan-naive patients opens the study up to potential bias. It is well recognized that failure of one triptan does not necessarily preclude response to another triptan. As a result, a bias in favour of zolmitriptan may exist due to the fact that patients who had an unsatisfactory response to sumatriptan were not excluded. Of interest, retrospective comparisons of naratriptan to sumatriptan in sumatriptan-experienced and sumatriptan-naive patients have shown that the biases can actually be introduced both ways (4).
Time-to-event analysis: problems associated with its use in headache trials
Four studies comparing sumatriptan to rizatriptan have been published (5–9). In two of these studies (5, 6), the primary endpoint was time to first headache relief up to 2 h postdose. Time to headache relief between two active treatment groups was measured by doing a time-to-event analysis that examined the cumulative probability of first report of postdose headache relief across time points up to and including 2 h. There are many methods of comparing treatment groups in a survival analysis, such as Kaplan–Meier curves and Cox regression models. The treatment groups in these two studies are compared using Cox regression models. One way in which treatment difference can be summarized is by the use of hazard ratios, which are used to make statements about group differences in the instantaneous probability of a response (i.e. the probability that a patient will respond in the next instant of time given that he or she has not already responded). Time-to-event analysis offers advantages, such as the accommodation of censored data (data for patients who are lost to follow-up, do not have a response prior to the completion of follow-up, etc.) and the ability to include early time points, however, this type of analysis may not be the most appropriate method of determining onset of relief. Time-to-event analysis was basically developed in cardiovascular medicine and oncology where it has been used to measure time to death, a finite event. The difficulty in using this type of analysis in the evaluation of migraine therapies is that the cumulative nature of this analysis does not account for patients who achieve headache relief, but go on to lose that relief before the 2-h postdose time point.
For example, Tfelt-Hansen et al. (5) and Goldstein et al. (6) published the results of two comparative trials between sumatriptan and rizatriptan where the primary endpoint of both studies was defined as time to headache relief. The prospectively defined intent-to-treat analysis failed to detect a difference in time to pain relief in the study by Tfelt-Hansen et al. (5). Goldstein et al. (6) reported a statistical difference (P = 0.046) between rizatriptan 10 mg and sumatriptan 50 mg. The Goldstein study was a two-period crossover, double-blind, placebo-controlled outpatient study designed to compare oral sumatriptan with oral rizatriptan in the acute treatment of two migraine attacks. The primary efficacy endpoint was a comparison of sumatriptan 50 mg with rizatriptan 10 mg in terms of time to first headache pain relief up to 2 hours postdose. In this study, 75% of the rizatriptan patients had experienced headache relief at some time point within 2 hours compared to 69% of the sumatriptan-treated patients. The hazard ratio was calculated to be 1.14 (95% CI was 1.00–1.29) and the difference between treatment groups was statistically significant in favour of rizatriptan. Note in Table 1 that at 2 h 72% of the patients in the rizatriptan group have headache relief, while 68% of the patients in the sumatriptan group have headache relief. This indicates that 3% of the patients in the rizatriptan group and 1% of the patients in the sumatriptan group had obtained their first headache relief sometime within 2 h; however, by the 2 h time point the patients had actually lost that relief. If these patients, who for all practical purposes are study failures, are excluded, this study would likely lose its statistical significance.
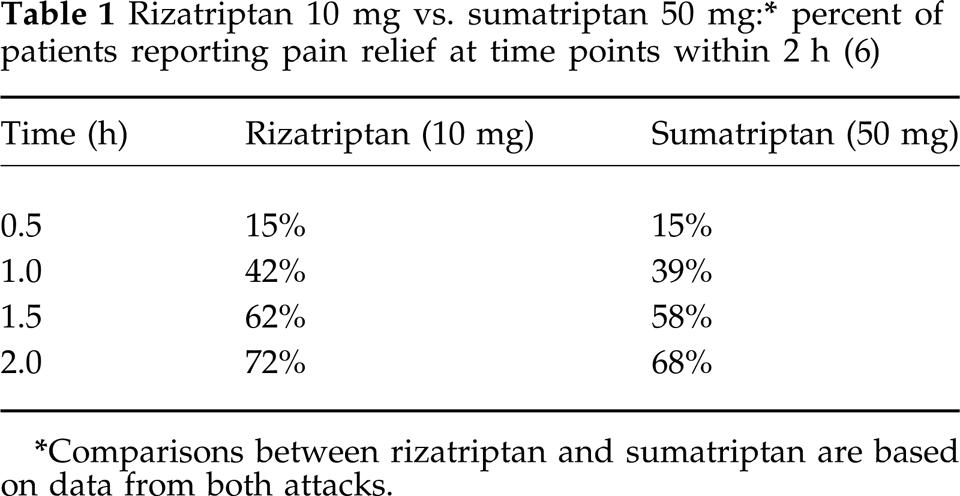
Comparisons between rizatriptan and sumatriptan are based on data from both attacks.
Another misconception arising from the time-to-headache relief analysis is the concept that the compound that demonstrates a statistical difference in this analysis will also have the faster onset of action. A time-to-event analysis essentially combines two pieces of information (1), the probability of response within 2 h across all patients and (2) the time to response for those patients who respond within 2 h. If these two components that are combined in a time-to-event analysis are investigated separately, it may prove that the above is in fact a misconception. Based on the data from the Goldstein study (Fig. 3) (10), there appears to be about a 4-min difference in the estimated median time to relief in favour of rizatriptan when considering all patients, including those who did not respond within 2 h. Looking at the two components separately, the probability of headache response within 2 h is 72% for rizatriptan vs. 68% for sumatriptan, showing a slight benefit for rizatriptan. If one defines time to pain relief in patients who actually had relief (conditional response analysis) (11) the time to pain relief is the same for both drugs (Fig. 4) (10).

Estimated median time to pain relief at 2 h using all study patients in the analysis (time to relief analysis) (10).

Estimated median time to pain relief at 2 h using only the patients with pain relief at 2 h (conditional response analysis) (10).
Importance of the choice of study endpoints
A number of years ago the efficacy of naratriptan at 4 and 24 h was compared to that of zolmitriptan (12). This trial was stopped early because of issues relating to clinical supplies, and only 200 of the targeted 728 patients were enrolled. While the efficacy was similar at 4 and 24 h for both treatments, the use of a 4-h primary endpoint makes assessment of efficacy difficult compared to agents evaluated using the more accepted 2-h endpoint. The use of a 4-h primary endpoint was a factor of early triptan trial design and in hindsight, was a mistake. A study comparing rizatriptan to naratriptan using headache relief at 2 h showed a significant difference in favour of rizatriptan (13).
Treatment blinding: use of encapsulation
Data was presented in 1999 that combined the results of several comparative trials of sumatriptan and eletriptan (14). In an effort to blind the treatments, an encapsulated form of sumatriptan was used, while eletriptan was not encapsulated. The encapsulation (combined with the well-known gastric stasis occurring during migraine) may have adversely affected the absorption and efficacy of the sumatriptan. Although bioequivalence studies of the encapsulated form of sumatriptan had been conducted, these trials were conducted in healthy volunteers. Because of the gastric stasis that occurs during migraine, bioequivalence studies conducted in healthy volunteers may not be applicable to patients taking triptans during a migraine attack. Figure 5 shows the results of a number of the comparative trials against sumatriptan. In the trials that utilized encapsulated sumatriptan, the response rates appear to be considerably lower than those seen in other comparative trials. While it is acknowledged that part of the difference between regular and encapsulated tablets can be explained by variable placebo response rates, the 95% confidence intervals for the 2 h response rates for the regular tablets vs. the encapsulated tablets do not overlap (Table 2).
Sumatriptan tablets vs. encapsulated sumatriptan: meta-analysis of response rates in comparator studies
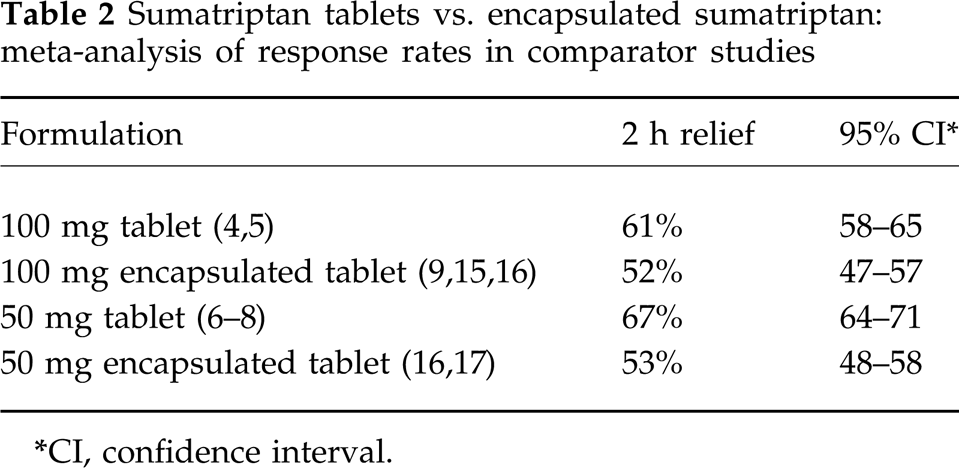
CI, confidence interval.

Assessment of consistency of response
Consistency of response is usually measured as the long-term consistency from open-label studies. The difficulty with this approach is that the patients who respond to the study medication during most attacks and have few adverse events are the ones who stay in the trial, making the response rates and consistency over time very high. Figure 6 demonstrates the high response rates seen in these long-term open-label studies. The best way to evaluate consistency of response is to look at intrapatient consistency in a double-blind fashion. Intrapatient consistency has been reported in at least two studies (18, 19). Both were placebo-controlled and thus the bias introduced on long-term open-label studies is not relevant.

Reported median response rates from long-term open-label studies used to demonstrate consistency of response with continued triptan use. Sumatriptan treatment during months 1–6 and months 7–12 (Data on file; Glaxo-Wellcome) and rizatriptan treatment for up to 1 year (20).
In the study by Kramer (18), patients were divided into five treatment groups and treated four migraine attacks. Four of the groups treated three migraine attacks with rizatriptan and one attack with placebo. The fifth group treated all four migraine attacks with rizatriptan. In the study by Pfaffenrath (19), patients treated three migraine attacks with different doses of sumatriptan and placebo. While the Kramer and Pfaffenrath studies demonstrated that rizatriptan and sumatriptan, respectively, had favourable consistency of response across multiple attacks, no comparisons are possible between the two studies because the Kramer and Pfaffenrath studies used very different methodologies. The Kramer design may raise patient expectations and thus improve consistency results (the patients know that they will get active drug either four out of four times or three out of four times.). If this was the case, one might expect the four out of four response on the active drug to be substantially and disproportionately lower than the three out of four response because, with each successful treatment, the patients know their chances of receiving placebo increase dramatically. This is particularly true for the patients where the first three treatments were active. Unfortunately, the four out of four response rate was not reported in the publication. Even if the Kramer design does not allow for assessment of the consistency of placebo response (unlike the Pfaffenrath design), it is closer to real life. The Kramer design is thus probably better if comparisons between different triptans are planned in the future.
Role of patient preferences
The clinical trials that compare efficacy are somewhat artificial for a number of reasons. First, patients are not allowed to treat their headache pain before it has become moderate to severe. Secondly, the trials look primarily at efficacy only at individual time points. Patients, on the other hand, value the treatment by looking at everything which is associated with the individual treatment such as efficacy, onset of action, tolerability, consistency of response, ease of use, and their general overall feeling of wellbeing. At least one clinical trial is currently under way that attempts to more objectively measure patient preference.
Using patient preference data may be one approach to comparing the triptans that provides a more real-life perspective.
Indirect comparisons
Meta-analysis
When direct comparative trials are not available, another approach to comparing the triptans is through the use of meta-analysis. The use of meta-analyses has some inherent drawbacks in that data derived from studies that may have significant differences in design and/or patient populations are pooled to make comparisons of the triptans. Examples of two such meta-analyses will be briefly reviewed. From the pooled clinical data, two factors can be calculated. The first is the NNT (number needed to treat) which represents how many patients must treat one attack to get one true drug response. The second factor is NNH (number needed to harm) which represents how many patients must treat one attack to get one true drug-induced adverse event (see the paper by Sheftell and Fox (21) for specifics on this calculation).
The Bandolier Meta-Analysis (Table 3) (22), compares three formulations of sumatriptan, subcutaneous 6 mg, oral 100 mg, and intranasal 20 mg; naratriptan 2.5 mg; rizatriptan 5 and 10 mg; and zolmitriptan 2.5 and 5 mg. Subcutaneous sumatriptan with an NNT of 2.0, indicating greater efficacy and naratriptan with an NNT of 8.8, indicating lower efficacy, represent the two extremes of this analysis. The remainder of the oral agents and sumatriptan intranasal are intermediate, with NNT values ranging from 2.8 for zolmitriptan 5 mg to 3.8 for rizatriptan 5 mg. In other words, approximately three patients must treat one attack before one true drug response can be seen.
Results of Bandolier meta-analysis

These results represents a summary of randomized comparisons with placebo for pain relief (mild or no pain) at 1 or 2 h (22).
CI, confidence interval.
Peter Goadsby reported the results of his meta-analysis comparing sumatriptan 50 and 100 mg, naratriptan 2.5 mg and zolmitriptan 2.5 and 5 mg in his paper ‘A triptan too far’ (23). Table 4 summarizes the results of this analysis. Again, for sumatriptan and zolmitriptan, approximately three patients must treat one attack before one true drug response can be seen. Possibly more interesting are the NNH data. For naratriptan, 1181 patients must treat one attack to see one true drug-induced adverse event. For sumatriptan 50 mg, the NNH is 14.3 followed by sumatriptan 100 mg and zolmitriptan 2.5 mg with NNH values of 5.9 each and finally zolmitriptan 5 mg with an NNH value of 3.5. Some caution must be used when applying this analysis where there are relatively few side-effects, as in the case with naratriptan. The 95% confidence interval in this case was 24 to infinity.
NNT and NNH data on three available triptans (23)
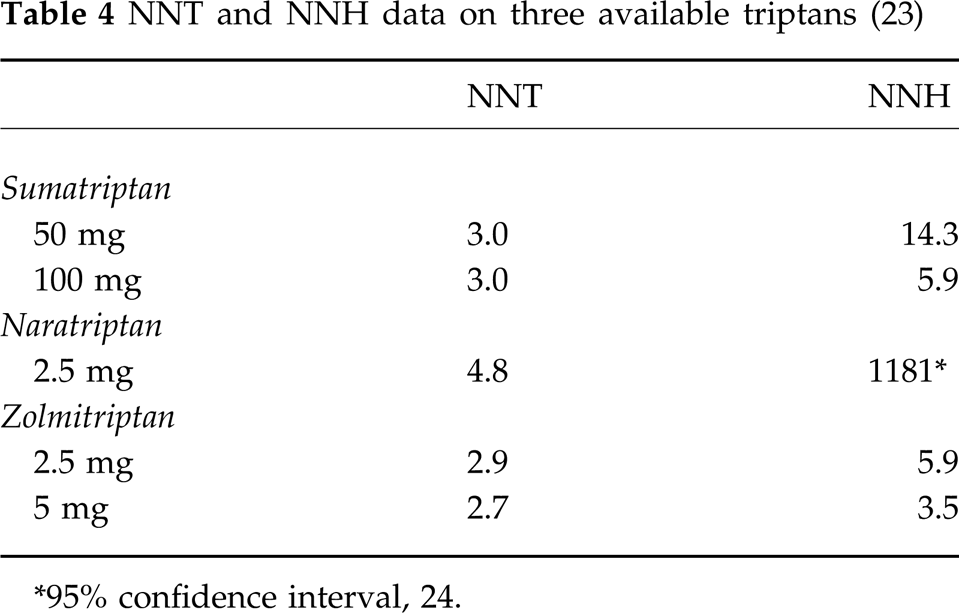
∗95% confidence interval, 24.
Meta-analysis can be a useful tool in the absence of direct comparative trials if the limitations of these types of analysis are carefully considered.
Official product labelling as a source of comparative data
Examining information provided by the regulatory authorities is another indirect method for comparing the triptans. In a manner of speaking, this is another example of a meta-analysis. The data are often presented in the same format and are usually readily available. The drawback to this approach is that the differences in trial designs, patient populations, and in some cases, changes in regulatory requirements over time, make drawing solid conclusions from this type of comparison difficult. The advantage of this data is that it is very carefully and objectively reviewed, even if some of the data may be unpublished. In any case, it provides the practising clinician with additional data above and beyond the published clinical literature.
Information provided or mandated by regulatory authorities is based on data submitted to the various regulatory agencies in order to gain approval for the product and is known by a number of different names around the world: package insert or product information (US), product monograph (Canada) or SPC (European Summary of Product Characteristics). When this information is presented in a similar format across each of the brands as is the case with the US package inserts, loose comparisons of the products can be made. All of the drawbacks associated with a meta-analysis apply to this type of comparison.
In the US package insert, response data in the form of Kaplan–Meier survival curves are presented for each of the marketed triptans. Figure 7 represents a Kaplan–Meier curve derived from the data presented in the sumatriptan and zolmitriptan package inserts. In this comparison, the one variable that can be taken into account and adjusted for is the placebo response, because this data exists in the package insert. Figure 8 represents the same data adjusted for placebo and essentially represents the therapeutic gain (response of active treatment minus placebo response) for sumatriptan and zolmitriptan. The efficacy of sumatriptan and rizatriptan can be compared in a similar manner. The 2 h response rates and the placebo response are listed in the package inserts for both drugs. From this, the therapeutic gain can be calculated. Table 5 summarizes these data. It is clear from these two examples that little difference can be seen between the triptans when comparing the data available in the package inserts.

PI, US Prescribing Information.

Kaplan–Meier plot of the probability over time of obtaining headache response (no or mild pain) following treatment with sumatriptan and zolmitriptan. The averages displayed are based on pooled data from placebo-controlled trials of sumatriptan and zolmitriptan. The data for this figure were adapted from the current US prescribing information for zolmitriptan (24) and sumatriptan (25), and are based on time points at 1, 2 and 4 h for zolmitriptan and 0.5, 1, 2, 3 and 4 h for sumatriptan.

Placebo-corrected Kaplan–Meier curve representing the therapeutic gain (response of active treatment minus the placebo response) for zolmitriptan and sumatriptan. The data for this figure were adapted from the current US prescribing information for zolmitriptan (24) and sumatriptan (25), and are based on time points at 1, 2 and 4 h for zolmitriptan and 0.5, 1, 2, 3 and 4 h for sumatriptan.
Conclusions
Even in the best of circumstances, drug comparisons are truly difficult to do, and the data derived from these comparisons must be carefully weighed when making therapeutic decisions for an individual patient. The examples presented here provide evidence that the currently marketed triptans, with the exception of naratriptan, have very similar clinical efficacy. In this context, factors other than efficacy must be considered in an evidence-based approach to migraine therapy. These would include such factors as overall tolerability and available formulations that affect the clinician's ability to design the proper therapy for the individual patient.
Footnotes
Acknowledgements
The author wishes to express appreciation for the contributions of Gayla P. Putnam, MS and Andrew B. Scott, PharmD.