
Abstract
Some migraine sufferers report certain visual patterns can reliably trigger a migraine attack, such as high contrast striped patterns or flickering lights. Differences between people with and without migraine on tasks that involve these patterns have been attributed to abnormal cortical processing in migraine, although the locus and extent of the abnormality remains unclear, as is any relationship between impairment on various visual tasks. In this study 58 migraine sufferers and 61 control subjects participated in three visual tasks involving striped patterns. One assessed pattern sensitivity with high contrast patterns, the second detection thresholds for low contrast patterns and the third supra-threshold contrast scaling. With each measure, the performance of migraine sufferers as a group differed to the performance of non-migraine control subjects. There were no significant differences between the migraine subgroups when classified according to the presence or absence of aura. Cross-correlating the results from the three tasks, however, revealed consistent associations: impaired or extreme responses on one task were associated with impaired or extreme responses on the others. There were no overall effects due to migraine duration, the frequency of migraine attacks or the time since the last attack. These results are discussed in the context of visually induced migraine, proposed causes of abnormal cortical function in migraine and the prospects for developing clinically useful tests of visual function.
Introduction
Visual function has received much attention in psychophysical and electrophysiological migraine research, due in part to the ability of visual stimuli to induce a migraine attack and in part to the fact that aura symptoms are commonly visual. Previous studies that have shown differences in visual processing between some migraine and non-migraine control subjects have tended to use, as experimental stimuli, patterns that have been reported to induce migraine, such as stripes, checkerboards or flickering light (e.g. (1–3)). For example, contrast discrimination or detection thresholds for low contrast stripes or flickering light have been reported to be elevated in migraine sufferers in that they fail, on average, to detect or to discriminate patterns that would be faintly discernible to control subjects (1, 2). It is not entirely known, however, how migraine can be triggered by particular visual stimuli, why visual patterns affect only a proportion of migraine sufferers, whether links exist between those whose headaches may be visually induced and reports of visual dysfunction in migraine, or indeed the extent of any dysfunction, including whether impaired performance on one visual task predicts performance on a second. One aim of the present study was to address these issues, using three psychophysical measures of visual function, by comparing the performance of migraine sufferers on each task first to the performance of non-migraine control subjects and second to their own performance on the separate tasks.
This paper also addresses abnormal cortical function as an explanation for some of the differences between migraine sufferers and control subjects. Abnormal cortical function is a common explanation from both electrophysiological (e.g. 4–6) and psychophysical (e.g. 2, 7, 8) research, but it has been attributed to different causes and to different cortical areas in each type of research (described further below). This study used a design tailored to the different predictions from previous electrophysiological and psychophysical research by assessing migraine duration and by comparing the performance of individual participants on the different tasks.
There is much converging evidence for abnormal cortical function in migraine that is compatible with interictal hyperexcitability, heightened responsiveness, a lack of habituation and/or a lack of intracortical inhibition. A cortical locus, as opposed to a more peripheral loss of sensitivity (cf. 3), is suggested by the results of psychophysical (2, 7–10), physiological (11), electrophysiological (4–6) and biochemical (12) studies. One example of the psychophysical evidence is reports of heightened ‘pattern sensitivity’ in migraine (1, 7, 13–16). The term ‘pattern sensitivity’ refers to the sometimes aversive illusions and distortions seen in high contrast, mid-spatial frequency striped patterns, such as movement, colour, depth, fragmentation of the straight edges of the bars, glare or shimmer. The illusions have been attributed to cortical processes as their number and severity increase with the height:width ratio of chequered patterns, decrease with monocular viewing and show interocular transfer (7, 17). Neurones with elongated receptive fields and binocular input are first found in the visual system in the primary visual cortex. The aversive patterns have been proposed to produce a sufficiently strong neuronal response to create a minimum failure in cortical inhibition, and the illusions reflect a disruption in the normal balance of inhibition and excitation in the cortex (7). Migraine sufferers may see a greater number and more vivid illusions if their cortex is already characterized by hyperexcitability, heightened responsiveness, a lack of intracortical inhibition and/or a lack of habituation.
Further support for abnormal cortical processing comes from electrophysiological studies that have used visual stimuli such as repetitive flash or contrast reversing checkerboards (2–6, 18–21). During exposure to repetitive visual (4, 5, 20–22) and even auditory (6, 20, 21) stimuli, for example, evoked and event related potentials typically habituate over time. This has been reported not to occur in migraine sufferers; instead, increased amplitude of the recorded potentials and a lack of habituation to repetitive stimuli have been reported. (While recent studies agree that the recordings are on average abnormal, the details of the nature of the underlying abnormality are sometimes conflicting. Some report increased amplitude, others increased latencies, others increased amplitude and latencies, and others a lack of habituation over time of the recorded potentials; for a review see 4.)
Although abnormal cortical function has been proposed as a common explanation for these electrophysiological and psychophysical data using the very displays that can induce a migraine attack, it is surprising that links are not routinely drawn between cortical function and the mechanism(s) of visually induced headache (8, see also 12, 20, 23). To clarify the role of abnormal cortical function in migraine generally, and in visually induced migraine in particular, some of the discrepancies between the conclusions drawn from the psychophysical and electrophysiological research need to be reconciled. First, notwithstanding earlier electrophysiological reports of anomalous recordings only in migraine with (e.g. 19), or without aura (e.g. 4), more recent reports have demonstrated equivalent anomalies in both groups (6, 24, 25). Psychophysical research, on the other hand, continues to draw distinctions between those with and without aura with several reports of differences only in migraine with aura (9, 19, 23, 26).
Second, conclusions drawn from psychophysical and electrophysiological research differ on the proposed locus and extent of any cortical abnormality in migraine. Abnormal event related potentials have been recorded over primary and secondary visual cortical areas (20, 21, 27), the auditory cortex (6, 20, 21, 28), and over the frontal cortex (4, 5). These suggest widespread, diffuse cortical processing differences between migraine and control subjects that have been attributed to general differences in attention and arousal (19) or to low serotonergic transmission that results in low cortical preactivation and heightened cortical responsiveness (6, 20–22). Conversely, differences between people with and without migraine in psychophysical studies have been ascribed to anomalous processing in discrete brain areas. For example, Chronicle and Mulleners (23) and Wray et al. (10) have proposed that hypersensitivity is confined to low-level visual processing (up to Area V1, the primary visual cortex) in migraine with visual aura, although the data to support these proposals are not conclusive.
Taking one of these studies, Wray et al. (10) reported faster reaction times in migraine than in control subjects in two tasks, one that involved judging the temporal order that two stimuli were presented and one that employed a serial visual search task (although the search result has recently not been replicated, see 29). Wray et al. concluded that hypersensitivity was confined to the primary visual cortex as they found no differences between migraine and control subjects in tasks that were designed to tap higher-level visual processes involving the recognition and identification of visual objects. However, performance on tasks such as serial search and temporal order judgement does not necessarily reflect visual processing only up to V1, it also reflects the integrity of the parietal cortex since performance on both tasks is classically disrupted in patients who have parietal damage (30, 31). Faster reaction times may therefore indicate interictal differences in the functioning of the parietal cortex, rather than exclusively in the primary visual cortex, again implicating differences in attention between people with and without migraine. The results of Wray et al. are therefore consistent with the widespread electrophysiological abnormalities that have been reported. It should be noted, however, that faster reaction times might simply reflect a motivational bias between migraine and control subjects.
The results reported by Wray et al. were limited to migraine with visual aura as they did not test migraine sufferers without aura. Chronicle and Mulleners (23), however, have suggested that only those with visual aura have heightened cortical sensitivity to visual stimuli. They suggest that selective damage to inhibitory neurones in the primary visual cortex (specifically in layer IV of Area V1) follows repeated attacks with visual aura and that a loss of inhibitory neurones can account for the results of various psychophysical tests, including increased pattern sensitivity, increased visual masking of letters by striped backgrounds, and elevated contrast thresholds.
The conclusions of Chronicle and Mulleners differ from those drawn from the electrophysiological research in three ways. First, by limiting any cortical abnormality to the visual cortex. Second, by limiting any cortical abnormality to migraine with visual aura. Third, by attributing the cause to damage at a particular cortical location from repeated migraine attacks. Clearly these differences could be resolved by testing the same group of participants on a range of tasks (visual and non-visual) and examining whether impaired or extreme responses on one task are associated with extreme responses on a second and with duration of migraine. There is, however, a conspicuous lack of studies that correlate the performance of individuals on various tests. Such an approach would clarify whether the widespread electrophysiological abnormalities have correlates in equally widespread performance differences between people with and without migraine, or whether performance differences are localisable to anomalous functioning in discrete brain areas. This is the approach taken in the present study for three visual tasks.
The proposal of Chronicle and Mulleners does not account for reports of impaired performance on visual tasks in migraine without aura (3, 26). A less restrictive extension of their proposal is that damage arises from areas that undergo large changes in regional cerebral blood flow during the migraine attack, whether or not these changes are associated with aura symptoms and whether or not the change in blood flow reaches ischaemic levels. Although the results from the many scanning studies are somewhat heterogeneous, there are nonetheless reports using both PET (reviewed in 32, see also 33, 34) and fMRI (35–37) that blood flow changes involve the parieto-occipital cortex in migraine with and without aura. Possible damage in these areas following repeated migraine attacks is more consistent with the widespread electrophysiological differences reported as it predicts differences between migraine (with and without aura) and control subjects on both visual and other tasks. It also predicts that differences should be associated with the number of attacks experienced, but reports are conflicting (1, 10, 38, see also Results).
While low serotonergic transmission and damage from repeated attacks are not mutually exclusive explanations for the electrophysiological and psychophysical data, it would be useful to assess their relative contributions (if any) as they have different implications for the clinical use of visual tests in migraine. If altered neurotransmission underlies anomalous visual function in migraine, non-invasive visual tests may be developed to elucidate the extent of central penetration and the mode of action of migraine medications. Ultimately, it may be possible to develop a test that aids diagnosis, or that predicts the likely response of individual patients to alternate medications (see 2, 4, 39–41, and Discussion). If, on the other hand, the differences between migraine and control subjects reflect primarily damage from repeated attacks, the clinical usefulness of visual tests is limited.
In this paper, previous work on visual function in migraine is extended in the following ways. First, previous work on visual contrast thresholds (1–3) and stripe-induced visual discomfort (7, 15) is replicated and extended to an assessment of supra-threshold contrast sensitivity. Second, a number of the participants completed the three tasks, allowing a comparison between visual impairment on one task and performance on the others. Third, each participant completed a detailed questionnaire regarding their headache symptoms, history and known triggers, so that these issues could also be related to performance on the psychophysical tests.
Methods
Subjects
Fifty-eight migraine and 61 non-migraine control subjects (matched by age and sex) were recruited from advertisements and from a volunteer subject panel. See Table 1 for participant details. Every participant completed a questionnaire that asked about the characteristics of their headaches, headache triggers, headache duration, frequency of headache and the time of the last attack. All migraineurs fulfilled the International Headache Society criteria for migraine (42). None of the control subjects experienced headaches fulfilling the IHS criteria.
Participant details for the three experiments

VA, Migraine with visual aura; NVA, migraine with non-visual aura such as speech disturbances, pins and needles or numbness, co-ordination difficulties; MwoA, migraine without aura; N, number; M, male; F, female. The sample includes a relatively large number of migraine sufferers with exclusively non-visual aura symptoms. These were specifically sought when the migraine subject panel was created as it is proposed to assess whether performance on other than visual tasks is associated with the particular aura symptoms experienced. Frequency estimates should be treated as a guide only as they are based on retrospective self reports and may include counts of headaches other than migraine. For example, one initially reported 160 a year but this number included all headaches, including cluster and tension. At least one other counted as separate headaches the number of days headache was experienced, whether or not the days were consecutive and whether or not the headache could be classified as rebound following treatment with sumatriptan. Twenty-seven experienced migraine up to 10 times a year, 22 between 11 and 20 times a year, six between 20 and 30 times a year and four more than 31 times a year.
None in the migraine group had taken acute medication within 48 h of testing (nor within 1 week for those who took ergotamine), two (one with visual aura, VA, one with non-visual aura, NVA) were on prophylactic treatment (pizotifen) yet still experienced migraine at least once a month. All participants were asked to telephone if they developed a migraine in the day following testing, yet only two did so (both VA). The pattern of results reported below does not change whether these two are included or excluded.
All participants had a near acuity of at least 6/9 monocularly and 6/6 binocularly and a binocular far acuity of at least 6/6 either with or without optometric correction. Acuity was assessed before the experiments commenced and current prescriptions were obtained when necessary and recreated at the time of testing with a set of trial lenses. All participants were screened for normal colour vision with the Farnsworth-Munsell 100-hue test. Written informed consent was obtained from all participants.
Experimental displays and procedure
Pattern sensitivity test
Stimuli were presented on an Apple RGB 17 inch colour monitor (Sony Trinitron). The screen measurement and calibration procedure have been described in detail elsewhere (43). Subjects were seated 50 cm from the monitor, which was the only source of light in an otherwise dark room. The screen displayed five black and white striped patterns with a spatial frequency of three cycles per degree (cpd) on a grey background (see Fig. 1). To minimize the risk of inducing headache, the stripes were displayed in small circular patches each subtending 6° visual angle. The stripes had a square wave luminance profile and, within each circular patch, the average luminance of the dark and bright bars was 31 cd m−2. The background subtended 33° by 16° and also had a luminance of 31 cd m−2. Small random luminance variations were introduced into the background to minimize differential luminance contrast effects against each of the five circles due to screen non-uniformities (43, 44). Each screen pixel was randomly assigned a luminance between 28.6 and 33.8 cd m−2, giving an overall average screen luminance of 31 cd m−2 and the appearance of a faintly speckled grey background.
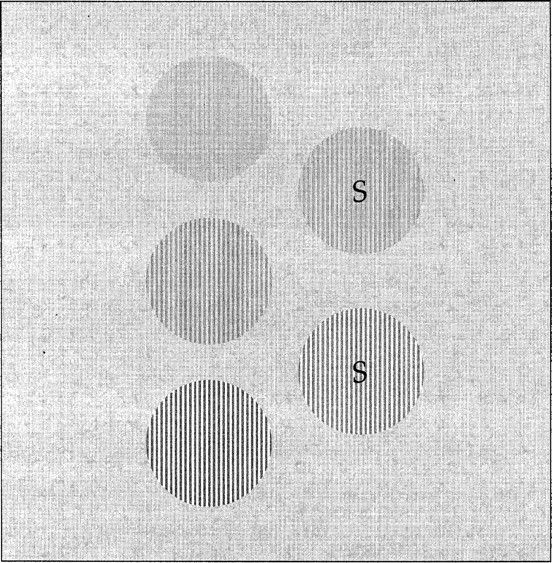
The display used in the assessment of pattern sensitivity (experiment 1) and in the contrast scaling experiment (experiment 3). Participants were seated 50 cm from a colour monitor that displayed five circles on a grey background. Each circular patch displayed a square-wave grating with a spatial frequency of 3 cpd. In the pattern sensitivity assessment, the five circles displayed mid to high contrast stripes and participants simply described their appearance. In the contrast scaling experiment, two of the circles were standards (marked with ‘S’ in the figure only) and their contrast could not be altered. The task was to set the remaining three circles such that the five circles formed a series in which the contrast of the stripes appeared to change uniformly from circle to circle. In separate trials participants set scales with four pairs of standards. The series of standard contrasts are given in Table 1. See text for further details.
The contrast displayed in each of the five circles progressed from the top of the screen to the bottom in even steps from 0.39 to 0.81 (Michelson contrast). To avoid any experimenter bias and to avoid introducing demand characteristics each subject was asked simply to describe the appearance of the stripes rather than to complete a checklist of illusions seen (cf. 7). No prompting was given as to the sorts of illusions that might be seen in these patterns. The descriptions were later coded into five categories to give a total pattern sensitivity score: illusions of (i) colour, (ii) motion, (iii) depth, (iv) shape, and (v) shimmer, flicker or glare. Within each category, the descriptions could be given a score of 1 or 2 depending on the intensity of illusion seen, or 0 if that category was not reported. Total pattern sensitivity scores therefore could range between 0 and 10 for each participant.
Contrast thresholds
Contrast thresholds were assessed using the Cambridge Low Contrast Gratings (45). These gratings measure contrast sensitivity at 4 cpd, close to the maximum of the normal human visual system. They comprise 10 plates that display a square wave grating and 10 blank plates and are presented to subjects in pairs, each presentation consisting of a grating and a blank plate. The blank plates have the same mean reflectance as their grating pair. The grating and blank plates were presented vertically, with the grating randomly situated in the upper or lower positions. Thus on each trial the participants must make a two-alternative forced choice when they indicate which of the two plates contains the grating. The plates were presented such that the gratings were orientated horizontally and were viewed at a distance of 6 m. On subsequent plates, the contrast of the grating decreases through a range of 13% to 0.11%. Each time an error was made, the sequence was restarted at the plate three preceding the error. The plate at which participants made an error was recorded on three runs through the sequence.
Contrast scaling
For the contrast scaling experiment the display described above for the pattern sensitivity experiment was again employed: throughout the experiment the screen displayed five black and white striped patterns with a spatial frequency of 3 cpd, an average luminance of 31 cd m−2, on a grey background also at 31 cd m−2 (see Fig. 1).
Two of the circles were standards (marked ‘S’ in Fig. 1) that could not be changed during each trial. The upper of the two standards displayed lower contrast stripes than the second standard. The contrast of the stripes displayed in the three circles on the left of the standards could be varied. Participants were instructed to set an equal appearing scale by first setting the middle circle to display a contrast that appeared to be half way between the contrasts displayed in the standard circles, and then to set the upper and lower circles such that, as they looked sequentially at the five circles, the change in contrast of the stripes appeared uniform. In separate trials participants set scales with four pairs of standards, making 12 settings in total. There were five standard contrasts, and the four pairs were selected to progress smoothly from low contrasts (Michelson contrast 0.141) to high (Michelson contrast 0.712). The contrasts of the four pairs of standards are plotted in Fig. 4 and are listed in Table 2.

Results of the supra-threshold contrast scaling experiment for the control subjects. Scale-number is plotted on the abscissa and the sets of three points plotted at each scale-number correspond to the settings made for the three circle-positions (upper, middle and lower) by the control subjects (see Fig. 1). The contrasts set for the upper circle are lower than the contrasts of each pair of standards (plotted as triangles), the contrasts set for the middle circle lie between the contrasts of the two standards and those set for the lower circle are greater than the contrasts of each pair of standards. See Fig. 5 for the data from the migraine group(s).
The contrasts of the pairs of standards used at each scale-number in the supra-threshold contrast scaling experiment (experiment 3)

The subjects made their settings with the use of a six-button control box. One pair of buttons changed the contrast of the stripes displayed in the currently selected circle by stepping through a set of 78 calibrated contrasts. Separate sets of calibrated contrasts were determined for the screen location of each of the five circles to avoid luminance differences from screen non-uniformities (43). The contrasts that could be displayed ranged between very low contrast, or light grey stripes (Michelson contrast 0.001) and high contrast, or black and white stripes (Michelson contrast 0.960). There were 78 settings available for each circle-position to give participants a sufficiently wide range and small enough step sizes to set an adequate equal appearance contrast scale. The average change in Michelson contrast between consecutive entries in each calibrated set was only 0.012. Other buttons on the control box allowed the subjects to move between the three circles and to record their scales when they were satisfied the change in contrast appeared uniform.
Results
Experiment 1: pattern sensitivity
All 119 participants completed the test for pattern sensitivity. When people view large black and white striped patterns many report seeing visual illusions, such as tinges of colour, the appearance of shadowy shapes, and the perception of depth, movement or flicker (7). With the small striped patches used here, many reported seeing no illusions, or seeing slight illusions of colour, depth or shape. Table 3d shows that in both the migraine and control groups illusions of shape (category 4) were the most common, including the faint appearance of geometric shapes in the background, distortion of the straight edges of the stripes and the pattern turning into a checkerboard (reported only in the migraine group, see below). The next most common illusion categories seen were motion and shimmer in the migraine group, and illusory colours in the control group.
Results for the pattern sensitivity test (experiment 1)

On average, the pattern sensitive score for the migraine group was significantly higher than that for the control group, but there were no significant differences between the migraine subgroups (column B). Column C: count of total pattern sensitivity scores between the minimum (0) and maximum (6) scores obtained. Migraine sufferers had higher total pattern sensitivity scores than the control subjects. Column D: total pattern sensitivity scores for each category of illusion. 1=colour, 2=motion, 3=depth, 4=shape, 5=shimmer, flicker or glare. Both migraine and control subjects saw illusions of shape most frequently, followed by depth and shimmer in the migraine group, and colour in the control group. See text for further details.
Although the illusion categories were not reported with equal frequency there were no significant differences between the migraine and control groups in the particular categories reported: a mixed
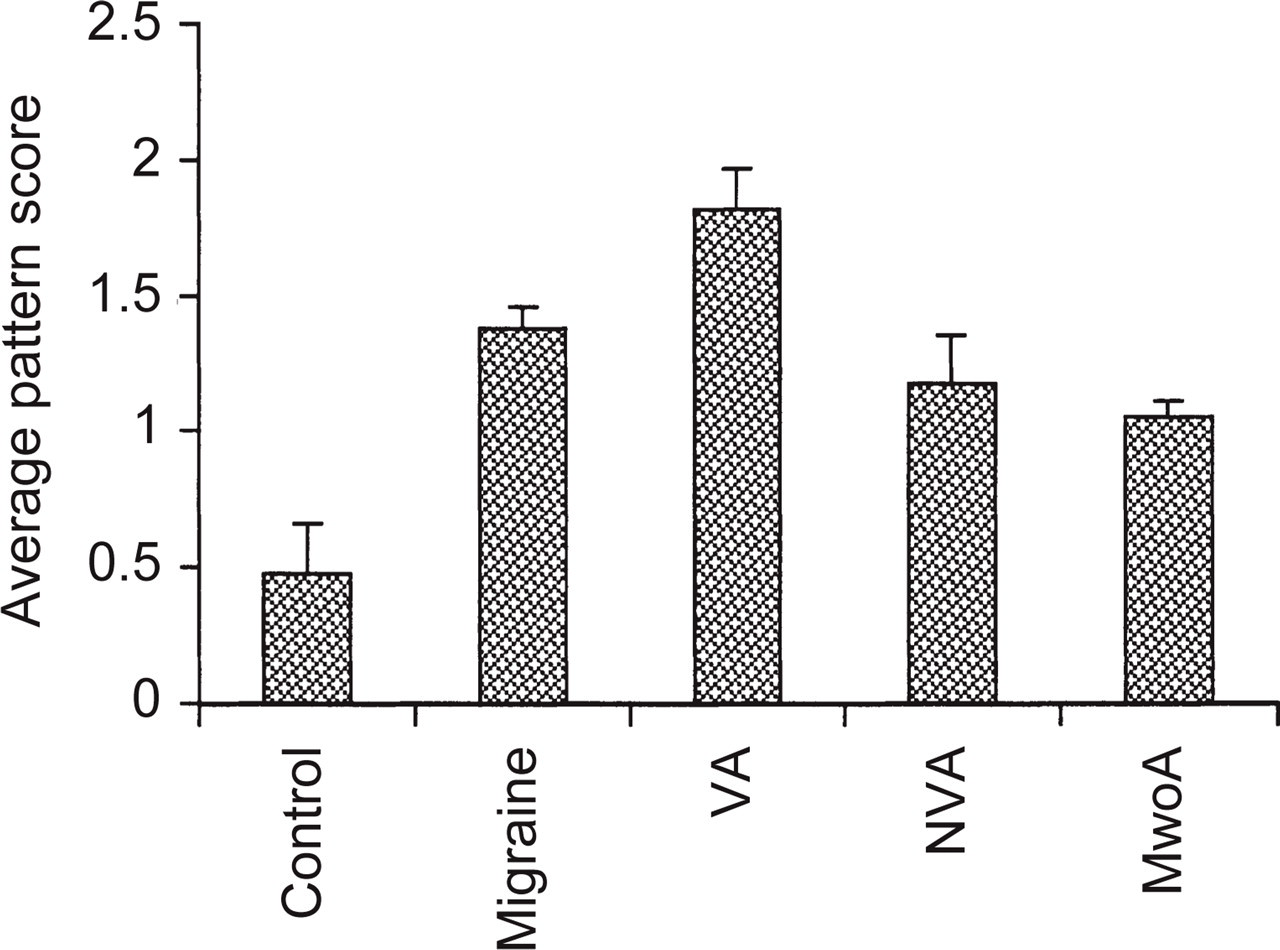
Results of the pattern sensitivity test for the control and all migraine groups (left side of figure) and for the migraine subgroups separately (right side of figure). VA = migraine with visual aura, NVA = migraine with exclusively non-visual aura, MwoA = migraine without aura. Error bars denote 1 standard error. Overall, migraine sufferers saw a greater number and more intense illusions than the control subjects. There were no significant differences between the migraine subgroups. See also Table 2 for a breakdown of the type of illusions seen and of total pattern sensitivity scores.
Looking in more detail at the migraine group, those with visual aura scored the highest on pattern sensitivity, and those without aura scored the lowest (Table 2b). A one-way
Other relevant factors include age, migraine duration, frequency of migraine attacks, time since last attack and whether headache can be induced by visual patterns. There was a significant correlation between total pattern score and those who reported that visual patterns could trigger their migraine attacks (rpb(58) = 0.36, p < 0.005). The positive correlation indicates that those who reported their headaches could be triggered by visual patterns also reported seeing illusions in the striped pattern. Commonly cited visual triggers were reflected sunshine, dappled sunshine, striped patterns or flicker.
There was no significant correlation between total pattern sensitivity score and age in either the control (r(61) =−0.15, NS) or migraine (r(58) =−0.05, NS) groups, nor was the small positive correlation between duration of migraine and total pattern sensitivity score significant (r(58) = 0.21, NS). Khalil and Legg (1) reported effects of duration in a test of contrast sensitivity when people who had migraine for less than 10 years were compared to those who had experienced migraine for more than 30 years. In the present data, the pattern sensitive scores of those who had experienced migraine for less than 10 years (average 0.60 ± 1.27, N = 10) were significantly lower than those who had experienced migraine for more than 30 years (average 1.78 ± 1.59, N = 18, t(26) =−2.01, p = 0.028).
Since there was a significant correlation between total pattern score and those who reported that visual patterns could trigger their migraine attacks and a significant difference in pattern scores when short and long duration migraine were compared, one might expect a correlation between those who reported their headaches could be triggered by visual stimuli and migraine duration. This correlation did not reach significance overall (rpb(58) = 0.24, p = 0.065), but was significant using only those participants who fell within the categories of Khalil and Legg (rpb(28) = 0.46, p = 0.015). Thus, there is evidence that long duration migraine (more than 30 years) is associated with the perception of illusions in the striped pattern and with self-reports of visual triggers.
Finally, there were no significant correlations between total pattern sensitivity score and the frequency of migraine (r(58) =−0.09, NS) nor the time since the last attack (r(58) =−0.04, NS). The two participants who developed migraine within 24 h of testing had both seen no illusions in the striped patterns.
Experiment 2: contrast thresholds
Thirty-five migraine and 35 control subjects participated in the contrast threshold experiment (Table 1). The Cambridge Low Contrast Gratings are numbered from 1 to 10 and higher plate numbers correspond to lower contrasts. To assess how representative the measurements are, consider first the control data. There was a negative correlation between age and threshold plate-number, indicating that the threshold for older subjects was higher contrast than that for the younger subjects, but this association was not significant (r(35) =−0.22, NS). The magnitude of the correlation was, however, comparable to that reported in the normative data for the Cambridge Low Contrast gratings (45) (r =−0.35), given that in this sample there were fewer participants and a smaller age range. In this sample sensitivity declined just over 6% with each decade of life, compared to 10% previously reported (45). Thus, the control subjects performed close to the published norms for the low contrast gratings.
Group averages for both the migraine and control groups are presented in Table 4 and Fig. 3(a). Clearly, the control subjects could detect lower contrasts (i.e. higher plate numbers) than the migraine sufferers, a difference that was statistically significant (t(68) = 2.14, p = 0.018).
Results for the threshold experiment (experiment 2)

Thresholds were assessed using the Cambridge Low Contrast Gratings, which consist of low contrast striped patterns at 4 cpd. The plate number (Column B) at which an error was made was recorded three times for each observer as an estimate of threshold. Higher plate numbers correspond to lower contrasts (Column C). See Figure 3 for further description of trends shown. PS, Pattern sensitive; NPS, non-pattern sensitive.
Considering the data from the migraine group in more detail, there appear to be no differences associated with the presence or absence of aura (see Table 4 and Fig. 3b), whether classified as VA, NVA and MwoA (F(2, 32) = 0.41, NS) or whether those with visual aura were compared to those without (t(33) = 0.23, NS). To summarize, there was an overall effect of group, in that the contrast threshold was higher for the migraine than the control subjects, but there appeared to be no differences between the migraine subgroups. This pattern of results is identical to that found in the assessment of pattern sensitivity.

Results of the threshold experiment. Thresholds were assessed using the Cambridge Low Contrast Gratings, which consist of low contrast striped patterns at 4 cpd. The plate number at which an error was made was recorded three times for each observer as an estimate of threshold. Higher plate numbers correspond to lower contrasts. See Table 3 for estimates of the contrast corresponding to these plate numbers. (a) Overall, migraine sufferers (M) made errors at lower plate numbers than the control subjects (C), indicating that they made errors at higher contrasts, or had poorer performance, than the control subjects. (b) A breakdown of the migraine group's data according to migraine type: VA, NVA, MwoA (left hand side of figure) and according to their total pattern sensitivity score (right hand side of figure). PS = pattern sensitive, NPS = non-pattern sensitive. There were no differences between the migraine subgroups when classified according to the presence or absence of aura, but there was a significant difference between the thresholds for migraineurs with a pattern sensitivity score of at least 2 (PS group) and those with a score below 2 (NPS group): those with the higher pattern sensitivity score made errors at lower plate numbers (i.e. at higher contrasts, poorer performance) than those with the lower pattern sensitivity score. Error bars denote one standard error.
Other factors to consider are migraine duration, frequency of migraine attacks, time since last attack and whether headache can be induced by visual patterns. The correlation between those reporting visual triggers and pattern sensitivity was again significant in this smaller sample (rpb(35) = 0.3548, p = 0.018); however, the correlation between those reporting visual triggers and their threshold did not reach significance (rpb(35) =−0.2445, p = 0.078). Finally, there were no significant correlations between the threshold and the frequency of migraine (r(35) = 0.23, NS), the time since the last attack (r(35) =−0.003, NS), nor the duration of migraine (r(35) =−0.02, NS). Considering the classification of Khalil and Legg (1) there were also no significant differences between those who had experienced migraine for less than 10 years (average plate number 7.90 ± 1.81, N = 7) or for more than 30 years (average 7.26 ± 1.20, N = 9, t(14) = 0.86, NS).
All of the participants in experiment 2 had also completed the pattern test (experiment 1). There was a significant correlation between the pattern sensitivity score of individual migraine subjects and their threshold score (r(35) =−0.34, p = 0.023). The negative correlation indicates that those who saw the most illusions had the lowest score (i.e. highest contrast thresholds, or poorest performance) on the Cambridge gratings (see also Table 4 and Fig. 3b). That is, those who saw the greatest number of illusions failed to detect contrasts that could be detected by those who saw fewer or no illusions and by the control subjects. The association was sufficiently strong that dividing the migraine group into two based on the median pattern sensitivity score (dividing the data at a pattern sensitive score of 2, see Fig. 3b) produced a group difference in average scores (t(33) = 2.69, p = 0.006). Migraineurs are usually divided into groups depending on their symptoms (migraine with and without aura). Classification according to pattern sensitivity combines people from each of these categories. There were no significant differences between the pattern and non-pattern sensitive groups in terms of age, duration of migraine, frequency of migraine attacks or time since the last attack (see Table 5).
Participant details when the migraine group is split into two based on their pattern sensitivity scores

Those with a score of ≥2 (pattern-sensitive, PS) and those with a score of <2 (non-pattern sensitive, NPS). There were no significant differences (NS) between the two groups in age, migraine duration, frequency or recency. d, Days; m, months. The columns on the left refer to participants in Experiment 2, those on the right to participants in Experiment 3.
Experiment 3: contrast scaling
Fifty-three migraine sufferers were initially tested on the contrast scaling experiment; however, only 44 managed to complete it. As an overriding concern was not to induce a migraine in any of the participants, the test was discontinued if any found the display strongly aversive. Five VA, two NVA and one MwoA discontinued because the display was aversive, one NVA for other reasons (see Discussion).
An analysis of the control group's average data (Fig. 4) revealed effects related to age and to overall contrast over the 12 settings that were not of primary interest to a study of visual function in migraine. As there were now 12 settings for each participant instead of a single value, effects of age were assessed by dividing the data into two groups at the median age (42 years) and incorporating age as a between-subjects factor in an
There was no overall effect of median age (F(1, 42) = 1.78, NS) but there was a median age by scale–number interaction (F(2.34, 98.36) = 3.81, p = 0.020): older subjects tended to set higher contrasts than younger subjects at the higher scale positions. There was no median age by circle-position interaction (F(1.22, 51.35) = 2.32, NS) nor an interaction between circle-position, scale-number and median age (F(3.87, 162.63) = 1.17, NS).
Since these significant effects in the control group's data were not of primary concern in this study, they were removed by transforming all scores to z-scores. Two control groups were formed divided at the median age of 42 years. The scale set by each migraineur was then expressed as a z-score relative to the appropriate control group. This transformation removes the effects of age and the effects of scale-number and circle-position that are due to overall contrast magnitude, but it leaves intact relative differences between the migraine and control groups.
A mixed

Results of the supra-threshold contrast scaling experiment. The migraineurs' settings are expressed as z-scores relative to control subjects' settings. Scale-number is plotted on the abscissa and the sets of three points plotted at each scale-number correspond to the settings made for the three circle-positions (upper, middle and lower) by the migraineurs (see Fig. 1). The settings for the upper and lower circles at each scale-number have been displaced + 1.5 and −1.5 along the ordinate, respectively, for clarity. Since these are z-scores, horizontal lines for each circle-position represent the average of the control groups' settings. Overall, the migraine group set lower contrasts than the control group.
Other relevant factors include migraine duration, frequency of attacks, time since the last attack, pattern sensitivity and whether migraine can be induced by visual patterns. Incorporating all of these factors in a single
Pattern sensitivity was incorporated as a two-level between-subject factor by dividing the migraine group into two groups based on the median score, those with a total pattern sensitivity score of 2 or higher, and those with a score of less than 2. Duration was also incorporated as a two-level between-subject factor by dividing the group at the median duration of 17 years. A mixed
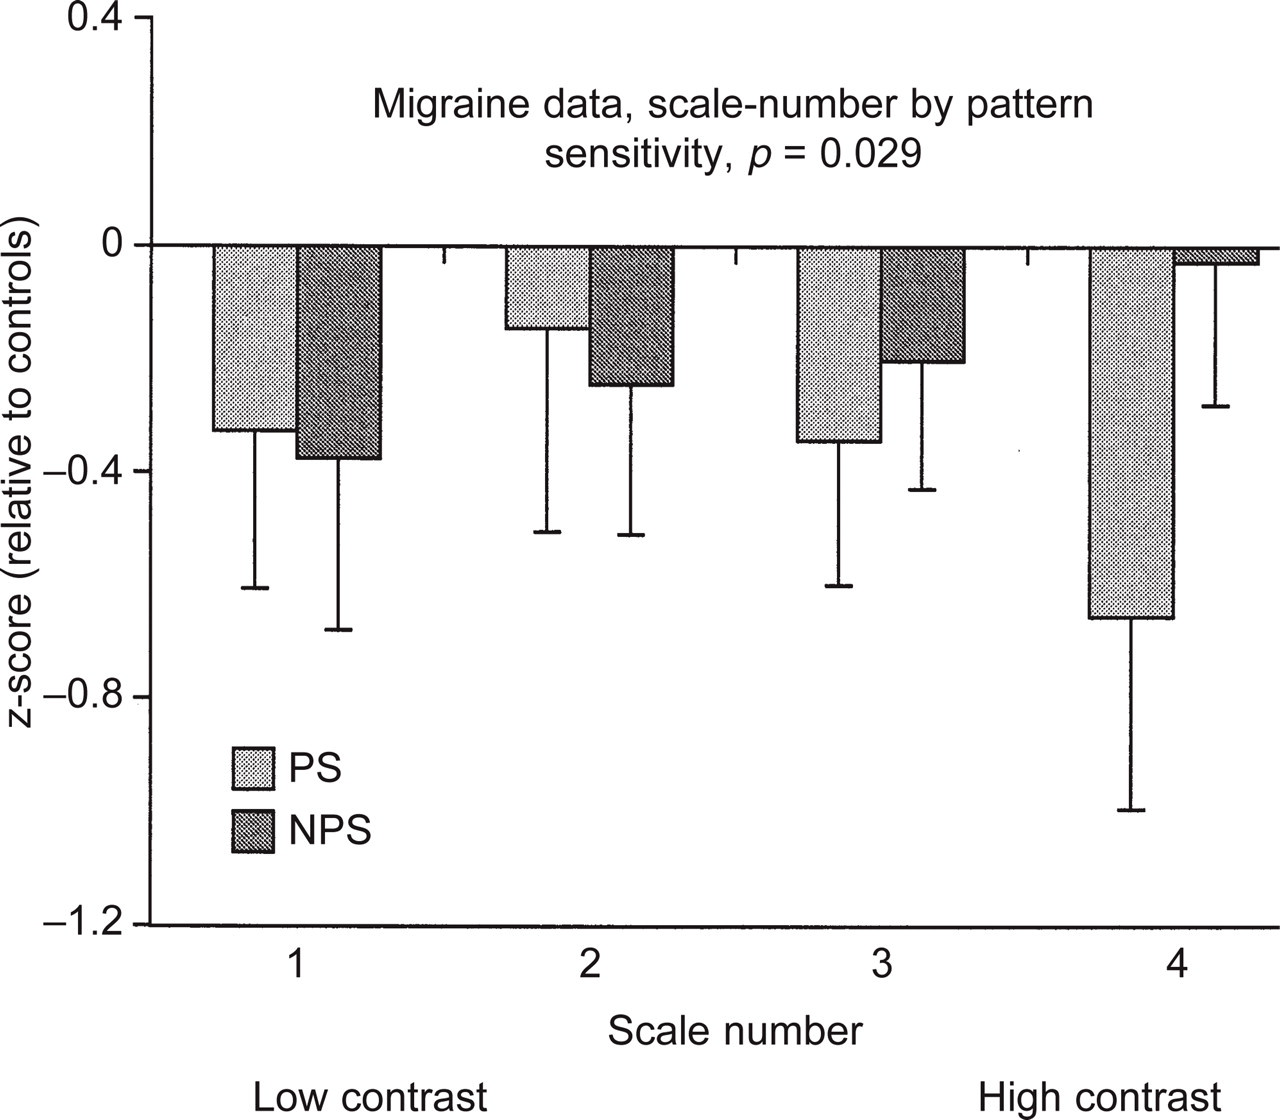
Results of the supra-threshold scaling experiment when the migraine group is divided into two based on their total pattern sensitivity score. Overall, the migraineurs set lower contrasts than the control subjects as the data for both groups lie below the horizontal line (as in Fig. 5, since these are z-scores, the control subjects' average data are represented by the horizontal line at 0). These data depict the scale-number by pattern sensitivity interaction, therefore the data plotted at each scale-number are the average of the three circle-position settings (upper, middle and lower) for that scale-number. As scale-number increases the settings of the two migraine groups increasingly diverge: those with a pattern sensitivity score of at least 2 (PS group) set lower contrasts than those with a score below 2 (NPS group).
Re-running the analysis with only those who had experienced migraine for less than 10 years or for more than 30 years did not alter the pattern of results: there was still a significant interaction between pattern sensitivity and scale-number (F(3, 57) = 4.10, p = 0.010) but no effects or interactions involving duration (all F's < 2.2).
Simple effects of the significant interaction between pattern sensitivity and scale-number (see Fig. 7) were tested in the migraine group using four separate independent t-tests, one analysis for each scale-number. There was a significant effect between the pattern sensitive and non-pattern sensitive groups for scale-number 4 (t(42) = 2.74, p = 0.0089, all other t's < 1).
As described above, classifying the migraineurs according to pattern sensitivity cuts across the traditional classification in terms of the presence or absence of aura. There were no significant differences between the pattern and non-pattern sensitive groups in terms of age, migraine duration, frequency or time since the last attack (see Table 5).
Twenty-six of the migraine and 22 of the control subjects completed both the threshold and the scaling experiments. As the significant effects in the scaling experiment involved an overall effect of group and an interaction in the migraine group between scale-number 4 and pattern sensitivity, threshold scores were correlated with both of these averages. An overall score for the scaling experiment was calculated by averaging all 12 settings for each participant. The scale-number 4 settings were calculated for each participant by averaging the three settings made at each circle-position (upper, middle and lower) for scale-number 4. In the migraine group, there was a significant positive correlation between threshold and the average for scale-number 4 (r(26) = 0.37, p = 0.03). The positive correlation indicates that those with low scores on the Cambridge Low Contrast Gratings (i.e. worst contrast detection) also set low contrasts in the scaling experiment (scale number 4), whereas those with higher threshold scores set higher contrasts in the scaling experiment. There was no significant correlation between threshold and the overall average (r(26) = 0.11, NS).
To summarize the results from the migraine participants who completed all three experiments, those who saw several or intense illusions in black and white striped patterns set the lowest contrasts at scale-number 4 and also had low scores (i.e. poor contrast detection) on the Cambridge Low Contrast Gratings. Similarly, those who saw few or no illusions in the striped patterns set higher contrasts at scale-number 4 and also had higher scores (i.e. better contrast detection) on the Cambridge Low Contrast Gratings.
Discussion
The results from the three experiments are in remarkable agreement. The test of pattern sensitivity revealed that people with migraine are more likely to see illusions and distortions when viewing high contrast 3 cpd black and white striped patterns than non-migraine control subjects. This result is similar to those reported previously (2, 7, 14, 15), although here much smaller striped patterns were employed. Similar to Khalil (2) and Coleston and Kennard (14), the migraine sufferers with visual aura saw a slightly greater number and more intense illusions than those without, although this trend was not statistically significant in this sample.
In a separate study, thresholds were determined at a spatial frequency of 4 cpd. Again, there was a significant overall group difference, with migraineurs on average failing to detect patterns that could be detected by the control subjects. This result is similar to those reported previously (1–3). An interesting new finding is the significant association between threshold and pattern sensitivity: those who saw illusions and distortions in the high contrast striped patterns had poorer detection thresholds than those who did not.
In the final study, participants were asked to set supra-threshold contrast scales such that the stripes displayed in a series of five circular patches progressed evenly from low to high contrast. Again, there was a significant group difference between the migraine and control subjects, with the migraine group setting on average lower contrasts than the control group. As in the other two tasks there were no significant group differences between migraine with and without aura, but again there was a significant association between the supra-threshold settings and pattern sensitivity: those who saw illusions and distortions in the patterns set lower contrasts at scale-number 4 than those who did not. Furthermore, there was an association between detection thresholds and the supra-threshold high contrast scale settings: those who had the poorest detection thresholds also set the lowest contrasts at scale-number 4.
The measure of pattern sensitivity used in this study was based on the number and severity of the illusions and distortions that were reported when the participants viewed a set of high contrast striped patterns. One proposed basis for the illusions is a failure in inhibitory connections in the visual cortex and heightened pattern sensitivity in some migraineurs has been attributed to an underlying cortical abnormality (see Introduction). In the present study, the increase in the number and type of illusions seen in a small black and white striped display in the migraine group, compared to the control group, is consistent with an increased cortical response to these patterns and/or a lack of inhibition in these migraineurs.
Abnormal cortical function has also been used to explain elevated contrast thresholds (1, 2). Impaired threshold performance may occur if heightened responsiveness and a lack of cortical inhibition results in increased noise in the visual system against which the weak threshold signal must be detected, or if a lack of inhibition broadens the bandwidth of cells tuned to particular spatial frequencies (2). Although performance on the threshold task used in experiment 2 does not necessarily reflect cortical function (see 43), elevated contrast thresholds are nonetheless compatible with a cortical locus.
Abnormal cortical function may also account for the lower contrasts set in the supra-threshold scaling experiment, particularly at scale-number 4. As contrast increases, the response of cells tuned to that spatial frequency normally also increases initially, before declining as the cells adapt with prolonged viewing. If the lack of habituation that has been reported in migraine (see Introduction) reflects a general disruption in adaptive processes, then an initially exaggerated response may not decline with prolonged viewing. As the contrast of the stripes increases, migraine sufferers may therefore reach a ceiling and have difficulty discriminating the gratings as contrast is further increased. At the start of each trial, the three circles that could be modified displayed a very low contrast pattern, and participants had to increase their contrast as they set each scale. Migraineurs may have set lower contrasts if they simply stopped increasing contrast once discrimination became difficult as the ceiling level was approached. There is anecdotal support for this explanation from one participant (NVA) who failed to complete the scaling experiment because she could see no difference between the two standards at scale-number 4 (contrasts of 0.524 an 0.712, see Table 1).
An alternative explanation is that the lower contrasts set at the higher scale positions reflect an aversion to making the screen display high contrasts. This is considered unlikely for the following reasons. First, all participants were informed that they could discontinue with the study at any stage if the patterns were aversive. Second, a few who saw illusions in the high contrast patterns did not report that they found the patterns unpleasant, even when reporting vivid illusions such as bubbling, checkerboards or rotation. Third, the association between the unaversive low contrast threshold scores and potentially aversive supra-threshold settings suggests that both tasks were addressing visual rather than motivational processes. These alternative explanations could be tested, however, by measuring mid/high contrast discrimination thresholds, rather than low contrast detection thresholds, for gratings with contrasts between 0.5 and 0.8.
The proposal that damage occurs in the primary visual cortex during the visual aura (23) and that this can account for elevated contrast thresholds and pattern sensitivity was not supported as extreme responses on these measures were not associated exclusively with migraine with visual aura. The more general suggestion that damage may occur in any migraineur following repeated migraine attacks received some support from these studies. Overall, there were no significant associations between pattern sensitivity, contrast thresholds or supra-threshold contrast scales and migraine duration. When people who had migraine for less than 10 years were compared to those who had migraine for more than 30 years, however, there were significant associations between duration and (i) pattern sensitivity and (ii) those who reported that migraine could be induced by visual patterns. These associations may reflect change or damage in the visual system resulting from long duration migraine. Any such damage does not appear to have a significant impact on performance on other visual tasks, since there were no significant associations between long and short duration and the threshold task or the supra-threshold contrast scales.
Using the same categories for long and short duration migraine, Khalil and Legg (1) reported an association between elevated contrast thresholds and migraine duration, but only in migraine with visual aura. In the present study there were insufficient data to make formal comparisons between those with and without visual aura and migraine duration as the long and short duration groups comprised only nine (3 VA, 5 NVA, 1 MwoA) and seven (1 VA, 2 NVA, 4 MwoA) migraineurs, respectively. From the data there were, however, there was little difference between the scores of those with long duration migraine whether they experience visual aura (7.11) or not (7.33), although both were slightly lower (i.e. poorer performance) than the scores of those with short duration migraine (7.90). It is possible, then, that differences related to duration and migraine classification could be revealed with a larger sample size. Any such differences would appear to be small, however, if they emerge only with categories of more than 30 and less than 10 years and if they depend on large sample sizes. Overall, the effects of duration are minor in the context of the three experiments and the main result that, regardless of duration, those migraineurs who see illusions in striped patterns also have impaired contrast detection and set lower contrast supra-threshold scales. Each of these results is compatible with abnormal cortical function, and the weak association with migraine duration suggests that the main effects are attributable to abnormal cortical function resulting from other factors, possibly low serotonergic transmission.
The lack of evidence for a large effect of migraine duration on these tasks indicates it is worthwhile to continue to develop tests of visual function that may be useful in the clinic. For example, the efficacy of beta-blockers correlates with an electrophysiological measure, contingent negative variation amplitude, before therapy (4, 39) and anomalous recordings normalize with treatment with beta-blockers (5). Because of the equipment, time and training required to make electrophysiological recordings, these results are unlikely to have routine clinical applications. If equivalent visual tests could be developed (see 2, 40, 41), they would provide a useful adjunct when considering the relative merits of prophylactic treatments. Khalil (2) assessed pattern sensitivity in a small number of migraine sufferers before and after prophylactic treatment, and reported a reduction in the number of illusions seen in those who responded to the treatment. It would be valuable to replicate this result using a larger number of migraine sufferers and using several measures of pattern sensitivity (or other display) to determine whether performance before treatment correlates with treatment efficacy, as visual tests can be easily incorporated in clinical settings.
These studies were motivated by the question of any link between impairment on visual tasks and visually induced headache. On the one hand, migraineurs who have identified that their headaches may be induced by visual patterns evidently differ in some way from those who do not, and this may indicate that their visual system differs in some way. However, visual triggers were only associated with pattern sensitivity, there were no significant associations with the threshold scores (P = 0.08) or any of the supra-threshold scale settings. This pattern of results may indicate that retrospective self-report of headache triggers may be an insensitive measure. It is clear that some migraine sufferers do not pay attention to many aspects of their migraine until asked to, such as laterality of aura symptoms or their progression, as they are more concerned with taking medication or finding somewhere to rest than taking time to examine what they are experiencing. They may pay similarly little attention to triggers, which may lead to an underestimate of susceptibility to visual patterns. Recently visual patterns have been used to induce migraine (36, 38). It would be useful if future studies asked participants, before inducing, about headache triggers so that self-reports and actual susceptibility could be correlated. To clarify the relationship between visual system dysfunction and visually induced headache, one proposal for future studies is that it is essential to assess in a more controlled manner which migraineurs may have headache induced by visual patterns.
What is clear from these studies is that comparing the performance of individual subjects over diverse tasks, and even grouping them on the basis of a performance measure (pattern sensitivity), produced more intelligible results than comparing group averages classified according to the presence or absence of aura. The agreement between the three experiments indicates that it would be useful to extend this approach and compare the performance of individual subjects over visual, non-visual and attentionally demanding tasks using both psychophysical and electrophysiological measures. Such an approach may provide a more complete understanding of the spectrum of differences between migraine and control groups and may even explain the sometimes conflicting reports in the literature when migraineurs are classified instead according to the presence or absence of aura.
Footnotes
Acknowledgements
I would like to acknowledge the assistance of Professor A. Wilkins and Dr G. Davis, who provided invaluable comments during the conduct of these experiments. The first and third experiments used low level routines written in C, some of which were based on Denis Pelli's ‘Video Toolbox’ collection. The data were collected at the former Medical Research Council Applied Psychology Unit, Cambridge. Elisabeth Pimm provided optometric correction where needed. Part of this work was supported by a Birkbeck College Research Grant.
1
The degrees of freedom are not integers because they have been adjusted for unequal variance using the Greenhouse–Geisser epsilon.
2
It is worth noting that nine of the original 53 migraine sufferers did not complete the 12 settings, but six of these did complete nine settings (3 VA, 2 NVA, 1 MwoA). Re-running the analysis on the first nine settings only but with these six and their matched controls included (n = 50 in each group) did not alter the pattern of results. There was an overall effect of group (F(1, 47) = 9.14, p = 0.004), but no other significant effects (all F's <1.8).