
Abstract
Depressive illness is a major public health problem and is the most common mental disorder in Australia. Andrews et al. [1] reported 12-month prevalences for major depression of 6.7% based on ICD-10 [2] and 6.3% using DSMIV criteria [3]; the respective 1-month prevalences were 3.3% and 3.2%. Using ICD-10, 1.3% suffered dysthymia over 12 months and 1.1% over the last month. Those with affective disorders had the highest number of disability days (average 11.7 days of total or partial inability to carry out activities) and lowest SF-12 mental summary score (mean = 33.4). Comparative epidemiological US data (based on DSM III-R [4]) report a 10.3% 12-month and 5% 30-day prevalence for a major depressive episode and a 17% lifetime prevalence rate [5, 6]. Evidence shows an increasing prevalence over the last 50 years [7–9]. The burden of depression (BoD), measured in Disability-Adjusted Life Years (DALYs), ranked fourth globally in 1990 and is projected to rank second after ischaemic heart disease by 2020 [10]; it was described as the ‘unseen burden’. In Australia, the burden of depression disease was estimated at 93 016 DALYs. An additional 29 316 DALYs were attributed to its indirect costs [11], including disability, self-harm, ischaemic heart disease and depression-related suicide [12]. The risk of suicide is increased with depression and 60% of suicides are depression-related [13].
When viewed from an economic perspective, the costs associated with depression include the value of resources consumed, costs to ill individuals, health care providers and other society segments. This economic burden remained hidden in the past owing to both a focus on the direct financial burden of illness on health service use and because depression causes little direct mortality. When indirect costs, but not mortality, are included the cost is estimated to represent over 20% of all mental illness costs [14]. The annual cost in the US in 1990 was estimated at US$43.7 billion for combined direct costs (inpatient and outpatient care and pharmaceuticals) and indirect costs (lost productivity, missed workdays and lost earnings) [15]. This estimate included major depression, bipolar disorder and dysthymia. Comparatively, it was of equal or greater magnitude to major diseases such as cancer and coronary heart disease [16]. A more recent review concluded that in 1998 the depression burden was US$65 billion and that it ranked third on prevalence and sixth on economic burden when compared with other major diseases [17]. There is evidence this burden is increasing. In SA, for example, the direct mental health care costs rose from AUD$68.8 million to AUD$80.8 million between 1993 and 1998 – a 17% per capita increase [18], pp.80,81]. In short, depression is associated with tremendous personal, social and financial costs [19].
Cost-of-illness studies provide a burden estimate in terms of resources used and complement prevalence data thereby assisting policy makers to set priorities, develop health care services or identify areas for research. Comparative studies can inform allocations between mental and other illnesses or within the mental health sphere. Cost of illness estimates also provide a basis from which to evaluate alternative health care intervention options.
This study estimated the size of the excess economic burden of depression in SA from a societal perspective using two methods. One combined the direct costs of treatment and indirect costs associated with loss of earnings. The other used a utility measure, reflecting societal preferences, to quantify the impact of illness on healthrelated quality of life (HRQoL).
Method
A perspective
Although there are many viewpoints from which evaluations can be undertaken, in economic evaluation the societal perspective is preferred because it represents the public interest [20–22], particularly where there may be high patient, family or other sector costs. This is the case with depression, which is both chronic and has multiple effects. Our data did not permit identification of the full range of societal costs; rather we had some information on particular activities (e.g. work status). We have presented these personal costs, but acknowledge their limitations.
Subject to this caveat, two estimates are presented. We present the estimated direct costs based on SA Health Omnibus Survey (HOS) data, and service use and costs from other sources. We also present a global estimate from the Assessment of Quality of Life (AQoL) utility measure [23, 24]. This estimate provides the broadest perspective since it is assumed it reflects all losses associated with ill health.
The Health Omnibus Survey
Data from the 1998 SA HOS were analysed. This is a user-pays survey for health organizations, covering people aged 15+ years. The metropolitan sample was based on the collectors' districts (each about 200 dwellings) used by the Australian Bureau of Statistics (ABS) in the 1996 Census. Ten district dwellings were chosen by selecting every fourth household from a random starting point. One interview was conducted per household; the respondent was the person with the last birthday. Rural respondents were selected from towns with a population of 1000 or more, using the same procedure. This sample frame comprised about 80% of the SA rural population.
Regarding sample size, 4400 cases were drawn of whom 4289 were eligible. Of these, 408 were non-contactable, 658 refused, and 213 were absent, too ill or did not speak English. Three thousand and ten interviews were conducted; a 70% response rate. Full survey method details can be found in Wilson et al. [25]. Interviews were by experienced interviewers. The data were weighted by ABS 1996 Census benchmarks to ensure representation of the SA population.
Definitions and instruments
Depression
Depression was delineated by utilizing the mood module of the Primary Care Evaluation of Mental Disorders (PRIME-MD), which has demonstrated reliability and validity in primary health care settings [26, 27]. The mood module comprises 16 questions measuring depression symptoms experienced nearly every day for the last two weeks. These questions were embedded within the HOS and administered to all subjects. ‘Caseness’ was determined by the PRIME-MD method for DSM-IV diagnoses [3]. Classifications were major depression, other depressions and no depression. The DSM-IV definition of major depression is a disorder characterized by depressed mood or loss of interest or pleasure nearly every day for the last two weeks with at least five characteristic symptoms (change in appetite or weight, sleep, and psychomotor activity; decreased energy; feelings of worthlessness or guilt; difficulty thinking, concentrating, or making decisions; or recurrent thoughts of death or suicidal ideation, plans or attempts). Other depression includes dysthymia, minor depression and partial remission of major depression, determined by having depression symptoms insufficient for major depression. This is consistent with the trend effect in morbidity and quality of life, those with no depression having least morbidity, those with major depression the highest and those with other depressions being intermediate [28].
Health status
The SF-36 [29] was used. It has been extensively validated and is the world's ubiquitous health status measure. It comprises eight dimensions: Physical Functioning, Role Physical, Bodily Pain, General Health, Vitality, Social Function, Role Emotion and Mental Health. These are combined to form the Physical Function (PCS) and Mental Health (MCS) indices. Each dimension is scored on a 0–100 point scale. The PCS and MCS use standardized T-scores (where the population mean is 50 points and the standard deviation 10 points [30]. Australian norms are used [31].
Health-related quality of life
We used the AQoL utility instrument, which is the only utility instrument with Australian values [24, 32]. It comprises five dimensions: Illness, Independent Living, Social Relationships, Physical Senses and Psychological Wellbeing. The AQoL algorithm uses the latter four dimensions for computing the utility score ranging from −0.04 (worst possible HRQoL) to 0.00 (death equivalent HRQoL) to 1.00 (full HRQoL). Since AQoL weights involved evaluations of 10-year health states, this suggests it is suitable for chronic illnesses such as depression [33, 34].
Socioeconomic status
For the socioeconomic status (SES) of respondents' area of residence, the ABS Socio-Economic Indicators for Australia (SEIFA), Index of Disadvantage [35] was used, computed from respondents' postcodes.
Service use and costs
We assigned costs using Drummond et al.'s [22] classifications: costs consumed within the health care sector, costs borne by the patient and his/her family, and costs borne by other sectors of the economy. All costs reported are in Australian dollars unless otherwise specified.
Although the HOS probed service use within the previous 4 weeks, it did not ask about the number of times each service was accessed. We estimated it from the 1998 Australian Institute of Health and Welfare's (AIHW) health report [36], pp.210–218] which states that of those consulting a GP within the previous two weeks, 77% reported one consultation, 17% two consultations and 6% three or more consultations. We accepted these figures although we recognize that they will lead to an underestimate of service use since the number of consultations within 4 weeks will be higher. The AIHW report stated that the annual average number of GP/specialist consultations was 6.5. From this we estimated the number of consultations and extrapolated these to the use of other health services where the data were not known (e.g. acupuncturists, chiropractors, community health centres).
Regarding pharmaceuticals, in 1998–1999 there were 128.4 million Pharmaceutical Benefits Schedule (PBS; the government subsidy scheme) or Repatriation PBS (RPBS) prescriptions, and 45 million other prescriptions [37], pp.301–306]. The average was 9.1 prescriptions per annum (from 173 million/19 million Australians). Dividing by the average number of consultations (6.5) provided an estimate of 1.4 prescriptions per consultation.
Where costs are not directly obtained, they must be assigned. The Medicare (government funded health insurance scheme) scheduled fee for a GP consultation was AUD$26.45 and for a specialist was AUD$65.80 for the first visit and AUD$33.00 thereafter. Private health insurance costs are different. Medibank Private (the largest private health insurer in Australia) rebates at 60% for a psychologist were AUD$48.90 for a first visit and AUD$42.80 for subsequent visits [personal communication, January 2001]. The AIHW report [37], pp.301–306] showed total non-hospital pharmaceutical costs were AUD$5335 million in 1998–1999, of which AUD$3377 million was for PBS pharmaceuticals. From these data the average cost per PBS/RPBS script was AUD$3377/128.4, that is AUD$26.30.
Hospital costs were calculated from the 1998–1999 SA Public Hospital (SAPH) record [38] and the 1997 National Mental Health Report (NMHR) [39]. The population of SA was 1 487 294 persons in 1999 [40]. South Australia Public Hospital receipts were AUD$47 894 000, there were 334 716 hospital separations and 1 725 833 outpatient visits. Thus, the mean cost of inpatient services was AUD$143.09 and outpatient visits was AUD$97.38. Length of stay (ALOS) was calculated from the National Hospital Cost Data Collection database [41], which reports 324 393 separations from public hospitals in 1997–1998, involving 1 248 752 hospital days, giving 3.85 days on average. The average cost per diagnostic-related group (DRG) was AUD$2,380, thus the average daily cost was AUD$618.18. For public hospital depression admissions, the ALOS was 8.8 days and 6.4 for private hospitals. The number of depressive episode separations was 20 507 (public hospitals) of which 31% were same day, and 13 583 (private hospitals) of which 65% were same day separations [42, Tables 7.12, 7.13]. The NMHR showed the SA mental health per capita cost was AUD$73.97 [39], of which inpatient services were AUD$48.58 and ambulatory services were AUD$24.47 [18].
Costs of allied health professionals (AHPs; chiropractors, physiotherapists, acupuncturists) were estimated from the Medibank Private rebate, which is calculated at 60% of the ‘recognized fee’ (for many AHPs there are no Australian recommended or award fees). Acupuncturist and chiropractor rebates were AUD$21.40 (first visit) and AUD$15.30 (thereafter), for a physiotherapist they were AUD$26.50 and AUD$20.90. Nursing costs were provided by the Australian Nursing Federation at AUD$22.77 per hour [personal communication, January 2001] and social worker costs were estimated by the Australian Association of Social Workers at AUD$90.00 per consultation [personal communication, January 2001]. The costs of counsellors, alternative therapists and other AHPs are unknown, accordingly we assigned chiropractor costs as being the best estimate. For community mental health services and centres we assigned GP costs.
The costs above are all direct service costs which are usually not borne by the consumer. However, these underestimate actual costs due to the ‘gap’ (i.e. copayments) between what any practitioner charges and the rebatable amount. For example, although many GPs bulk bill (leaving no patient out-of-pocket expenses) others charge well above the recommended fee. Since the proportion charging above the scheduled fee and the amount charged is unknown, we assumed that 50% of all visits incurred out-of-pocket copayments of 40%, based on the Medibank Private ‘recognized fee’. Out-of-pocket costs are therefore estimated at 20% of direct costs.
Regarding loss of wages, ABS data show average weekly earnings in SA in 1999 of AUD$570.10, or $15.20 per hour or AUD$114.00 per day [43]. We recognize that where a person was unable to work there may be sickness benefits which camouflage loss of income. Where a person had to reduce their work because of their health, we estimated this reduction would be 20%; however, this is our best guess and many employers would not reduce wages. Where a person worked voluntarily (e.g. in the home) there may also be no actual financial loss.
Finally, the ‘excess’ costs in the findings are just that: ‘excess’ costs over and above usage by the non-depressed. Our data provide no evidence regarding the real costs of depression. If a person's ‘excess’ cost, say, was AUD$77 in a calendar year this does not imply the depression cost was AUD$77 since there is no measure of the benefits from treatment. It is possible this excess cost produced thousands of dollars in benefits in demand reduction elsewhere in health services, in a higher quality of life, or enabling the person to resume work full-time. Also, our data reflect the situation for those living in the community; those institutionalized (e.g. in psychiatric hospitals) were not included in the HOS.
Value of life
Generally, life values are estimates extracted from revealed behaviours (e.g. observing wage differentials as a function of occupational risk), and estimates based on discounted loss of lifetime earnings. This second approach is reflected in insurance pay-outs, court awards, etc. However, there is virtually no consensus. For example, regarding actual life-value estimates, the Australian Pharmaceutical Benefits Advisory Committee will, in general, fund pharmaceuticals where the cost-perlife-saved is up to AUD$70 000 [44]. Within the environment industry, the value of life ranges between AUD$1–5 million [45]. The transport sector typically values life at AUD$750 000 assuming a 15-year loss of life [46, 47].
We accepted this last estimate as a conservative value since it implies a value of AUD$50 000/life year.
Data analyses
For categorical variables, χ2 was used. Where the numbers violated the distributional assumptions, Fisher's Exact Test was used instead. For interval variables, where the data were normally distributed we used analysis of variance (ANOVA), where the data were non-normally distributed we used the Kruskal–Wallis ANOVA instead. All percentages have been rounded up, therefore totals may not add up to 100% exactly.
The weighted (see section on Health Onnibus Survey) data were analysed with SPSS, Versions 6 [48] and 10 [49].
Results
Respondents' demographic and health status
Respondents' demographic characteristics were broken down by level of depression (Table 1). Females were more likely to be assigned to major depression, as were those with primary school education, those reporting their occupation as home duties or unemployed, who were on low incomes, from low SES areas, and who were separated or divorced.
Demographic, health and health-r elated quality of life status (Per centages have all been rounded up)
Those suffering major depression took more days off work or their usual activities, and were more limited in their work or usual activities. Although not reported in the table, when the reasons for these findings were examined, the data showed that those with major depression were more likely to report they suffered from nerves/tension/anxiety or mental health problems.
Less likely to be assigned to depression levels were males, those with post-high school education, managers or professionals and tradespersons, those working full-time and earning high incomes, those from upper SES areas, and those married or in a de facto relationship.
Regarding health status, this was measured by the SF-36, and the details are given in Figure 1. On all eight SF-36 dimensions those with major depression obtained scores indicative of poorer health when compared with those with other depression, and those with other depression obtained scores showing poorer health when compared with those with no depression. On all dimensions these differences were significant.
Health status as measured by the SF-36 ▪, no depression; ▴, other depression; •, major depression. (Note: all differences are significant, ANOVA, p < 0.01.) See Appendix for notes for this figure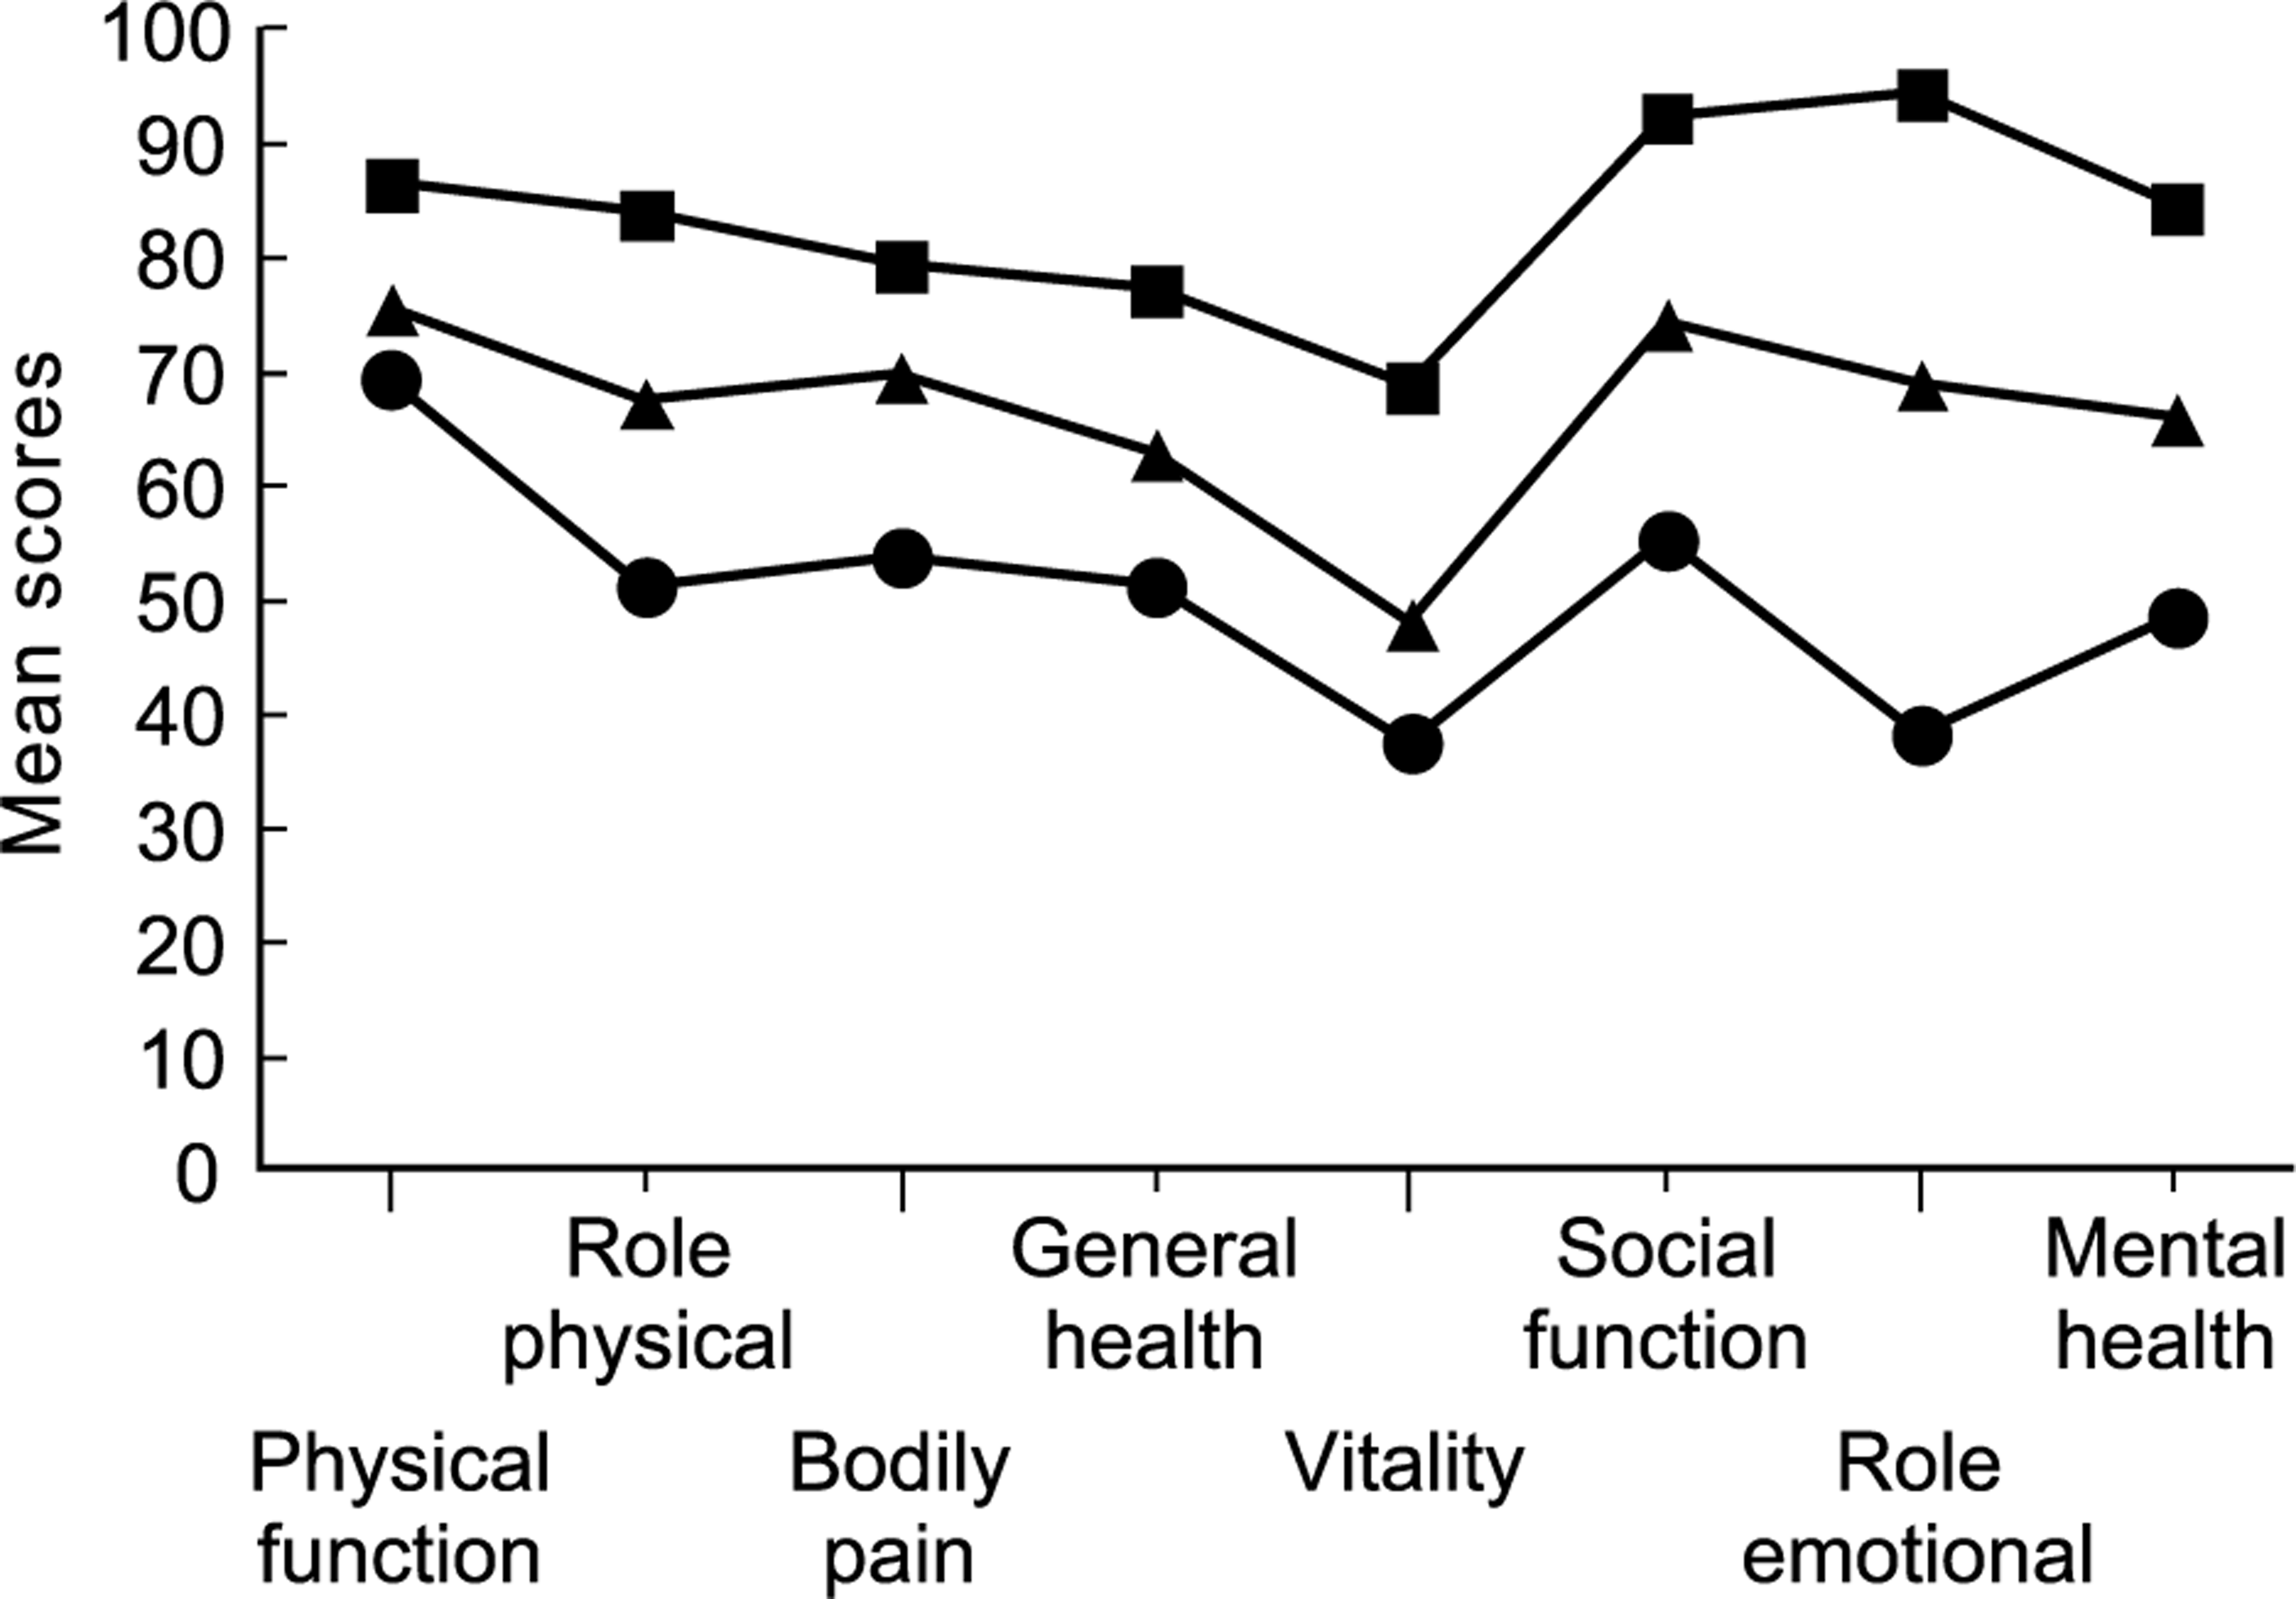
Table 2 shows health service use by level of depression. For medications used in the previous 12 months, those with major depression were more likely to report medications for both physical and mental health problems. Those with no depression were more likely to use medications for physical health problems only. For medical service use in the previous month, those with major depression were more likely to have visited a GP, a community mental health service, a community health centre, a social worker, psychologist, psychiatrist, a counsellor, physiotherapist or attended hospital as an outpatient. Those with other depression were more likely to have seen a GP or used a district nurse. Finally, those with major depression used more services than those with other depression, who used more services than those with no depression.
Health service use
Excess costs associated with depression
To calculate excess costs we assigned costs to the service usage reported in Table 2. We estimated actual proportional service use, copayment and loss of income as broken down in the methods section. We then assigned costs as outlined in the methods section also, estimating these separately for the health sector and the patient. Once costs per case were estimated we extrapolated these to the SA population and from the study point prevalence period to the calendar year. During this process we combined several services into larger categories to minimize multiple analyses involving very small numbers. Full details of the procedures and intermediate tables are available from the researchers.
The estimated excess costs by both the health sector and patient, and at both the case and population levels are presented in Table 3.
Estimated excess costs associated with depression
Regarding major depression, the areas of highest excess health sector costs were: hospital inpatient services (73% of all health sector excess costs), pharmaceuticals (9%), specialist services (7%), and GPs (4%). The highest excess patient costs for major depression were: days unable to work (52%), days of reduced work (46%), pharmaceuticals (0.5%) and specialist services (0.4%).
For other depression the highest excess health sector costs were: hospital inpatient services (70%), pharmaceuticals (15%), GPs (6%) and specialist services (4%). The highest excess patient costs were: days of reduced work (62%), days unable to work (36%), pharmaceuticals (0.8%) and GPs (0.3%).
Across all depression (both major and other) the areas of highest excess cost from the health sector's perspective were: hospital inpatient costs (72% of all health sector excess costs), pharmaceuticals (11%) and specialist services (6%). From the patient's perspective the highest excess costs were: days of reduced work (52%), days unable to work (47%), and pharmaceuticals (0.6%).
The actual excess costs for major depression, when examined by health sector and patient costs, were AUD$282 million and AUD$1 010 million and for other depression they were AUD$131 and AUD$497 million, respectively. The total excess cost due to depression was estimated to be $1921 million.
Regarding the costs per person, for major depression the personal costs were AUD$9951 per annum and AUD$2803 for health sector costs. For other depression, the costs were AUD$3153 and $829, respectively.
The value of life lost due to depression
From the HOS we calculated that 10.6% of respondents were suffering other symptoms of depression and that 6.8% were suffering symptoms of major depression (Table 1). If it is assumed that the HOS figures represent the lower and upper estimates for SA, then the number of SA adults suffering some form of depression may be between 101 000–259 000.
The AQoL utility weights were obtained through respondents directly evaluating the relationship between quality of life and lifelength. According to utility theory, these utilities place HRQoL on a bounded inviolable equal-interval scale between 0.00 and 1.00. If this strong interval property is accepted, then, for example, a person obtaining an AQoL score of 0.90 would be prepared to give up 10% of their life length in order to be restored to full health; this implies AQoL utility scores can be directly translated into reductions in life expectancy. When we calculated the HOS AQoL values there was a monotonic relationship between depression level and AQoL scores; the values were major depression, 0.54 (95% CI = 0.50–0.58), other depression, 0.71 (0.67–0.73) and no depression, 0.86 (0.85–0.87). These differences were significant (ANOVA, F = 352.42, df = 2,2931, p < 0.01.
Based on the above parameters these estimates would suggest that the cost per annum in loss of health-related quality of life due to depression in SA is approximately AUD$2801 million (95% CI = AUD$2571–$3190 million), as shown in Table 4.
Estimated value of annual losses associated with depression
Discussion
The limitations of this study are those applicable to all cross-sectional surveys [50]. Given the HOS study method [25] we do not believe that response bias or voluntarism would have played an important role in the findings.
It could be argued that the mood module of the PRIME-MD delineated too many cases with depression; it classified 6.8% with major depression and 10.6% with other depression. We utilized the mood module of the PRIME-MD for all subjects as it is based on DSM-IV criteria, specifically the duration of symptoms being 2 weeks. It is acknowledged that in the full version of the PRIME-MD there are two screening questions about depressive symptoms experienced in the past month that determine whether the mood module should be administered [26]. Respondents to the HOS completed both the two preliminary screening questions and the mood module; those who did not endorse one of the preliminary screening questions but who endorsed the PRIMEMD items provided inconsistent responses. We therefore based our analysis on those cases which met the DSM-IV criteria.
The resulting figures are higher than those reported in the Australian National Mental Health Survey [1, 11], which used a different instrument, the CIDI. Regarding the relationship with the CIDI, Loerch et al. [51] compared the two methods using untrained PRIME-MD interviewers (i.e. similar to those in this study) with outpatient and inpatient samples. The findings showed that when assessed by the PRIME-MD 51% fulfilled DSM-IV criteria for depression compared with 46% for the CIDI (kappa = 0.46 for major depression). In a validation study, Spitzer et al. [26] compared primary care physicians' PRIME-MD scores with mental health professionals' assessments: for major depression the prevalence was 10% and 14%, for dysthymia it was 8% and 10%, and for minor depression 7% and 6%, respectively. These data do not suggest it over-identifies cases. Furthermore, the obtained point prevalence was within the ranges reported for community studies of both major depression and other depressions [52–54]. Additionally, the South Australian HOS survey, in 2000, found similar depression rates to those identified in our study; 5.8% for major depression and 11.7% for other depression, based on DSM-III criteria using the Centre for Epidemiologic Studies Depression scale [unpublished data, personal communication David Banham]. It is also reassuring that Andrews et al. [1], p.151] noted that ‘Even if the prevalence figures are different, the nature of the disorders identified are likely to be the same’. For a further discussion of PRIME-MD we refer readers to an earlier paper [28].
A second caveat is in relation to costs. Where costs were not known, we made theassumptions in the methods section. Although our procedures may have overestimated some costs, others would have been underestimated. Regarding overestimation in relation to the excess consumption of health care services, we are aware that many people with mental health conditions suffer comorbidies which they raise with their clinicians even though they do not consult for their mental health condition [55]. Thus, where a person suffers both mental and physical health conditions that warrant health care, and was classified by the PRIME-MD as suffering depression yet consulted with a clinician for their physical condition only, it is possible we overestimated depression costs. This must be balanced, however, by systematic underestimation in our procedures elsewhere. Wherever possible we assigned 1998–1999 costs because the HOS data were collected in 1998. Costs will have risen since then, particularly pharmaceutical costs. For the number of times services were used, we used the AIHW 2-week estimates [36], recognizing that this will have underreported 4-week usage. We used general ALOS figures which include same day separations. We are aware that, excluding same day separations, the mean 1993/1994 ALOS for those with major affective disorders was 26 days and 15 days for those with other affective and somatoform disorders [56]; thus our hospital costs are systematically understated. Regarding other costs, we did not consider costs borne by services other than health services and costs to family members and others, nor costs to other sectors of the economy. Our estimates do not include those who are institutionalized because of their depression, since they were not included in the HOS. In addition, this study considered only morbidity due to depression and not the mortality burden, which may be significant [15].
Finally, the confidence intervals were very broad. For example, the 95% CIs around the total cost estimate of AUD$1921 million (Table 3) showed a lower boundary which was 35% lower, while the upper boundary was 41% higher. This uncertainty should be taken into account when interpreting the findings.
Subject to these caveats, this study has demonstrated excess burden in terms of reduced quality of life, increased service use and productivity loss among depressed community residents.
Based on loss of HRQoL utility as a result of living with depression the results suggest an overall excess burden of depression in SA of over AUD$2800 million. Fifty-eight per cent can be attributed to major depression and 42% to other depression. This estimate is based on a moderate valuation of the value of life (AUD$50 000). This estimate provides the broadest perspective since it reflects all losses associated with ill health.
Based on health sector and patient costs, the cost burden was AUD$1921 million comprising 22% and 78% in costs for the health care system and patients, respectively.
Total costs will be affected by the depression definition. Most studies focus on major depression defined according to set criteria (usually clinician assessment). This study has shown that a significant proportion of the population not diagnosed as having a major depressive disorder, but with depressive symptoms also impose a major burden on society. We found a graded relationship between severity of depression and excess costs. A similar relationship was reported from a large US study finding excess health care costs of around US$1500 per individual with depressive symptoms and around US$3000 for individuals with major depression [57]; costs which were much higher than those reported in this study.
Our study also showed that 77% of the depression cost was in lost productivity through total or partial inability to carry out normal functions. This finding is consistent with another Australian study that reported that inpatients with depression rated the indirect financial costs of depression as having a greater impact on their lives than direct costs, and that social, relationship and personal costs were greater than both [58]. It is also consistent with the study by Berndt et al. of the onset of major depression that showed that there were significant human capital losses [59]. It is these personal costs that cost of illness studies do not generally measure. These costs are reflected in the AQoL utility scores.
Burden of disease studies can be used to target high users of health services for appropriate interventions. Given the excess costs identified in this study, the net savings from treating depression are likely to be significant [60]. Examples where this has been done include an evaluation by Rutz et al. of GP training in depression treatment, which resulted in considerable savings through reductions in psychiatric admissions, sick leave and suicides [61]. In another study there was decreased service use, improved depression, work productivity and quality of life [62]. A third study reported that those with greater clinical improvement were more likely to maintain paid employment, to report fewer days off work due to illness and to have lower health care costs [63].
Further research is required to identify the underlying cost patterns, particularly the indirect costs, in order to develop more targeted strategies for reducing this burden. However, immediate economic gains can probably be made by simply raising the proportion of depressed individuals on treatment. It is well documented that depression often goes unrecognized and untreated [64, 65] despite increasing epidemiological evidence of the cost-effectiveness of pharmacological and psychological treatments. Our estimates report on the proportion of depressed persons in the community, most of whom are not aware of their condition, and the excess service use most of which will not be treatment for depression. From the ABS NMHS only 40% of depressed persons sought treatment for their depression and most of those received the care in primary care settings [66], a finding that was replicated in this study (Table 2).
A further finding from this study is that the low rate of identification and treatment of depression implies an unmet need for treatment and the need for resources to be directed at increasing the identification and treatment of depressed individuals. For example, we found that of those classified as having major depression only 19% were on antidepressants, as were 7% of those classified as other depression and 2% of the non-depressed (it is possible these cases were those who have been ‘successfully’ treated, i.e. no longer have symptoms).
Given this, more evidence is required regarding the cost-effectiveness of a range of interventions to help planners develop strategies that are appropriately targeted to those who would benefit most and to guide clinical practice. However, given the size of the problem it is likely that available specific resources (e.g. the recent Australian beyondblue AUD$35 million initiative [67]) may be too small to have a major impact. Information is also required on multidimensional outcomes for depression and not just depressive symptoms given the high cost of depression outside the direct cost of treatment. Strategies could include further raising of public awareness and reduction of the stigma attached to mental illness as well as focused education programmes and methods to improve diagnosis. Better management strategies may improve both effectiveness and economic efficiency. That most depressed persons are treated in GP settings (Table 2) implies that strategies aimed at improving the skills of GPs are imperative.
Our findings also suggest the need for economic evaluation so that those interventions with the greatest benefit are supported. Where the patient's perspective is desired, a perspective which this study has shown to be so important, such evaluations should include costutility analysis.
Strategies aimed at identifying and treating depression with currently available interventions would be expected to yield immediate results. Simulations of costs and outcomes show that provision of appropriate care for depression (antidepressants and psychotherapy) improves the cost-effectiveness of treatment, despite increased costs, as a result of greater benefits in terms of improved outcomes [68].
Conclusions
Subject to the caveats above, using a cross-sectional survey we found symptoms of major depression in 7% of the SA population, and 11% for other depression. In addition we found that those with major depression reported worse health status (Fig. 1), more time off work, more limitations in work performance (Table 1), that they made greater use of most health services (Table 2) and that their HRQoL was poorer (Table 1).
We used these data to calculate the excess burden of illness due to depression using two different methods. From the health sector and patient perspectives we obtained an estimate of direct service costs and the indirect costs due to work restrictions. This suggested that the excess cost of depression was AUD$1921 million per annum. Importantly, this perspective excludes other costs, such as family tensions or breakdown, and costs to other services and other social costs (e.g. legal costs). When we estimated the excess burden of illness using a utility approach based on the AQoL and assigning a very modest life-value (AUD$50 000) we obtained an estimate which, ipso facto, includes these broader costs since the AQoL utility weights are based on a societal perspective of the value of illness. The AQoL-based estimate (AUD$2801 million) was considerably higher than the health sector and patient cost estimate. Given the very different methodologies and assumptions, there is no particular reason these two different methods should agree as they provide different kinds of information.
Both methods, however, suggest that estimating the excess burden of illness from the direct service provision perspective is too restrictive, and that patient and societal costs ought to be always taken into account.
Despite the high ranking of depression as a major health problem in terms of the proportion of the population affected and the excess economic burden to society, it is often unrecognized and undertreated. The high prevalence of depressive illness as revealed in this population survey mandates action to explore ways of reducing the excess burden borne by depressed individuals, those affected by their illness, the health system and society generally. Given the limited information on the cost-effectiveness of different treatment options, it would seem important that resources be allocated to evaluating alternative depression treatments.
Given the prevalence rates and costs reported in our survey, society needs to increase the effort to detect and treat depression.
Footnotes
Acknowledgements
This study, supported by grants from the University of Adelaide, Pfizer, Bristol-Myers Squibb Australia, and Wyeth Australia, was conducted as part of the SA Health Omnibus Survey. The AQoL was funded by the Australian Research Council, National Health and Medical Research Council and Victorian Health Promotion Foundation.
Thanks to Tony Harris from the Health Economics Unit, Centre for Health Program Evaluation, for his advice on health service costs.
Appendix
Notes to Figure 1