
Abstract
Over the past two decades, many sophisticated techniques for imaging the brain have been developed and introduced into clinical practice [1, 2]. Magnetic resonance spectroscopy is one such technique that is becoming increasingly available in most MRI units and its application to psychiatry is receiving much attention. In this paper, we describe magnetic resonance spectroscopy (MRS) and its applications in psychiatry.
Magnetic resonance spectroscopy is a non-invasive computerized imaging technique that relies on the same nuclear magnetic resonance (NMR) principles that form the basis of magnetic resonance imaging (MRI) and functional MRI (fMRI). It is used in both clinical and research settings to study brain chemistry, as it enables the relative quantification of certain compounds and their constituents in specific brain regions. This metabolic information can be used to define the nature and extent of brain diseases, such as cancer, stroke and various neurodegenerative disorders, aiding diagnosis and management [3–5]. In psychiatry, MRS is increasingly being used to research the neurochemical changes that occur in psychiatric disorders such as schizophrenia, dementia and affective disorders [6, 7].
Basic principles of magnetic resonance spectroscopy
Nuclear magnetic resonance exploits the fact that atomic nuclei ‘spin’ and that spinning charged nuclei produce a small magnetic field. When placed in a strong external magnetic field, certain atomic nuclei align themselves with the applied field either in the same (lower energy state) or opposite (higher energy state) direction. The application of a radio frequency pulse briefly promotes some of the lower energy nuclei to higher energy (less stable) states and synchronizes their spins so that all are in phase. When the pulse is switched off, the nuclei immediately begin to dephase, reverting to their former states, and in doing so emit radio frequency energy, which forms the basis of the electromagnetic signal detected by the scanner. The energy released decays with two relaxation times, T1 and T2. T1 (spinlattice or longitudinal relaxation time) is the time atomic nuclei take to return to their baseline lower energy states. T2 (spin-spin or transverse relaxation time) is the time it takes for the nuclei to substantially dephase. These relaxation times are determined by the immediate molecular environment of the atomic nuclei and are encoded within the electromagnetic (EM) signals produced by magnetic resonance scanning. Analysis of these EM signals yields structural, chemical or functional information about the tissues to which the atomic nuclei belong.
Structural MRI is now widely applied in clinical neuropsychiatry, and offers images superior to X-ray computed tomography (CT) because of greater resolution, lack of bony artefacts, greater differentiation of grey and white matter and increased sensitivity to white matter pathology. It relies largely on the proton signals from water molecules and provides cross-sectional, anatomical images with regional differences emerging as a result of association between water and lipid.
Magnetic resonance spectroscopy is rooted in similar NMR principles and permits in vivo neurochemical evaluation of the brain. However, instead of images it provides frequency-signal intensity spectra that reflect the biochemical (metabolite/compound) composition of a localized brain region (see Fig. 1). Magnetic resonance spectroscopy is able to measure a variety of nuclei/ isotopes (see below), of which hydrogen is the most widely used, as it occurs in high concentrations in biological tissues. Compounds, containing hydrogen can be distinguished because not all protons, even within a uniform magnetic field, experience the exact same field. This is because each proton differs to the extent it is shielded by surrounding molecules such that protons within different compounds resonate at slightly different frequencies. These small differences in frequency are referred to as ‘chemical shift’ and are conventionally plotted along the horizontal axis, right to left, of a MR spectrum, in units of parts-per-million. The range of frequencies for hydrogen is relatively small and so brain tissue spectra consist of many overlapping signals from the many constituent compounds. Even so, its unique position or chemical shift along the frequency axis of a MR spectrum can accurately identify each metabolite and its tissue concentration can be readily determined, as it is proportional to the area under the peak or the peak intensity [8]. In this manner MRS provides a unique means of non-invasive ‘chemical biopsy’ of the brain.
A short echo (TR/TE = 1500/30 ms) STEAM (Stimulated Echo Acquisition Method) spectrum obtained from 8 cm3 of healthy brain (principally anterior cingulate cortex). Abbreviations: Cho, choline; Cre, creatine, NAA, N-acetyl-aspartate; Lip, lipids; Lac, lactate; Glx, glutamate and glutamine; mI, myo-inositol.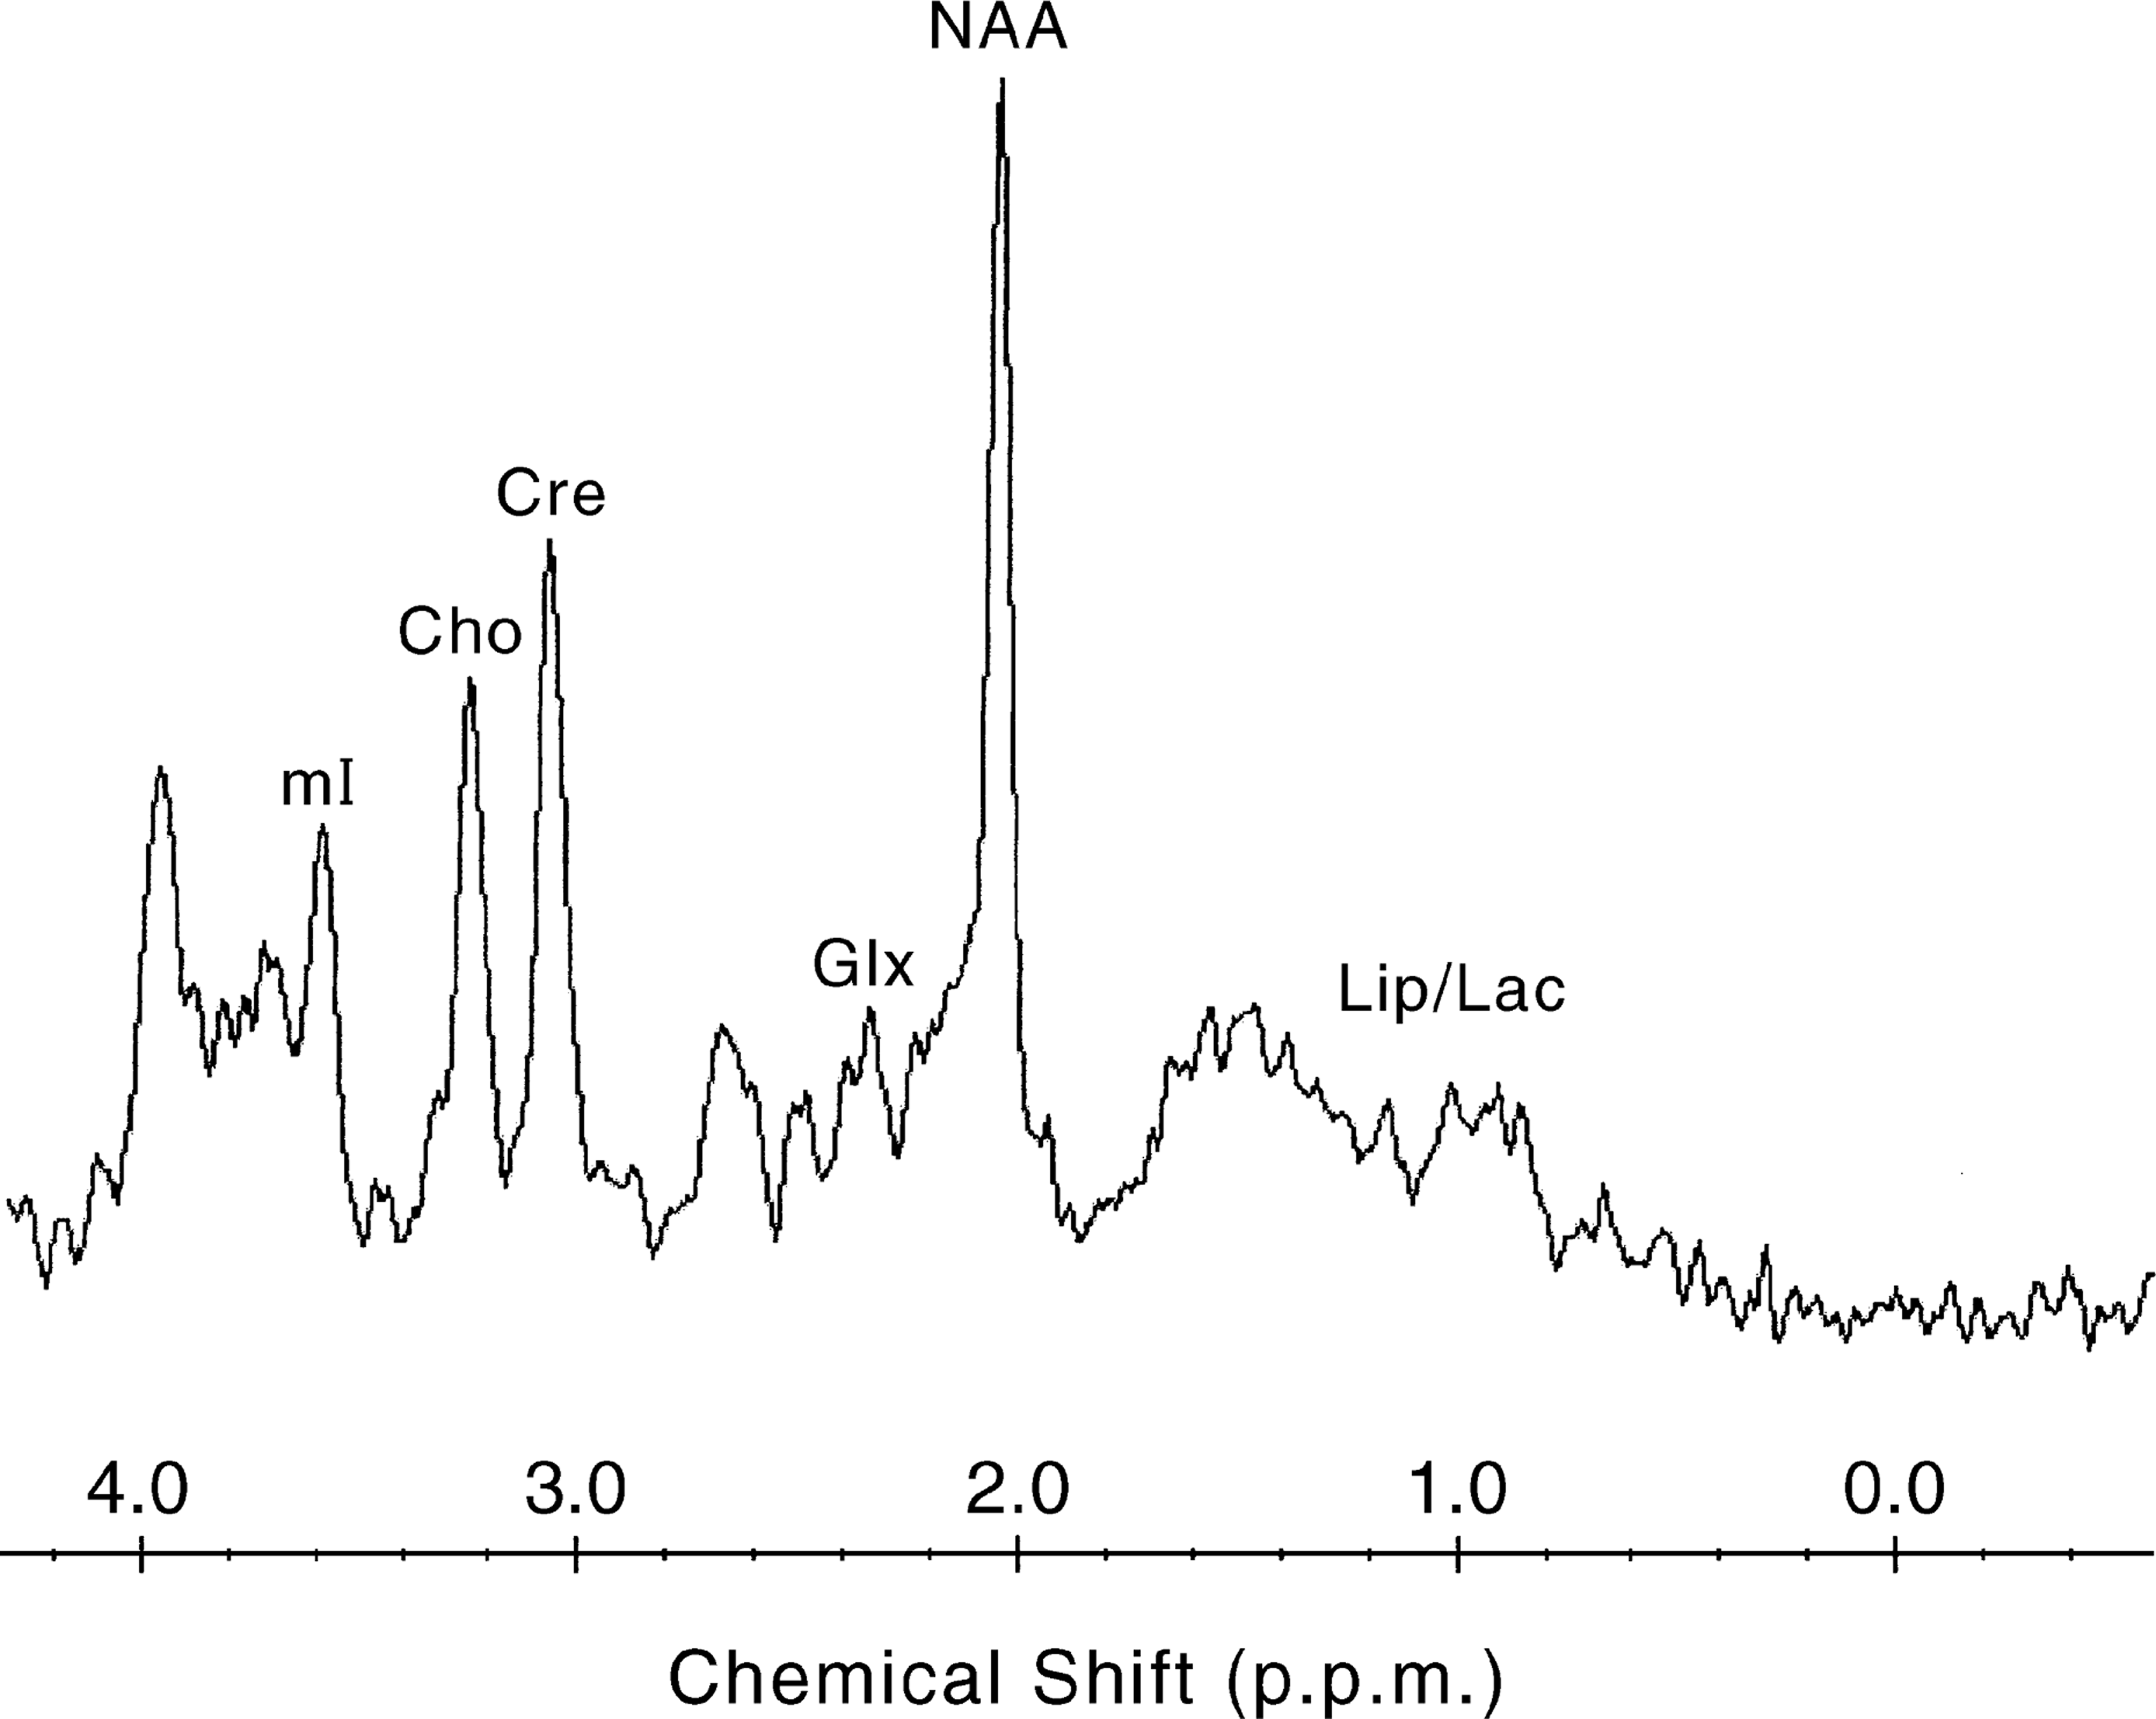
Magnetic resonance spectroscopy is a versatile technique that permits selection of the region of interest (ROI), the means of data acquisition, its postprocessing and quantification. The general aim in an MRS procedure is to optimize the signal from the ROI both in terms of quantity and quality in relation to background ‘noise’. This is often referred to as the signal to noise ratio (SNR) and is influenced by many factors. The ROI is defined by graphic prescription on an initial localiser image. Voxel (a three dimensional volume) size and location is then determined by placement of an adjustable box cursor (see Fig. 2) and by slice selection. An ideal MRS voxel should only contain tissues of interest and therefore its dimensions are usually compact. However, the MR signal is directly related to voxel size necessitating a judicious balance between signal to noise-ratio (via sufficient tissue sampling) and localization specificity.
An axial T2-weighted MR image illustrating midline placement of an adjustable boxcursor targeting anterior cingulate cortex.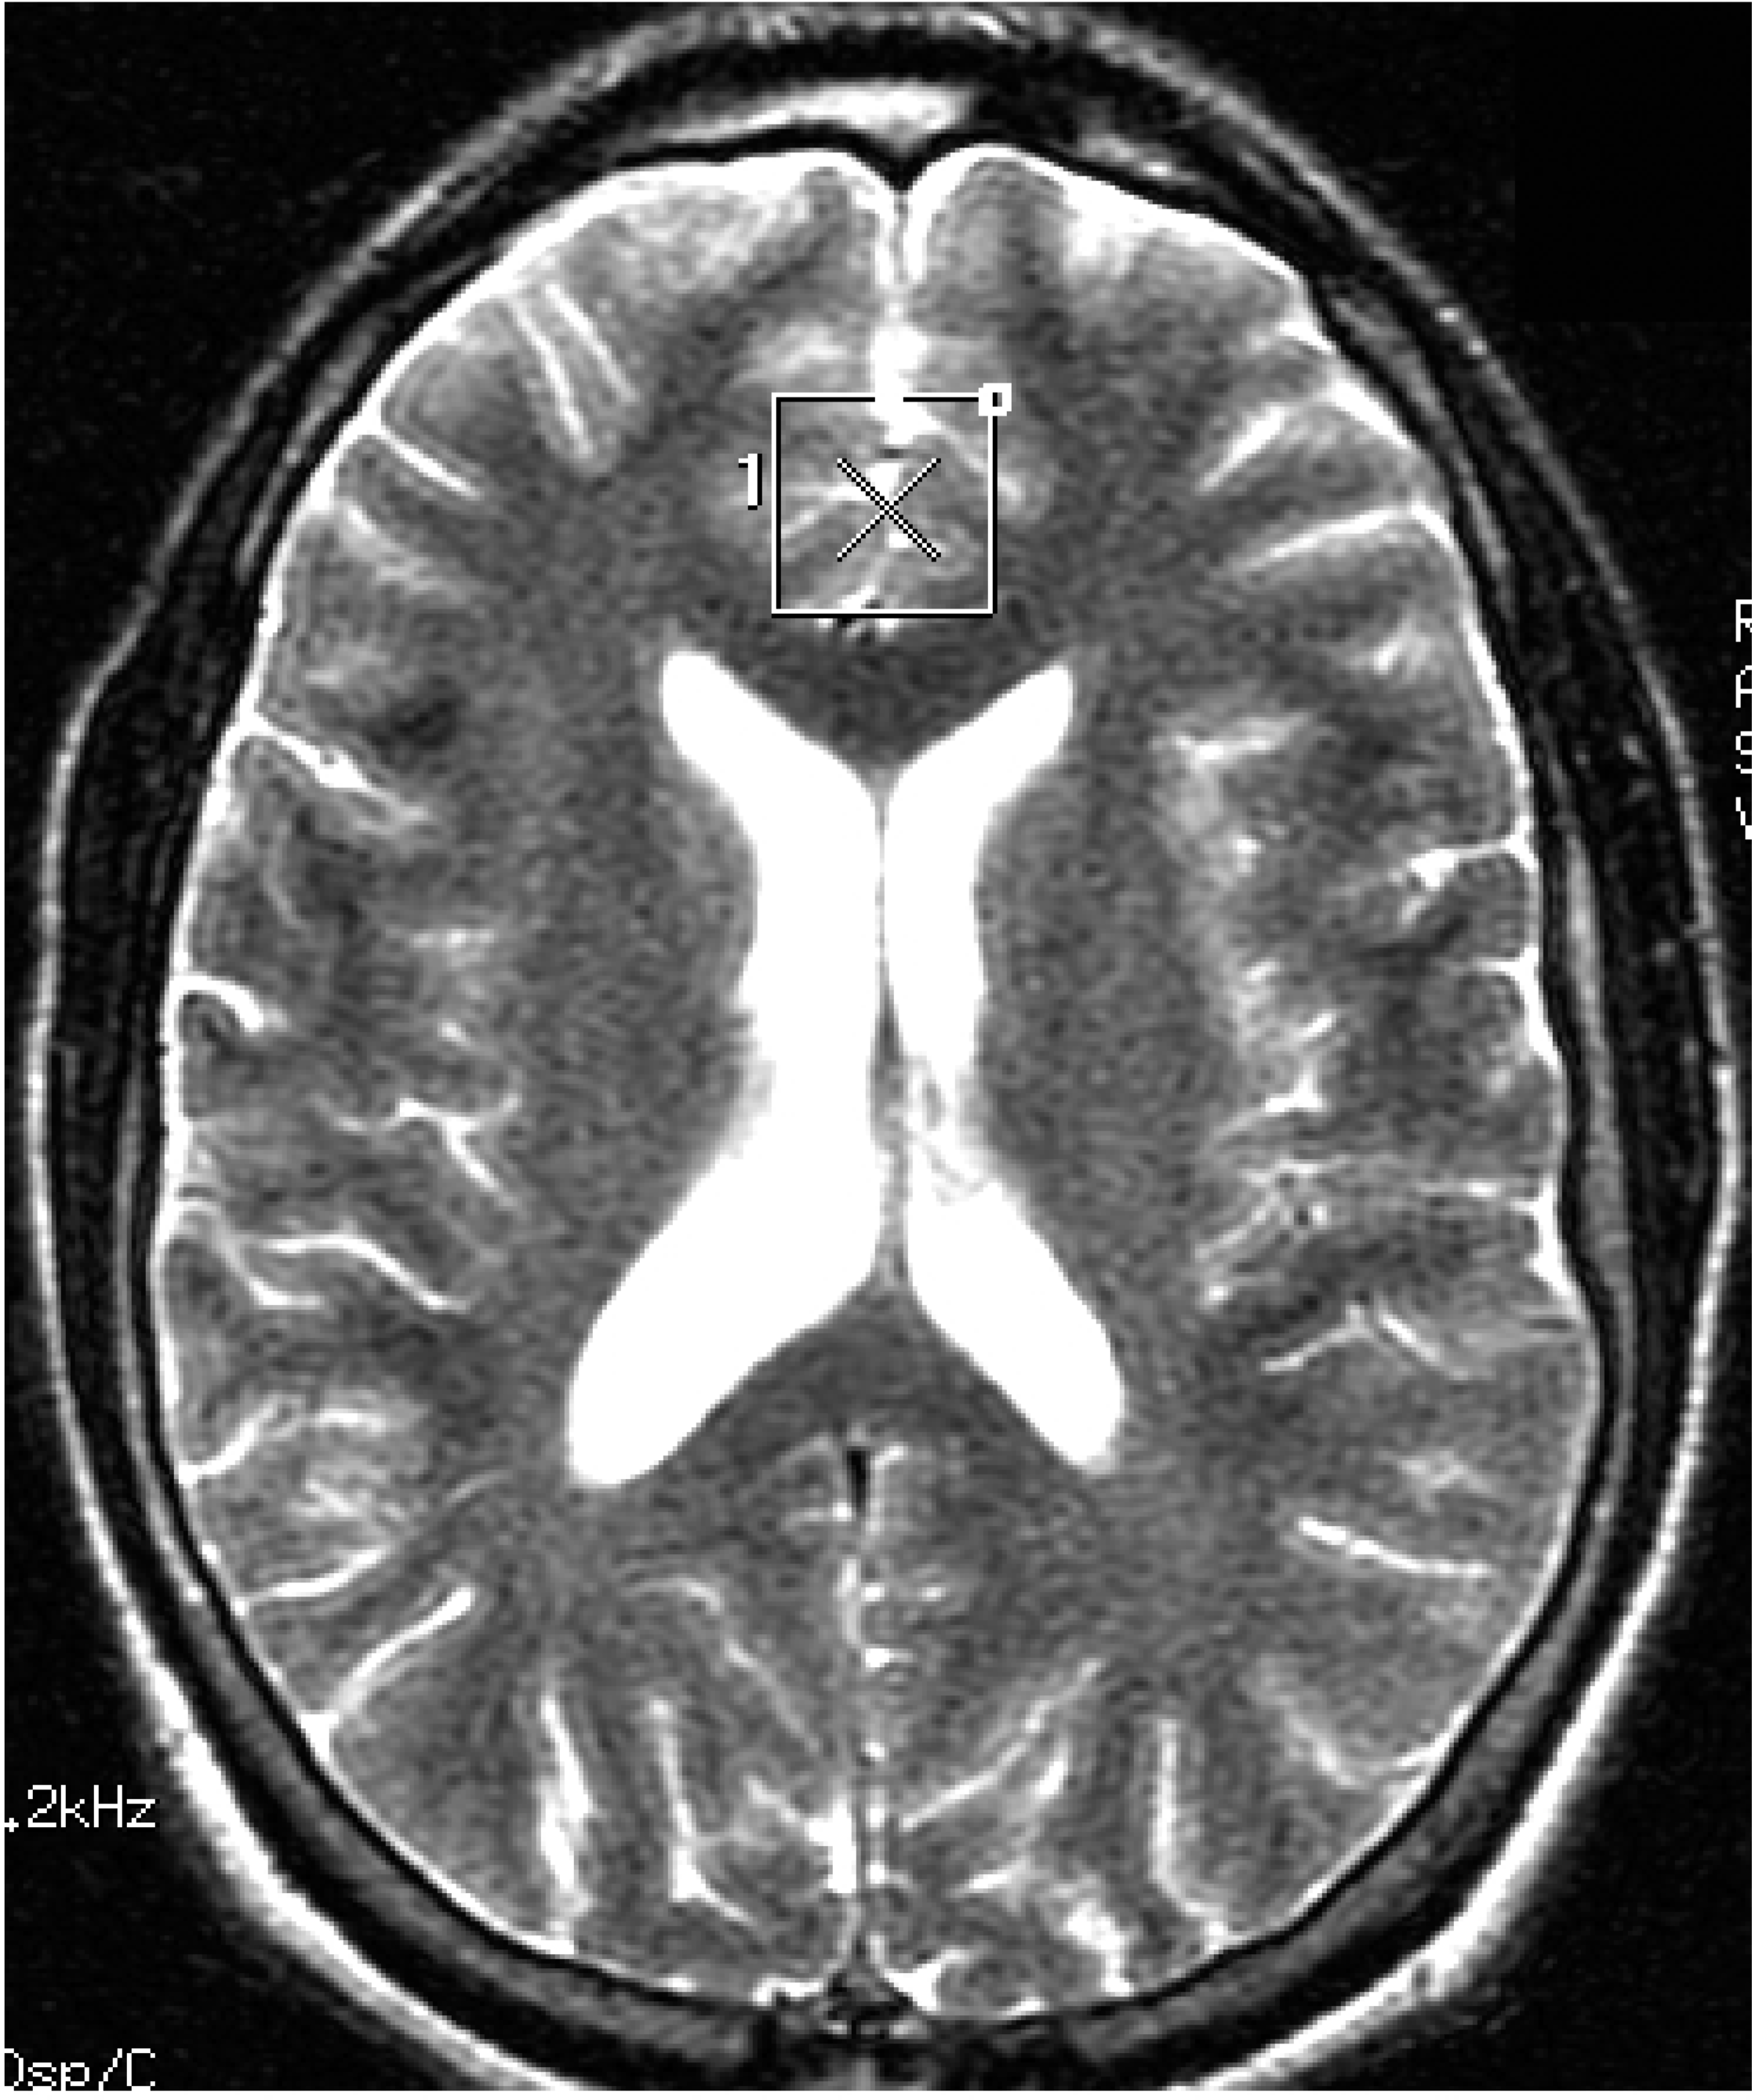
Data acquisition, in single-voxel MRS, most often utilizes either STEAM (Stimulated Echo Acquisition Method) or PRESS (Point Resolved Spectroscopy) excitation pulse sequences. Technically the two differ in that, from the volume defined by the intersection of three slices, PRESS uses a 90-degree radiofrequency pulse (RF) and two 180-degree pulses to generate a spin echo, and STEAM uses three 90-degree RF pulses (stimulated echoes have only half the signal of spin echoes). In practice the two have different metabolite sensitivities, such that the STEAM sequence is better for metabolites with short T2 relaxation times, and PRESS is better for those with long T2 relaxation times. Suitable voxel selection and excitation sequence administration usually ensures a reasonable ‘raw signal’. However, the concentration of water in the brain far exceeds that of any metabolites of interest and therefore its peak dominates and distorts the MR spectrum unless it is appropriately suppressed. This is achieved using RF pulses designed to excite frequencies corresponding to the water peak. The signal can also be ‘lost’ if there is substantial fat contamination within the voxel or distorted if there are abrupt tissue changes. These aberrations and others can sometimes be corrected during processing, a necessary step that converts the EM signals into spectra, before finally resolving the various spectral peaks, assigning them to the metabolites they represent and quantifying them. Quantification is dependent upon a number of variables (peak area, T1 and T2 relaxation times of each metabolite) and each of these complex steps adds to the overall complexity of singlevoxel MRS [9–11]. Nowadays, quantification is usually achieved automatically using ‘MRS software’ and recent advances allow more than one voxel to be sampled at a time, within a chosen plane, and this can be extended to multiple slices. This novel technique called spectroscopic imaging (MRSI) or chemical shift imaging (CSI) allows the sampling of much larger volumes and has the advantage of allowing retrospective voxel selection and alignment in keeping with a variety of regions of interest. However, it necessitates pristine magnetic field homogeneity – which is rarely achieved and is prone to severe distortion by extra-cerebral tissue signals. Nevertheless, the appeal of MRS and CSI is that most MRI machines can be adapted, with some relatively minor changes, to perform the above functions and so it is potentially widely available.
Nuclei relevant to magnetic resonance spectroscopy
A growing number of isotopes can be measured using MRS – proton [1H], carbon [13C], phosphorus [31P], lithium [7Li], fluorine [19F] and sodium [23Na], with each having its own particular applications that exploit that isotope's specific properties. The concentrations of the isotopes vary considerably, from protons, which are ubiquitous, to those that are absent or negligible (e.g. lithium). However, in some instances the absence of a signal is an advantage as there is minimal background ‘noise’. Such isotopes are therefore useful when investigating brain metabolism or pharmacokinetics. In glutamatergic neurotransmission research, 13C-labelled carbon has been used to track the synthesis of γ-aminobutyric acid (GABA) and the metabolism of glutamate [12, 13]. Lithium-[7Li] spectroscopy measures the dominant atomic form of lithium, and has made in vivo investigation of its pharmacokinetic and pharmacodynamic properties possible. Similarly, fluorine-[19F] spectroscopy has been used to determine the concentration of fluorine containing medications in the brain, such as fluoxetine and fluvoxamine. Most studies use either proton-[1H], or phosphorus-[31P] spectroscopy, because these nuclei permit the analysis of a variety of metabolites and are abundant in brain tissue. Proton-[1H] and phosphorus-[31P] spectroscopy and the metabolites they measure will therefore be discussed in some detail, especially those that have relevance to psychiatry.
Compounds of interest
Proton spectroscopy (1H-NMR)
Hydrogen is a component of many compounds and would be expected to generate many overlapping spectral peaks especially as its chemical shift range is relatively small. However, only a handful of metabolites are readily observable on typical proton spectra. The reason for this is twofold. Firstly, only metabolites that are sufficiently small and mobile are able to generate clinically detectable MR spectra. Secondly, compounds need to be present in sufficiently high concentration (1–2 mM and higher) to be detected within a suitable imaging time. Hence, the following compounds can be measured: N-acetyl aspartate, choline, combined creatine and phosphocreatine, glutamate, myoinositol, and lactate. Those of interest to psychiatry are shown in Table 1.
Proton-1H-spectroscopy metabolites
Practical considerations
The use of proton spectroscopy in assessing in vivo neurochemistry is limited by some practical difficulties. The technique, although able to detect the concentrations of metabolites, is unable to specifically identify their source, i.e. whether they are intra/extra-neuronal or synaptic. Distinguishing between these various sites is further complicated by the existence of many compounds in several sites with multiple stores. Another difficulty is the volume of tissue that needs to be sampled in order to achieve a reasonable signal. In single-voxel measurements, several cm3 are necessary, limiting spatial resolution significantly and increasing the partial volume of unwanted tissue. A large voxel is also less likely to have field homogeneity, which is essential when attempting to achieve resolution of overlapping peaks, such as those of glutamate and glutamine [23]. In this respect MRSI techniques are better as they tend to have greater spatial resolution (as little as 1 cm3). Another consideration that needs to be mentioned is the localization and reproducibility of MR sequences [24], usually achieved by monitoring and repeating the sequences using ‘phantoms’ containing known solutions and measuring the effective size of localized voxels [25]. There are also the problems of relative quantification. Metabolite concentration levels are often expressed as a ratio, but changes in the metabolite level of a widely used denominator (PCr + Cr) have been observed [26, 27] and ideally absolute metabolite concentration levels should be obtained [28]. However, here too there are problems as it is unclear which of the many methods currently available is the most accurate and reliable.
Phosphorus-31 spectroscopy (31P-NMR)
Phosphorus-[31P] spectroscopy has been used for clinical research in psychiatry since its development. It quantifies the resonances of phosphomonoesters (PMEs), phosphodiesters (PDEs), inorganic orthophosphate (Pi), phosphocreatine (PCr) and the nucleoside adenosine triphosphate (ATP), producing a total of seven peaks in a typical spectrum, with three peaks corresponding to ATP. It therefore provides a means of directly assessing membrane phospholipids and high-energy metabolism [29] (see Table 2).
Phosphorus-31P-spectroscopy metabolites
Applications in psychiatry
Traditionally, the relationship between specific psychiatric disorders and associated brain changes has been thought to be monocausal because of historical observations stemming from a variety of investigations that demonstrated brain region specific neuronal abnormalities in psychiatric disorders. Neuroimaging, along with other investigative techniques, has changed this view to one of neuronal networks by implicating or revealing the involvement of more than one brain region in many psychiatric disorders and showing that these regions interact with each other in a complex and sophisticated manner [36]. Neuropsychiatric disorders are therefore thought to alter the brain's activities at multiple morphological levels – from the macroscopic (cortical, subcortical and regional) to the microscopic (neuronal, transmitter and receptor). Structural (CT, MRI) and functional (positron emission tomography, fMRI) neuroimaging have contributed significantly to the understanding of the pathophysiology of neuropsychiatric disorders. However, interpretations have been limited because until recently the in vivo neurochemistry of the brain was inaccessible for study. Magnetic resonance spectroscopy techniques have changed this and promise to add a new dimension to our understanding of neuropsychiatric disease. The principal findings of studies are discussed below according to phenotype, noting observations of clinical interest and research salience.
Schizophrenia
Cumulative evidence from several modes of study suggests that the pathophysiology of schizophrenia most likely involves corticostriatal and corticothalamic networks [37] with alterations occurring during brain development [38]. However, the neurochemistry of schizophrenia remains an enigma with almost every neurotransmitter being implicated at one time or another.
The neurodevelopmental hypothesis of schizophrenia is supported by the many MRS studies that have demonstrated diminished levels of NAA in frontal and temporal lobes of patients with schizophrenia, irrespective of treatment status [39–48]. The precise pathophysiological significance of this remains unclear, but since NAA is reduced after neuronal loss [14], it may be a reflection of temporal and frontal cortical volume loss because of metabolic changes or reduced numbers of synaptic neuropils [49, 50]. Compromised prefrontal cortex neuronal integrity could lead to increased limbic dopaminergic activity resulting in psychosis [51]. Indeed prefrontal cortical NAA has been shown to be associated with striatal dopamine concentration changes and as frontostriatal pathways are mediated by glutamate, NAA alterations may be the consequence of glutamatergic neurotransmission abnormalities [52, 53]. Of particular interest the same group has recently shown that antipsychotic drugs selectively increase dorsolateral prefrontal cortex NAA in patients with schizophrenia, suggesting regionally specific therapeutic action [54], however, a separate study has demonstrated reduced NAA in a different region of the brain, the mediodorsal thalamus [55].
Neurotransmitter changes can also arise because of neuronal cell membrane dysfunction, as membranes are essential for signal transduction, receptor function and ion conduction [56]. Studies of membrane metabolism in patients with schizophrenia have found a decrease in the ratio of PME/PDE that is localized to fronto-temporal brain regions [57, 58] suggestive of decreased synthesis and increased degradation of membrane phospholipids that is perhaps the result of increased phospholipase activity or diminished phosphodiesterase activity and precedes clinical manifestation of the illness [58–60]. This is consistent with the finding that young first-degree relatives of patients with schizophrenia also have similar membrane changes [61] and is in keeping with the theory of developmental arrest in which the observed changes may be an exaggeration of the normal synaptic pruning that occurs in late childhood and early adolescence. However, PMEs and PDEs do not consist solely of phospholipid precursors and breakdown products, and the observed changes in their concentrations in schizophrenia may have alternative explanations, such as alterations of neuronal membrane structure itself [62].
Other studies have reported changes in the concentrations of high-energy phosphate metabolites, cholinecontaining compounds and myoinositol, but the findings have been inconsistent because of variability of clinical methodology and MRS application [63, 64]. Clearly further studies are necessary and because the glutamate signal is difficult to resolve studies may have to use highfield MRS to enhance spectral resolution.
Summary
Magnetic resonance spectroscopy studies in schizophrenia have identified reduced levels of NAA in temporal, thalamic and prefrontal cortical regions of the brain and specific changes in neuronal membrane phosphate metabolism. Although none of the findings are diagnostic they are supportive of current aetiological models of the disorder and enhance understanding of its neurochemistry. Monitoring these changes over time with progression of the disease and in response to treatment may provide insights into its pathophysiology and perhaps lead to the development of novel treatments. Furthermore, just as the neuropsychological and neuroanatomic changes help characterize schizophrenia, MRS profiles may yield diagnostic categories of clinical or therapeutic relevance and provide a means of early detection and screening.
Affective Disorders
In comparison to the study of schizophrenia, the application of spectroscopy to research in affective disorders has been relatively limited perhaps partly because of the greater heterogeneity of mood disorders. Both unipolar and bipolar patients have been investigated for ‘neurochemical markers’ and the changes brought about by pharmacotherapy. A relatively consistent finding in depressed adults with either major depression or bipolar disorder has been an increase in the concentration of choline in the basal ganglia [65–67] and anterior cingulate [68]; structures that have been widely implicated in the generation and modulation of emotion by lesion, neuropsychological and neuroimaging studies [69].
Basal ganglia choline concentration has been found to vary with depression severity and is possibly state-dependent [70]. Indeed choline level changes are more pronounced in those who are responsive to selective-serotonin reuptake inhibitors (SSRIs), such as fluoxetine [71], and tend to normalize with suitable antidepressant treatment [72]. Choline concentration is also altered in the left orbitofrontal cortex of depressed adolescents [73] further supporting a pathophysiological role in depression for choline-containing compounds. However, these findings that associate regional changes of choline concentration with clinical status [74] are as yet tentative and along with studies examining the effects of pharmacotherapeutic agents await robust replication using fluorinated metabolite studies [70, 75].
Similar increases in membrane phospholipid metabolites are also observed in both medicated and unmedicated bipolar depressed patients [76–78]. [31P]-MRS studies have demonstrated elevations of PMEs in the frontal lobes of symptomatic unipolar [79] and bipolar patients [80, 81] along with changes in phosphocreatine [82, 83]. These increases of choline and PME measurements may in fact denote changes in phosphocholine or be the consequence of treatment with lithium, which inhibits choline transport and increases intracellular choline-containing compounds [84]. Phosphate metabolite changes point to the involvement of second messenger systems in the pathophysiology of bipolar disorders and several studies that have used lithium [7Li] spectroscopy to determine the relationship between brain lithium concentrations and therapeutic response, have demonstrated that the two are closely coupled [85–87]. However, the precise therapeutic effects of lithium remain unknown [88].
Proton spectroscopy studies of patients with bipolar disorder have revealed diminished dorsolateral prefrontal NAA [89] and creatine [90] concentrations, imputing decreased neuronal density or neuronal dysfunction and state dependent changes in metabolism. However, increased levels of thalamic NAA and creatine have been found in familial bipolar patients [91] suggesting that differential processes may be occurring between neuroanatomically connected regions. More recent studies of patients with affective disorders have shown significant reductions in the concentrations of cortical GABA [92] and anterior cingulate glutamate [93] and treatment studies, examining the metabolite changes before and after the administration of antidepressants [71] or ECT [94], have attempted to correlate biochemical and clinical parameters.
Summary
Increased levels of choline and PME are found in depressed patients with studies in bipolar disorder suggesting that these are perhaps state-dependent and can be modified by treatment [95]. Regionally specific changes in NAA and GABA have also been identified, in those with affective disorders, involving structures that are strongly implicated in the generation of emotion such as the anterior cingulate and prefrontal cortex. Clearly, these findings are preliminary and need replication, however, they are significant as they reflect membrane turnover and cellular metabolism upon which many essential neuronal functions such as neurotransmission and second messenger cascades are dependent. Furthermore these findings are important as they demonstrate both cortical and subcortical changes in brain neurochemistry that may prove useful state and/or trait markers of these disorders and perhaps serve as predictors of treatment response.
Dementia
Dementia has perhaps been the more extensively investigated neuropsychiatric illness with MRS. Proton spectroscopy in Alzheimer's disease (AD) has demonstrated distributed cortical NAA losses, verified using quantitative methods that control for regional atrophy. These replicated findings suggest cellular decrements in neuroviability, which may precede observable structural changes. Such changes are likely to have cognitive consequences since NAA levels correlate with cognitive ability in disease-free younger [96] and older [97] individuals.
Myo-inositol (mI) has been found significantly elevated, by about 20%, in grey matter samples of AD patients [98]. One study found that this change began in the posterior cingulate [99]. It perhaps reflects the interruption of mI conversion to inositol-triphosphate, which normally regulates the membrane lipid, phosphatidylinositol [100]. This can result in a wide range of functional consequences since inositol phosphates are important secondary messengers linking endoplasmic reticulum protein synthesis with cell membrane turnover [101]. Other hypotheses about mI elevation include gliosis, because astrocytes contain high concentrations of the metabolite [102], or as a cell toxin marker, since mI has detoxification properties in other parts of the body [103] and correlates significantly with postmortem neurofibrillary tangles [104]. Combining NAA and mI data has proven to be clinically useful for the prognosis of cognitive status at 1 year follow-up [105] and is beginning to show significant promise in automated diagnosis of AD [106, 107].
Phosphorous MRS of AD has delivered less consistent findings, possibly because of the competing systems of quantification that have been employed [98]. However, results suggest PME elevation early in the disease process, which later normalizes with dementia progression. The reverse occurs with PCr levels, which initially decline and then eventually normalize. The pathological basis of these changes is not understood, but they have been used for preclinical diagnosis in an individual who exhibited these early changes, in the absence of cognitive abnormalities and later developed AD [108]. More consistent evidence comes from in vitro studies that have demonstrated that PDE levels are highly correlated with Aβ plaque numbers [109], suggesting that this imaging modality may be suitable for monitoring disease progression and treatment response.
Less well studied dementia syndromes using MRS include Parkinson's disease [110], Huntington's disease [111], Vascular dementia [112], Frontotemporal dementia [113] and the AIDS dementia complex (ADC) [114]. In general, studies have found a region-specific pattern of NAA loss, in keeping with pathological change disrupting cellular neurometabolism. ADC studies are of particular interest because [1H]-MRS has been used to show rectification of the NAA signal after clinical treatment with Zidovudine [115]. The potential for MRS to monitor treatment efficacy in dementia, at the biochemical level, is an exciting one that requires further investigation.
Summary
Proton MRS in dementia is able to detect neural tissue that is ‘at risk’ identified by NAA depletion and mI elevation, with the latter possibly being more sensitive to intracellular toxic change. MRS neuroimaging may therefore aid initial diagnosis and improve prognosis and management by facilitating monitoring of disease progression and treatment [116]. Valuable information from phosphorous MRS includes cell membrane status and the level of Aβ infiltration derived from the PDE signal. Combining this information with risk factors such as ApoE may ultimately provide significant insight into an individual's susceptibility for dementia.
Anxiety disorders and post-traumatic stress disorder
The investigation of anxiety disorders using MRS is especially difficult, as the MRI environment is notoriously anxiogenic. However, several studies have been conducted investigating the neurochemical pathology associated with anxiety across a range of anxiety disorders.
An early study that examined the effect of lactateinduced panic demonstrated an association between increased insular cortical lactate concentration and induced panic [117]. The same group subsequently showed that treatment with fluoxetine abated panic symptoms but did not normalize the brain metabolic response with respect to lactate [118]. A recently published study has shown that panic disorder is associated with reductions in the levels of occipital cortical GABA, which is in keeping with preclinical and clinical evidence that implicates GABA in the pathophysiology of Panic Disorder. Anxiogenesis has been associated with deficits in GABA neuronal function and enhancement of GABA has been found to be anxiolytic [119].
Preliminary spectroscopy studies of patients with obsessive-compulsive disorder (OCD) also show little [120] or no change [121] in lenticular concentrations of NAA, Choline or Creatine. However, recent studies, measuring caudate nucleus glutamate and glutamine, found increased concentrations of these metabolites commensurate with symptom severity, which normalized after paroxetine treatment in line with clinical improvement [122].
In post-traumatic stress disorder (PTSD) anterior cingulate dysfunction has been implicated [123]. Supporting this is the finding that, in childhood PTSD, the concentration of NAA in the anterior cingulate is significantly lowered and that neuronal metabolism is altered [123].
Summary
Changes of metabolite concentrations, some of which seem to be reversible with treatment, support the view that anxiety disorders arise because of neurochemically mediated dysfunction. These alterations may serve as markers of disease or as indicators of treatment-response and clearly warrant further investigation.
Alcoholism
Both proton and phosphorus spectroscopy have been used to examine chronic alcohol abuse. However, relatively few studies have been conducted, and the findings are somewhat disparate, limiting the inferences that can be made. Reported findings include reduced occipital GABA [124] and cerebellar choline [125], and cortical white matter changes (PDE and phosphocreatine) that result from phospholipid damage [126, 127] because of decreased brain energy metabolism [128]. A significant reduction in frontal white matter NAA is found in alcoholics that may be the consequence of neuronal loss or dysfunction in the metabolism of NAA [129]. However, axonal damage or destruction can also occur secondary to glutamate-mediated excitotoxicity during alcohol withdrawal, which may lead to frontal-lobe specific NAA reductions.
Summary
It is well established that chronic severe alcohol abuse leads to significant brain damage, however, early identification of this process when the tissue changes are subtle would be of greater clinical use. Spectroscopy may therefore provide useful insights in terms of understanding the mechanisms of alcoholic brain damage and may provide a means of early detection and/or monitoring. Indeed, the ability to directly measure brain alcohol, using MRS, is a recent development that is likely to lead to a better understanding of the pharmacokinetics of alcohol and its long-term effects on brain tissue [130].
Conclusion
The brain's inaccessibility limits its in vivo neurochemical assessment. Magnetic resonance spectroscopy has successfully negotiated this difficulty and enabled direct chemical examination of the tissues of the brain, such that, it is now being used to address key questions in neuropsychiatric research. However, phenotypic heterogeneity and technical limitations mean that its clinical applications remain relatively few.
It is hoped that further advances in technology and computing will lead to more sensitive and reliable methods of metabolite quantification and localization, and perhaps increase the number of compounds, in particular neurotransmitters, that can be detected using spectroscopy. Indeed, already MRS is being used to probe the pathophysiology and psychopharmacology of many neuropsychiatric disorders and it is possible that, in the near future, such ‘chemical sampling’ will generate means of classifying psychiatric disease on neurochemical grounds. Furthermore, spectroscopy may permit the analysis of immediate and long-term pharmacotherapeutic interventions and eventually uncover means of diagnosing disorders at a preclinical stage.
However, to achieve these ambitious goals, in addition to further technological refinement, the technique needs to be applied to pristine patient populations that are diagnostically distinct and ideally medication-free. Clearly, MRS is a promising investigational tool that raises many exciting possibilities in the research of neuropsychiatric disorders and its full clinical potential is only beginning to be realized.
Footnotes
Acknowledgements
We sincerely thank Zora Vuckovic, Anne-Maree Austen and other members of the Mood Disorders Unit for their assistance. Supported by a National Health and Medical Research Council Program Grant (993208), a NSW Department of Health Infrastructure Grant and an Australian Rotary Health Research Fund Grant.