
Abstract
Infection is a risk factor for adult stroke and neonatal encephalopathy. We investigated whether exposure to bacterial endotoxin increases hypoxia-induced brain cell death and impairs cerebral metabolic compensatory responses to hypoxia. Prehatching chicken embryos (incubation day 19) were exposed to bacterial lipopolysaccharide (LPS) (3 mg Salmonella typhimurium LPS per egg) or hypoxia (4% ambient O2 for 1 h), alone or in combination with LPS, followed 4 h later by hypoxia. Cerebral cell death and glial activation were assessed histologically. Further, chicken embryo brains were studied by magnetic resonance imaging (MRI) and spectroscopy (MRS) to assess haemodynamic and metabolic responses. In most brain areas, combined LPS/hypoxia resulted in a 30- to 100-fold increase in terminal deoxynucleotidyl transferase dUTP nick end labelling -positive cells, compared to control and single-insult groups. Glial activation correlated with the severity of cell death and was significantly greater in the combined-insult group (P<0.05). Hypoxia was associated with a 10-fold increase in lactate/N-acetyl-aspartate (NAA), an ˜20% increase in total creatine/NAA, rapid decreases in T2 and T2+, and a reduction in direction-averaged brain-water diffusion (Dav) by ˜15%. Liposaccharide pretreatment did not alter the magnitude or timing of these responses, but engendered baseline shifts (increased Cho/NAA, Cr/NAA, and Dav, and reduced T2+). In conclusion, LPS greatly increased hypoxia-induced brain damage in this model and induced changes in baseline haemodynamics and metabolism but did not affect the magnitude of the glycolytic response to hypoxia. The damage-enhancing effects of LPS are not because of additional energy depletion but because of a synergistic toxic component.
Introduction
Intrapartum fetal cerebral hypoxia-ischaemia (HI) can lead to perinatal brain injury; however, because of effective fetal metabolic and haemodynamic compensatory mechanisms, HI is not usually the sole cause of such injury (Badawi et al, 1998). Epidemiological data suggest that both adult stroke and neonatal encephalopathy are more likely with infection: chorioamnionitis, maternal pyrexia, and viral illness are associated with increased risk of neonatal encephalopathy and consequent cerebral palsy, and pyrexia is also a stroke risk factor (Grau et al, 1998). While infection alone can cause brain injury, particularly in the preterm fetus, an additional possibility is that an inflammatory stimulus reduces the threshold at which HI initiates the cascade of events leading to brain injury (Peebles and Wyatt, 2002). Epidemiological data support this concept: combined antenatal infection and birth asphyxia are associated with a higher risk of neonatal encephalopathy than either factor alone (Nelson and Grether, 1998). Studies in neonatal rodents have shown a synergistic interaction between systemic inflammation, induced by endotoxin, and hypoxic-ischaemic brain injury (Coumans et al, 2003; Eklind et al, 2001; Yang et al, 2004; Lehnardt et al, 2003), with cortical regions being particularly vulnerable.
The mechanisms underlying the synergistic interaction between HI and inflammation remain unclear. Endotoxin causes hypoglycaemia in the neonatal rat, which could impair the glycolytic response to hypoxia (Eklind et al, 2004), while in glial/neuronal cultures endotoxin impairs oxidative phosphorylation by inducing astrocytic nitric oxide release and reversible blockade of cytochrome oxidase (Mander et al, 2005).
We have previously reported the use of magnetic resonance imaging and spectroscopy (MRI and MRS) to quantify the metabolic and haemodynamic responses to acute hypoxia of chicken embryo brain before hatching (Peebles et al, 2003a; Dixon et al, 2005). In particular, it was possible to (1) obtain good-quality proton (1H) MRS data and assess glycolysis via the lactate (Lac) peak, (2) measure the brain-water apparent diffusion coefficient (ADC), which is an indirect marker of high-energy phosphate metabolism (Thornton et al, 1998), and (3) measure the brain-water transverse and effective transverse relaxation times (T2 and T2+ respectively—the latter includes the influence of time-invariant local magnetic field inhomogeneities). Both T2 and T2+ are altered by tissue oxygenation and perfusion via blood oxygenation level-dependent contrast (Ogawa et al, 1993). We chose to study chicken embryos because (1) the physiological response to hypoxia is markedly similar to that of the mammalian fetus (Mulder et al, 1998, 2000; van Golde et al, 1997), (2) the brain is relatively large, (3) responses to physiological intervention can be studied without maternal modulation, thereby allowing precise experimental condition specification, and (4) good-quality magnetic resonance images and spectra can be acquired in ovo. We chose an antenatal surrogate (as in the mammalian fetus, the chicken embryo is relatively hypoxic before hatching) and a global hypoxic insult, in contrast to previous studies using air-breathing neonates/adults and combined hypoxia and ischaemia (Eklind et al, 2001; Ahmed et al, 2000; Dawson et al 1999; Tasaki et al, 1997). We also started hypoxia 4 h after lipopolysaccharide (LPS), administration as previous neonatal studies and our neonatal murine data (unpublished) show that this delay worsens hypoxic brain injury (Coumans et al, 2003; Eklind et al, 2001; Yang et al, 2004; Lehnardt et al, 2003). However, in both neonatal and adult rodent studies, a longer delay (24 h) attenuated brain damage (Eklind et al, 2005).
The aims of this study in chicken embryo brains in ovo were to (1) investigate whether cell death was greater after combined bacterial endotoxin and transient hypoxia than with either factor alone, and (2) determine whether endotoxin altered metabolic and haemodynamic responses to acute hypoxia. Specifically, we hypothesized that, compared with hypoxia-alone, endotoxin pretreatment would lead to a greater decrease in ADC during hypoxia, indicating more severe cellular energy depletion (even lower adenosine triphosphate (ATP) concentration), and cause a larger increase in Lac, suggesting greater impairment of oxidative phosphorylation and consequently further reliance on glycolytic energy generation.
Materials and methods
Chicken Embryo Incubation, Endotoxin, and Hypoxia
Fresh fertilized white Leghorn eggs (Lohmann, Hyline or Bovans strains, acquired from Henry Stewart and Co. Ltd, Louth, UK) were incubated at 38.7°C and 63% humidity (Polyhatch, Brinsea, UK). Studies were performed in accordance with the UK Animal Act 1988 under Animal Project licence 70/5341. To assess associations between endotoxin dose, hypoxia level, and chicken mortality, chicken embryos on incubation day 19 were exposed to lipopolysaccharide (LPS; Sigma Aldrich, Gillingham, UK), from Salmonella typhimurium (STM, L7261) or Escherichia coli (EC, 055:B5 serotype, L4005) at doses of 1, 3, 6, or 10 mg per egg in 0.4 mL isotonic saline, 4 h before hypoxia (1%, 2%, 4%, or 8% O2 in the ambient air/nitrogen mix for 1 h) or normoxia, both individually and in combination. Numbers of embryos for each investigative condition are given in Results. Injection of saline alone served as control. Saline alone, or LPS and saline were injected into the albumin, 3 mm under the chorioallantoic membrane, avoiding major blood vessels.
Histology Studies
Study Groups: On incubation day 19, chicken embryos were randomized to four groups: combined insult (LPS/hypoxia; 3mg LPS + 1h of 4% O2, n = 23), hypoxia-alone (1h of 4% O2, n = 18), LPS alone (3 mg LPS, n = 14), or controls (n = 15). These experimental conditions were selected on the basis of dose-response studies with mortality as an outcome (see Results). Embryos were killed at 12, 24, or 48 h after hypoxia and perfusion-fixed in 4% paraformaldehyde. Brains were extracted and stored at −80°C. Coronal sections (20 μm thick) were made at −20°C using a cryostat (Leica, Wetzlar, Germany).
Sections were stained for nuclear DNA fragmentation with terminal deoxynucleotidyl transferase (TdT) dUTP nick end labelling (TUNEL) following the protocol of Gavrieli et al (1992) with some adjustments. Sections were fixed to the gelatine-coated slides with 4% formaldehyde/phosphate buffer (PB) for 5 min, treated with 3% H2O2/methanol for 15 min, washed once in PB, defatted with 50% acetone/H2O, then 100% acetone, then 50% acetone/H2O again, washed twice in PB, and finally treated with 0.1% bovine serum albumin (BSA)/PB for 2 min. Tissue sections were subjected to 2 h incubation at 37°C with TdT solution (which contained 400U/mL recombinant TdT; Roche Products Ltd, Welwyn Garden City, UK), 7.5 μmol/L dUTP-biotinylated (Roche Products Ltd), and cacodylate buffer (made up of 3 mmol/L Tris hydroxymethylaminoethane, 187 mmol/L cacodylate sodium and, 1 mmol/L CoCl2). The TdT reaction was terminated by TUNEL stop solution, made up of 300 mmol/L sodium chloride and 30 mmol/L sodium citrate, washed well with PB, and then incubated for 1 h with avidin biotinylated horseradish peroxidase complex (ABC) reagent (Vector Laboratories, Peterborough, UK) in PB, washed with PB and visualized with diaminobenzidine (DAB, 1.388 mmol/L) with 88.9 mmol/L CoCl2 and 84.1 mmol/L NiS04 and H2O2. The sections were then washed in distilled water, dehydrated in graded alcohol and Xylene, and mounted with Depex (Fluka, Basel, Switzerland).
The study group was masked to quantification of nuclear DNA fragmentation. Two consecutive sections at the same level on both sides of each brain were assessed. Cells with TUNEL-positive nuclei were counted under light microscopy (× 40) in 10 brain regions—hippocampus, parahippocampal area, hyperstriatum ventrale, piriform cortex, dorsal lateral cortex, thalamus, striatum, cerebellum, stratum griseum paraventriculare, and stratum griseum centrale (one visual field per region, same intraregion visual field location when regions were larger than the visual field).
Immunocytochemical Labelling of Microglial Activation and Astrocytosis: Tissue sections were fixed and defatted as described above. For microglial labelling, tissue sections were briefly treated with BSA and left overnight at 4°C in biotinylated ricinus communis agglutinin 1 solution (RCA1; Vector Laboratories; 1:20,000 v/v in BSA). The next day, tissue sections were incubated for 1h with ABC reagent in PB, washed with PB, and visualized with diaminobenzidine and H2O2. For glial fibrillary acidic protein labelling, tissue sections were pretreated with goat serum, washed with BSA, and left overnight at 4°C in reaction with rabbit anti-cow glial fibrillary acidic protein monoclonal antibody solution (1:6,400, v/v in BSA DAKO, Glostrup, Denmark). A secondary antibody (1:100 v/v goat anti-rabbit) was diluted in chicken serum and then applied. Reaction products were incubated for 1 h with ABC reagent in PB and visualized with diaminobenzidine and H2O2. Staining intensity was visualized using a light microscope.
Microglial activation and astrocytosis were quantified (Kendall et al, 2006) by an operator (XW) masked to study group. For the former, score 0 indicated no activation, 1 mild activation with some deramified microglia; 2, diffuse activation and some phagocytes; and 3, diffuse phagocytes present. Similarly, for astrocytosis, score 0 indicated no astrocyte staining; 1, few astrocytes and weak staining intensity; 2, a moderate number of astrocytes and moderate staining intensity; and 3, diffuse astrocytes and strong staining intensity.
MRI and MRS Studies
Chicken Embryos: A separate batch of eggs was used because 50% mortality over 24 h (see Results) powered this study to detect MRI and MRS differences at 2 h but not histological differences at 24 h.
On incubation day 19, embryos were randomized to groups LPS/hypoxia (n = 9) or hypoxia-alone (n = 10) group. The effect of LPS alone (at ˜4h after injection) was obtained from the examination of baseline differences between groups in MRI/MRS measures. Experimental protocols were identical to those for the corresponding histological groups except that embryos were immobilized with a neuromuscular blocker (tubocurarine; 0.5 mg per embryo in 125 μL of double-distilled H2O) and hypoxia was induced in the magnetic resonance spectrometer. Immobility is important to optimize MRI and MRS quality; tubocurarine was chosen, as anaesthetic agents are neuroprotective (Kitano et al, 2007). At this stage of embryonic development, respiration is via passive O2 and CO2 diffusion through chorioallantoic blood vessels and unimpaired by muscle paralysis. To confirm that MRI and MRS results could be compared with histology, a control study assessed whether tubocurarine influenced histological outcome of the LPS/hypoxia protocol (see Results).
Preparation: Images and spectra were obtained using a 7 T Biospec (Bruker BioSpin, Karlsruhe, Germany) with a 12-cm diameter (available) horizontal bore. Brain position was determined from whole-egg images using an elliptical surface coil (6.5 × 5.5 cm). A miniature hot-water bottle maintained egg temperature for the short period necessary to obtain three orthogonal images. After brain localization, a thermocouple thermometer was inserted via a small hole in the eggshell over the airspace. The egg was placed in a plastic bag with positive-pressure gas flow for peri-ovo environment control, in particular oxygenation and temperature (38.5°C). The brain was centred over a 2.5-cm-diameter circular surface coil. Plastic bag gas mix was warmed via a heat exchanger. The plastic bag and magnetic resonance surface coil were located in a pod also supplied with warmed air. This arrangement ensured a stable peri-ovo temperature.
MRI and MRS measurements were made before and approximately every 15 min both during hypoxia and for 2 h thereafter with the particular aim of characterizing the acute-hypoxia response. There were four cycles of MRS and MRI during hypoxia, but typically the final MRS measurement was just after the hypoxia period. The order of measurements in each cycle was T2+, T2, and diffusion MRI, then 1H MRS.
MRS Acquisition: 1H spectra were obtained from a 4 mm cubic voxel centred within brain using point-resolved spectroscopy (PRESS). To optimize rapid measurement of Lac and other metabolites, we used echo time (TE) 135 ms, repetition time (TR) 2 s, and 128 summed echoes. Metabolite signal-amplitude ratios involving choline-containing compounds (Cho), total creatine (Cr; i.e., including phosphocreatine (PCr)), N-acetylaspartate (NAA; including a small contribution from N-acetylaspartylglutamate), and Lac were derived using LC model (Provencher, 2001). MRI Acquisition: All imaging used a single slice (typically coronal; see Figure 1) containing forebrain, cerebellum, and optic tectum. It was not always possible to image the same brain anatomy because of variable head orientation in ovo.
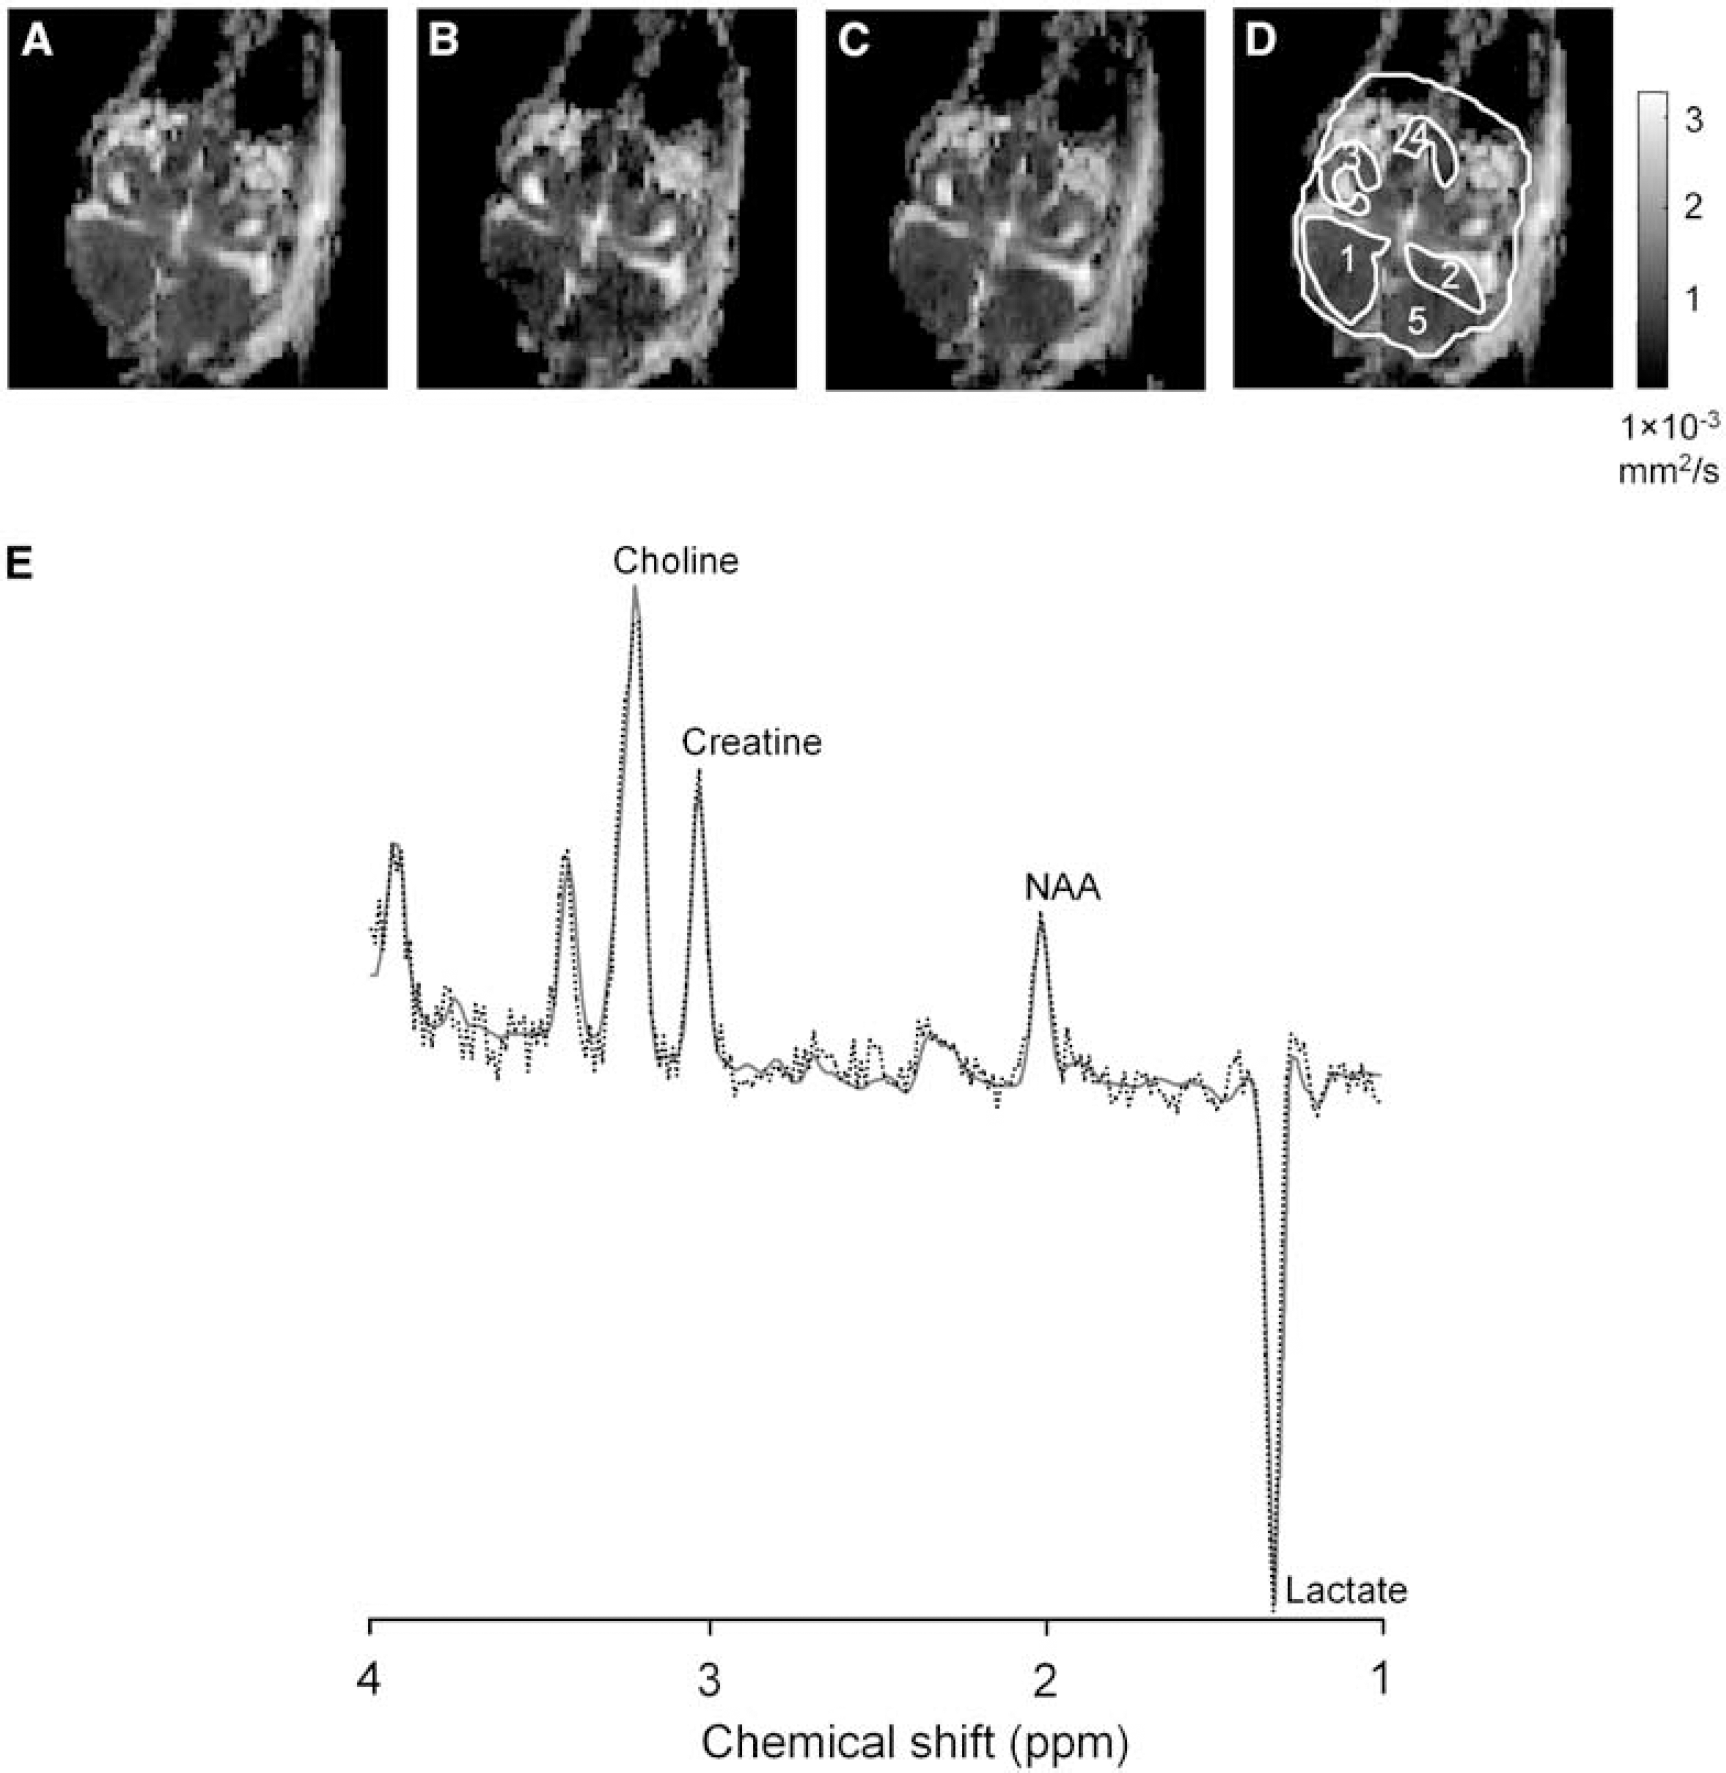
Representative Dav maps of LPS-preconditioned chicken embryo brain with 273 μm in-plane resolution (
MRI/S results
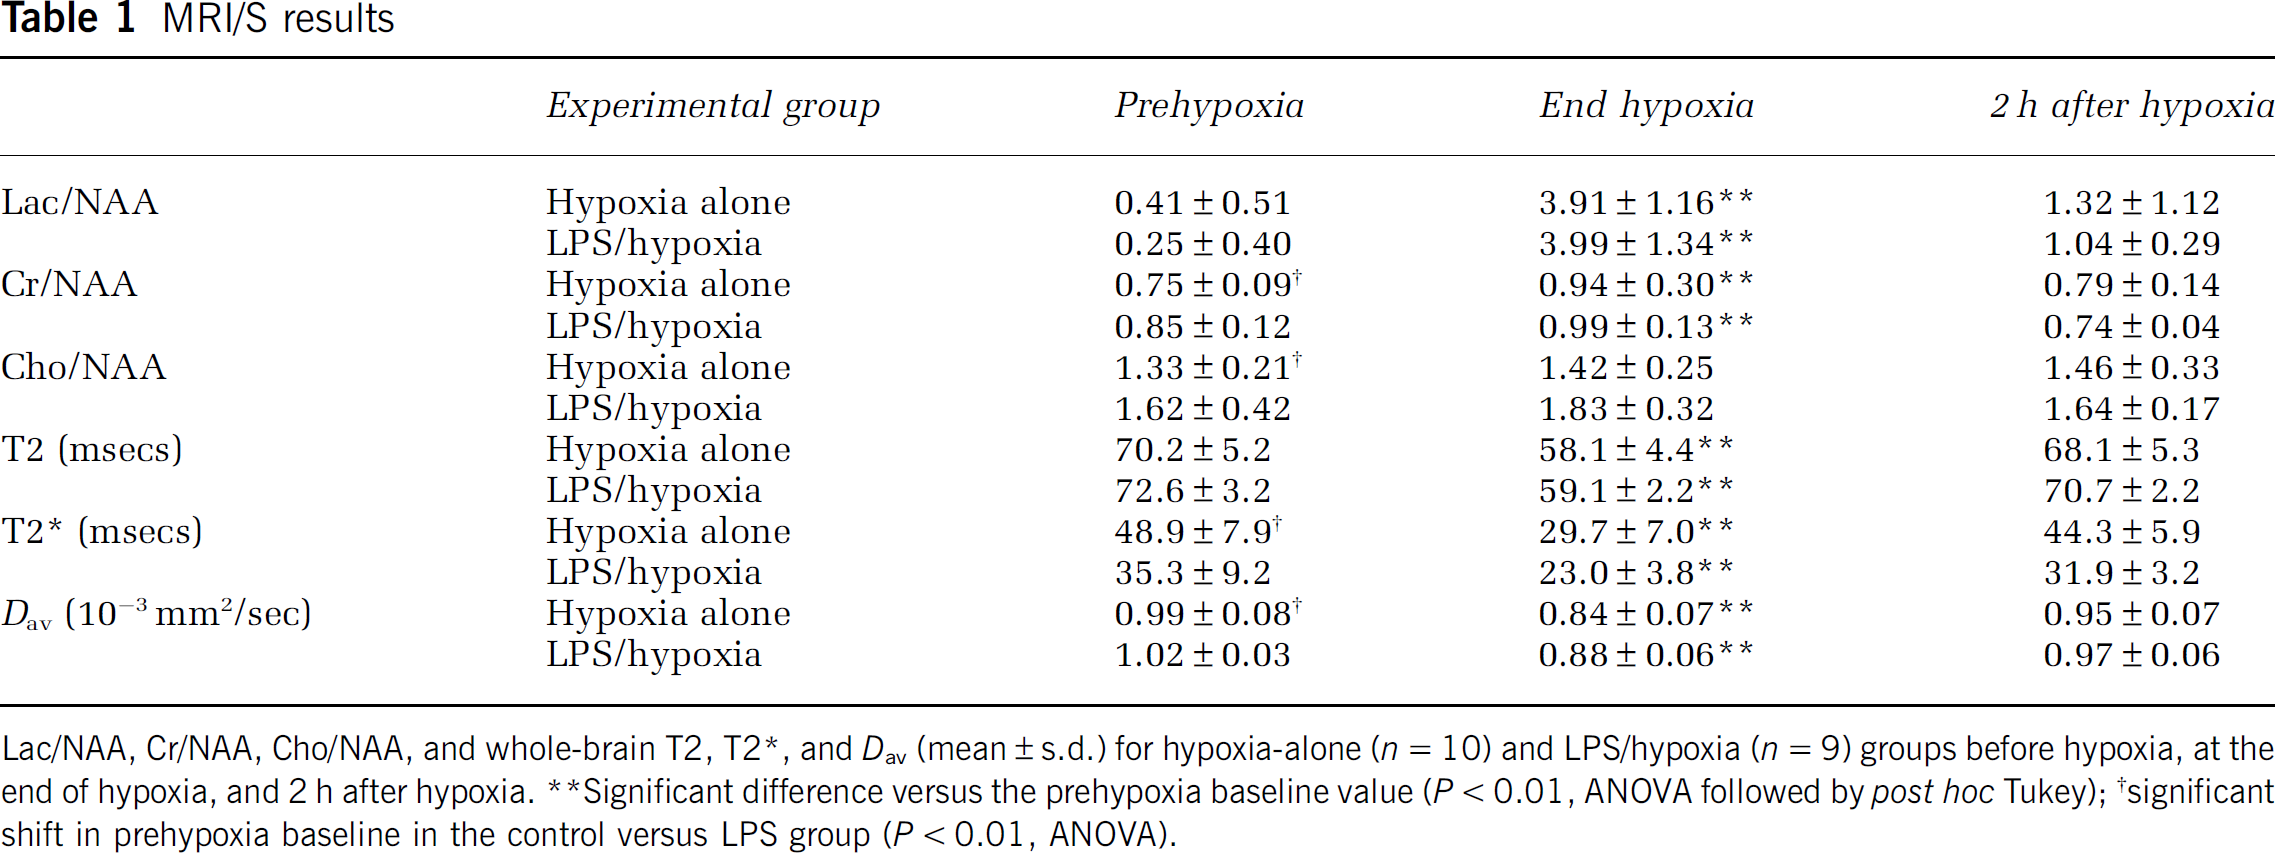
Lac/NAA, Cr/NAA, Cho/NAA, and whole-brain T2, T2 *, and Dav (mean ± s.d.) for hypoxia-alone (n = 10) and LPS/hypoxia (n = 9) groups before hypoxia, at the end of hypoxia, and 2 h after hypoxia.
Significant difference versus the prehypoxia baseline value (P < 0.01, ANOVA followed by post hoc Tu key)
Significant shift in prehypoxia baseline in the control versus LPS group (P < 0.01, ANOVA).
Quantitative ADC maps were calculated by echo-planar imaging images: TR 2.5s, TE 119ms, field of view 35 × 35 mm, 1mm slice thickness, and 128 × 128 matrix; obtained without diffusion weighting (12 averages) and with high diffusion weighting (b 875 sees/mm2, 30 averages). Diffusion weighting was applied successively in three orthogonal directions (x, y, and z). For every pixel, ADC was calculated for each diffusion-weighting direction using a linear fit to log (signal intensity) with and without diffusion weighting. Maps of 1/3 trace ADC (Dav) were calculated giving isotropic ADC measurements (see Figure 1).
Data Reduction and Statistical Analysis
Histology results were analysed by comparing results from the LPS/hypoxia, hypoxia-alone, LPS alone, and control groups using analysis of variance (ANOVA) followed by a post hoc Tukey test. For relationships between cell death stained with TUNEL and microglial activation or astrocytosis, correlation coefficients were calculated with Microsoft Excel.
For each MRI and MRS cycle, LPS/hypoxia and hypoxia-alone results were compared. On the Dav, T2, and T2+ maps, regions of interest (ROI) were defined covering the whole brain and within forebrain, optic tectum, and cerebellum (Figure 1D). For the whole-brain ROI, cerebro spinal fluid (CSF) was automatically excluded by thresholding image signal intensity. For each ROI, Dav, T2, and T2+ means were calculated. MRI and MRS results were tested for the global effects of time. If a significant time effect was established, a post hoc Tukey test was used to ascertain which individual time points showed a significant response (taken over both groups). The effect of LPS was tested at baseline, and during and after hypoxia using multifactor ANOVA. Thus, a baseline difference represents a consistent difference between groups through all the time points, whereas a difference in response is seen by a statistically significant difference (in absolute values) between groups when baseline differences have been accounted for.
In the control tubocurarine study, Student's t-test was used (two-tailed with equal variance). Significance was assumed for P<0.05. Results are mean ± s.d. unless stated otherwise.
Results
Dependence of Embryo Mortality on LPS Dose and Level of Hypoxia
A pilot study determined the appropriate combined LPS and hypoxia insult severity (see Materials and methods). Chicken embryos were much more sensitive to STM than EC LPS (higher mortality rates at equivalent doses) and this was therefore used throughout the following histology and magnetic resonance studies. Overall, peak mortality occurred between 12 and 24 h after injection of endotoxin and/or hypoxia. There was very little mortality in the first 12 h, or between 24 and 48 h (Figures 2A to 2C).
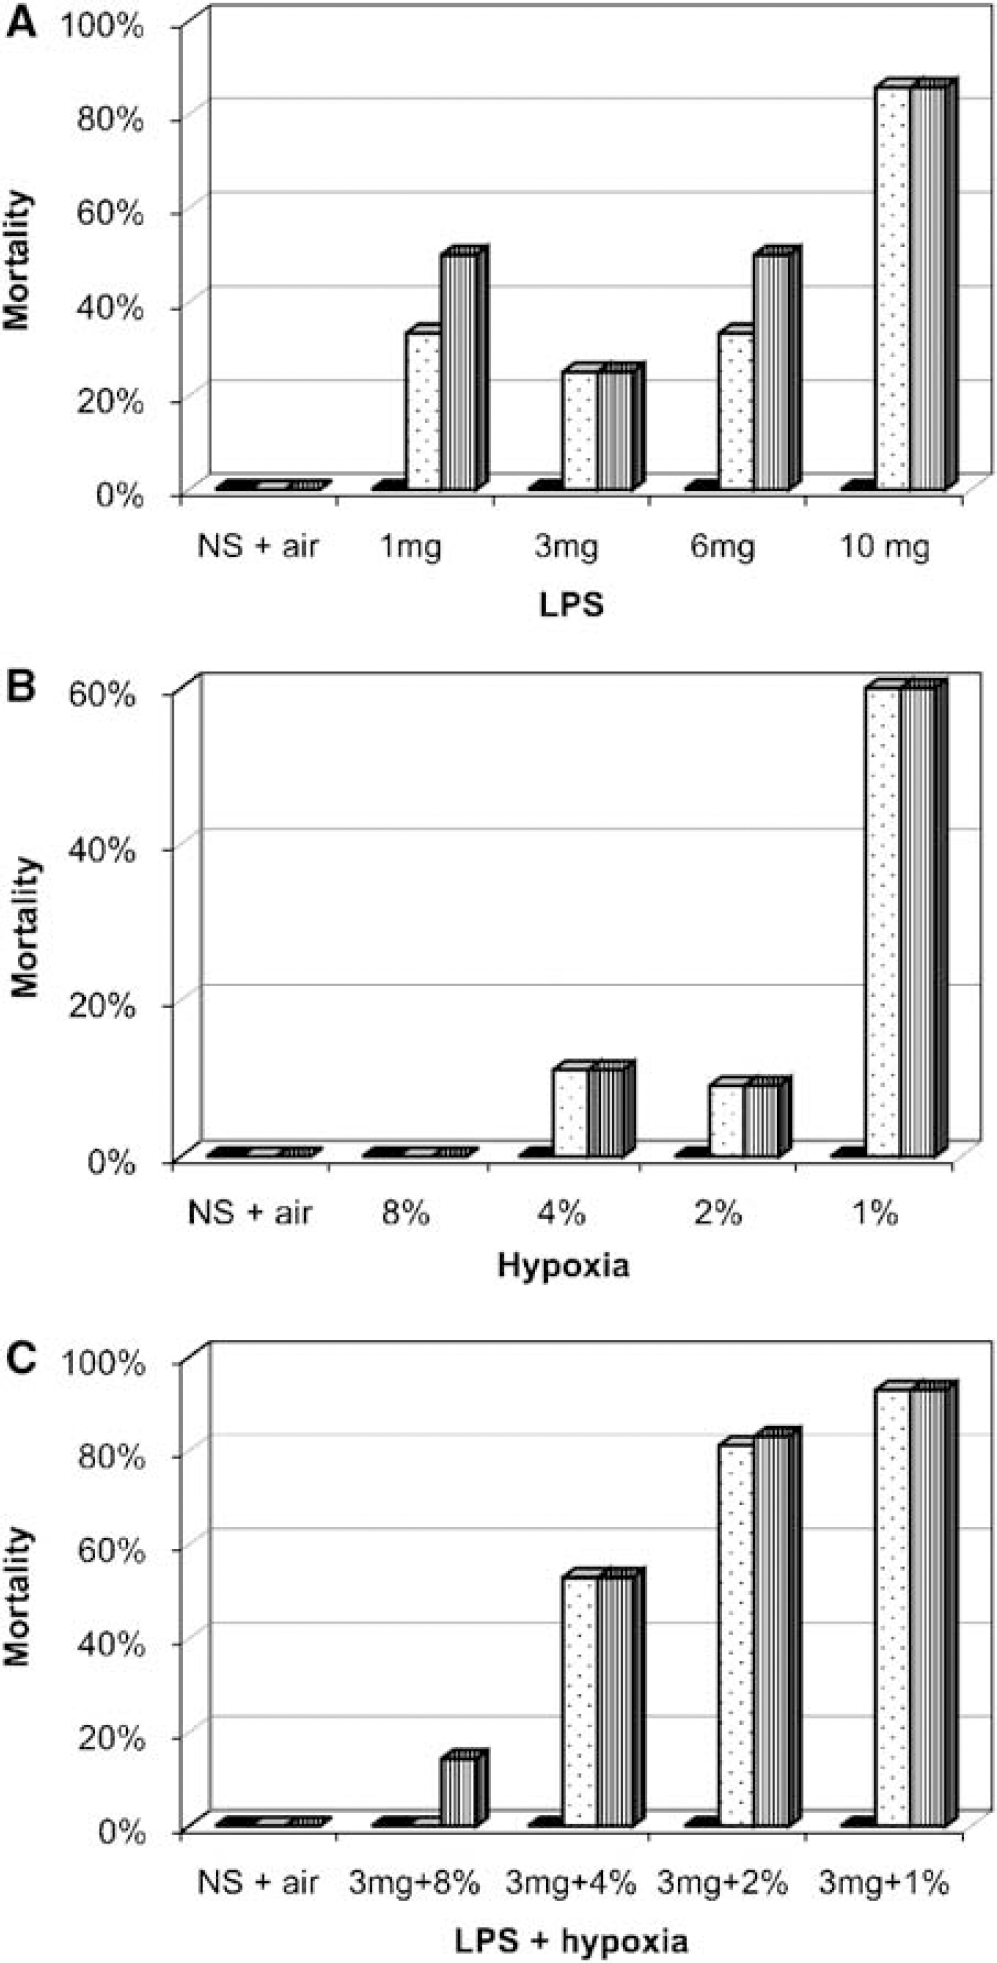
Embryo mortality at 12 h (black), 24 h (dotted), and 48 h (vertical lines); (
Mortality at 24 h with STM LPS alone was already 25% to 33%, at 1 mg LPS per egg (dead/total = 2/6), 3mg per egg (2/8) and 6mg per egg (2/6), rising to 86% (6/7) at 10 mg per egg (Figure 2A). Embryos were comparatively resilient to hypoxia-alone: after 24 h, none had died after 1h of 8% O2 (0/5), only 11% (1/9) after 4% O2, and 9% (1/11) after 2% O2, but rising to 60% (3/5) after 1% O2 (Figure 2B). However, when a moderate LPS dose (3 mg per egg) was combined with hypoxia (8%, 4%, 2%, or 1% O2 for 1 h), 24-h mortality rates increased compared with LPS or hypoxia-alone, with 0% (0/7), 53% (9/17), 81% (43/53), and 93% (13/14), respectively (Figure 2C). Based on these data, and the requirement for a robust model with an acceptable level of mortality, insult conditions of 3 mg LPS per egg and 4% O2 for 1 h (associated with approximately 50% mortality at 24 h) were used throughout this study for the LPS/hypoxia and LPS-alone groups.
Histology and Cerebral Cell Death
Nuclear DNA fragmentation was assessed with routine TUNEL histochemistry providing a marker of cell death. Compared with controls, in embryos surviving combined LPS and hypoxia, there was a very significant increase, by a factor of 30 to 100, in the number of TUNEL-positive nuclei in most brain regions at 12 and 24h after hypoxia (P < 0.05, one-way ANOVA followed by post hoc Tukey; Figures 3A to 3C and 4). This increase was consistently found in the hippocampus, the parahippocampal area, hyperstriatum ventrale, piriform cortex, dorsal lateral cortex, stratum griseum paraventriculare, stratum griseum centrale, and cerebellum. Striatum and thalamus were the exceptions, showing relatively high levels of TUNEL-positive nuclei, even in the untreated controls, without a significant increase after combined LPS/hypoxia.
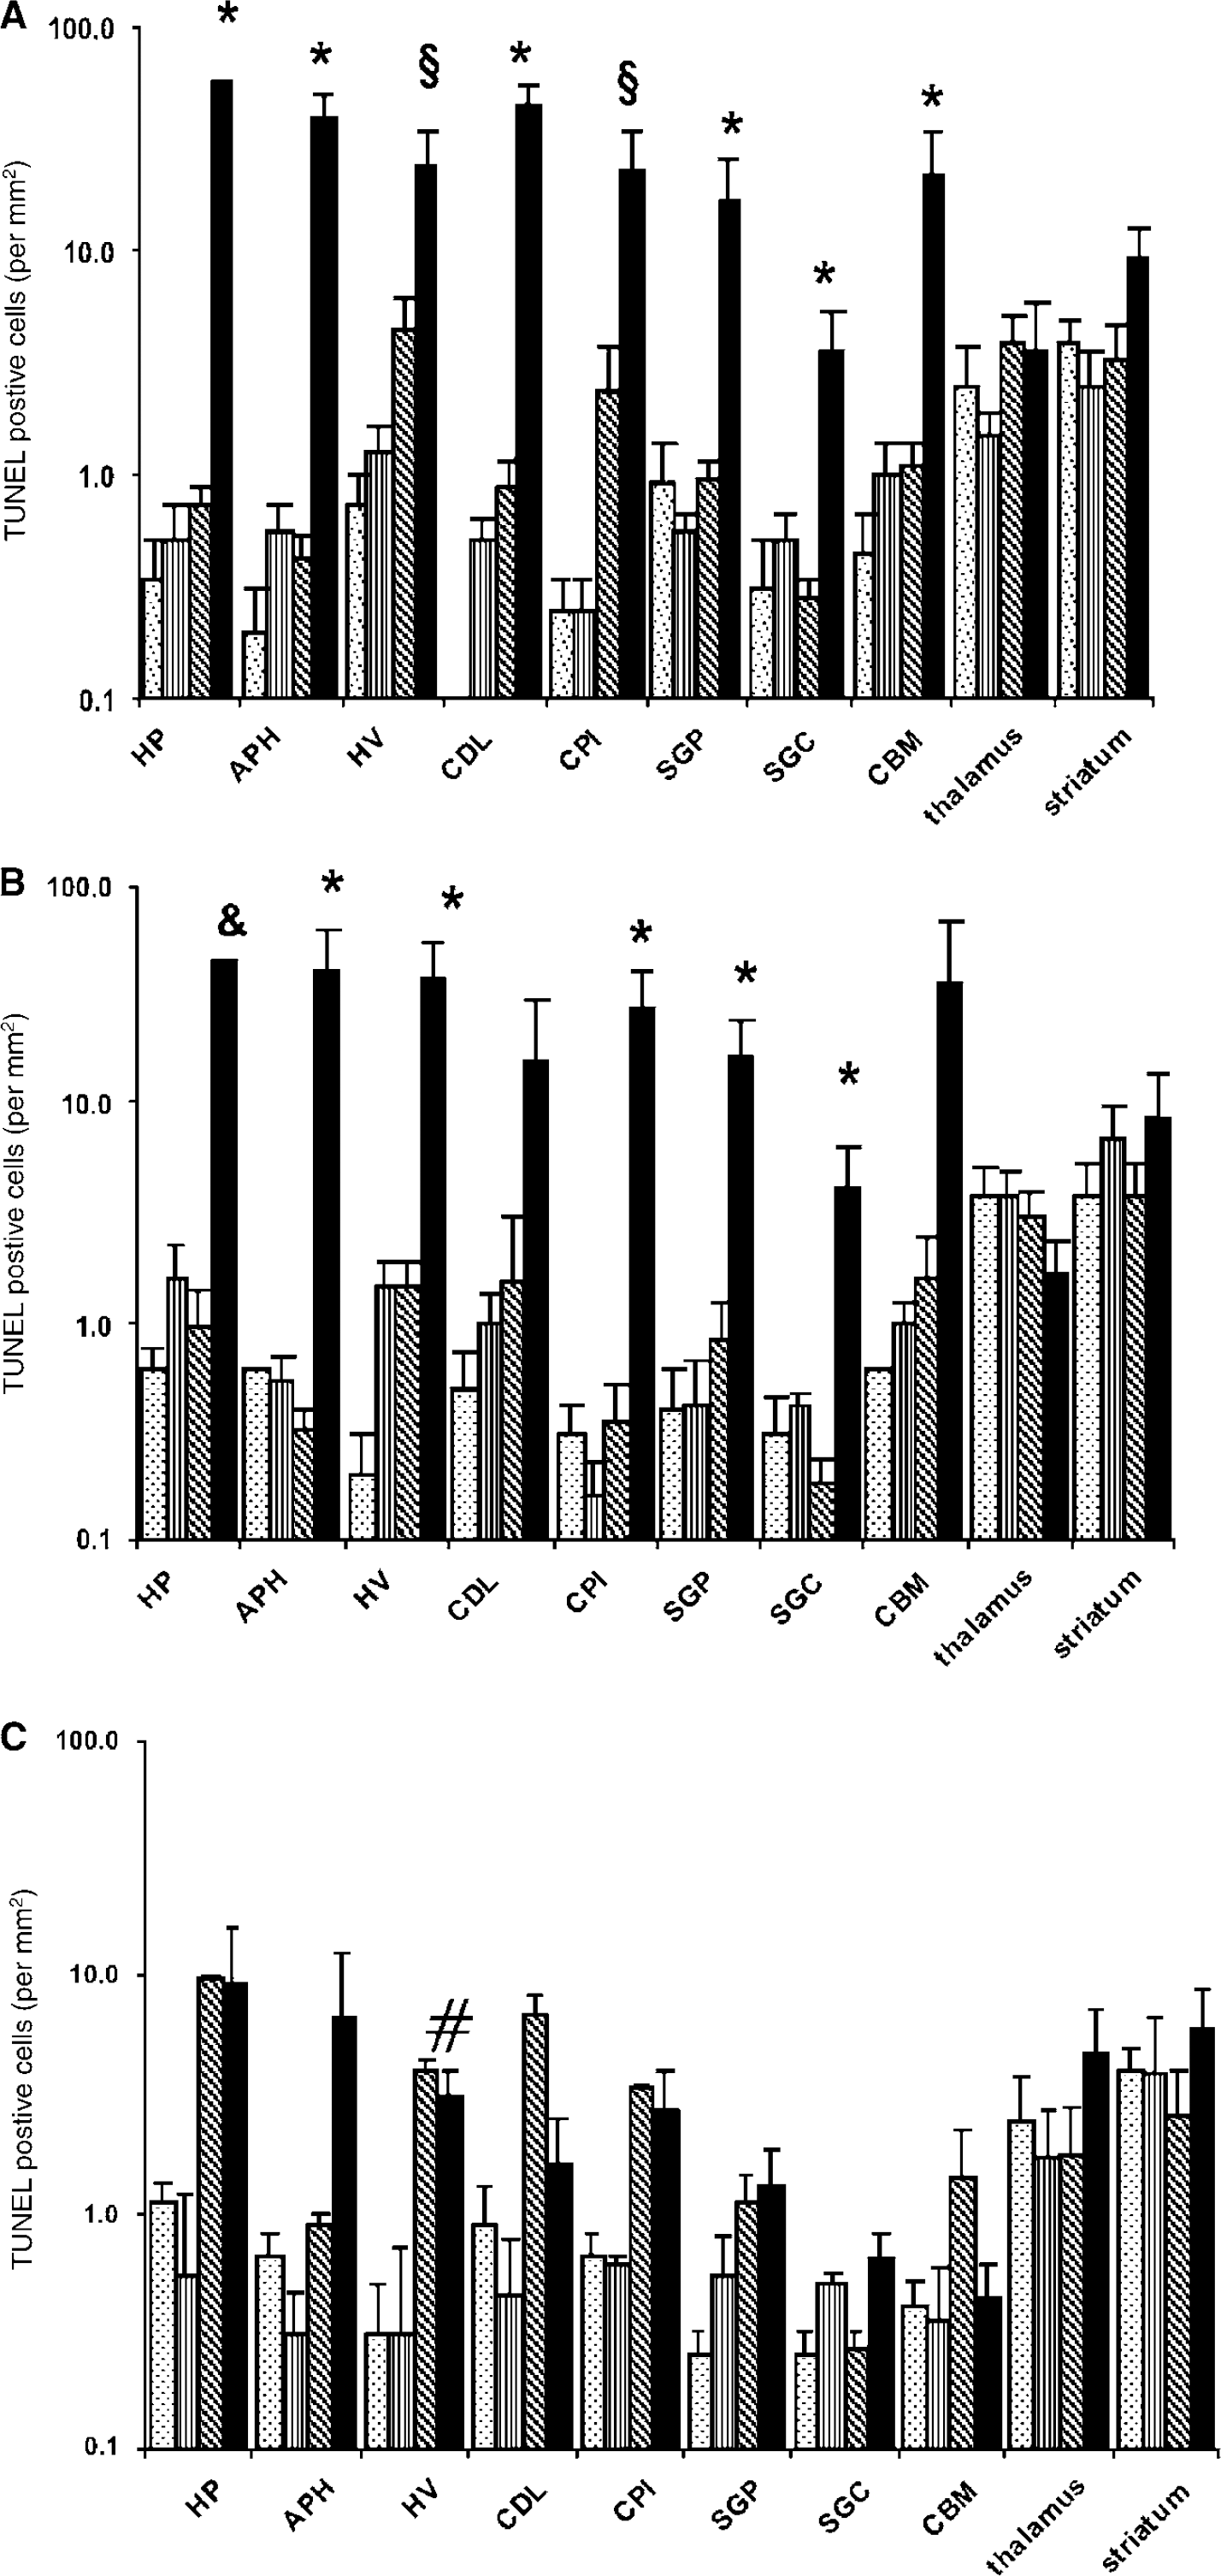
Cell death for different insults (number of TUNEL-positive cells/mm2 of the histological visual field; mean ± s.e.m.; log scaled) at 12, 24, and 48h after hypoxia (
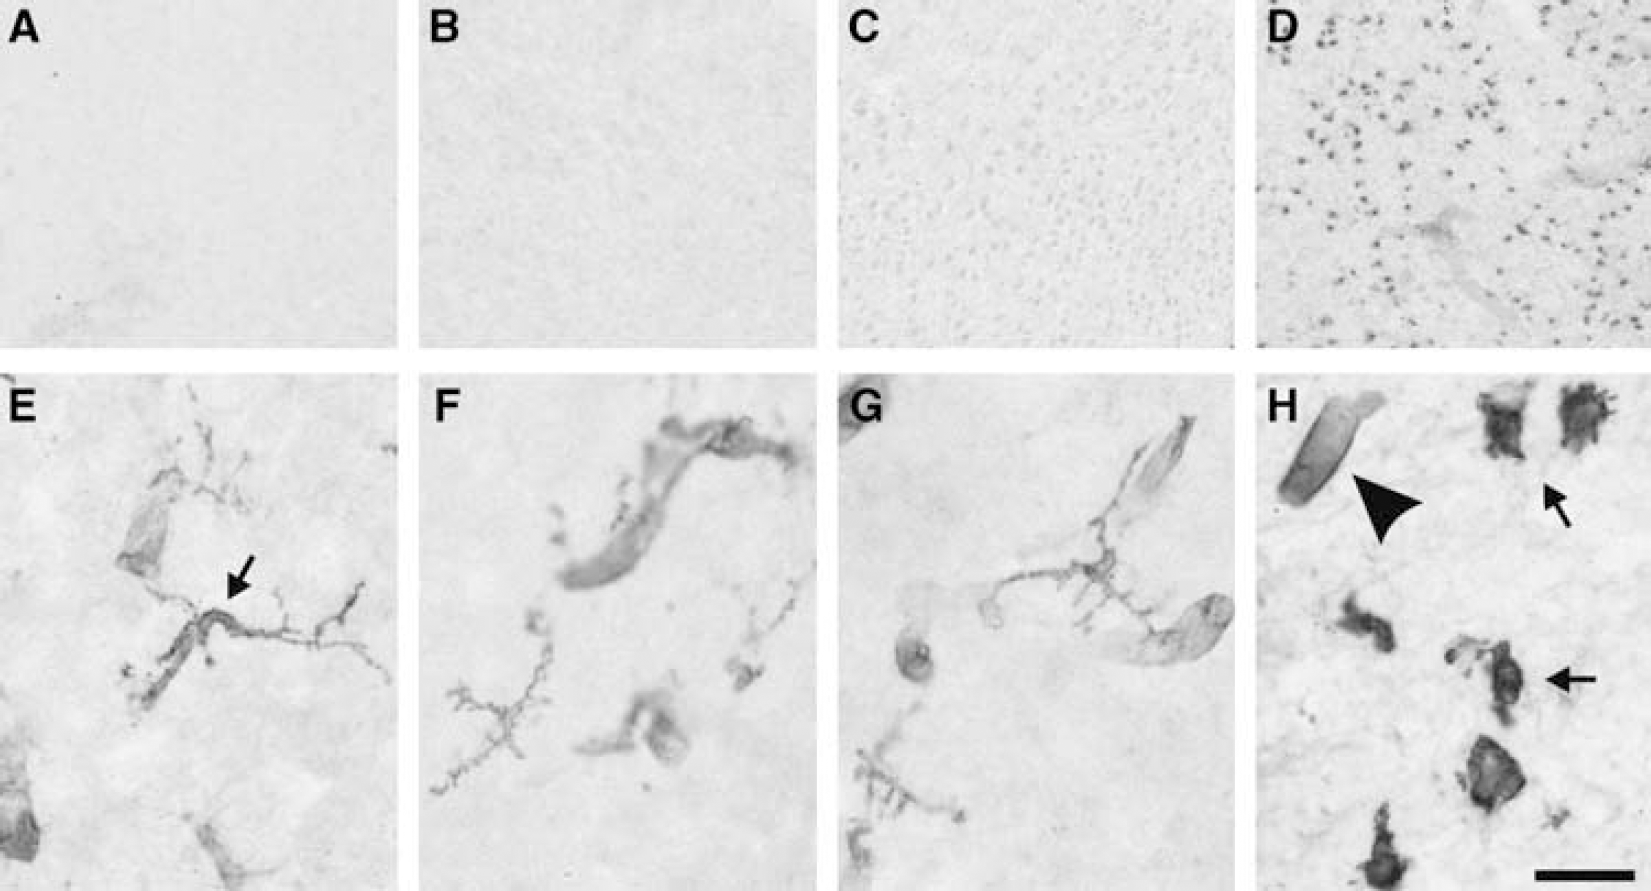
Histochemical visualization of cell death and microglial response in embryonic chicken brain 24 h after endotoxin and hypoxia. (
In almost all regions, the number of TUNEL-positive cells in the combined LPS and hypoxia group declined considerably 48 h after insult (Figure 3C). However, there was still a significant, although more moderate, increase in the average number of TUNEL-positive cells across all brain regions in the combined group versus the LPS-alone or the control group (P<0.05). Regionally, there was also a significant elevation in the hypoxia-alone and the combined LPS and hypoxia groups, compared with the other two groups (control, LPS) in the hyperstriatum ventrale (P<0.01). Hypoxia and LPS by themselves did not separately cause a significant increase in cell death compared with controls at 12, 24, or 48 h (Figures 3A to 3C), except for the 48 h hypoxia-alone group in hyperstriatum ventrale.
Glial Response
The LPS/hypoxia group showed an increase in glial activation, detected using RCA1 lectin histochemistry for microglia and glial fibrillary acidic protein immunoreactivity for astrocytes. Blind scoring of hippocampus, parahippocampal area, hyperstriatum ventrale, dorsal lateral cortex, and piriform cortex brain regions showed a prompt RCA1-positive microglia response maximizing within the first 24 h. A significant activation of microglial cells with various degrees of deramification and transformation into macrophages was observed (Figures 4 and 5A). Figures 5A to 5D show the average scores across all five tested brain regions, but similar time courses were also observed for each individually tested region (not shown).
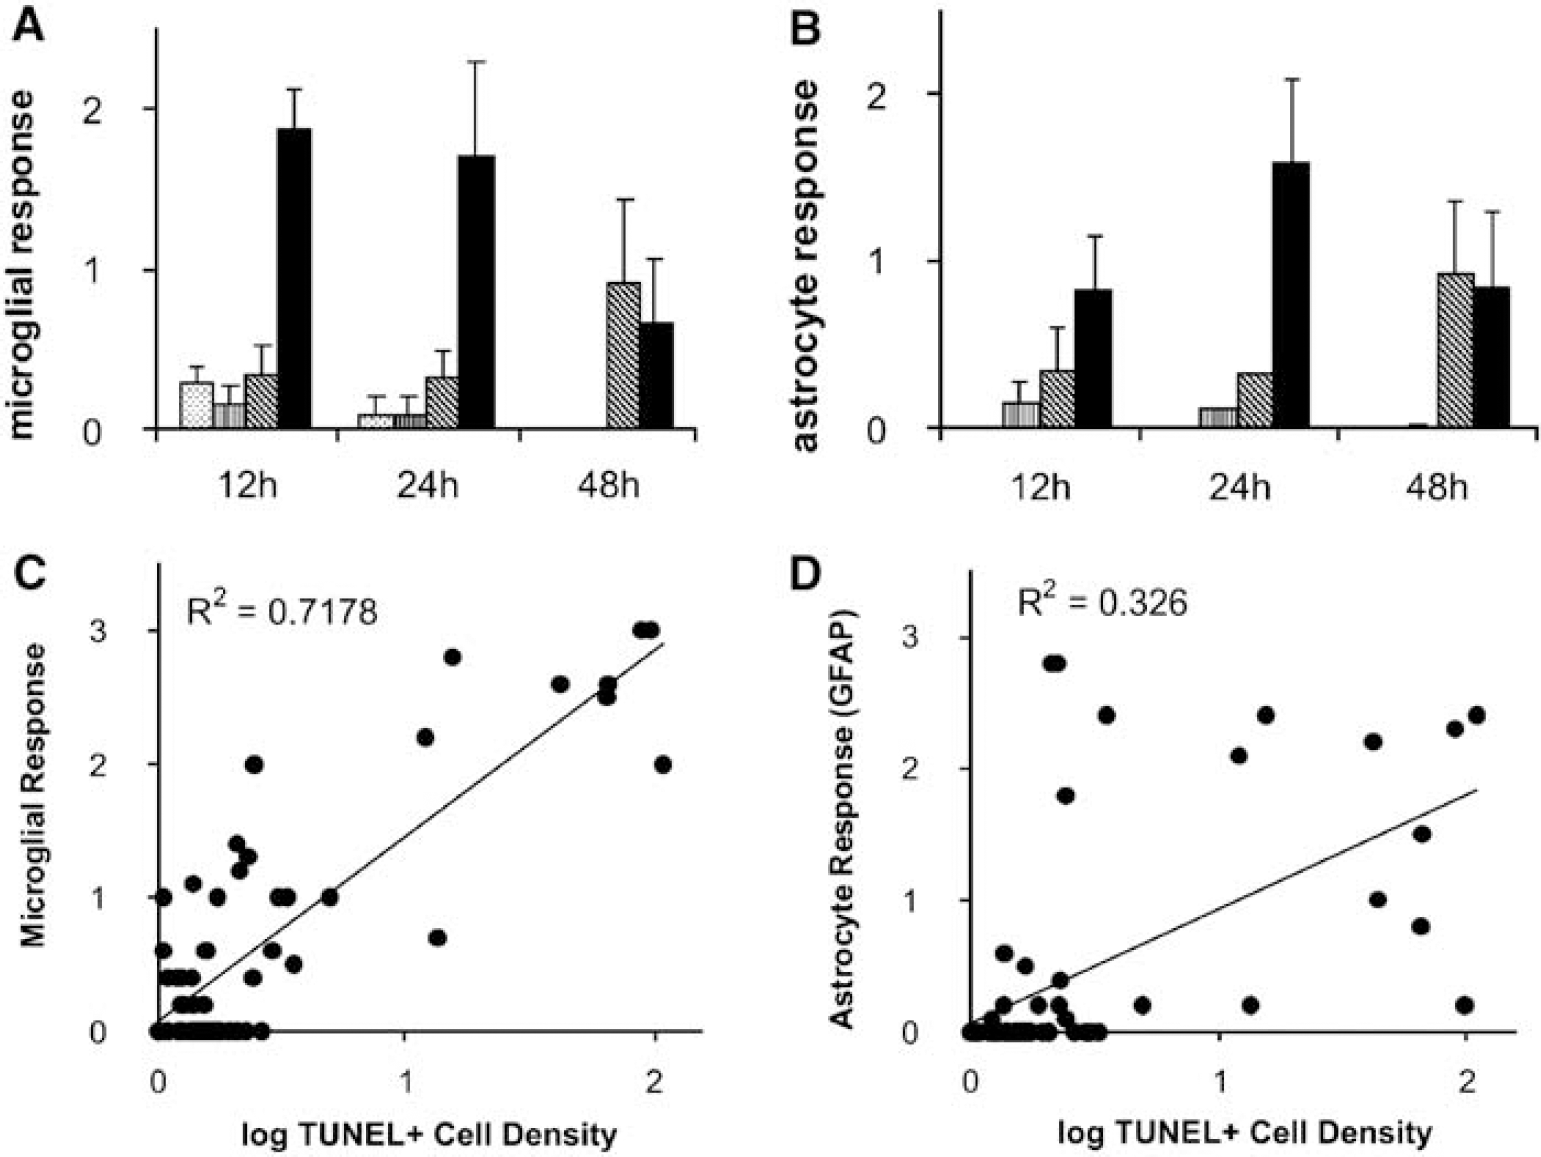
Microglial (
The astrocyte response was smaller than the microglial response and peaked slightly later at 24 h (Figure 5B). Although there was very little microglial or astrocyte activation in the hypoxia-alone or LPS-alone groups at 12 or 24 h after hypoxia, hypoxia-alone group showed moderate activation at 48h (P<0.05), similar to that for LPS plus hypoxia.
Figures 5C and 5D show the correlation between the average microglial and astrocytic responses and the log density of TUNEL-positive cells, averaged across the same five brain regions, with each datum representing a single embryo. Although a correlation was observed in both cases (P<0.05, one-way ANOVA), cell death was more strongly correlated to the microglial response (R2 = 0.72) than to astrogliosis (R2 = 0.33).
Effects of Tubocurarine on Brain Cell Death
Application of 0.5 mg per embryo tubocurarine before hypoxia did not alter the number of TUNEL-positive cells in any region 24 h after LPS/hypoxia (P<0.05, t-test): hence, this tubocurarine dose was used to prevent detrimental effects of chicken embryo movement during MRI and MRS without the confounds (i.e., neuroprotection) introduced by anaesthetics.
MRI and MRS
We assessed alterations in Lac, NAA, Cho, and Cr peak amplitude ratios and in T2, T2+, and Dav induced separately by hypoxia-alone, combined LPS and hypoxia, and LPS alone. A statistical comparison of the intergroup baseline (consistent difference through out the time points) yielded the effect of LPS alone for each of these measurements. The difference in absolute response was then assessed to observe any modulatory effects in the response to hypoxia owing to LPS pretreatment.
Metabolic Changes: Lac/Cho, Lac/Cr, and Lac/NAA increased steadily during hypoxia, with the latter peaking 10-fold higher than baseline by the end of hypoxia (Figure 6A and Table 1; P <0.01), followed by a more gradual decline during the 2-h recovery period. Individual Lac ratios were similar in the hypoxia-alone and LPS/hypoxia groups at baseline and during the hypoxic and posthypoxic periods; LPS increased baseline Cr/NAA and Cho/NAA (13% and 22% respectively; both P <0.01); Cho/NAA was unchanged by hypoxia but Cr/NAA was increased at the end of hypoxia irrespective of LPS pretreatment (both P <0.01; Figures 6B and 6C and Table 1).
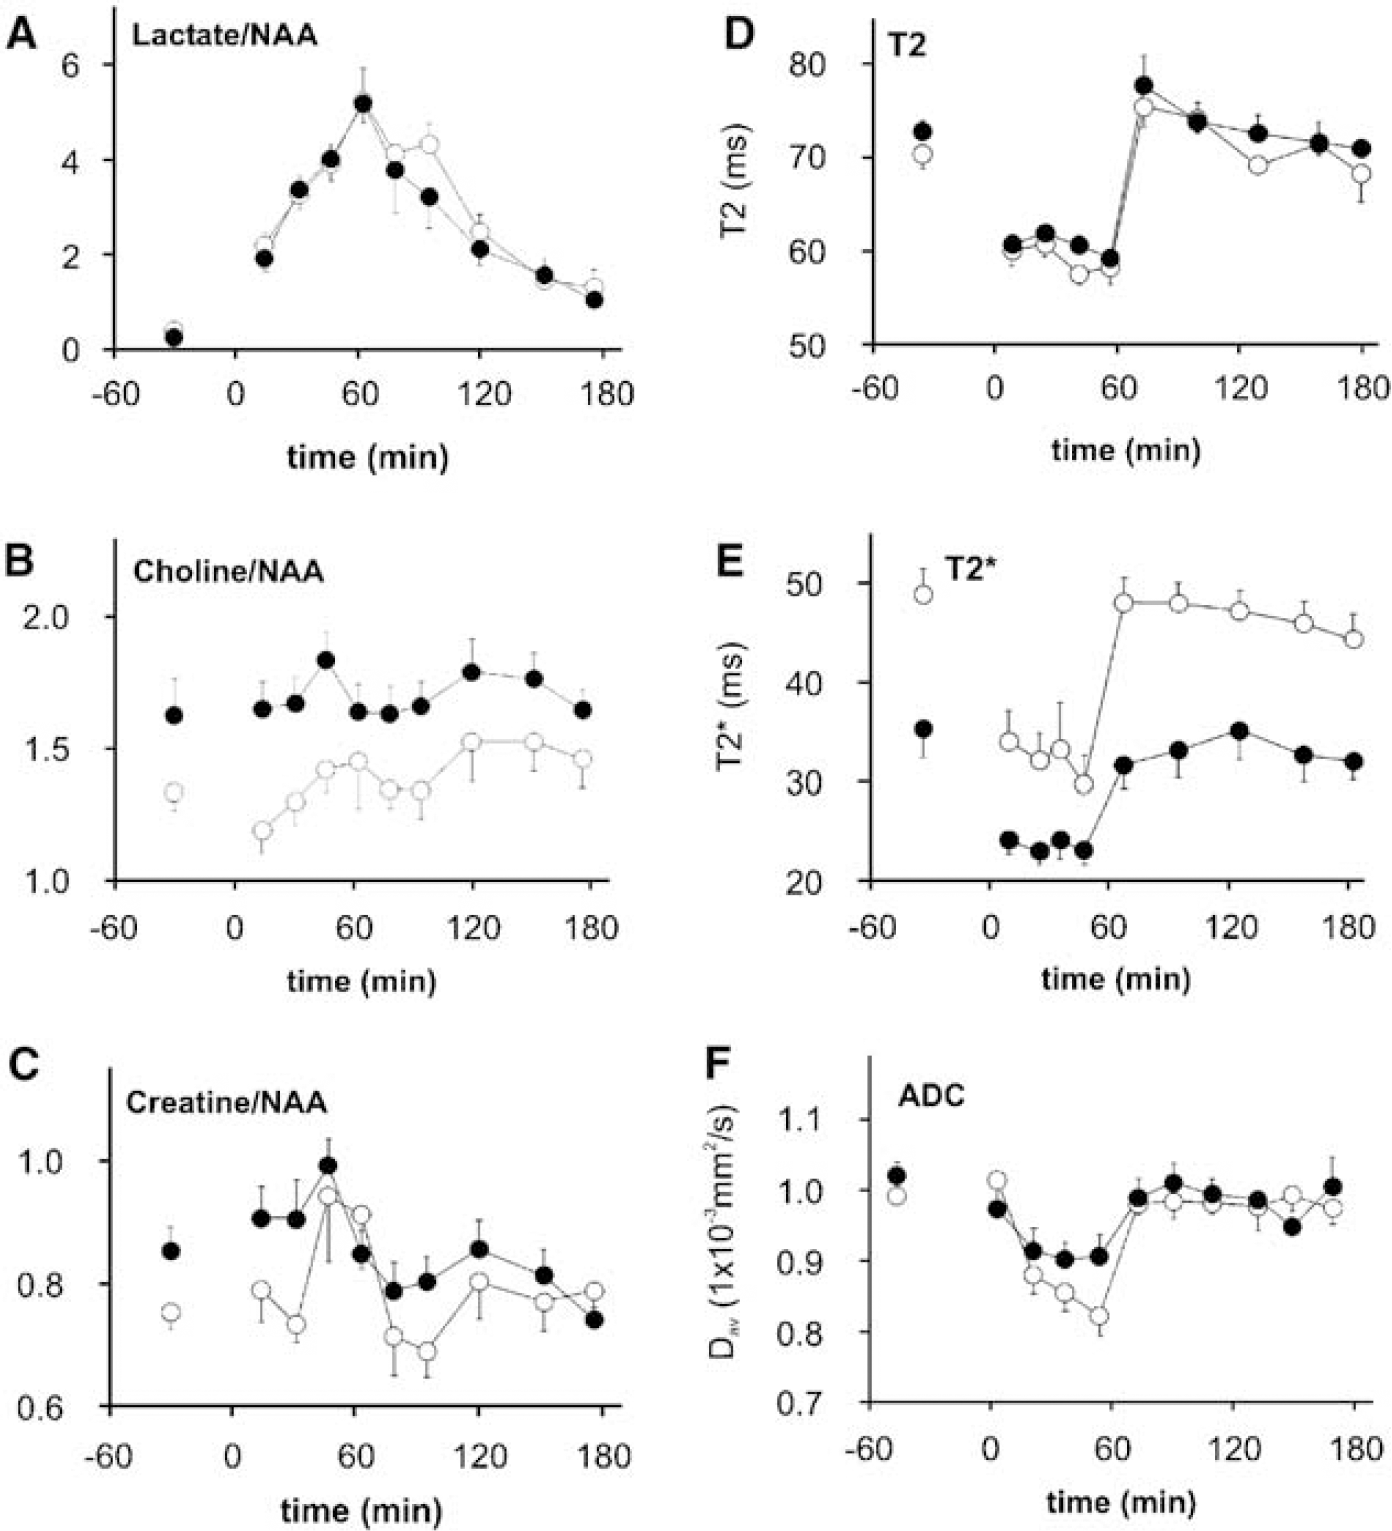
The figure shows MRI and MRS measures (mean ± s.e.m.) before, during, and after hypoxia, without (open circles) and with (black circles) LPS pretreatment. Hypoxia began at Omin and continued until 60 mins.
Whole-Brain T2 and T2+ MRI: There was no intergroup difference in baseline T2; however, baseline T2+ was lower with LPS pretreatment (Table 1; P <0.01). In both groups, T2 and T2+ declined precipitously when hypoxia started and then remained approximately constant (˜15% and ˜33% below baseline respectively) until baseline values were rapidly recovered after normoxia resumption (Table 1 and Figures 6D and 6E). Immediately after hypoxia, T2 (but not T2+) increased transiently above baseline levels in both groups. However, when the baseline T2+ and T2 differences were subtracted, T2+ and T2 responses were similar in each group both during hypoxia and recovery. Regional T2 and T2+ results were similar to those for the whole brain.
Whole-Brain Diffusion (Dav): LPS increased baseline Dav slightly (Table 1; P <0.01). However, LPS did not modulate Dav during hypoxia or recovery. In both groups, the first hypoxic Dav was similar to baseline but later hypoxia Dav was typically 10% to 15% lower throughout (Figures 1 and 6F and Table 1; P <0.01, ANOVA followed by post hoc Tukey): baseline values were recovered within 10 mins of normoxia resumption. Regional Dav behaved similarly.
Discussion
This study provides important information about the complex interaction between infection and transient cerebral hypoxia and their effects on cerebral metabolism and cell viability. Our results show that in the preair breathing chicken embryo, exposure to bacterial endotoxin (LPS) 4 h before transient global hypoxia (4% inspired O2 for 1 h) increased brain cell death by a factor of 30 to 100 compared with either LPS or hypoxia-alone. The increased cell death was associated with prompt and strong microglial activation and transformation into phagocytes, and a more gradual, moderate increase in astrogliosis.
Neuroglial activation is a ubiquitously observed, constitutive response of the injured nervous system. The microglial response is an early component that coincides approximately with the early changes in neuronal physiology and protein synthesis (Morioka et al, 1991; Kloss et al, 1999, 2001). Although some early astrocyte reactions, for example increased gap junction proteins, have been reported (Rohlmann et al, 1993), the general astrocyte response detected with glial fibrillary acidic protein immunoreactivity tends to be delayed by 1 to 2 days (Raivich et al, 1999). These differences in timing could partially explain why the correlation observed between early neural cell death and microglial activation and phagocytosis was closer than that with the astrocyte response.
The close correlation between cell death and results from microglial-activation staining (particularly phagocytic, e.g., RCA1 lectin used in this study) showed that such staining provides rapid assessment of potential cerebral injury. This association extends to forms of adult neuronal damage and cell death frequently unassociated with nuclear DNA fragmentation (Raivich et al, 1998, 2002). Previous in vitro studies showed a good dose response between the quantity of neural cell debris and the transformation of ramified microglia into phagocytic ameboid macrophages (Bohatschek et al, 2001). However, while the appearance of phagocytic macrophages in the current study is likely to result from the presence of dead cells, we have been unable to determine whether microglial activation actually causes the greater cell death observed in the LPS/hypoxia group. Other studies suggest that LPS enhances the innate immune response, eliciting the activation of microglia via stimulation of Toll-like receptors and increased production of proinflammatory cytokines (Eklind et al, 2001; Lehnardt et al, 2003). Of relevance to this study is that STM LPS activates Toll-receptor 4 and this receptor type has been shown in chicken brain (Leveque et al, 2003; Gerold et al, 2007). Microglia have been identified as the major LPS responsive cells in the central nervous system and a loss-of-function mutation of microglial Toll-like receptor 4 is associated with resistance to the sensitizing effects of LPS in neonatal mice (Lehnardt et al, 2003). Although we observed a close correlation between the degree of microglial activation and level of cellular damage, we did not show an effect of LPS alone, perhaps because the marker used (RCA1 lectin) reflected later rather than early stage of activation. We did however observe increases in baseline Cho/NAA and Cr/NAA after LPS, both of which might result from such early stage, but later diminishing, activation (see below).
To determine whether the neurotoxic interaction between hypoxia and LPS was because of a metabolic effect, we used MRS and MRI to assess (1) glycolysis (via Lac), (2) impairment of cerebral energy generation (via Cr and, indirectly, by Dav), and (3) blood oxygenation, flow, and volume (via T2 and T2+). The most direct way to assess energy depletion would be to use 31P MRS (Lorek et al, 1994). However, localized 31P magnetic resonance spectra have relatively poor signal-to-noise ratio and so lack the necessary temporal resolution, while nonlocalized spectra are prone to massive contamination from tissues other than the brain because the brain is situated within the egg—a particular problem when the insult is global. We therefore chose to collect ADC and 1H-spectra, as these provide similar, localized information within an acceptable time frame (Thornton et al, 1998). In this study, spectra were acquired unrelaxed (TR 2 sees) with a relatively long TE (135 ms): hence, metabolite ratios depended on the transverse and longitudinal relaxation times (T2 and T1) of the constituent metabolites as well as their concentrations. Absolute quantitation of metabolite concentrations (e.g., in mmol/kg wet weight tissue) requires a far longer MRS acquisition time, which would greatly reduce temporal resolution during hypoxia and recovery: This study therefore had the limitation that metabolite ratio changes could have resulted from metabolite concentrations, T1, or T2, or a combination thereof, altering under experimental conditions. For example, both Lac T2 and Cr T2 increase during transient cerebral HI as nucleotide triphosphate (NTP; mainly ATP) decreases: the T2 increases are probably because of Na+/K+ pump impairment (Cady et al, 1994). Furthermore, during HI, PCr is dephosphorylated to creatine, which has a longer T2 (Ke et al, 2002), and consequentially the Cr signal increases (Cady et al, 1994): in neonatal encephalopathy (caused by HI), increased Cr T2 is predictive of poor outcome, illustrating the importance of metabolite T2 changes (Cheong et al, 2006).
Endotoxin pretreatment was associated with increases in baseline Cr/NAA and Cho/NAA that, in combination, could be because of reduced NAA signal. However, although NAA is predominantly neuronal, it is unlikely that these Cr/NAA and Cho/NAA baseline shifts were owing to neuronal loss: endotoxin alone was not associated with increased TUNEL labelling of dying neurons, or with phagocytic RCA1-positive microglia reacting to neural debris. It is also unlikely that shorter NAA T2, or increased NAA T1, reduced the NAA signal in view of the very similar Lac/NAA observed in the hypoxia-alone and LPS/hypoxia groups. In fact, no baseline differences in Lac/NAA due to endotoxin were detected. Although low Lac levels make the variance at the prehypoxia time point large compared with mean values (reducing statistical power) the ANOVA is still sensitive to persistent shifts. Both sets of arguments strongly suggest that LPS increased the Cr and Cho signals in the current study. These observations suggest several ways by which LPS preexposure could increase subsequent hypoxia-induced cell death. The increase in Cr signal could result from PCr dephosphorylation and the resulting increase in T2 (see above); as PCr is an important buffer against ATP depletion, this finding suggests increased vulnerability to subsequent acute energy failure. Increased Cho/NAA shows that endotoxin can alter cerebral choline status; changes in serum free and phospholipid-bound choline after endotoxin administration in dogs suggest that LPS may affect cytosolic choline levels (Ilcol et al, 2005). Any alteration to cell membrane phospholipids could have important consequences for the response to hypoxia if cell communication is altered. Alternatively, alterations in Cho and Cr could reflect microglial activation, as this process is likely to involve changes in cell membrane status and increased energy consumption.
In vitro cell culture studies suggest that endotoxin-activated glia produce nitric oxide, which inhibits mitochondrial respiration by competing with oxygen at the cytochrome oxidase stage of the electron transport chain; cell death is increased further by addition of 2-deoxyglucose, an inhibitor of glycolysis (Mander et al, 2005). We had hypothesized that endotoxin preexposure would impair mitochondrial respiration and worsen the ATP deficit during acute hypoxia; further, this would be compensated by increased anaerobic glycolysis. The data do not support this hypothesis. Lac/NAA increased and Dav decreased during hypoxia but neither exhibited an intergroup difference in the response to, or recovery from, hypoxia, suggesting strongly that LPS did not significantly modulate cerebral energy demand or generation by anaerobic glycolysis. Similarly, although we observed moderate increases in Cr/NAA, perhaps because of PCr dephosphorylation, there was no intergroup difference in response to hypoxia. In mammalian brain, ADC decreases as ATP decreases, as assessed biochemically and by phosphorus MRS (Back et al, 1994, Thornton et al, 1998). The isotropic averaged ADC (Dav) decrease reported here (<˜15% of baseline; Table 1 and Figure 6F) suggested that 1 h of 4% inspired O2 did not reduce ATP (normally observed only if Dav decreases by >25%). This is compatible with histology showing that hypoxia-alone caused little cell death. As cell death was mainly hippocampal and cortical, it is possible that whole-brain, postbaseline MRI and MRS measures were inadequately sensitive. However, even regional Dav measurements of the response to hypoxia were independent of LPS.
T2 and T2+ are inversely proportional to erythrocyte deoxyhaemoglobin (dHb) content (Thulborn et al, 1982; Brooks et al, 1989): dHb is paramagnetic and causes local magnetic field inhomogeneities that expedite transverse relaxation (T2/T2+ shortens). Tissue dHb content is related to blood flow and volume, the rate of oxygen consumption (CMRO2), and arterial oxygen saturation. While both T2 and T2+ are sensitive to altered dHb content, T2+ is more sensitive to venous dHb because it depends on constant local magnetic fields such as those around draining veins (containing more dHb). T2 depends more on small vessels because its relaxation process requires spin diffusion through smaller-scale (e.g., comparable to typical spin-diffusion distances), fluctuating local magnetic fields.
In our study, both T2 and T2+ showed large and rapid reductions during hypoxia, consistent with increased dHb because of reduced arterial oxygen saturation and a compensatory increase in cerebral blood volume. On reoxygenation, T2 increased rapidly, resulting in a transient overshoot above baseline and suggesting a temporarily elevated oxygenated blood supply. In our study, T2+, but not T2, was persistently lower in the LPS/hypoxia, group before, during, and after hypoxia suggesting that LPS changed blood volume in different vascular/venous compartments. In a previous study of fetal sheep (Peebles et al, 2003b), LPS increased cerebral blood flow and volume; LPS has also been linked to improved microvascular patency in adult ischaemia models (Dawson et al, 1999). Either an increase in venous blood volume or an inflammation-related increase in CMRO2, because of glial activation, could preferentially increase the amount of venous dHb causing a greater reduction in T2+ than T2. T2+ decreases have been associated with decreased blood pressure (Wang et al, 2006). However, our results suggest that the effect of endotoxin on T2+ is unlikely to reflect physiologically important changes in cerebral oxygen delivery before or during hypoxia, as this should impair mitochondrial respiration and, indirectly, decrease Dav and greatly increase cerebral Lac generation, which were not observed.
In conclusion, our results show that exposure of developing brain to bacterial endotoxin 4 h before transient global hypoxia led to more cell death than observed with either LPS or hypoxia-alone. Endotoxin led to baseline changes suggesting both metabolic and haemodynamic perturbations that would be compatible with an LPS-induced increase in oxidative metabolism, perhaps related to microglial activation. We had hypothesized that endotoxin preexposure would impair mitochondrial respiration and worsen the ATP deficit during acute hypoxia. Our findings do not support this hypothesis: at the end of hypoxia, neither Dav nor Lac/NAA was affected by LPS pretreatment. LPS enhancement of the innate immune response system may be responsible for the increased cell death caused by endotoxin preexposure.
Footnotes
Acknowledgements
This work was supported by Wellcome Trust (XW and DWC), and University College London Hospitals NHS Foundation Trust (EC and AB). This work was undertaken at UCLH/UCL, which received a proportion of funding from the Department of Health's NIHR Biomedical Research Centres funding scheme.