
Abstract
Autophagy contributes to ischemic brain injury, but it is not clear if autophagy occurs after intracerebral hemorrhage (ICH). This study examined whether ICH-induced cell death is partly autophagic. It then examined the role of iron in inducing this form of cell death after ICH. Male, adult Sprague-Dawley rats received an infusion of autologous whole blood or ferrous iron into the right basal ganglia. Control rats (sham) had a needle insertion. The rats were killed at 1, 3, 7, or 28 days later. Some rats were treated with either deferoxamine or vehicle after ICH. Microtubule-associated protein light chain-3 (LC3), a biomarker of autophagosome, and cathepsin D, a lysosomal biomarker, were measured by Western blot analysis and immunohistochemistry. Immunofluorescent double-labeling was used to identify the cell types expressing cathepsin D. Electron microscopy was performed to examine the cellular ultrastructure changes after ICH. We found that conversion of LC3-I to LC3-II, cathepsin D expression, and vacuole formation are increased in the ipsilateral basal ganglia after ICH. Intracerebral infusion of iron also resulted in enhanced conversion of LC3-I to LC3-II and increased cathepsin D levels. Deferoxamine (an iron chelator) treatment significantly reduced the conversion of LC3-I to LC3-II and cathepsin D levels after ICH. Our results demonstrated that autophagy occurs after ICH, and iron has a key role in ICH-induced autophagy. This also suggests that iron-induced autophagy may play a role in brain injury in other diseases associated with iron overload.
Keywords
Introduction
Intracerebral hemorrhage (ICH) is a common and often fatal subtype of stroke with a high mortality rate. If the patient survives, the hematoma itself can lead to significant neuronal death and result in severe neurological deficits (Qureshi et al, 2001; Xi et al, 2006). The mechanisms of brain injury after ICH are still being elucidated, but they differ from ischemic stroke. There is often little or no reduction in cerebral blood flow after ICH. Instead, clot-derived factors, including iron released from hemoglobin, play a major role (Xi et al, 2006).
There are three main types of cell death, including necrotic, apoptotic, and autophagic cell death. Both necrosis and apoptosis have been found in the brain after ICH (Xi et al, 2006), but it is not clear whether autophagy occurs. Autophagy is a cellular degradation process in which cellular proteins and organelles are sequestered in double membrane vesicles known as autophagosomes, delivered to lysosomes, and digested by lysosomal hydrolases (Wang and Klionsky, 2003). Autophagy plays an important role in cellular homeostasis, and it is involved in a number of human diseases, including neurodegenerative diseases and cerebral ischemia (Adhami et al, 2006; Degterev et al, 2005; Komatsu et al, 2006; Rubinsztein et al, 2005). Understanding whether autophagy is also important in ICH may aid in the development of effective treatments for this condition.
Oxidative stress has been implicated in the induction of autophagy (Kiffin et al, 2006). Our previous studies have demonstrated oxidative brain damage after ICH, which may be related to iron overload (Nakamura et al, 2005a; Wu et al, 2002). Iron release from the hematoma contributes to ICH-induced brain injury including delayed brain atrophy (Hua et al, 2007, 2008; Nakamura et al, 2004; Wagner et al, 2003; Wu et al, 2003), but whether it also induces autophagy has not been examined. An involvement of iron in inducing autophagy would be important for multiple diseases, for although ICH may represent an extreme form of iron overload, iron has been implicated in brain injury in a wide variety of diseased states (Zecca et al, 2004).
This study investigated whether autophagy occurs in the brain after ICH and the potential role of iron in ICH-induced autophagy. Electron microscopy and two biomarkers of autophagy, cathepsin D and microtubule-associated protein light chain 3 (LC3), were used. Light chain 3 is a marker for the detection of autophagosomes. Light chain 3 has two forms: type I is cytosolic and type II is membrane-bound. During autophagy, LC3-II is increased by conversion from LC3-I (Kabeya et al, 2000). Cathepsin D is a protein known to mediate autophagy (Yan et al, 2005).
Materials and methods
Animal Preparation and Intracerebral Infusion
The University of Michigan Committee on the Use and Care of Animals approved the protocols for these studies. A total of 96 male Sprague-Dawley rats (weighing 275 to 350 g, Charles River Laboratories, Portage, MI, USA) were used. Rats were anesthetized with pentobarbital (40 mg/kg, intraperitoneal). A polyethylene catheter (PE-50) was then inserted into the right femoral artery to monitor arterial blood pressure and blood gases and to obtain blood for intracerebral blood infusion. Rectal temperature was maintained at 37.5°C using a feedback-controlled heating pad. The animals were positioned in a stereotactic frame (Kopf Instruments, Tujunga, CA, USA) and a cranial burr hole (1 mm) was drilled. Autologous blood was infused into the right caudate nucleus through a 26-gauge needle at a rate of 10 μL/min using a microinfusion pump (Harvard Apparatus Inc., South Natick, MA, USA). The coordinates were 0.2 mm anterior and 3.5 mm lateral to the bregma and a depth of 5.5 mm. After intracerebral infusion, the needle was removed and the skin incision closed with suture.
Experimental Groups
This study was divided into three parts. In the first part, rats received either a needle insertion (sham) or an intracerebral infusion of 100 μL autologous whole blood and were killed at 1, 3, 7, or 28 days later for Western blot analysis, immunohistochemistry, and electron microscopy analysis. In the second part, rats had an infusion of 30 μL ferrous chloride (1 mmol/L) or a needle insertion. Rat brains were sampled 1 day after intracerebral injection and used for Western blot analysis and immunohistochemistry. In the third part, rats had an intracerebral infusion of 100 μL autologous whole blood and were treated with either deferoxamine (100 mg/kg, intraperitoneal 2 h after ICH and then at 12-hour intervals for 7 days) or the same amount of vehicle. Rats were then killed at day 7 for Western blot analysis and immunohistochemistry.
Western Blot Analysis
Rats were anesthetized and underwent intracardiac perfusion with 0.1 mol/L phosphate-buffered saline (pH 7.4). The brains were removed and a 3-mm-thick coronal brain slice was cut approximately 4 mm from the frontal pole. The slice was separated into ipsilateral and contralateral basal ganglia. Western blot analysis was performed as previously described (Xi et al, 1999). Briefly, brain samples were sonicated with Western blot lysis buffer. Protein concentration was determined using a Bio-Rad Laboratories (Hercules, CA, USA), protein assay kit. A 50 μg portion of protein from each sample was separated by sodium dodecyl sulfate-polyacrylamide gel electrophoresis and transferred to a hybond-C pure nitrocellulose membrane (Amersham, Piscataway, NJ, USA). The membranes were blocked in Carnation nonfat milk and probed with primary and secondary antibodies. The primary antibodies were mouse anti-cathepsin D antibody (Sigma, St Louis, MO, USA; 1:1,000 dilution) and rabbit anti-MAPLC3 antibody (Abgent Inc., San Diego, CA, USA; 1:400 dilution). The secondary antibodies were goat anti-mouse and goat anti-rabbit IgG (Bio-Rad; 1:2,500 dilution). The antigen-antibody complexes were visualized with a chemiluminescence system (Amersham) and exposed to a Kodak X-OMAT film. Relative densities of bands were analyzed with NIH Image program (Version 1.61).
Immunohistochemistry
Immunohistochemistry was performed as described previously (Xi et al, 1999). Briefly, rats were anesthetized and subjected to intracardiac perfusion with 4% paraformaldehyde in 0.1 mol/L phosphate-buffered saline (pH 7.4). The brains were removed and kept in 4% paraformaldehyde for 12 h, then immersed in 25% sucrose for 3 to 4 days at 4°C. Brains were then placed in embedding compound and sectioned on a cryostat (18 μm thick). Immunohistochemistry staining was then performed using the avidin-biotin complex technique. The primary antibody was monoclonal mouse anti-cathepsin D (Sigma; 1:400 dilution). The secondary antibody was horse anti-mouse (Vector Laboratories, Burlingame, CA, USA Abgent Inc., San Diego, CA, USA; 1:600 dilution). Normal mouse IgG was used as a negative control.
Immunofluorescent Double-Labeling
For immunofluorescent double-labeling, the primary antibodies were mouse anti-cathepsin D (Sigma; 1:100 dilution), goat anti-glial fibrillary acid protein (Santa Cruz, Santa Cruz, CA, USA; 1:100 dilution), and rabbit anti-rat neuron-specific enolase (NSE) (Chemicon International Inc., Temecula, CA, USA; 1:100 dilution). Rhodamine-conjugated goat anti-rabbit, rabbit anti-goat antibodies (Boehringer Mannheim Bio, Indianapolis, IN, USA; 1:100 dilution) and fluorescein isothiocyanate (FITC)-labeled horse anti-mouse antibody (Vector; 1:100 dilution) were used as secondary antibodies. The double-labeling was analyzed using a fluorescence microscope (Xi et al, 1999).
Electron Microscopy
Rats were anesthetized and subjected to intracardiac perfusion with 4% paraformaldehyde and 2.5% glutaraldehyde in 0.1 mol/L Sorensen's buffer (pH 7.4). The brains were removed and a 1-mm-thick coronal brain slice was cut with a blade approximately 4 mm from the frontal pole. The slices were separated into ipsilateral and contralateral basal ganglia and immersed in the same fixative overnight at 4°C. The samples were then post-fixed with 1.0% OsO4 and dehydrated in graded ethyl alcohol. After complete dehydration, samples were infiltrated with propylene oxide, embedded in Epon, and sectioned. The ultra-thin sections were then stained with uranyl acetate and Reynold's lead citrate, and evaluated using Philips CM 100 TEM and digitally imaged using a Hamamatsu (Hamamatsu City, Shizuoka, Japan), ORCA-HR camera.
Statistical Analysis
All data in this study are presented as mean ± s.d. Data were analyzed with Student's t-test and analysis of variance. Statistical significance was set at 0.05.
Results
All physiological variables including mean arterial blood pressure, blood pH, PaO2, PaCO2, hematocrit, and blood glucose level were within normal ranges (mean arterial blood pressure, 80 to 120 mm Hg; blood pH, 7.40 to 7.50; PaO2, 80 to 120 mm Hg; PaCO2, 35 to 45 mm Hg; hematocrit, 35% to 45%; blood glucose level, 80 to 130 mg/dL).
ICH Induced the Conversion of LC3-I to LC3-II
By Western blotting, the time-course study of LC3 demonstrated that the ratio of LC3-II to LC3-I in the ipsilateral basal ganglia was significantly increased at day 3, peaked at day 7, and decreased markedly at day 28 after ICH (Figure 1A). The Ratio of LC3-II to LC3-I in the ipsilateral basal ganglia at day 7 after blood injection was markedly increased (1.71 ± 0.06 versus 0.66 ± 0.16 in the contralateral basal ganglia after ICH and 0.60 ± 0.15 in the ipsilateral basal ganglia after sham operation, P < 0.01, Figure 1B).
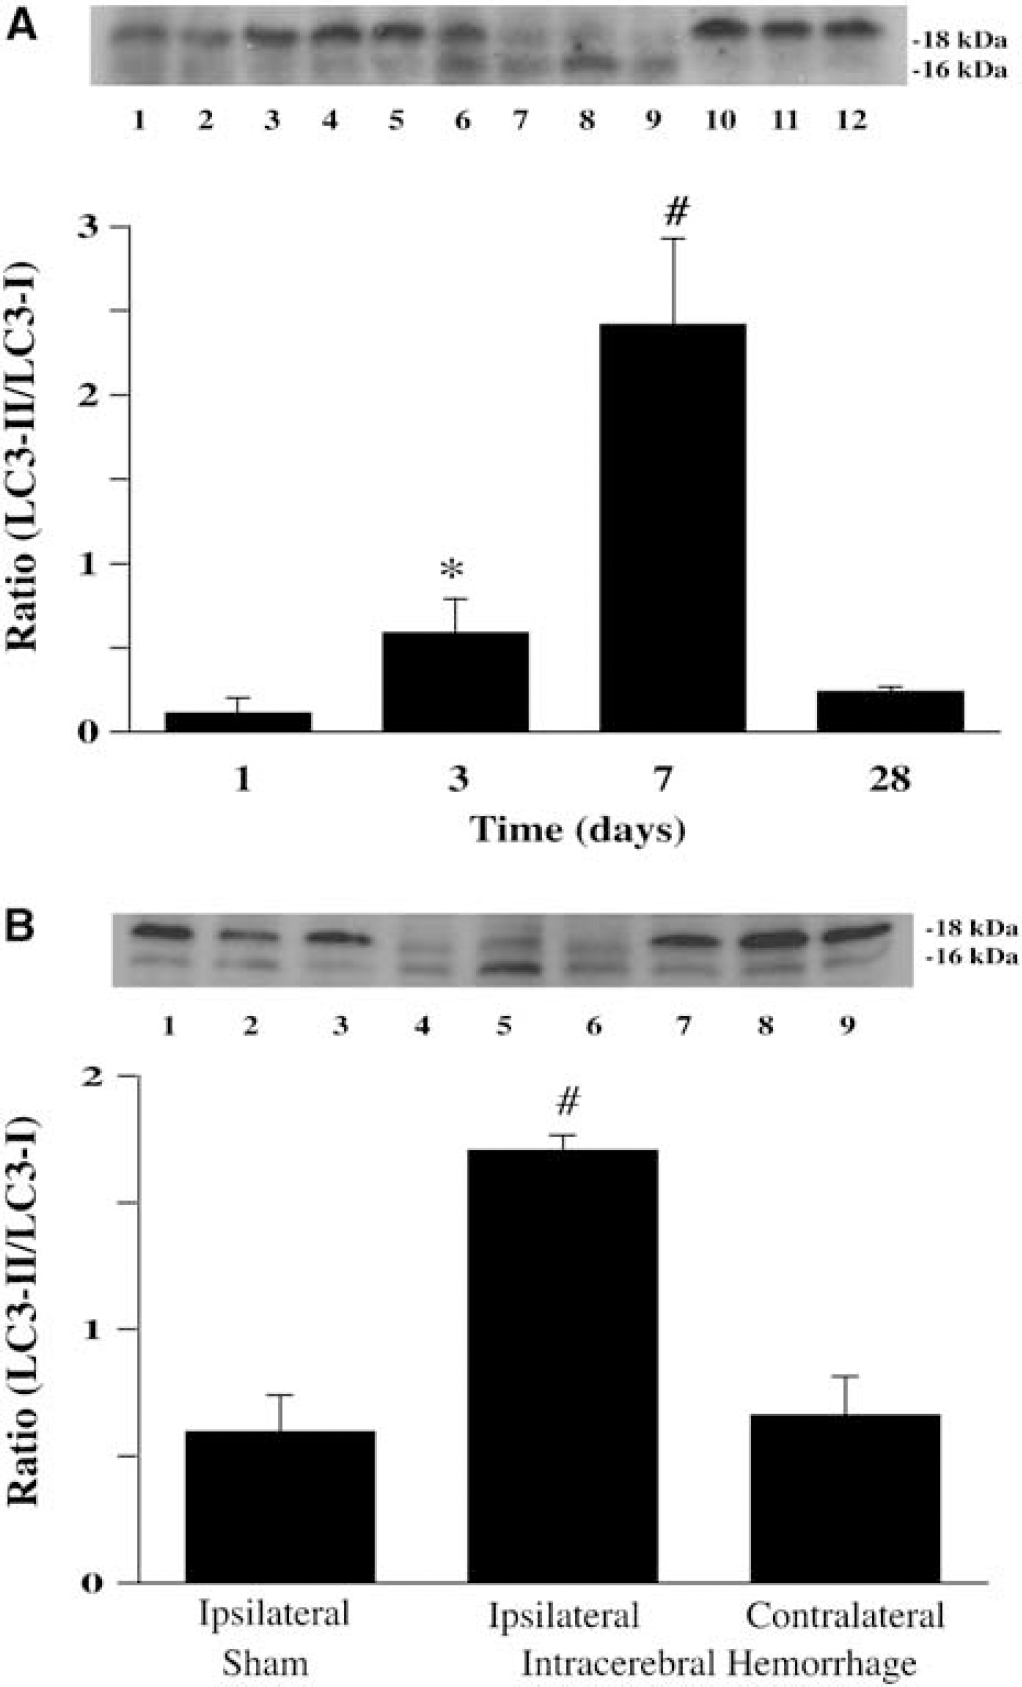
ICH induces conversion of LC3-I to LC3-II. (
Brain Cathepsin D Levels were Increased after ICH
Cathepsin D, an aspartic proteinase in lysosomes, is associated with autophagy. Immunohistochemistry showed that cathepsin D immunoreactivity was very weak in the contralateral basal ganglia but was significantly increased in the ipsilateral basal ganglia after ICH (Figures 2A and 2B). Western blot analysis showed that cathepsin D protein levels were significantly higher in the ipsilateral compared with contralateral basal ganglia (3,953 ± 894 versus 1,157 ± 285 pixels, P <0.05) at 1 day after blood injection and also higher than in the ipsilateral basal ganglia after a sham operation (888 ± 17 pixels, P <0.01). A time course of cathepsin D levels showed that cathepsin D reached a peak at day 7 and remained at high levels at day 28 after ICH (Figure 2C).
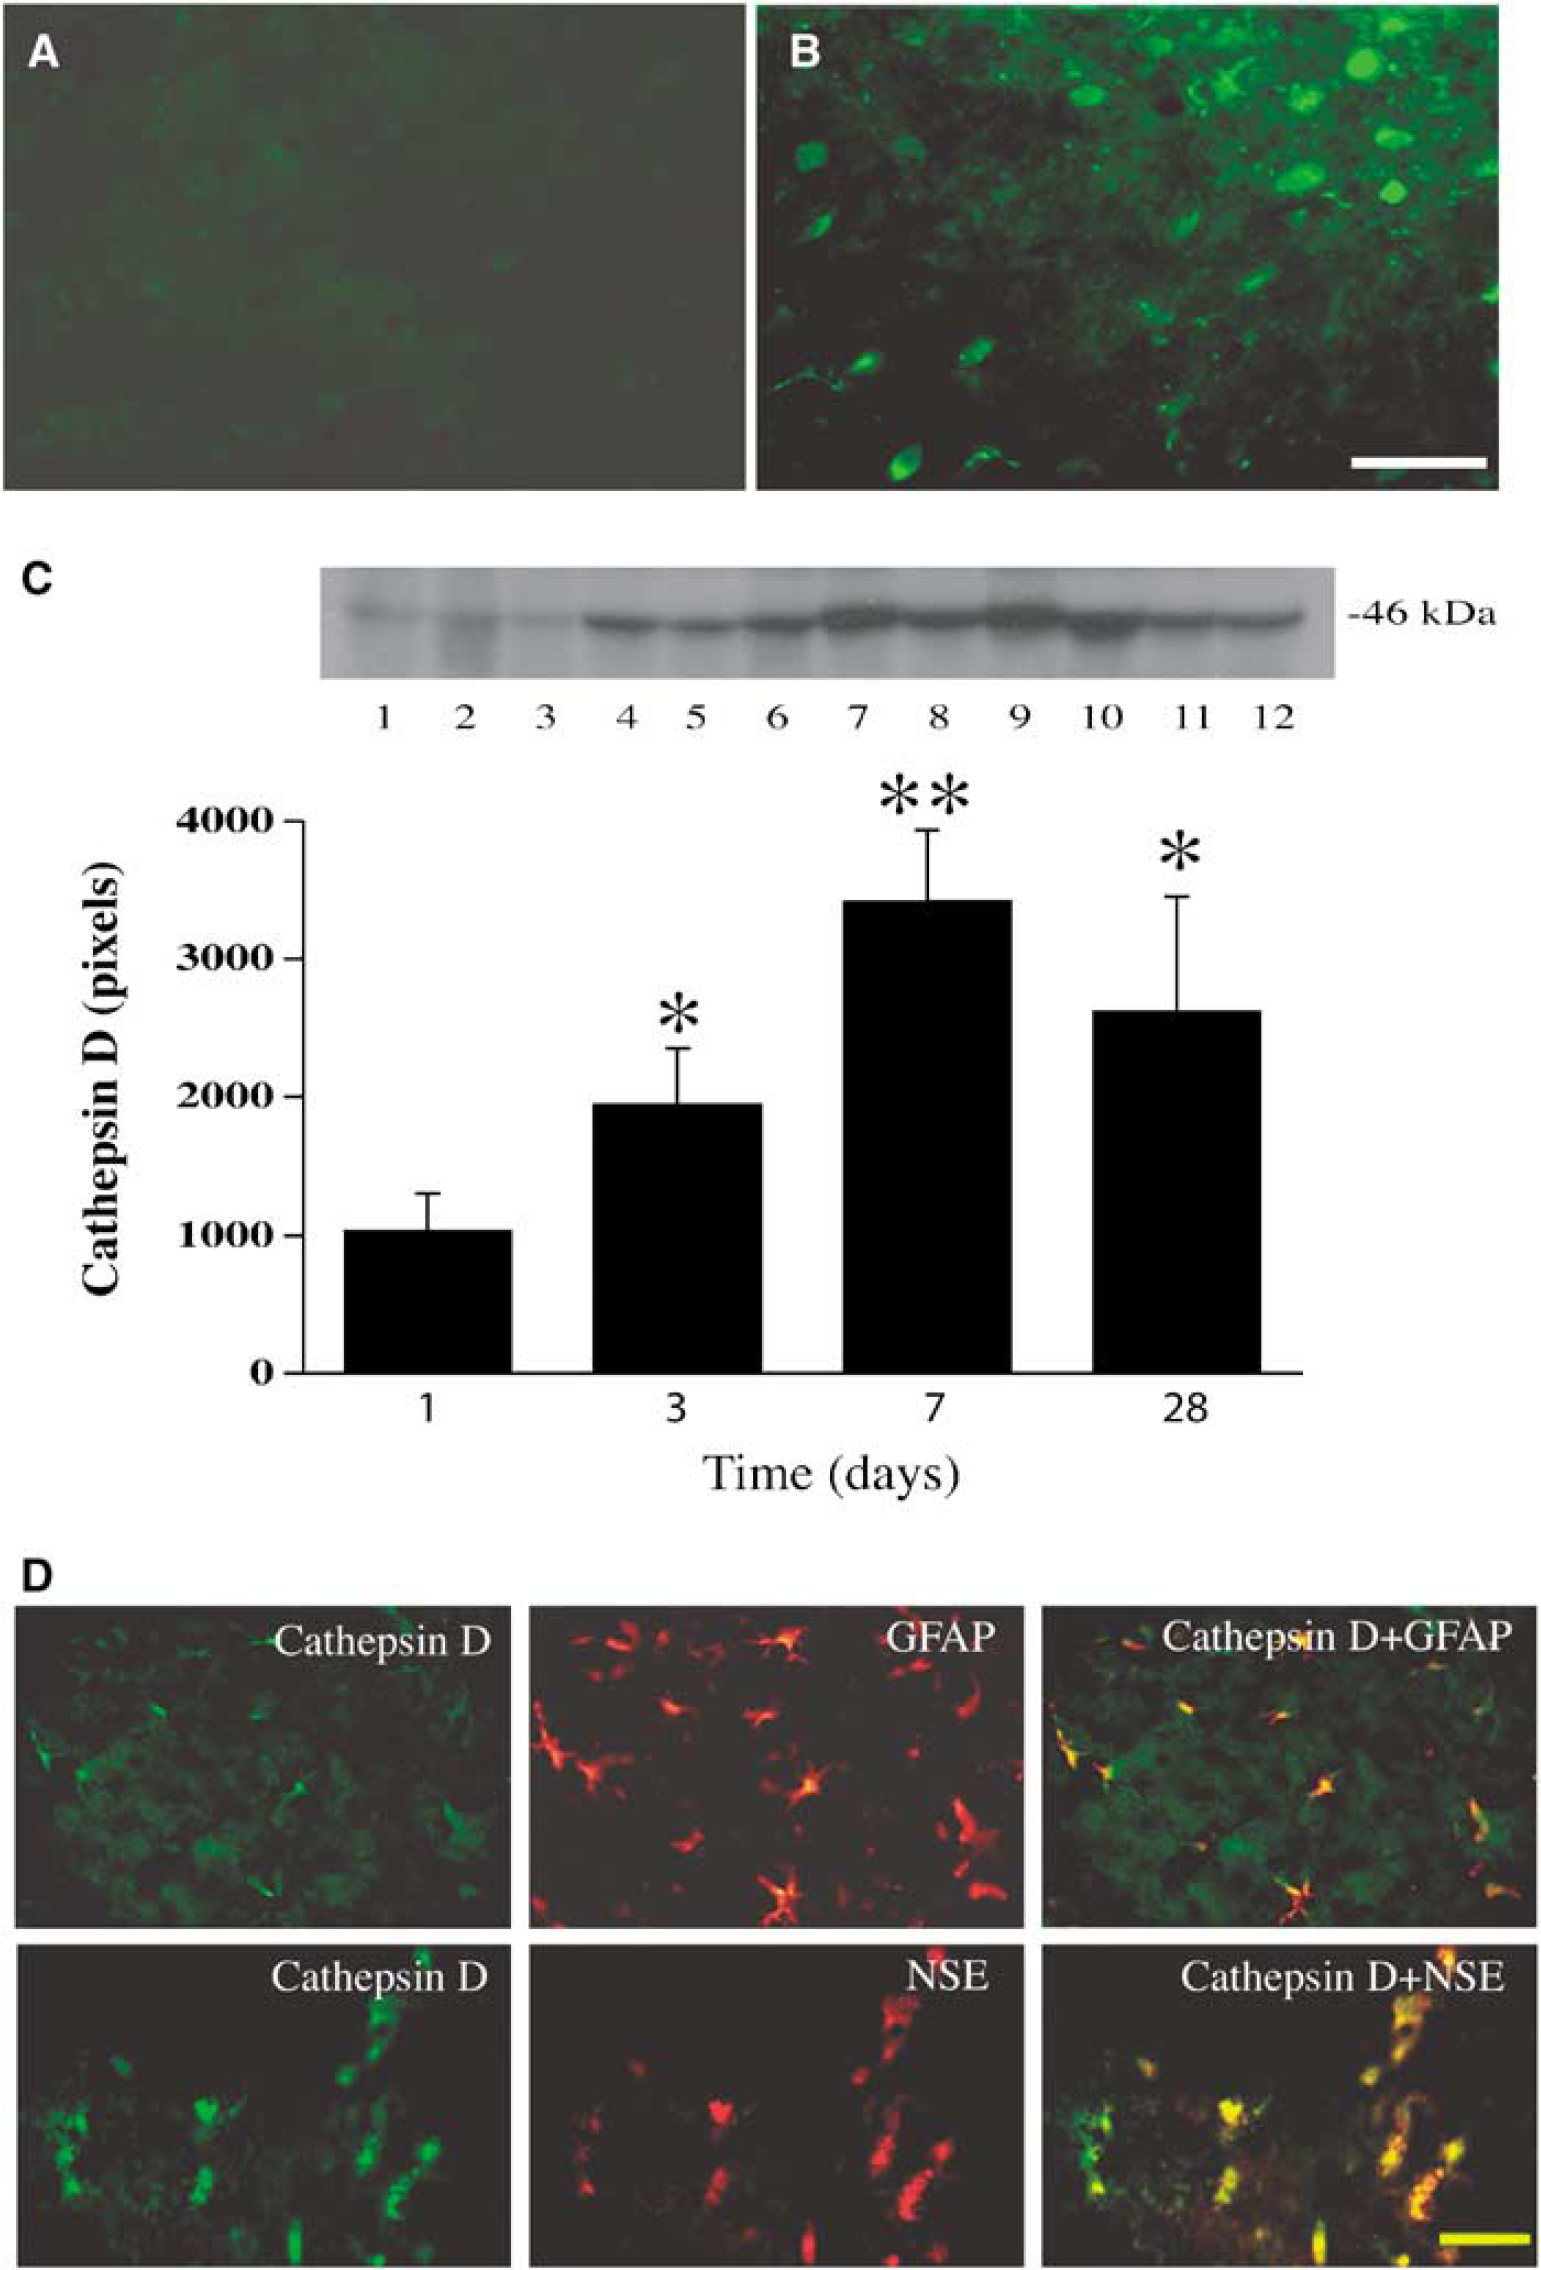
Cathepsin D immunoreactivity in the basal ganglia after ICH. Immunohistochemistry showing immunoreactivity of cathepsin D in the contra- (
According to the morphology and localization, at day 1 after ICH most cathepsin D-positive cells in the perihematomal area were neuron-like, whereas some cathepsin D-positive cells within the hematoma appeared to be neutrophils. However, by days 3 and 7 after ICH most cathepsin D-positive cells in the perihematomal area were glial-like, although some of the positive cells appeared neurons. Double-labeling revealed that cathepsin D was colocalized with glial fibrillary acid protein and NSE (Figure 2D), suggesting that cathepsin D was indeed expressed in both astrocytes and neurons in the perihematomal area 3 days after ICH.
Formation of Vacuoles
Currently, electron microscopy is considered as a sensitive and accurate way to monitor autophagy, both in vitro and in vivo (Martinet et al, 2006). To confirm the existence of autophagic cell death after ICH, the morphology of damaged cells in the perihematomal area at days 3 and 7 was examined by electron microscopy. Electron microscopy demonstrated that cells in the ipsilateral basal ganglia of sham rats (Figure 3A) and the contralateral basal ganglia of rats that underwent ICH (Figure 3B) possessed normal nuclei, mitochondria, synapses, endoplasmic reticulum, and myelinated axons. No autophagic vacuoles were observed. In contrast, numerous cytoplasmic vacuoles containing membranous structures and parts of the cytoplasm were found in the perihematomal area after ICH. This was most prominent at day 7 (Figure 3C and 3D). These structures resembled autophagic vacuoles described in previous studies (Adhami et al, 2006; Nitatori et al, 1995; Xue et al, 1999). According to the ultrastructural morphology, most dying cells containing numerous autophagic vacuoles were glia.
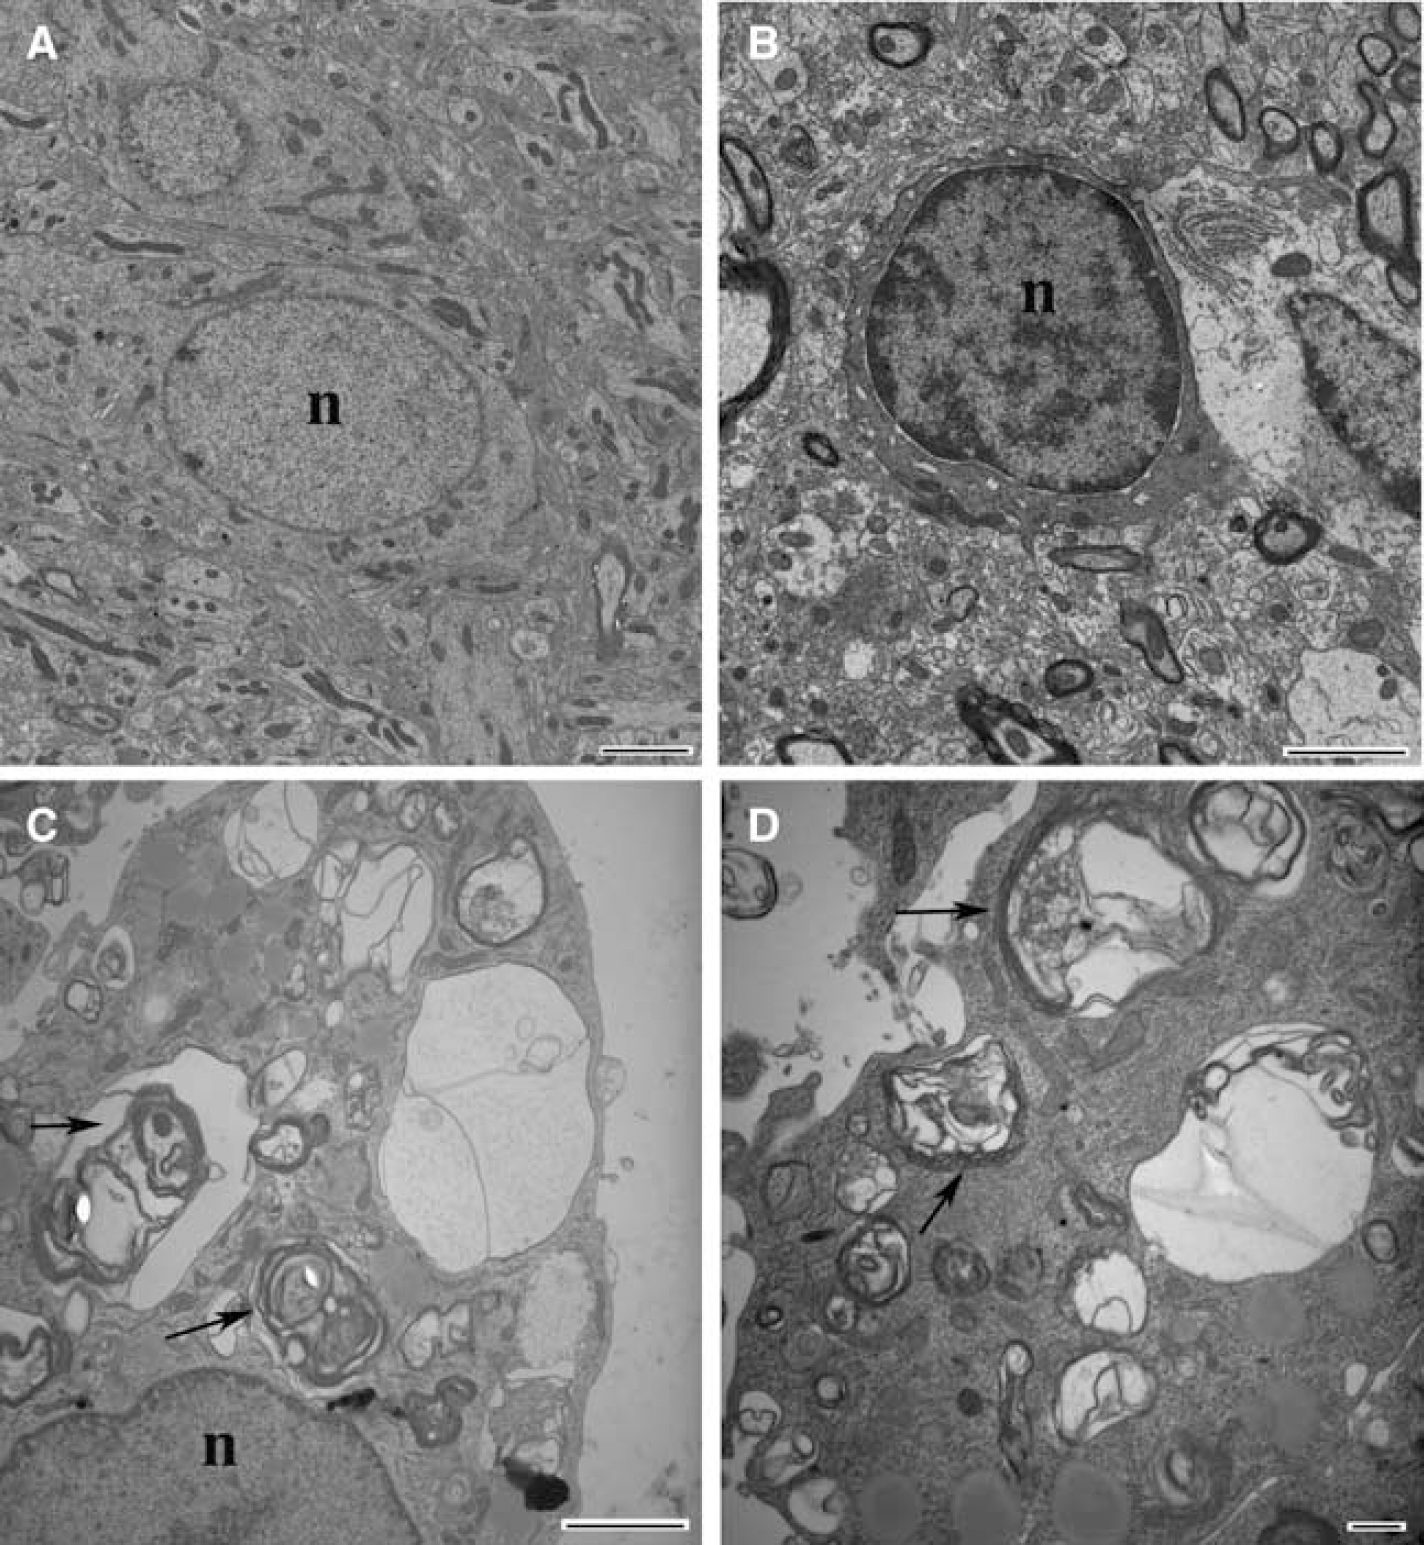
Electron micrographs showing cells in the ipsilateral basal ganglia of sham operated rats (
Autophagy after Intracaudate Injection of Ferrous Iron
To test the potential role of iron in inducing autophagy, ferrous iron was injected into the basal ganglia. Cathepsin D protein levels were significantly increased in the ipsilateral basal ganglia 24 h after ferrous iron injection (3,227 ± 753 pixels) compared to the contralateral basal ganglia (1,765 ± 472 pixels, P <0.05) and that found in shams (1,894 ± 211pixels, P < 0.05; Figure 4A). Twenty-four hours after ferrous iron injection, the ratio of LC3-II/LC3-I in the ipsilateral basal ganglia (0.89 ± 0.18) was also markedly higher than that in the contralateral basal ganglia (0.13 ± 0.05) or in the ipsilateral basal ganglia after needle insertion alone (0.20 ± 0.06, P < 0.01; Figure 4B).
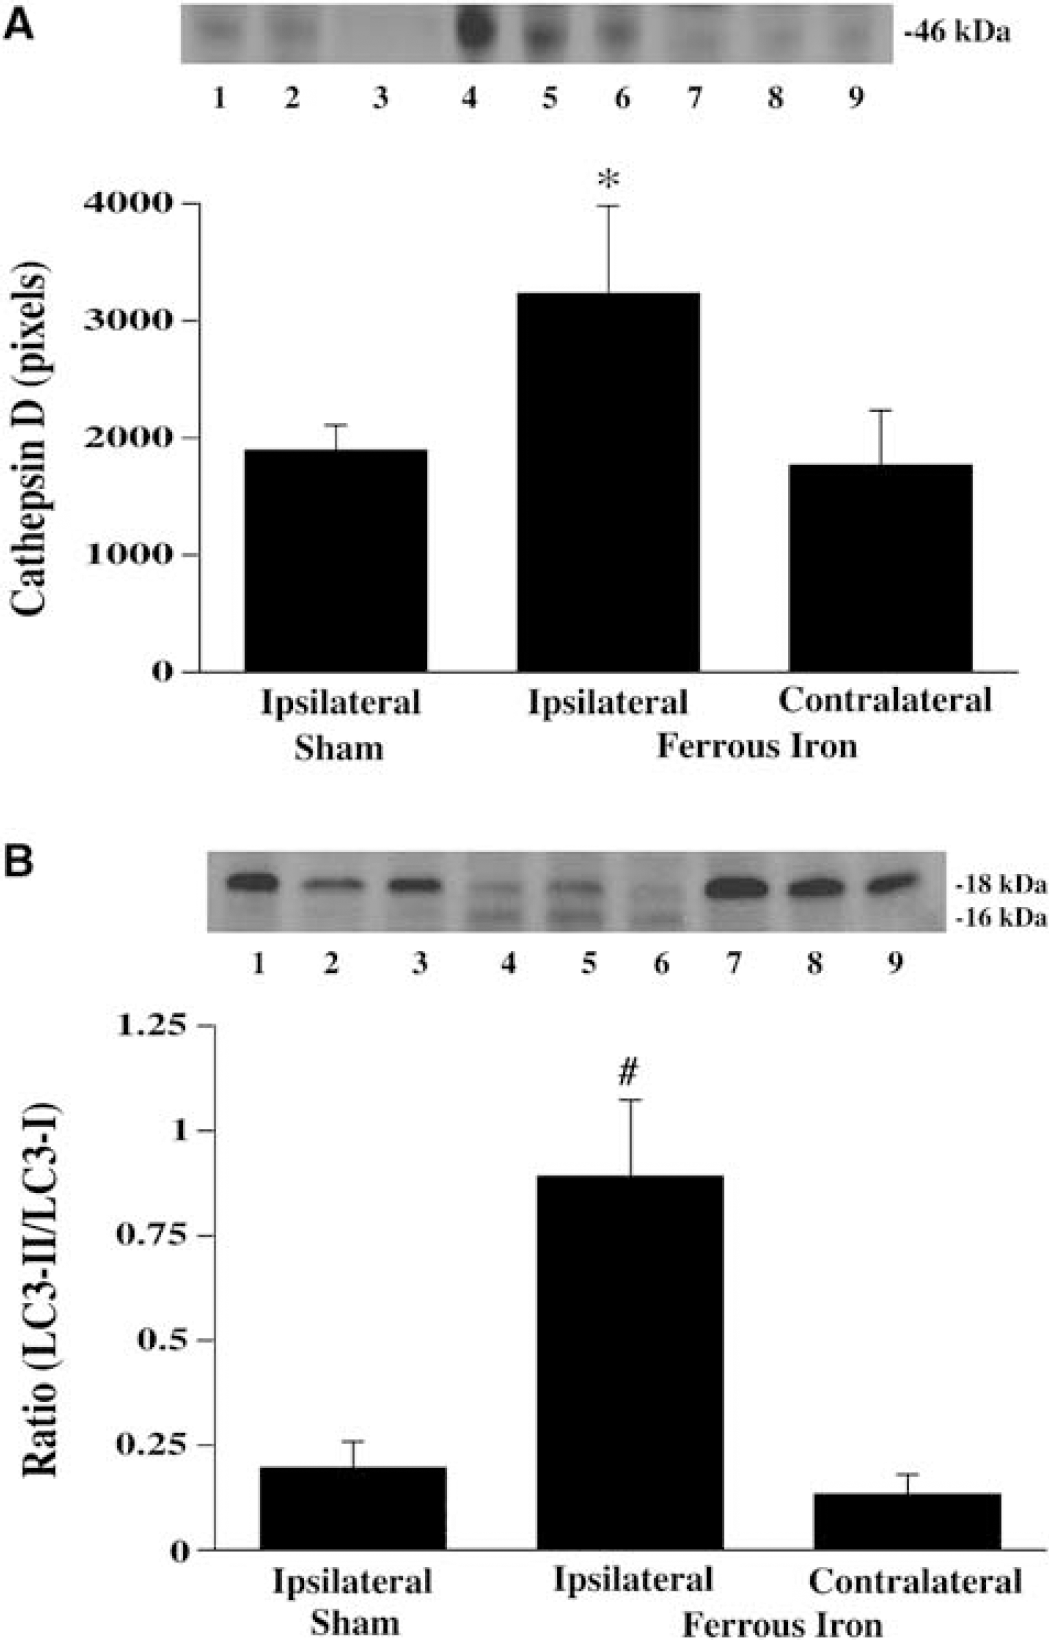
The effect of ferrous iron injection on brain cathepsin D (
Cathepsin D-positive cells were detected in the ipsilateral basal ganglia 24 h after ferrous iron injection, and most cathepsin D-positive cells appeared to be neurons (Figure 5B). There were no cathepsin D-positive cells in the contralateral basal ganglia or in the ipsilateral basal ganglia of sham-operated rats (Figure 5A and 5C).
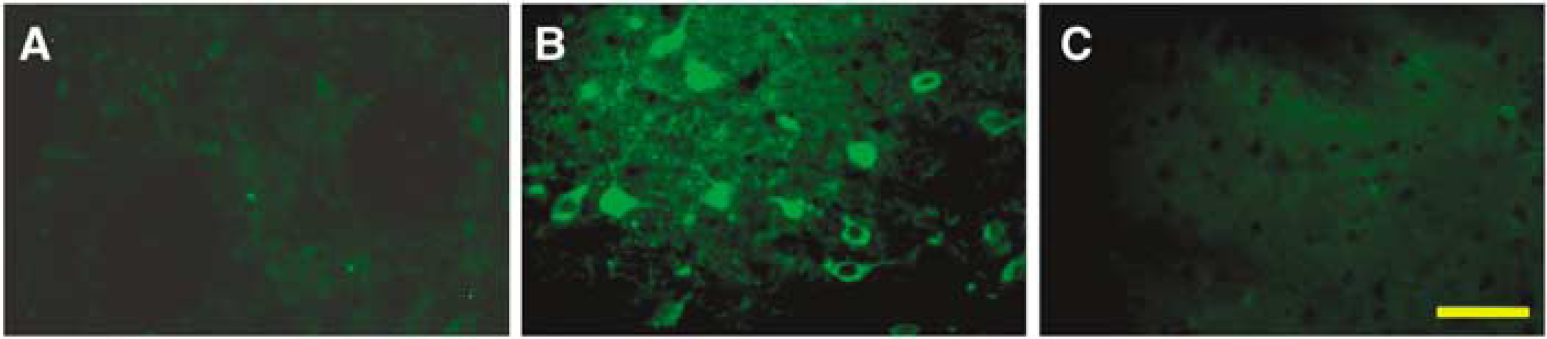
Cathepsin D immunoreactivities in the ipsilateral basal ganglia 24 h after sham operation (
Deferoxamine Reduced ICH-Induced Autophagy
To determine whether ICH-induced autophagic cell death is mediated by iron, we treated rats with deferoxamine, an iron chelator, or vehicle 2 h after ICH. We found that deferoxamine treatment significantly reduced cathepsin D protein levels in the ipsilateral basal ganglia after ICH (1,489 ± 365 versus 2,668 ± 610 pixels in the vehicle-treated rats, P<0.01; Figure 6A). The ratio of LC3-II to LC3-I 7 days after ICH was also decreased by deferoxamine treatment (0.70 ± 0.14 versus 1.60 ± 0.24 in the vehicle-treated rats, P < 0.01; Figure 6B).
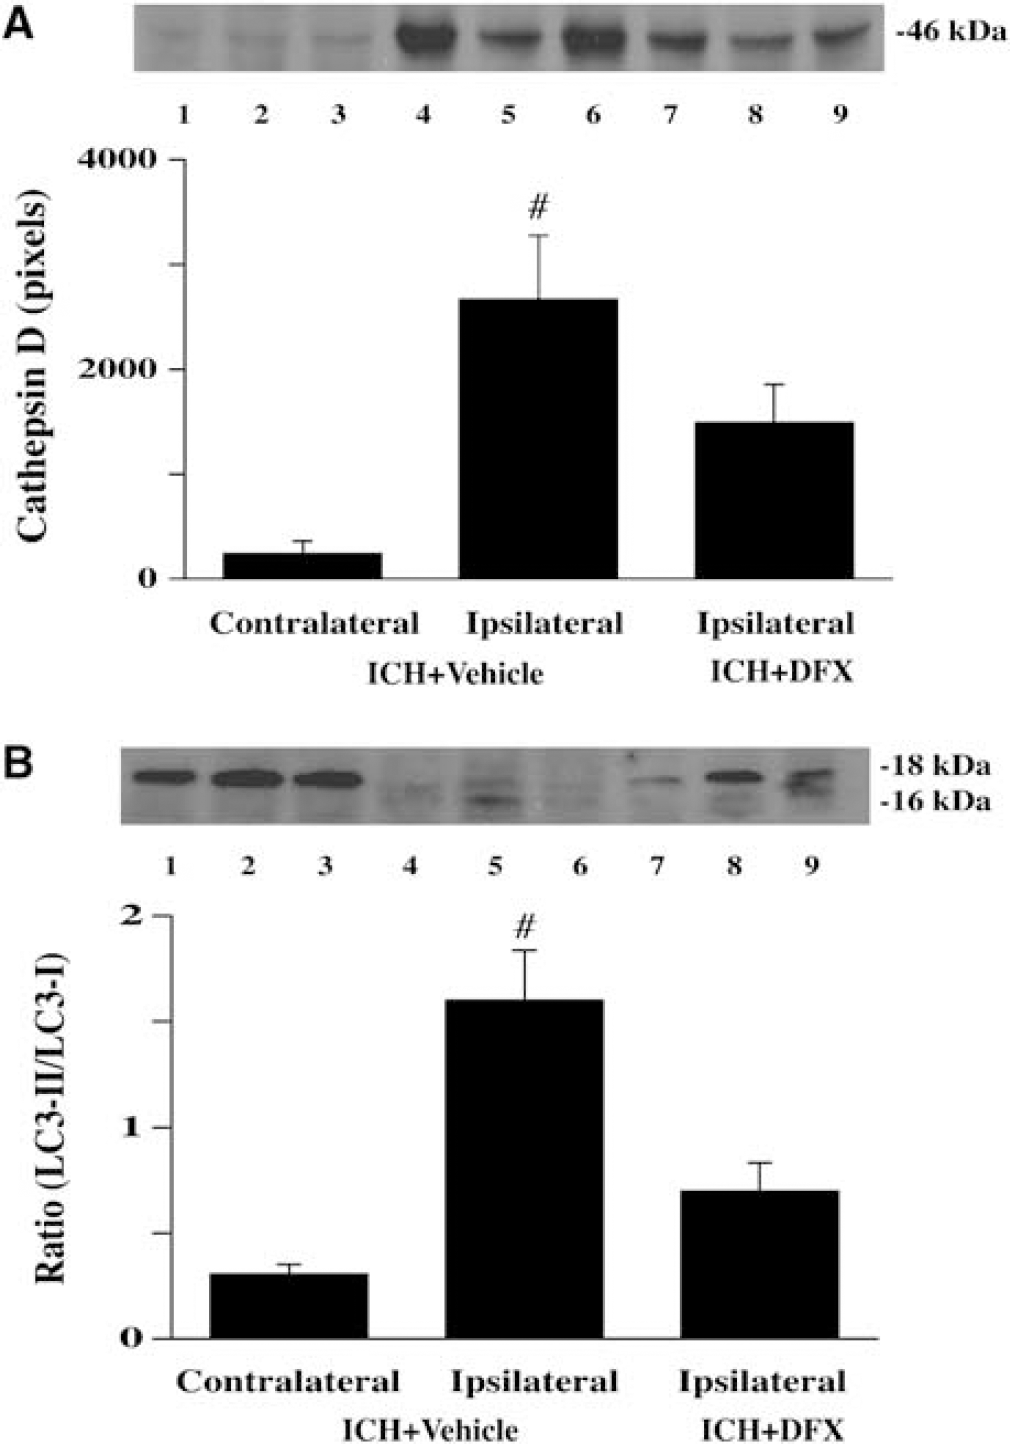
Western blot analysis showing cathepsin D (
Discussion
This study shows that autophagy occurs in the brain after ICH. Intracerebral infusion of ferrous iron into rat striatum also resulted in autophagy, and deferoxamine, an iron chelator, significantly reduced the ICH-induced autophagy suggesting a significant role of iron in ICH-induced autophagic cell death. Because of the large quantities of iron present in hemoglobin within the hematoma, ICH is an extreme case of brain iron overload. However, iron overload has been postulated to be involved in many neurological disorders. The current results suggest that iron may also induce autophagy in those diseases.
Neuronal Death after ICH
Neuronal death results in brain atrophy and such atrophy occurs in patients with ICH (Skriver and Olsen, 1986). We and others have shown that brain atrophy also occurs over several months after ICH in rats (Felberg et al, 2002; Hua et al, 2006). Both necrotic cell death and apoptotic cell death occur in the brain after ICH. Necrotic brain tissue has been found adjacent to the hematoma (Kase and Caplan, 1994). Either mechanical force during hematoma formation or clot-derived neurotoxic factors may cause the necrosis. While apoptosis occurs in the brain adjacent to an ICH (Matsushita et al, 2000; Xue and Del Bigio, 2000), it is not clear whether apoptotic cell death plays an important role in brain damage after ICH (Xi et al, 2006). The present study shows that autophagic cell death also occurs after ICH. Whether autophagy contributes to delayed brain atrophy needs further study.
Autophagic Cell Death
Autophagy is a cellular degradation process in which cellular proteins and organelles are sequestered in double-membrane vesicles known as autophagosomes, delivered to lysosomes, and digested by lysosmal hydrolases (Wang and Klionsky, 2003). Autophagy plays an important role in cellular homeostasis and has been implicated to play a role in cancer, neurodegeneration, and myopathology (Komatsu et al, 2006; Kondo et al, 2005). Recent studies indicate that autophagy occurs in cerebral ischemia (Adhami et al, 2006; Degterev et al, 2005), and enhancing autophagy provides a powerful protective mechanism against ischemia/reperfusion injury in cardiac myocytes (Hamacher-Brady et al, 2006).
Light chain 3 has been used as a marker of autophagy because it was identified as the first mammalian protein localized in the autophagosome membrane (Kabeya et al, 2000). LC3 has two forms: type I is cytosolic and type II is membrane-bound. During autophagy, LC3 type II is increased by conversion from type I and the ratio of LC3-II to LC3-I is correlated with the extent of autophagosome formation. In the present study, the ratio of LC3-II to LC3-I in the ipsilateral basal ganglia was markedly increased by day 7 after ICH, indicating the occurrence of autophagic cell death. There was a decrease in LC3-II to LC3-I ratio by day 28, which may indicate a decrease in the rate of autophagy. However, it is known that LC3-II can be rapidly degraded by lysosomal proteases and this result might also be explained by increased lysosomal activity. Our studies have shown that cathepsin D remains at high levels at least 28 days after ICH.
Cathepsin D is a hydrolytic enzyme in lysosomes that degrades damaged proteins. A recent study showed that cathepsin D can act as an autophagic mediator, and inhibition of cathepsin D prevents the formation of vacuoles (Araki et al, 2006), suggesting that cathepsin D plays an important role in the execution of autophagic cell death. In this study, cathepsin D was increased in neurons and astrocytes at 1 day after ICH, reached a peak at 7 days after ICH, and remained at high levels for at least 28 days. This greater expression of cathepsin D after ICH might indicate increased lysosomal activity and autophagy. However, it should be noted that cathepsin D is not a specific marker for autophagy. It may also be involved in apoptotic cell death. There is evidence showing that cathepsin D participates in apoptosis of PC12 cells after serum deprivation (Shibata et al, 1998). Inhibition of cathepsin D prevents free-radical-induced apoptosis in rat cardiac myocytes (Ollinger, 2000). Previous studies have shown the existence of necrosis and apoptosis in ICH (Matsushita et al, 2000; Qureshi et al, 2003). Therefore, it is possible that increased activity of cathepsin D may be involved in both apoptotic and autophagic cell death, and this might also contribute to the difference in time course between cathepsin D and the LC3-II to LC3-I ratio.
Electron microscopy is currently considered as the most sensitive and accurate way to determine whether cells are undergoing autophagy. Numerous autophagic vacuoles were found in the perihematomal area, particularly 7 days after ICH. These autophagic vacuoles contain multi-vesicular bodies and organelles surrounded by a sequestering membrane. According to ultrastructural morphology, most of the damaged cells containing numerous autophagic vacuoles appeared to be glial cells and neurons. Cells in the sham-ipsilateral and the ICH-contralateral basal ganglia possessed normal nucleus, mitochondria, synapses, endoplasmic reticulum, myelinated axon, and no autophagic vacuoles.
Taken together, our results indicate that autophagy is present in the perihematomal area after ICH. The function of autophagy after ICH, however, still remains unclear. Autophagy after ICH might be beneficial or harmful. There is evidence showing that autophagy in certain pathological situations can trigger and mediate programmed cell death (Tolkovsky et al, 2002; Yu et al, 2004). However, autophagy can also be important for cell survival. A recent study has shown that enhancing autophagy plays a protective role in ischemic/reperfusion injury in cardiac myocytes (Hamacher-Brady et al, 2006).
Role of Iron in ICH-Induced Autophagic Cell Death
After ICH, iron concentrations in the brain can reach very high levels and non-heme iron is not cleared from the brain within 4 weeks (Wu et al, 2003). Experimental studies have demonstrated that iron overload contributes to ICH-induced brain injury via many pathways, such as lipid peroxidation and formation of free radicals (Wagner et al, 2003). Oxidative stress has been implicated to play a role in induction of autophagy (Kiffin et al, 2006). Therefore, iron may be an important trigger for ICH-induced autophagic cell death. In the present study, we demonstrated that the ratio of LC3-II to LC3-I and cathepsin D protein levels were significantly increased by 24 h after ferrous iron injection. Deferoxamine significantly reduced cathepsin D protein levels and the ratio of LC3-II to LC3-I after ICH, indicating that iron has an important role in inducing autophagic cell death after ICH. However, the effects of deferoxamine were incomplete, suggesting that factors other than iron may also participate in the induction of autophagy after ICH.
Our previous studies have shown that iron overload in the brain is harmful after ICH (Hua et al, 2003, 2006; Nakamura et al, 2004, 2005b; Wu et al, 2003, 2002). Here, we found that iron can induce autophagy and deferoxamine can reduce ICH-induced autophagy, suggesting that one of the beneficial effects of deferoxamine may be to reduce autophagy-mediated cell death.
Iron overload is thought to participate in many neurodegenerative disorders including Alzheimer's disease, Parkinson's disease, Friedreich ataxia, and neuroferritonopathy (Zecca et al, 2004). Recently, there has also been considerable recent interest in the role of autophagy in such disorders, whether it is beneficial or harmful, and whether defective autophagy participates in these diseases (Nixon, 2006). The current study suggests that there may be a link between the occurrence of iron overload and autophagy in these disease states, a link that merits further investigation.
In summary, the present study showed that ICH induces autophagy form of programmed cell death, and iron is an important factor in inducing autophagic cell death in ICH. As in other neurological diseases, more work is needed to determine whether autophagy is protective (removal of dying cells) or harmful (inducing death in potentially viable cells). However, an understanding of the mechanisms of ICH-induced autophagic cell death should be helpful in seeking effective new treatments for ICH. The link between iron and autophagy may also be of importance in many CNS disorders where iron has been postulated to be involved in brain injury.
Disclosure/Conflict of Interest
None.