
Abstract
Many therapies have shown promise in preclinical stroke studies, but few benefit patients. A greater understanding of stroke pathophysiology is needed to successfully develop therapies, and this depends on appropriate animal models. The collagenase and blood infusion models of intracerebral hemorrhage (ICH) are widely used; yet, investigators often prefer using one model for a variety of reasons. Thus, we directly compared these to highlight advantages and limitations of each as well as the assessment approach. An ICH was created by infusing blood or bacterial collagenase into the rats' striatum. We matched initial hematoma volume in each model (Experiment 1) and assessed the time course of bleeding (Experiment 2). Functional deficits and the progression of injury were tracked over 6 weeks using behavior, magnetic resonance imaging, and histology (Experiment 3). Despite similar initial hematoma volumes, collagenase-induced ICH resulted in a greater blood—brain barrier breakdown and more damage to the striatum, substantia nigra, white matter, and cortex. Magnetic resonance imaging revealed faster hematoma resolution in the blood model, and little increase in the volume of tissue lost from 1 to 6 weeks. In contrast, tissue loss continued over 4 weeks in the collagenase model. Finally, functional deficits recovered more quickly and completely in the blood model. This study highlights key differences between these models and that neither closely replicates the human condition. Thus, both should be used whenever possible taking into account the significant differences between these models and their limitations. Furthermore, this work illustrates significant weaknesses with several outcome measures.
Introduction
Intracerebral hemorrhage (ICH) is one of the deadliest types of stroke (Mayo et al, 1996), and it leaves many survivors disabled (Broderick et al, 1999). As with ischemic stroke, there is an expectation and some evidence that hemostatic and cytoprotective treatments will lessen mortality and morbidity. Unfortunately, no cytoprotective treatment tested to date provides benefit for ICH patients, and the hemostatic agent recombinant activated factor VII failed to reduce mortality or disability in a recent phase III clinical trial (Mayer et al, 2007). Therefore, effective treatments for ICH are still desperately needed and are dependent on a thorough understanding of pathophysiology (Report from a National Institute of Neurological Disorders and Stroke workshop, 2005). Fortunately, the number of experimental ICH studies has increased dramatically over the past decade, and much progress has been made in characterizing injury and its underlying mechanisms, thus leading to many putative therapeutic targets and treatments.
In vivo rodent models contribute greatly in this regard. However, despite the plethora of promising therapies tested in preclinical stroke studies, the majority has not benefited stroke patients. As clearly stated in numerous reviews (Gladstone et al, 2002; Report from a National Institute of Neurological Disorders and Stroke workshop, 2005; Wahlgren and Ahmed, 2004) and the Stroke Therapy Academic Industry Roundtable reports (Recommendations for clinical trial evaluation of acute stroke therapies, 2001; Stroke Therapy Academic Industry Roundtable (STAIR), 1999), this translation failure results from limitations in both experimental and clinical stroke studies. Notably, investigators do not often rigorously assess efficacy in preclinical rodent studies. That is, they do not frequently and comprehensively gauge long-term histologic and functional outcome. As well, progress has been hindered by the lack of animal models that truly mimic the pathophysiology of human stroke. Until such animal models are developed, rigorous preclinical testing requires the use of multiple stroke models as recommended by recent reports.
There are two widely used rodent ICH models (Andaluz et al, 2002). One involves infusing autologous whole blood (Bullock et al, 1984), usually into the striatum, whereas the other uses bacterial collagenase (Rosenberg et al, 1990). The blood model mimics a single large bleed that was thought to occur in most ICH patients (Herbstein and Schaumberg, 1974), but does not reproduce spontaneous bleeding. More recent clinical data (e.g., using imaging) suggest that bleeding continues for up to 24 h in many ICH patients (Brott et al, 1997; Fujii et al, 1994; Kazui et al, 1996). Thus, the blood model is not appropriate for studying ongoing bleeding or interventions that might affect bleeding. Instead, it is routinely used to investigate mechanisms of hemorrhagic damage (Xi et al, 2006). However, it is of limited use for long-term studies, because the relatively mild brain injury leads to more subtle functional deficits at late survival times (Hua et al, 2002; MacLellan et al, 2006b, c ). Bacterial collagenase disrupts the basal lamina of cerebral blood vessels causing blood to leak into the surrounding brain tissue. It is widely used in part owing to simplicity and the belief that the model results in more consistent hemorrhaging. However, some investigators prefer to use alternative models because of the belief that collagenase produces an exaggerated inflammatory response and is directly toxic to neurons (Report from a National Institute of Neurological Disorders and Stroke workshop, 2005). Importantly, several groups (Chu et al, 2004; Matsushita et al, 2000) using in vitro assays have shown that collagenase, at concentrations approximating those used in vivo, does not cause neuronal death or inflammation, whereas larger doses of collagenase are toxic to neurons. Although functional outcome (Hua et al, 2002; MacLellan et al, 2006b, c ) and the progression of cell death (Del Bigio et al, 1996; Felberg et al, 2002) have been well characterized in both models, investigators often prefer one model over the other.
In this study, we directly compared the progression of injury and functional recovery in these commonly used ICH models. Magnetic resonance imaging (MRI) was used to track evolution of the hematoma and blood—brain barrier (BBB) breakdown, and histologic analyses were used to evaluate long-term injury in the striatum and distal regions. We also repeatedly assessed neurologic deficits. We hypothesized that even when matched for initial hematoma volume, the collagenase model would result in greater histologic injury and functional impairment. Our findings highlight key differences between the models and emphasize the importance of using multiple models and end points when evaluating putative stroke therapies.
Materials and methods
Animals
All animal procedures conformed to Canadian guidelines and were approved by Animal Care Committees at the Universities of Alberta and Manitoba.
We used 145 male Sprague—Dawley rats weighing ~300g and at ~3 months old. Experiments 1 (N = 40) and 2 (N = 60) determined bleeding profiles and hematoma size in two ICH models, whereas Experiment 3 (N = 45) compared behavior and lesion size (histopathology, MRI).
Intracerebral Hemorrhage
Rats were anesthetized with isoflurane (70% N2O and 30% O2; 4% induction, 2% maintenance) and placed in a stereotaxic frame for aseptic surgery. Marcaine (Sanofi Canada, Markham, ON, Canada) was injected under the scalp ~10 mins before making an incision. A 26-G needle was inserted 6.0 mm deep through a small burr hole made 3.5 mm right of and at the anteroposterior level of bregma. Autologous blood (Bullock et al, 1984; MacLellan et al, 2006b, c ) (100 μL taken from the tail within 60 secs of infusion) or bacterial collagenase (MacLellan et al, 2006a; Rosenberg et al, 1990) (0.2 U in 1.0 μL sterile saline) was infused into the striatum over 10 mins. The needle was slowly removed after an additional 10 mins delay to prevent backflow. The hole was sealed with bone wax and the wound sutured. Body temperature was maintained near normothermia (37.0°C) during surgery with a rectal probe and a heating blanket. Postoperative temperature was not measured or controlled as neither model causes post-ICH temperature alterations (MacLellan et al, 2006b, 2004).
Spectrophotometric Hemoglobin Assay (Experiments 1 and 2)
Hematoma volume was assessed at various times after ICH using a hemoglobin assay described previously (Choudhri et al, 1997; MacLellan et al, 2004). In Experiment 1, we attempted to match the collagenase insult to the standard 100 μL blood model at 12 h post-ICH. After testing several doses (pilot data not included in this study), we used 0.2 U of collagenase to create a similar hematoma volume. In Experiment 2, hematoma volume was measured at 1, 2, and 4 h after induction of ICH to assess the bleeding profiles in each model (N = 10/time/model). The difference in hematoma volume in Experiments 1 and 2 was due to different batches of collagenase. Experiments 1 and 3 used the same batch of collagenase.
Magnetic Resonance Imaging (Experiment 3)
Images were acquired at 6 h, 12 h, 2 days, 4 days, 1 week, 2 weeks, 4 weeks, and 6 weeks after ICH on a Bruker Biospec 7T/21 cm spectrometer using a 3.2cm internal diameter volume coil. Half of the rats were imaged at 6 h, 2 days, 2 weeks, 4 weeks, and 6 weeks after ICH, and the others at 12 h, 4 days, 1 week, 4 weeks, and 6 weeks. Rats were anesthetized with isoflurane and kept normothermic during imaging (~40 mins). Anatomic images were acquired using a standard multislice T2-weighted spin-echo method with field of view 3.5 × 3.5 cm2, matrix 256 × 256, slice thickness 0.8 mm, slice gap 0.2 mm, recovery time 1,600 ms, echo time 80 ms, and four averages. Ten slices acquired from +4.7 to −4.3 mm from bregma using the pituitary and anterior commissure as landmarks were used to evaluate the evolution of the hematoma and volume of injury.
The integrity of the BBB was examined in a subset of rats at 12 h (N = 3/group), 2 days (N = 4/group), and 4 days (N = 6/group) after ICH by measuring Gd(DTPA) contrast enhancement in the hematoma and in a 1.5 mm thick region of tissue surrounding it. Following T2-weighted imaging, a set of 10 T1-weighted images (TE = 13 ms, TR = 600 ms) was obtained, with position and size identical to the T2-weighted images. A bolus of 0.4 mmol/kg of Gd-DTPA (dimeglumine salt, 0.5 mmol/L; Berlex Canada, Point-Claire, Quebec, Canada) was injected through a tail vein cannula, and two sets of contrast-enhanced T1-weighted images (acquisition time 10 mins each) were obtained. To highlight the areas of BBB breakdown (Schellenberg et al, 2007), a map of the percent change in signal intensity owing to contrast enhancement relative to a pre-injection T1-weighted image was calculated as
% signal intensity increase = ((postcontrast image—precontrast image)/(precontrast image)) × 100
The percent change in signal intensity in homotopic regions of the contralateral hemisphere served as a control.
Functional Assessment (Experiment 3)
Behavior was assessed the day before ICH and from 1 day to 1 month after ICH using a Neurological Deficit Scale that included tests of spontaneous circling, contralateral forelimb flexion, hindlimb retraction, beam walking ability, and bilateral forepaw grasp (MacLellan et al, 2006a). A score of 14 indicates maximum impairment, whereas 0 denotes none.
Histopathology (Experiment 3)
Rats were euthanized 6 weeks after ICH by pentobarbital overdose (85 mg/kg) followed by cardiac perfusion with saline and then 10% formalin. Coronal sections (20 μm) were taken every 200 μm from +4.0 to −5.8 mm from bregma. Sections were stained with cresyl violet, and the volume of lesion (e.g., cavity, cellular debris) and atrophy (e.g., ventriculomegaly) was calculated using ImageJ 4.0 (Scion Corporation, Frederick, MD, USA) as routinely performed (MacLellan et al, 2006b,
c
). Tissue loss was also calculated in this manner using MR images obtained 6 h to 6 weeks after ICH as
volume of tissue lost = remaining volume of non-injured hemisphere—remaining volume of injured hemisphere volume of a hemisphere = average (area of coronal section of the hemisphere—area of ventricle—area of damage) × section interval × number of sections.
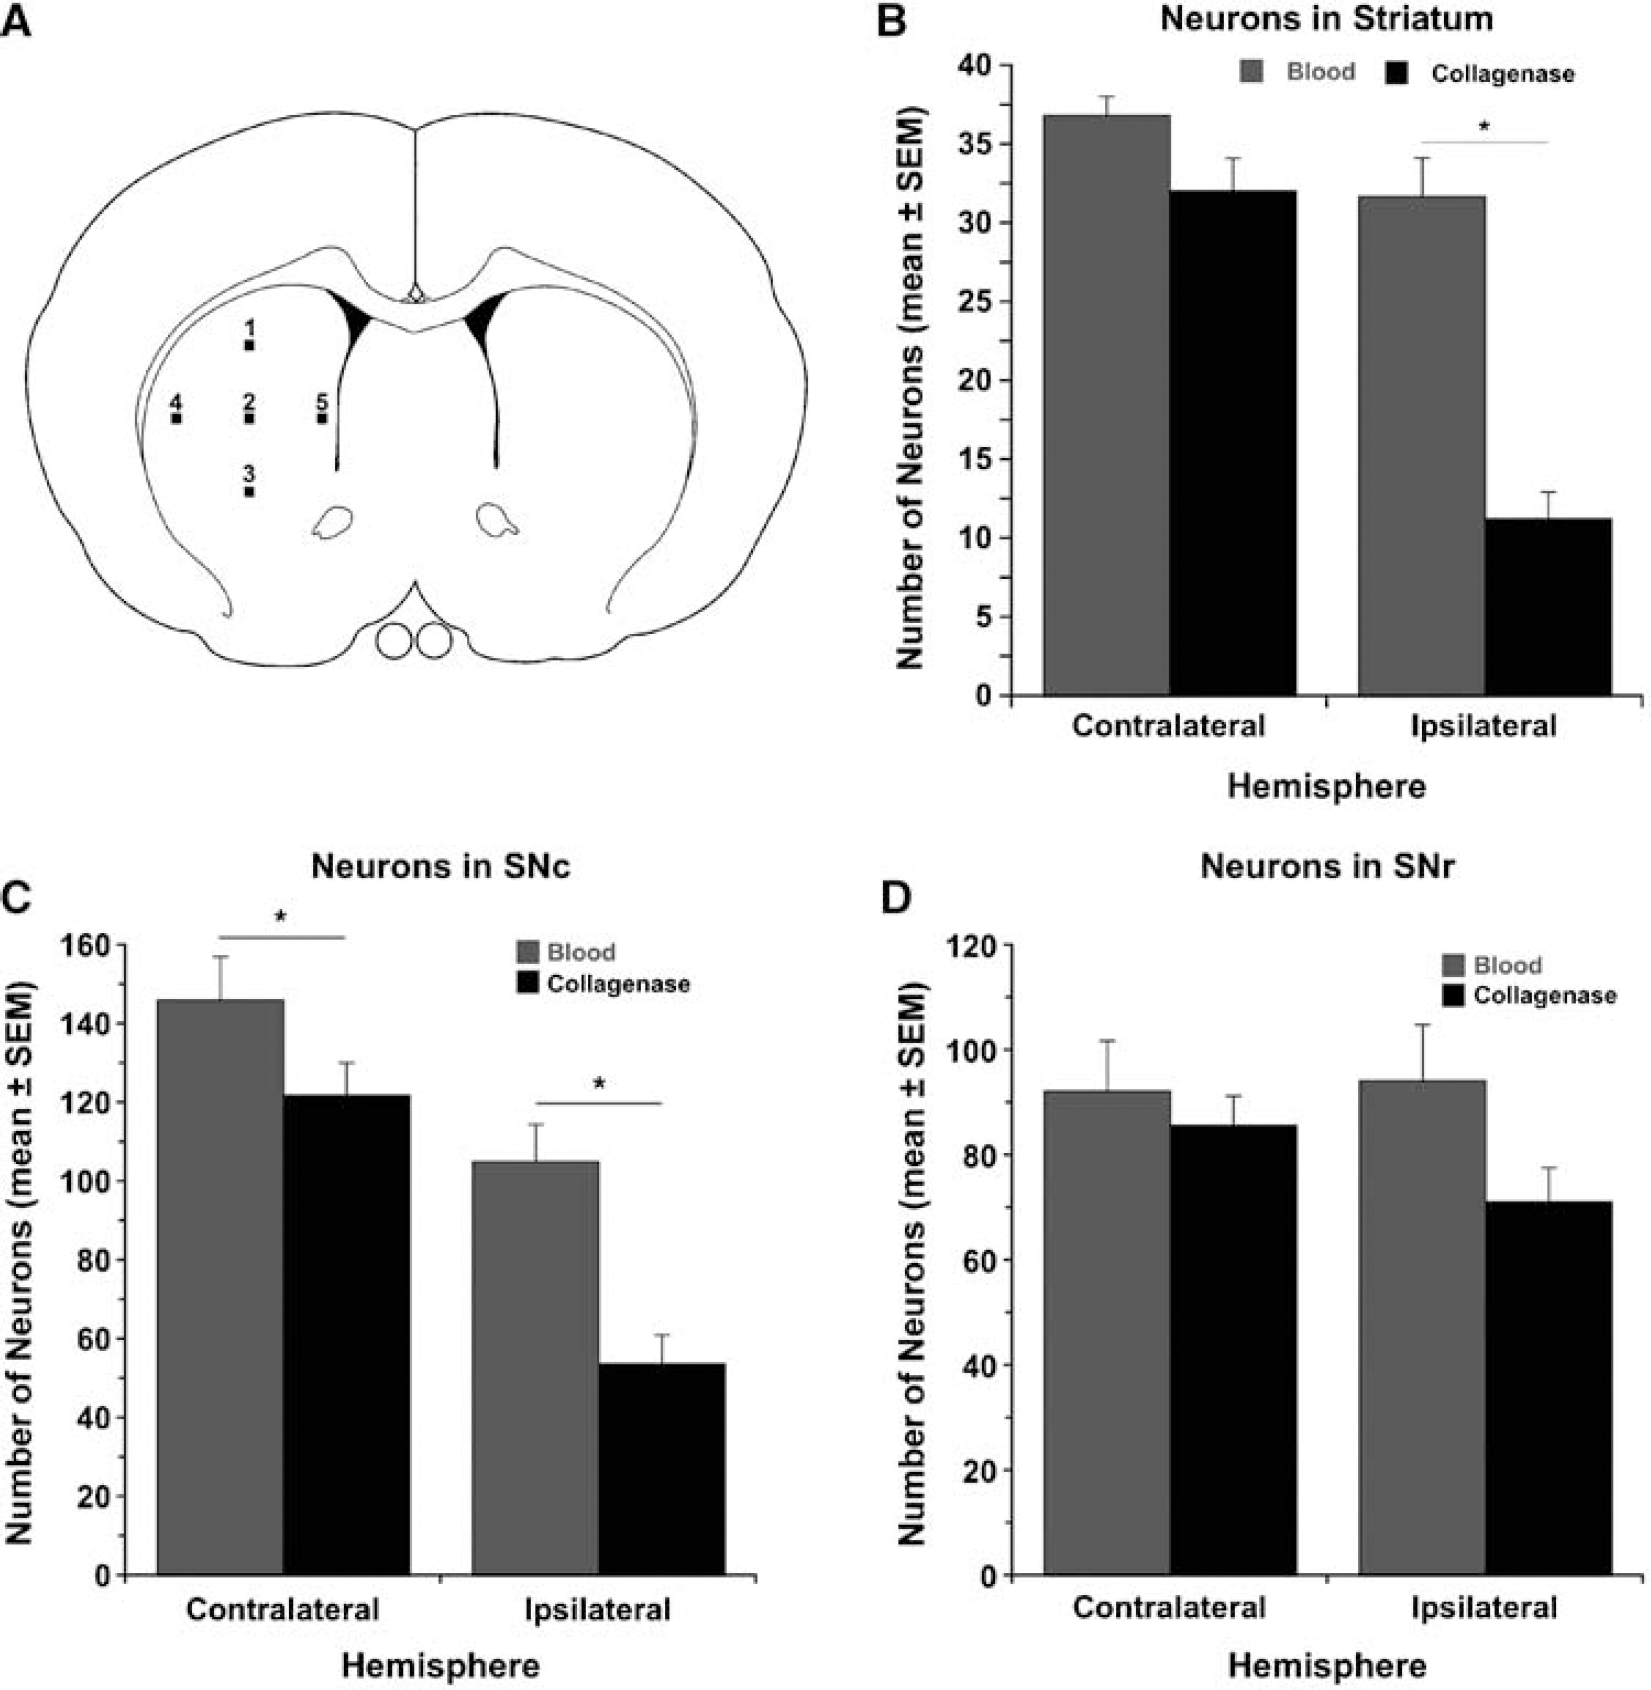
Striatal neuronal loss was estimated according to established methods (Felberg et al, 2002) with modification. Briefly, striatal neurons were counted at × 400 magnification in five areas (250 μm × 250 μm grids) per hemisphere in the section with the maximum hematoma diameter (Figure 3A illustrates preselected locations). Neurons were also counted in the substantia nigra pars compacta (SNc) and pars reticulata (SNr) at −5.8 mm to bregma.
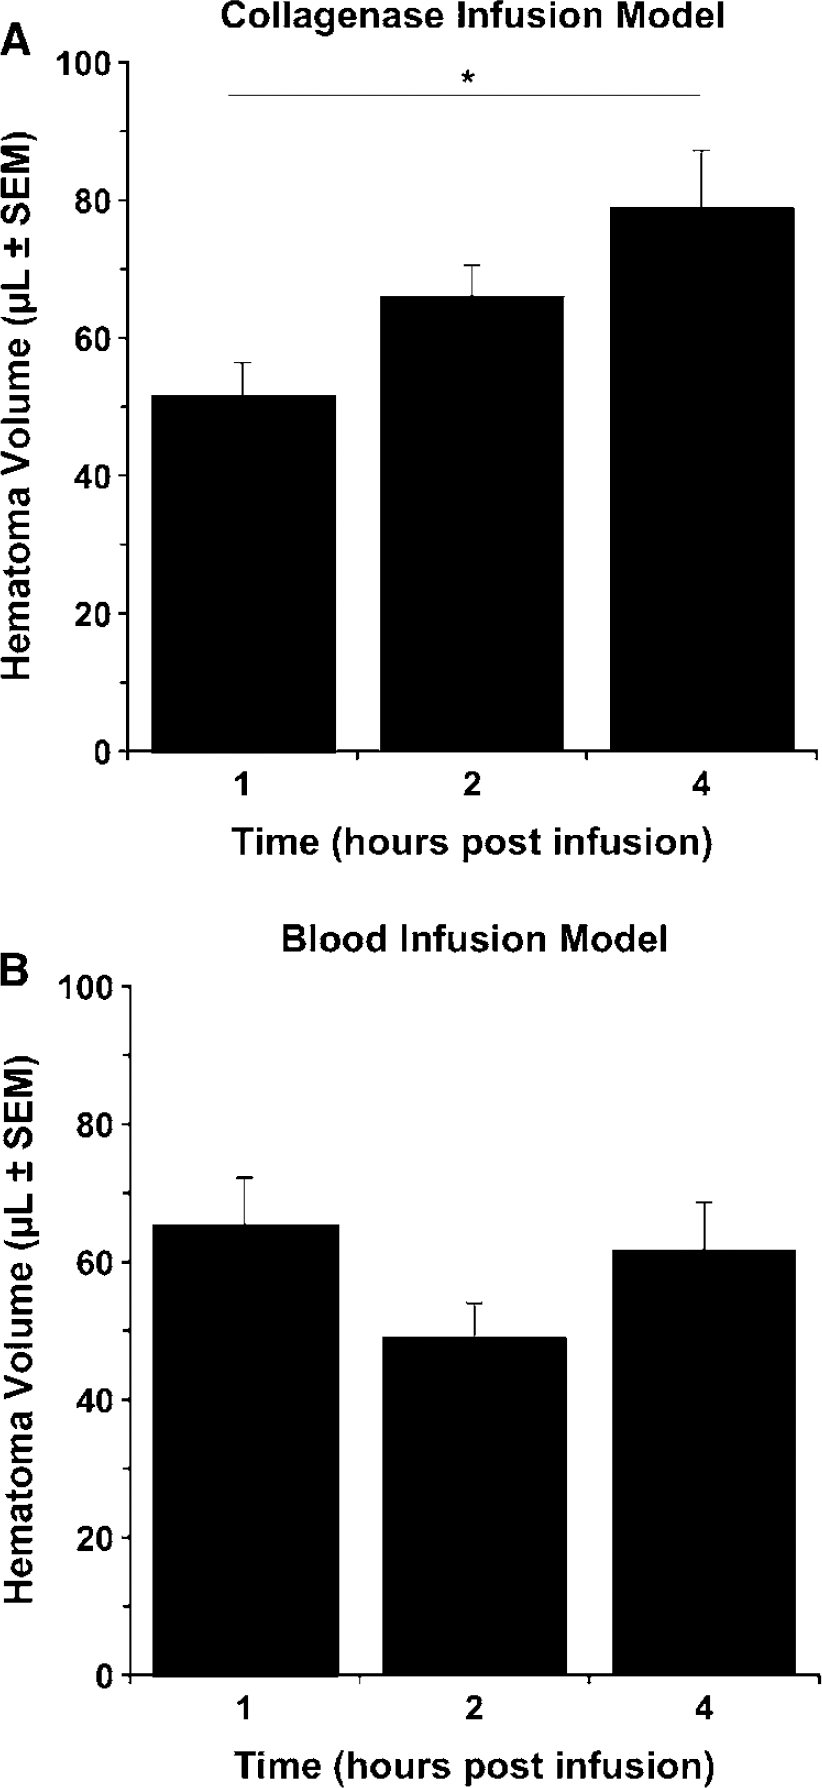
Hematoma volume (mean±s.e.m.) at 1, 2, and 4 h after ICH induced by infusion of collagenase (
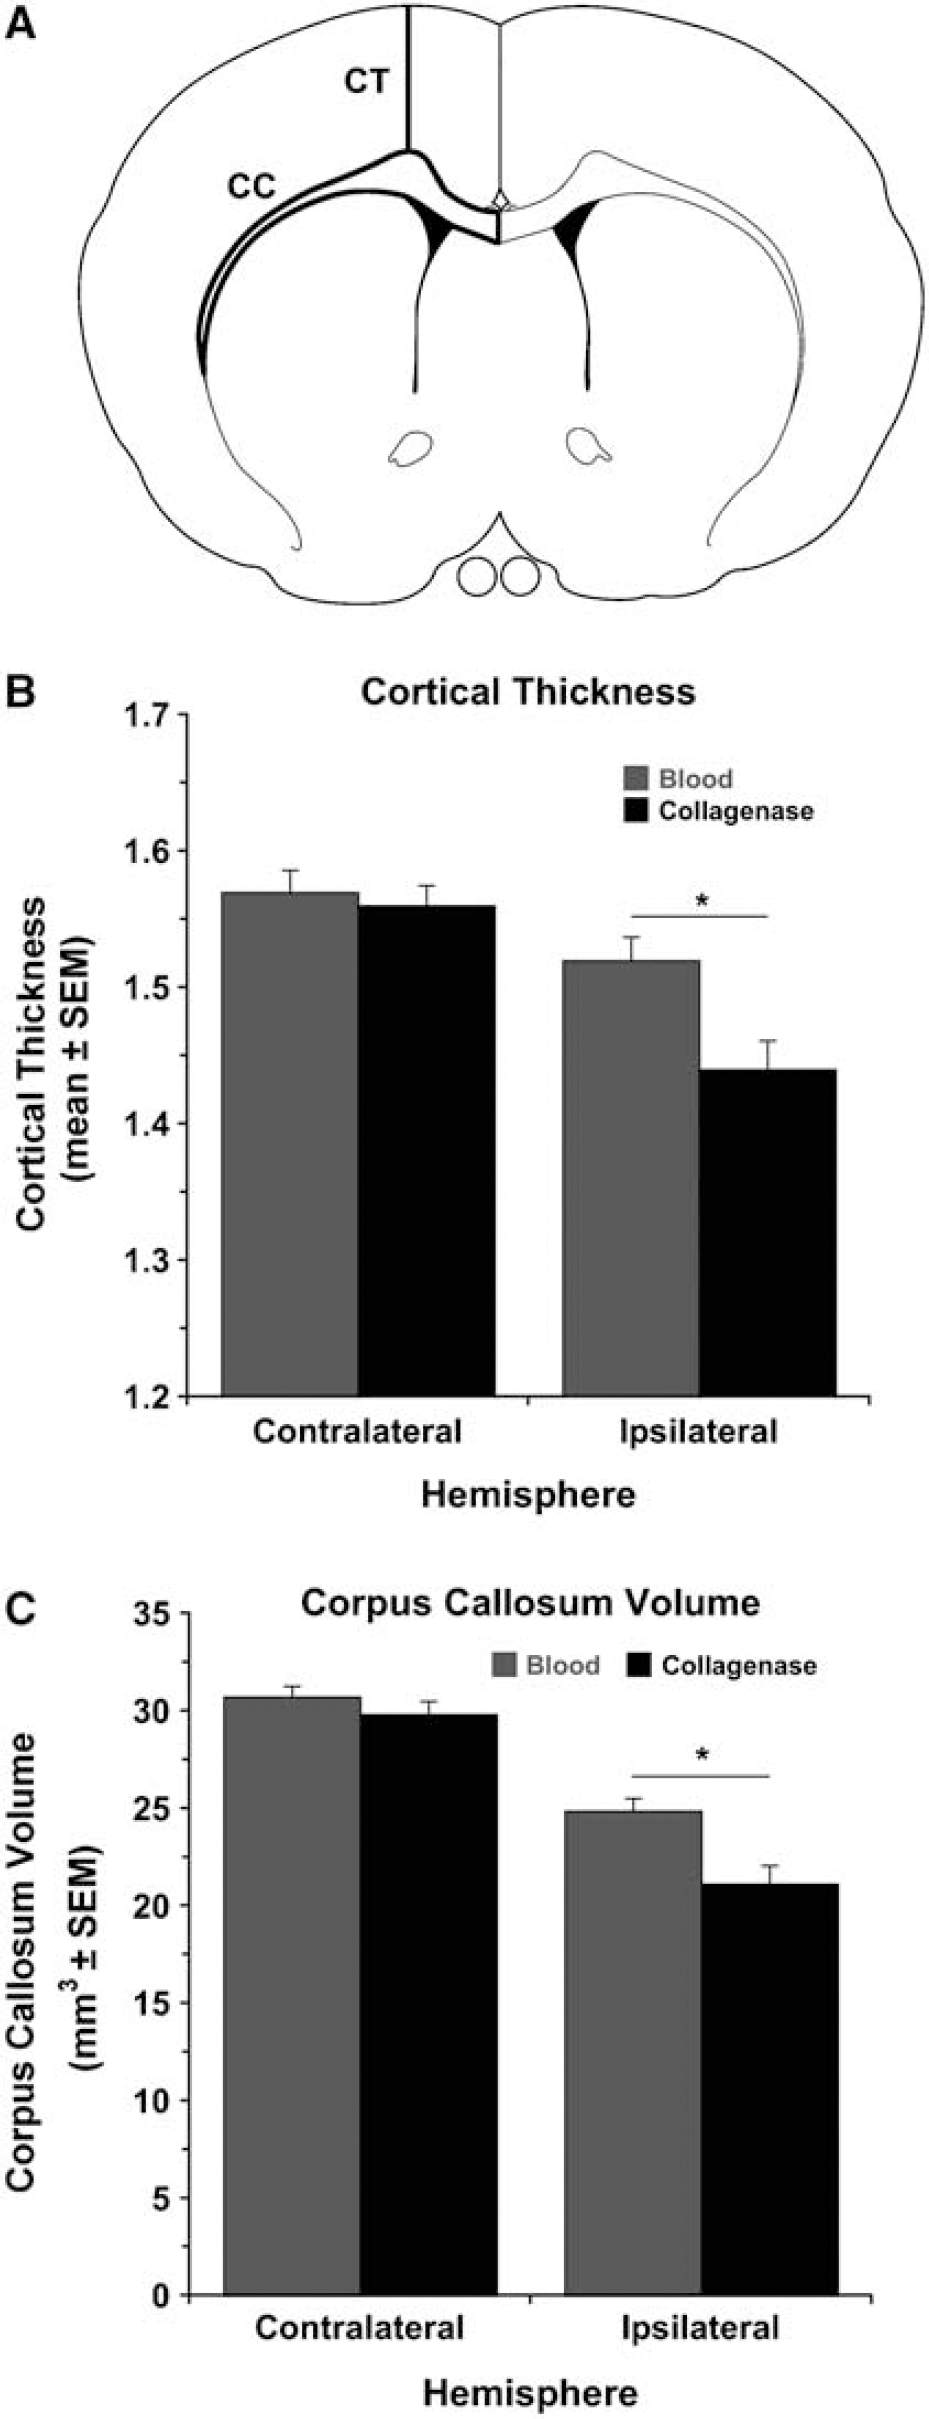
The cortical thickness of both hemispheres was determined using ImageJ by measuring the distance from the cingulum to layer II of the cortex in eight sections interspaced 1 mm and ranging from +2.2 to −4.8 mm to bregma (Newson et al, 2005; Figure 4A).
(
Corpus callosum injury was also assessed by calculating its volume in each hemisphere from eight coronal sections from + 2.2 to −4.8 mm to bregma (1 mm intervals; Figure 4A):
volume = average area of corpus callosum × section interval × number of sections.
To determine whether ICH induced pathologic changes in the nonlesioned hemisphere, we analyzed striatal and SN neuronal loss, cortical thickness, and corpus callosum volume as described above in age-matched naïve animals (N = 5).
Statistical Analysis
Data are presented as mean±s.e.m. All behavioral and histologic analyses were performed by experimenters blind to group identity. Most data were analyzed using analysis of variance. However, Mann—Whitney U-test comparisons were used for nonparametric data (i.e., rating scale for Neurological Deficit Scale). Relationships between hematoma volume and tissue loss measured with MRI and histopathology were assessed with Pearson's r correlations. A P-value of < 0.05 was considered statistically significant.
Results
Hematoma Volume
In Experiment 1, we attempted to match the collagenase insult to the standard 100 μL blood injection. The hematoma volume was slightly larger in the blood model (85.34±6.25 μL) than in the collagenase model (68.32±3.24 μL) at 12 h (P < 0.05). A larger dose of collagenase was not used to avoid mortality. In Experiment 2, hematoma volume increased (P < 0.05) from 1 to 4 h after infusing collagenase (Figure 1A), but not after blood infusion (Figure 1B).
Volume of Tissue Lost
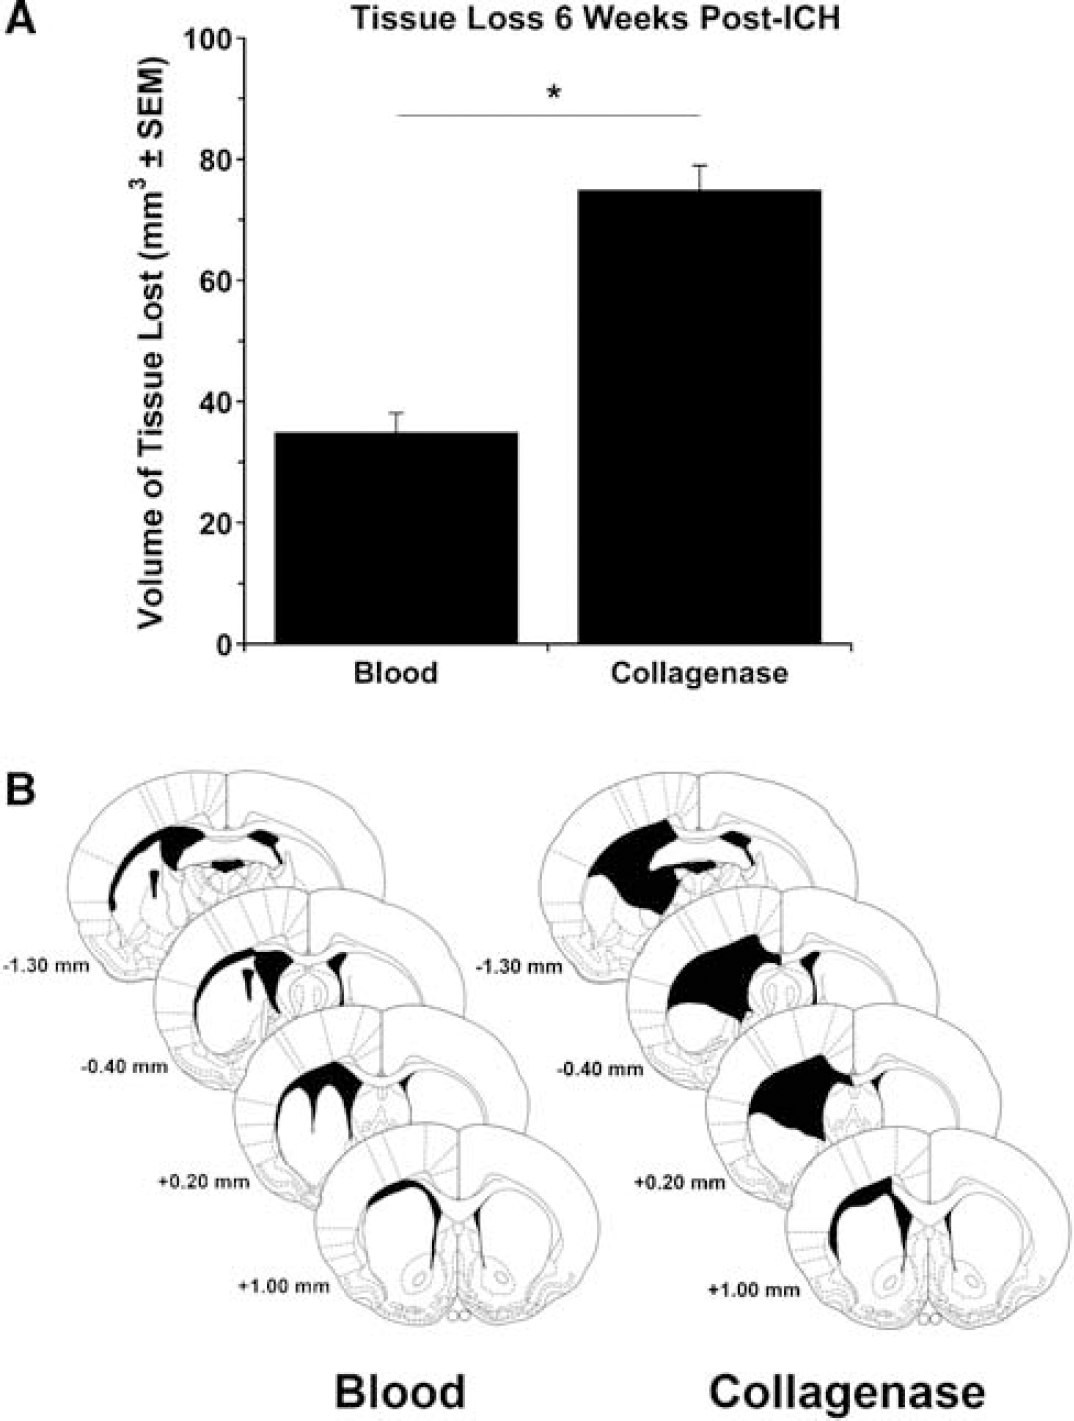
The volume of tissue lost 6 weeks after ICH was substantially greater in the collagenase model (Figure 2A; P < 0.05) despite the somewhat greater hematoma size in the blood model at 12 h. Both models were equally consistent in producing injury (not significant; Levene's test for heterogeneity). Figure 2B illustrates the size and placement of typical lesions. In the blood model, damage occurred primarily to the medial striatum and corpus callosum, whereas the medial and lateral striatum and corpus callosum were injured after collagenase infusion. Other structures including the globus pallidus, internal capsule, septum pellucidum, and thalamus were also sometimes damaged. Enlarged lateral ventricles, indicating striatal atrophy, occurred in both models. Intraventricular hemorrhage extension occurred in two animals in the blood infusion group.
Neuronal Loss in Striatum and Substantia Nigra
To evaluate the effects of ICH on neuronal loss in the striatum and in areas distal to the hematoma, neurons were counted in the striatum (Figure 3A) and in the SNc and SNr 6 weeks after ICH. Neuronal loss occurred in the ipsilateral striatum (versus contralateral striatum, P < 0.05) in both models. However, neuronal loss was substantially greater in the collagenase model compared with the blood model (Figure 3B, P < 0.05). Additional analysis of neuronal loss outside of the hematoma (i.e., the remaining perihematoma region) revealed significant (P < 0.05) neuronal loss in the collagenase model (20.51±2.84 neurons remaining versus 36.78±2.46 in controls) but not in the blood infusion model (33.39±1.55 versus 36.78±2.46 in controls). Intracerebral hemorrhage caused neuronal loss in the ipsilateral SNc, and this was greater (P < 0.05) in the collagenase model (Figure 3C). Although the trends were similar in the SNr, this did not reach statistical significance (Figure 3D). Neuronal counts in the contralateral striatum and SN did not differ from controls (data not shown).
Cortical Thickness
Cortical thickness (Figure 4A) was reduced in the ipsilateral side (versus contralateral, P < 0.05) in both models at 6 weeks (Figure 4B) and this was greater in the collagenase model (P < 0.05). Intracerebral hemorrhage did not cause cortical thinning in the contralateral hemisphere (versus control; data not shown).
White Matter Injury/Atrophy
To determine whether ICH results in direct injury and/or atrophy to white matter tracts, the volume of the corpus callosum was measured in both hemispheres in each model (Figure 4A). The corpus callosum volume was reduced in the ipsilateral hemisphere in both models (P < 0.05), but more so after collagenase-induced ICH (Figure 4C, P < 0.05). The corpus callosum volume in the contralateral hemisphere was not affected by ICH (not significant versus control).
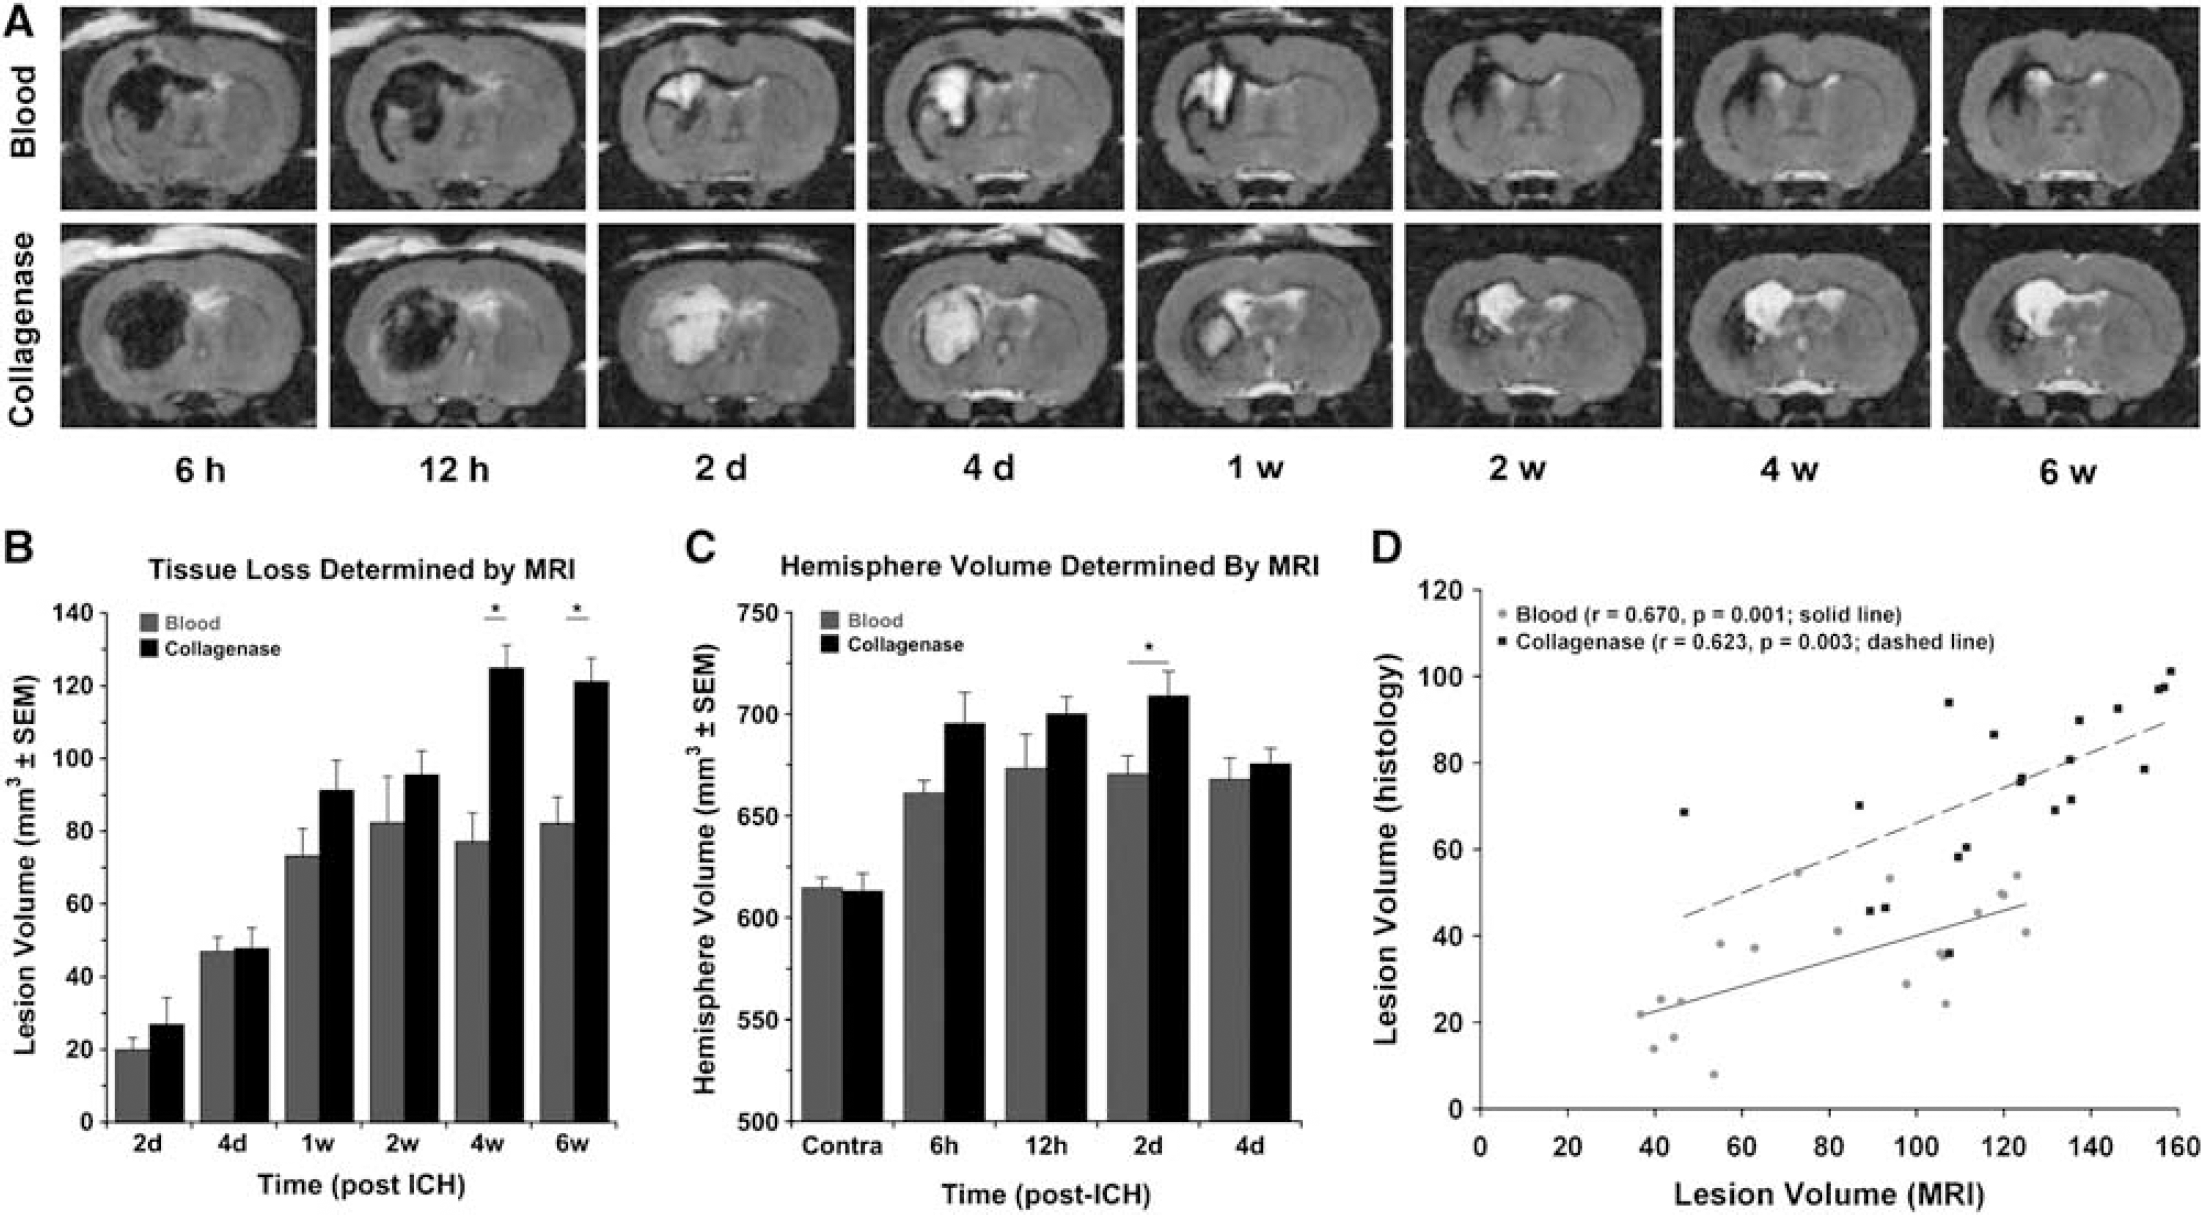
Magnetic Resonance Imaging
Figure 5A shows MR images at the level of maximum hematoma diameter in each model at each scan time. Despite similar initial hematoma volumes as assessed via the hemoglobin assay at 12 h (Experiment 1), the hematoma appears larger in the collagenase-ICH group probably because blood dissects through the parenchyma as opposed to remaining in a pool at the injection site as occurs in the blood model. The formation of a hemosiderin ring surrounding the hematoma indicates the beginning of the chronic phase of the hematoma (Bradley, 1993) and suggests that the hematoma resolves more quickly after blood-induced ICH. From these images, it is also apparent that injury at later time points (i.e., 4 to 6 weeks after ICH) is much greater in the collagenase model. We calculated the volume of tissue lost from MR images, as done in coronal sections described previously. The volume of tissue lost increased markedly from 1 to 4 weeks in the collagenase model (P < 0.05), but was unchanged in the blood model (Figure 5B). Volume of injury calculations before 1 week are inaccurate owing to edema and mass effect of the hematoma at these times. Furthermore, calculating tissue loss very early after ICH (e.g., 6 and 12 h) is not meaningful and therefore data for these times are not shown. Instead, hemispheric volume is presented (Figure 5C). The volume of the ipsilateral hemisphere was greater than the contralateral hemisphere from 6 h to 4 days after ICH (P < 0.05). Magnetic resonance imaging-determined injury at 6 weeks significantly correlated with histopathology in the blood (r = 0.670, P < 0.05; Figure 5D) and collagenase models (r = 0.623, P < 0.05), but overestimated histologically defined lesion size in both models.
Blood—Brain Barrier Disruption
Magnetic resonance contrast enhancement was used as a marker of BBB disruption at 12 h, 2 days, and 4 days after ICH. Data were corrected for signal intensity in the contralateral hemisphere, which served as a control. At 12 h, we detected greater signal intensity enhancement in the collagenase model in the hematoma but not the surrounding rim of tissue. At 2 and 4 days after ICH, there was a significantly greater increase in signal qintensity in both the hematoma (Figure 6B, P < 0.05) and the rim (Figure 6A, P < 0.05) in the collagenase model. Analysis of time course of Gd enhancement revealed no effect of time in the blood infusion model, whereas in the collagenase model, signal intensity in the hematoma and rim increased from 12 h to 4 days (P < 0.05). Data are shown for the MR slice with maximum hematoma diameter, but results from other slices were similar.
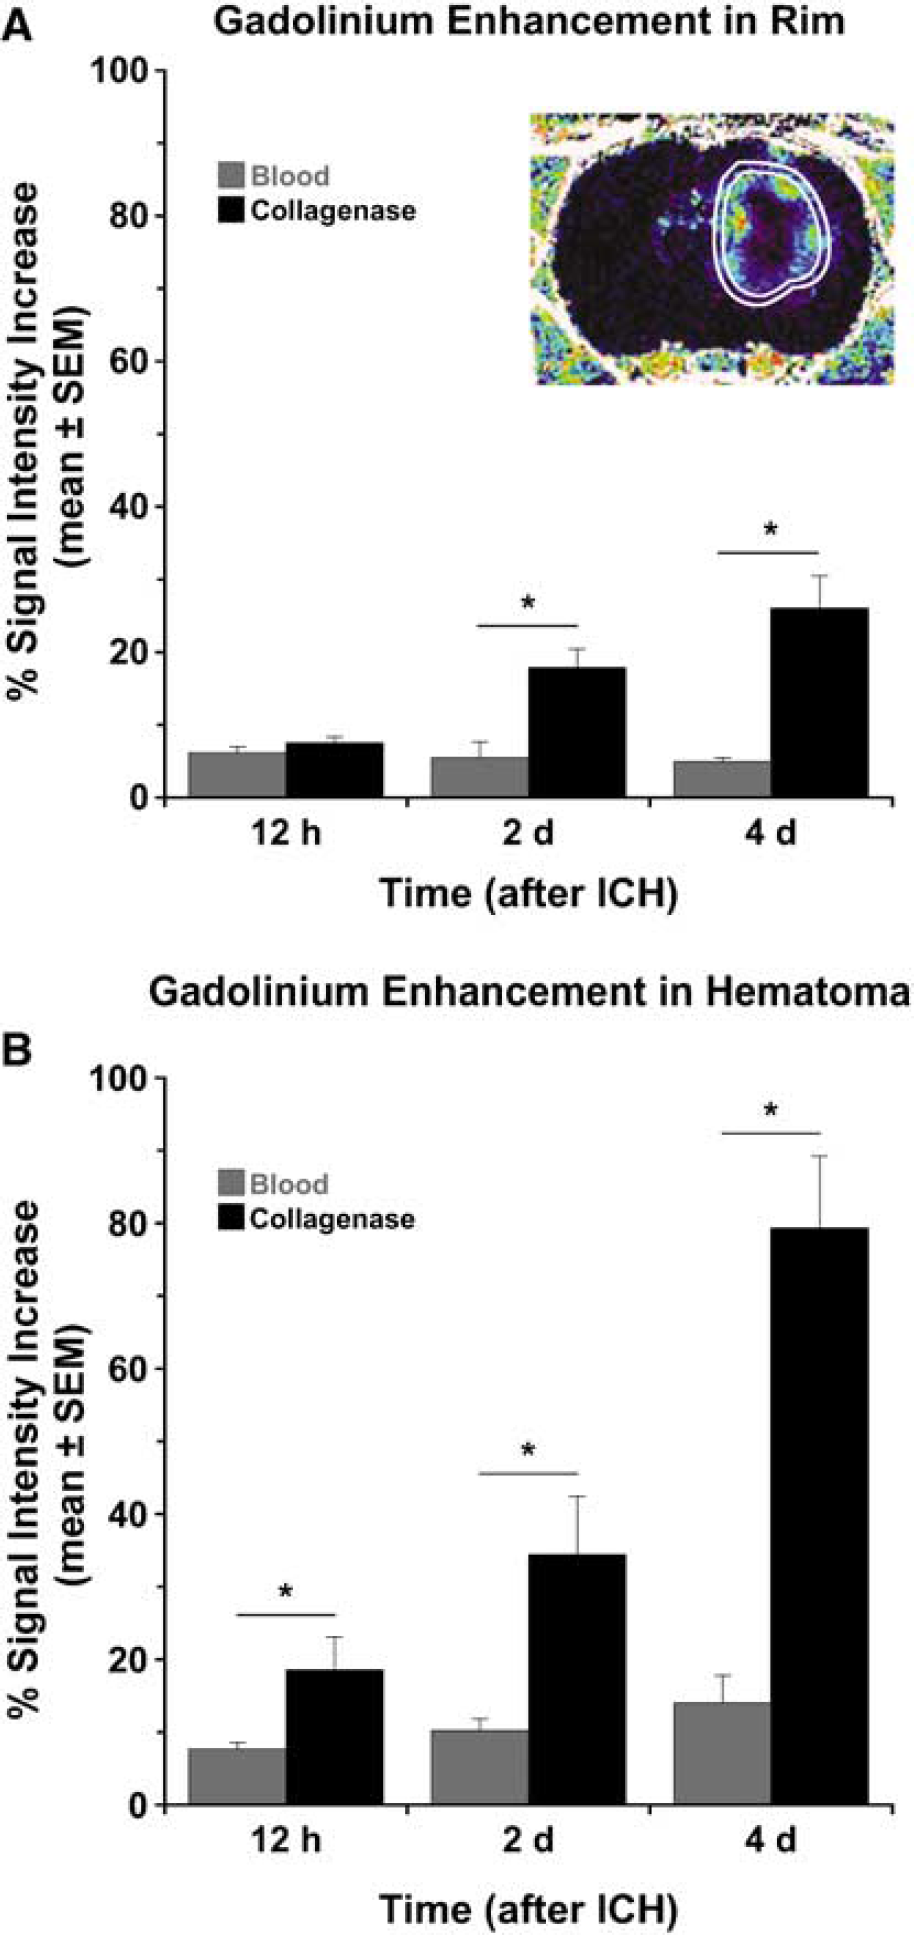
Blood—brain barrier (BBB) disruption, measured via Gd-enhancement (see inset; mean signal intensity change± s.e.m.), at 12 h, 2 days, and 4 days after stroke in (
Functional Recovery
Both groups exhibited significant neurologic deficits (versus baseline, P < 0.05) after ICH. The collagenase model produced significantly greater deficits than the blood model at all times (Figure 7, P < 0.05). Deficits quickly recovered in the blood model, as scores were not different from baseline by 21 days. In contrast, recovery was much more gradual in the collagenase group, which remained impaired on day 28 (P < 0.05).
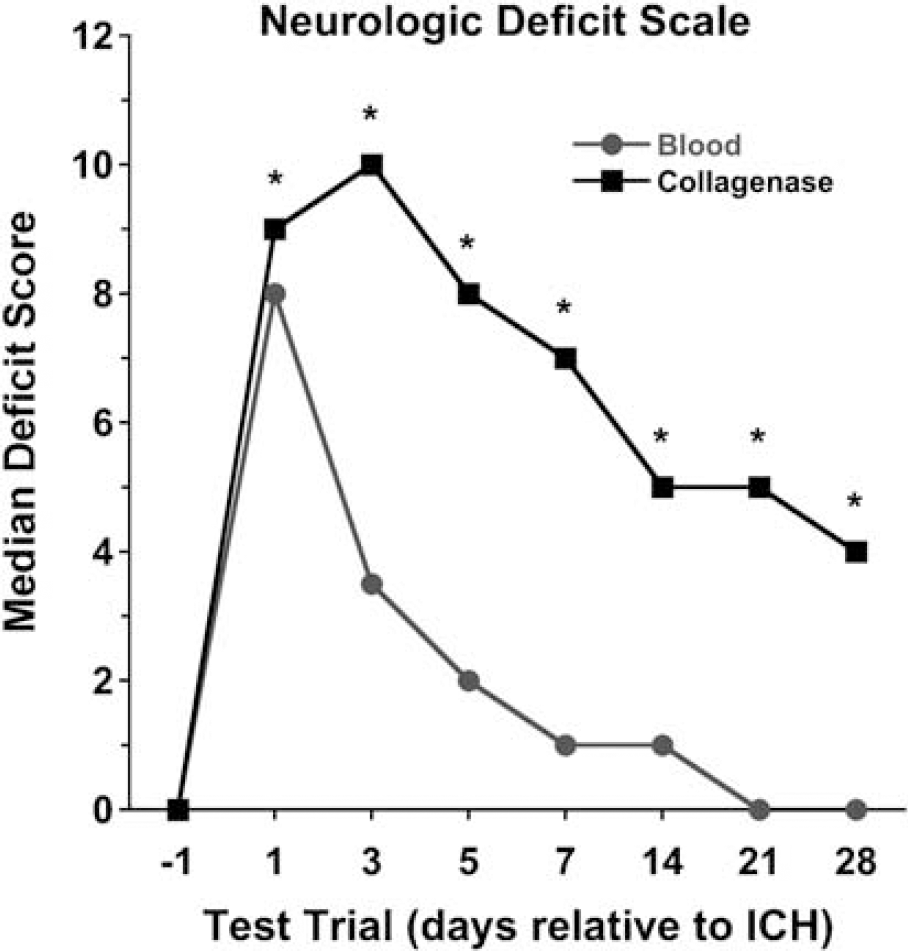
Median Neurological Deficit Scale scores at baseline (day before ICH) and at 1 through 28 days after stroke in both models. Rats infused with collagenase sustained greater neurologic impairment than those infused with blood at all times after the stroke. Complete recovery was found in the blood infusion model, but not in the collagenase model where animals were still significantly impaired (versus baseline) at 28 days.
Discussion
Infusions of autologous blood or collagenase are the most widely used rodent models of ICH. Presumably, the better model is the one that more closely mimics the pathophysiology and functional consequences of ICH in humans while taking into account practical issues (e.g., surgical difficulty, assessment characteristics). In this study, we are the first to directly compare these models (matched for hematoma size) using numerous end points. Our primary findings are (1) greater primary injury occurs in the collagenase model, (2) injury also occurs distal to the hematoma in both models, but more so after collagenase infusion, (3) neurologic deficits resolve more rapidly and completely in the blood model, (4) MRI assessment fails to accurately gauge the tissue injury early after ICH, whereas it overestimates lesion size weeks later, and (5) MRI can track the evolution of the hematoma degradation, which occurs faster in the blood model. These findings underscore the necessity of using both models in testing putative therapeutics and they also illustrate the difficulties with the unimodal assessment approach common in stroke research.
It is interesting that the collagenase model caused much greater structural injury than the blood model despite the fact that the whole-blood model had a somewhat larger hematoma. There are several possible reasons for this. First, collagenase injures many blood vessels, depending on dosage and diffusion characteristics, resulting in blood broadly dissecting throughout the parenchyma, whereas infused blood pooled within the striatum and between the striatum and corpus callosum. Accordingly, more brain cells were exposed to degenerating erythrocytes and probably inflammatory cells in the collagenase model, leading to a greater mass effect and edema, and presumably greater neurotoxicity (Atlas and Thulborn, 1998; Felberg et al, 2002). Second, BBB extravasation was greater in the collagenase model, especially within the hematoma. The temporal profile of BBB breakdown here is similar to that of other events that contribute to injury, including erythrocyte degeneration and edema formation (Xi et al, 2006). Third, the more widespread destruction of vasculature may cause some ischemic injury after collagenase infusion, at least within the diffuse hematoma, and this may be causing the greater BBB disruption. If so, this might mean that antiischemic therapies might fare better against collagenase-induced ICH than after blood infusion, as seems to be the case with the use of prolonged hypothermia in these models (MacLellan et al, 2004, 2006b). We did not assess cerebral blood flow in this study to determine the extent of ischemia in the hematoma or surrounding tissue and how this differs between models. Clearly, further mechanistic studies are needed to compare models regarding the contribution of ischemia among many other pathologic processes such as edema, inflammation, and oxidative stress because model differences will impact treatment efficacy.
Differences in injury might also relate to the rate of hematoma formation that is virtually instantaneous in the blood model compared with a gradual (hours) evolution in the collagenase model. However, one would predict that a slow bleed might be less devastating than a rapid one. Some ICH patients experience a single large bleed, but many undergo hematoma expansion over the first day (Fujii et al, 1994; Kazui et al, 1996). Accordingly, the collagenase model is clearly more suited to assessing treatments that affect bleeding and/or hematoma expansion such as hemostatic therapies (Kawai et al, 2006) or blood pressure manipulations. Likewise, the collagenase model might be better suited for detecting treatment side effects (e.g., elevated blood pressure caused by induced hypothermia; MacLellan et al, 2004).
The more severe and persistent functional impairment in the collagenase model undoubtedly stems from greater striatal destruction and additional injury to areas distal to the hematoma, such as the cortex and white matter tracts. Unfortunately, these other structures are not routinely assessed in experimental ICH studies (but see Felberg et al, 2002) despite calls for assessing both gray and white matter and for using models that have significant white matter injury (Report from a National Institute of Neurological Disorders and Stroke workshop, 2005). Several ICH studies report functional improvement without a reduction in striatal injury (Peeling et al, 2001), which might have resulted from a reduction in injury distal to the lesion epicenter.
Recovery from the initial functional impairment was considerably more gradual and incomplete in the collagenase model (MacLellan et al, 2006a, b , c ) despite similar impairment at the outset. The rapid and apparently complete behavioral recovery in the blood model is at odds with the persistent and debilitating deficits seen in ICH patients (Fieschi et al, 1988; Fogelholm et al, 1992). Furthermore, a rapid functional recovery is a significant problem in studies that seek to assess long-term outcome (e.g., floor/ceiling effects), which is of great importance in cytoprotection studies. Thus, a simple Neurological Deficit Scale should not be the only measure used in the whole-blood model; instead, or additionally, investigators should use more sensitive tests such as the forelimb use asymmetry task (Hua et al, 2002) and the single pellet reaching task (MacLellan et al, 2006c). Ideally, a sensitive functional assessment battery should be identified and used for each ICH model.
Magnetic resonance imaging is routinely used to detect hyperacute ICH, and has proven to be reliable in differentiating between ischemic and hemorrhagic insults (Fiebach et al, 2004; Schellinger et al, 1999). Furthermore, MRI is useful for identifying ICH and hematoma evolution in rodent models (Brown et al, 1995; Del Bigio et al, 1996; Hartmann et al, 2000). Long-term examinations of the temporal pattern of ICH in humans are rare, and much of the existing data are contradictory (Bradley, 1993; Fiebach et al, 2004). We cannot directly compare hematoma evolution in this study to human ICH, although it appears that both undergo the same stages of hemoglobin oxidation, which define the age of the hematoma (Bradley, 1993), and that the hematoma resolution occurs much faster in rodents. This is especially the case for the blood model as indicated by the earlier formation of a hemosiderin ring surrounding the hematoma in the chronic phase of ICH. Other pathophysiologic processes, such as edema and inflammation, also occur sooner after ICH onset in rodents compared with humans (Xi et al, 2006) and thus our findings are not surprising. Nonetheless, they raise serious concerns about predicting efficacy and therapeutic windows in patients from rodent work, thus arguing for the need to develop alternative models or to use other species.
Our findings illustrate an important technical limitation with T2-MRI in rodent ICH studies. That is, measurements of hematoma volume and/or tissue injury in the first few days after ICH were confounded by the mass effect of the hematoma and edema. Furthermore, we could not directly assess edema formation because the MR appearance of hemoglobin (hematoma) and vasogenic edema is indistinguishable soon after ICH (e.g., day 2) with T2-weighted images. Thus, alternative measures to gauge ICH size, such as hemisphere volume, may be more appropriate at such times. Finally, although MRI appears to be a valuable surrogate marker for ICH, we found that the volume of tissue lost was overestimated with MRI compared with histology. This discrepancy is probably due to the tissue thickness used here (0.8 mm for MRI versus 0.02 mm for histology), and could be partly avoided by using a higher resolution (e.g., thinner slice thickness).
The collagenase and blood infusion models of ICH differ significantly in the extent and location of injury, and also in the recovery profile. Thus, researchers may prefer to use one model over the other in studies assessing long-term functional outcome (i.e., collagenase model) or pathophysiology of ICH (i.e., blood model). Our findings clearly show that the use of any one particular surrogate marker (e.g., histology) of benefit is fraught with limitations not the least of which is their inability to completely gauge recovery, which is the clinical end point of greatest concern. This holds true irrespective of the model and applies as well to other end points not presently used, as shown by several labs (MacLellan et al, 2006b; Wasserman and Schlichter, 2007). Advantages and disadvantages of each model, along with the fact that neither model perfectly mimics ICH in patients, strongly argue for using both models to assess putative cytoprotectants or rehabilitation therapies.
Footnotes
Acknowledgements
Technical assistance was kindly provided by G Chernenko, S Lee, and A Schellenberg.