
Abstract
We describe a distributed parameter (DP) model for tracer kinetic analysis in brain and validate the derived perfusion values with positron emission tomography (PET) scans. The proposed model is applied on actual clinical cases of hemispheric stroke. Nine patients with experienced transient ischaemic attack or minor stroke and a stenosis of the internal carotid artery were referred for computed tomography (CT) and PET imaging. The applicability of the DP model in clinical practice was tested in seven patients with acute stroke who received a baseline perfusion CT study and a noncontrast follow-up CT study after 2.4 ± 1.8 days. The mean blood flow (F) value for all patients with carotid stenosis in the pooled data (54 regions of interest (ROIs)) was 37.9 ± 11.2 mL/min per 100 g in perfusion CT and 35.6 ± 9.8 mL/min per 100 g in perfusion PET imaging [r = 0.77 (P = 0.00)]. Regression analysis of the pooled ROIs for every patient revealed significant correlation between F values in seven patients [r = 0.50 to 0.79 (r2-values ranged from 0.45 to 0.79), (0.01 ≤P ≤ 0.05)]. Parametric maps that corresponded to all physiologic parameters were generated for every perfusion CT in the patients with acute stroke using the DP model. The ischaemic area was better delineated in F, intravascular blood volume and lag time (tlag) maps. The correlation coefficient comparing the visually outlined regions of abnormality between the tlag parametric map and the follow-up CT scans was 0.81 (P = 0.003). In conclusion, DP physiological model using more realistic pharmacokinetics is feasible in dynamic contrast-enhanced CT of the brain in patients with acute and chronic cerebrovascular disease.
Keywords
Introduction
Since the first application (Axel, 1980) of dynamic contrast-enhanced (DCE) computed tomography (CT) to determine tissue perfusion, recent developments of helical CT and multislice CT have allowed DCE-CT to be potentially better than the nuclear medicine methods in terms of both temporal (approaching subsecond) and spatial resolutions (submillimeter). The in vivo assessment and quantification of physiological processes associated with microcirculation in the brain by means of DCE-CT has undergone significant improvements bearing considerable impact on care of patients with severe head injury, stroke, and cerebral tumours (Bisdas et al, 2004; Cenic et al, 2000; Hoeffner et al, 2004; Wintermark, 2005). Dynamic contrast-enhanced computed tomography, also called perfusion CT, can generate functional images of the brain, to facilitate diagnosis, guide therapeutic decisions, and monitor treatment effects, although with a certain radiation burden that can be kept within acceptable clinical range (Hirata et al, 2005a; Murase et al, 2005).
However, the mathematical calculations for deriving functional or physiologic parameters using DCE-CT are still mainly based on those of the early years when temporal resolution was typically limited to a few seconds or longer. According to a review article (Miles and Griffiths, 2003), methods currently still in use by commercial software are applying summary parameters, such as the peak area under curve, time to peak, or are based on assumptions such as an initial time interval with no venous outflow, a single pass of tracer with no recirculation, and no efflux of tracer back into the capillaries.
A deconvolution approach that derives physiological parameters from the impulse residue function, R(t) (as a function of time t) of the tissue has been used increasingly. The numerical deconvolution method has been the method of choice of several reports in the recent literature (Bisdas et al, 2004, 2006; Wintermark, 2005; Roberts et al, 2002a, b). However, numerical deconvolution is very sensitive to noise and thus requires regularization, which again requires assumptions to be made regarding the inherent noise, or on the expected behaviour of R(t) (Nabavi et al, 1999; Koh et al, 2004). Furthermore, the parameters that could be extracted from the numerically derived R(t) are limited.
Alternatively, deconvolution analysis of DCE-CT data can also be performed by parametric fitting using tracer kinetics models. Such models are usually compartmental models, which can be broadly classified as lumped parameter and distributed parameter (DP) models. The DP models describe tracer concentration in the vascular compartment as a function of both time and position along the capillary, and are generally believed to be more realistic than the lumped parameter models, which assume instantaneous mixing within the compartments (Johnson and Wilson, 1966; Koh et al, 2003, 2006; Larson et al, 1987). Recent work has presented the theoretical formulation of the DP model in the analysis of DCE-CT data of brain parenchyma and has shown its applicability in a few clinical cases with metastatic cerebral tumours (Koh et al, 2006).
Recent advances in CT technology have enabled the acquisition of high temporal resolution DCE images for diagnosis of cerebrovascular diseases. Considering that the imaging temporal resolution can now be smaller than the average transit time of tracer within tissues, it might be more appropriate to use a DP model for the analysis of such data sets. In this work, we attempt to validate the perfusion values derived using two-compartment DP model analysis of DCE-CT data, by comparing with those obtained by positron emission tomography (PET) in the same patients with stenotic carotid disease. Our hypothesis is that cerebral blood flow (CBF) values estimated by means of DP model analysis do not differ from those obtained with PET in human subjects. Furthermore, the proposed model is applied on actual clinical cases of hemispheric stroke to study its applicability in the analysis of DCE-CT data of stroke patients.
Theoretical background
The technique of external monitoring of tracer by dynamic imaging typically involves the intravenous injection of the tracer and subsequent sequential imaging to monitor the concentration of tracer in the tissue of interest Ctiss(t) and a feeding artery Ca(t), as functions of time t. We briefly outline the DP model of R(t) for a capillary—tissue exchange unit, which accounts for the processes of convective transport and transcapillary exchange. Multiple compartmental versions of the DP model for describing the impulse residue functions of catenary and mammillary systems have been derived previously (Koh et al, 2003, 2004; Larson et al, 1987) for the analysis of large regions of interest (ROI). For parametric mapping, as each pixel value on a parametric map corresponds to a small volume of tissue, the two-compartment version of the DP model is employed in this work. A convenient property of the DP impulse response model is that it can be written in separable form in time domain, with each component phase representing a physiologic process (Koh et al, 2003). The impulse residue function for the two-compartment DP model is
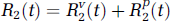
with
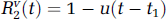
and
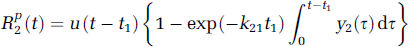
representing the vascular and parenchyma phases, respectively. u(t) is the Heaviside unit step function, t1 the transit time through the vascular compartment (with compartments 1 and 2, respectively, representing the vascular and interstitial spaces), and kij denotes the rate constant for transfer from compartment j to compartment i.
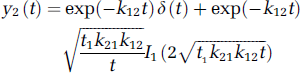
where I1 is the modified Bessel function, and δ(t) the Dirac delta function.
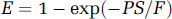
As explained by Larson et al (1987), the vascular phase has a constant value of unity for t < t1, reflecting the fact that an external detector registers a constant response proportional to the total amount of tracer in the injected bolus. At t = t1, the unextracted tracer within the vascular space exits by outflowing blood, resulting in a discrete decrease, and the detector response registers the fraction of extracted tracer, given by E. For t > t1, the extracted tracer diffuses back into the blood and is cleared by outflowing blood, giving rise to a gradually decreasing parenchyma phase. The parameters that can be directly obtained from fitting experimental curves are blood perfusion (blood flow) F, t1, k21, and k12. With the DP model, the first pass extraction fraction, which can be used to assess the ‘leakiness’ of the blood vessels, can be formally given by Larson et al (1987)

Since v1 can be estimated by v1 = ρFt1, one might then estimate the permeability—surface area product as PS = k21v1/ρ, and the latter equation reverts to the classic Renkin—Crone equation [11]
Materials and methods
Patients
Nine patients (five men and four women, mean age: 66.8 ± 6.2 years) referred for CT and PET imaging of their cerebral perfusion were included in this study. Clinical and demographic data of our patients are summarized in Table 1. All patients had a severe degree of internal carotid artery stenosis and were enroled from an ongoing clinical trial of haemodynamics in chronic cerebrovascular disease. Written informed consent (including specific mention of the radiation exposure) was obtained from every participant in accordance to the guidelines of the Institutional Review Board. Six patients had high-grade atherosclerotic stenosis (more than 75% of NASCET (North American Symptomatic Carotid Endarterectomy Trial) score) of one internal carotid artery and three patients had a low-grade stenosis of the contralateral internal carotid artery. All patients had experienced single or recurrent (either stereotyped or nonstereotyped) episodes of transient ischaemic attack (6 patients) or minor stroke (3 patients). Transient ischaemic attack was diagnosed clinically in patients with focal neurological symptoms relating to focal cerebral or retinal ischaemia with abrupt onset and complete resolution within 24 h. Minor stroke was defined as Rankin Scale score 1 or 2. The patients were examined at least 6 weeks after their last event, but not longer than 3 months after they became symptomatic.
Clinical and demographic data of the patients with carotid disease who received perfusion CT and PET examinations
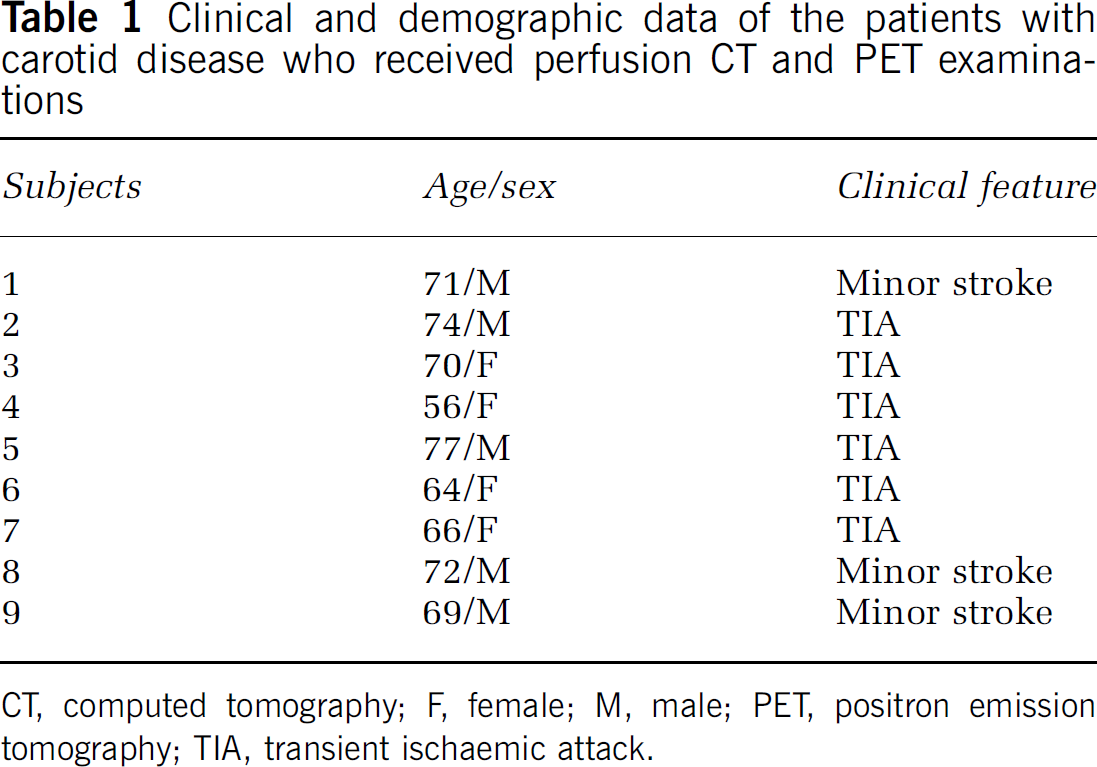
CT, computed tomography; F, female; M, male; PET, positron emission tomography; TIA, transient ischaemic attack.
The applicability of the DP model in clinical practice was tested in seven patients (four men and three women, mean age: 71.3 ± 5.2 years) with acute stroke who received a baseline perfusion CT study and a noncontrast follow-up CT study (which served as reference standard in the acute stroke setting) after 2.4 ± 1.8 days after the admission imaging. The perfusion CT was performed in 166 ± 34 mins after symptom onset. Three patients had stroke in the territory of the middle cerebral artery (MCA) on the right side, two patients on the territory of the anterior cerebral artery (ACA) on the left side, and two patients on the territory of the MCA on the left side. The patients' data were retrieved from a clinical study of the perfusion CT in acute stroke setting, after Review Board Approval and informed consent of the patients or their families. Inclusion criteria for the patients were: (1) symptom onset identified by the patient or by another person less than 6 h before CT scanning, (2) no preexisting neurologic disease or previous stroke that would hamper the interpretation of imaging data, (3) no haemorrhage on noncontrast CT scan, and (4) no spontaneous improvement of symptoms before perfusion CT. The enroled patients were in a stable condition to undergo perfusion CT.
The exclusion criteria for all examined patients in our study included inability to provide informed consent, pregnancy, inability to tolerate a supine position for CT and PET imaging, a history of hyperthyroidism, known allergy against contrast agents, and preexisting major cerebral infarction that would hamper interpretation of imaging data.
Noncontrast and Perfusion Computed Tomography Imaging Protocol
All perfusion CT imaging examinations were performed at a Lightspeed multislice helical CT scanner (GE Medical Systems, Milwaukee, WI, USA). Two adjacent levels among the 17 examined sections in the noncontrast baseline CT were selected at the level of the basal nuclei. Forty-five 10-mm CT sections of continuous (cine) scanning (80 kV, 190 mA) were obtained at every adjacent level with a total acquisition time of 45 secs. Computed tomography was initiated 4 secs after the intravenous rapid infusion (injection rate = 6 mL/sec) of iodinated contrast material with an iodine concentration of 300 mg/dl (Imeron 300, Altana, Konstanz, Germany). The contrast agent was injected into an antecubital vein with a power injector (Medrad, Pittsburgh, PA, USA). We did not perform radiation exposure measurements in our patients; thus, the average radiation doses, provided in the literature, of brain parenchyma, head surface, and lens at the same settings of voltage and current are applicable (Hirata et al, 2005b). According to these measurements, the lens dose has to be approximately 22 mGy, the head surface dose approximately 580 mGy, and the brain parenchyma (basal ganglia level) dose approximately 332 mGy. However, these values are measured by 80 kV, 200 mA, and four 5-mm slices over 60 secs (1 rotation/sec). In our protocol, we used slightly lower tube current (190 mA) and two 10-mm slices over 45 secs. Thus, we assume that the radiation exposure in our subjects was substantially lower.
Positron Emission Tomography Protocol
Quantitative CBF measurement was performed immediately after the perfusion CT examination by using automated intravenous bolus administration of 3.7 Gbq 15O-labelled water for 7 secs. Multiple time frames were taken (12 × 5, 4 × 15, 2 × 30, and 2 × 60 secs frames; FOV (fields of view): 16.2 cm, FWHM (full-width half maximum): 7 to 8 mm, transmission scan 10 min, Ge-68 source) using an ECAT EXACT 922/47 PET scanner (Siemens, Erlangen, Germany). During image acquisition, continuous arterial blood sampling was performed to measure the arterial input function by means of an arterial catheter in the radial artery. Regional quantitative CBF values were calculated using the Kety—Schmidt one-compartment model and for correction of the measured input function, delay and dispersion were determined by multilinear least squares minimization (van den Hoff et al, 1993).
Perfusion Computed Tomography Analysis
The images were registered (SPM software package; University College, London, UK) relative to the first image as a template, to correct for any patient movement during the scans. To derive Ca(t) for each patient, a small ROI of 1 to 4 pixels was manually drawn over the ACA that clearly occupied at least one voxel along the plane of the CT image, and that showed an early bolus arrival time. The CT attenuation (in Hounsfield units, HU), which reflects the concentration of tracer within the ROI, was estimated by computing the mean of all pixel values within the ROI. We normalized the area of the Ca(t) curve to the concentration curve at a voxel within a vein to correct for possible partial volume averaging for the artery, as the smaller arteries may not necessarily orient along the slice thickness axis to fully occupy a voxel (Dennis Cheong et al, 2004). As the Ca(t) curve generally began to rise at an earlier time than most of the Ctiss(t) curves, a time delay or time lag (tlag) parameter was introduced to account for the time difference between the initial rise of these two curves. During parametric fitting, the tlag was searched together with the other four parameters in the R(t) function, using a constrained, nonlinear optimization algorithm (MatlabTM) to arrive at an optimal fit for the Ctiss(t) curve of each tissue voxel.
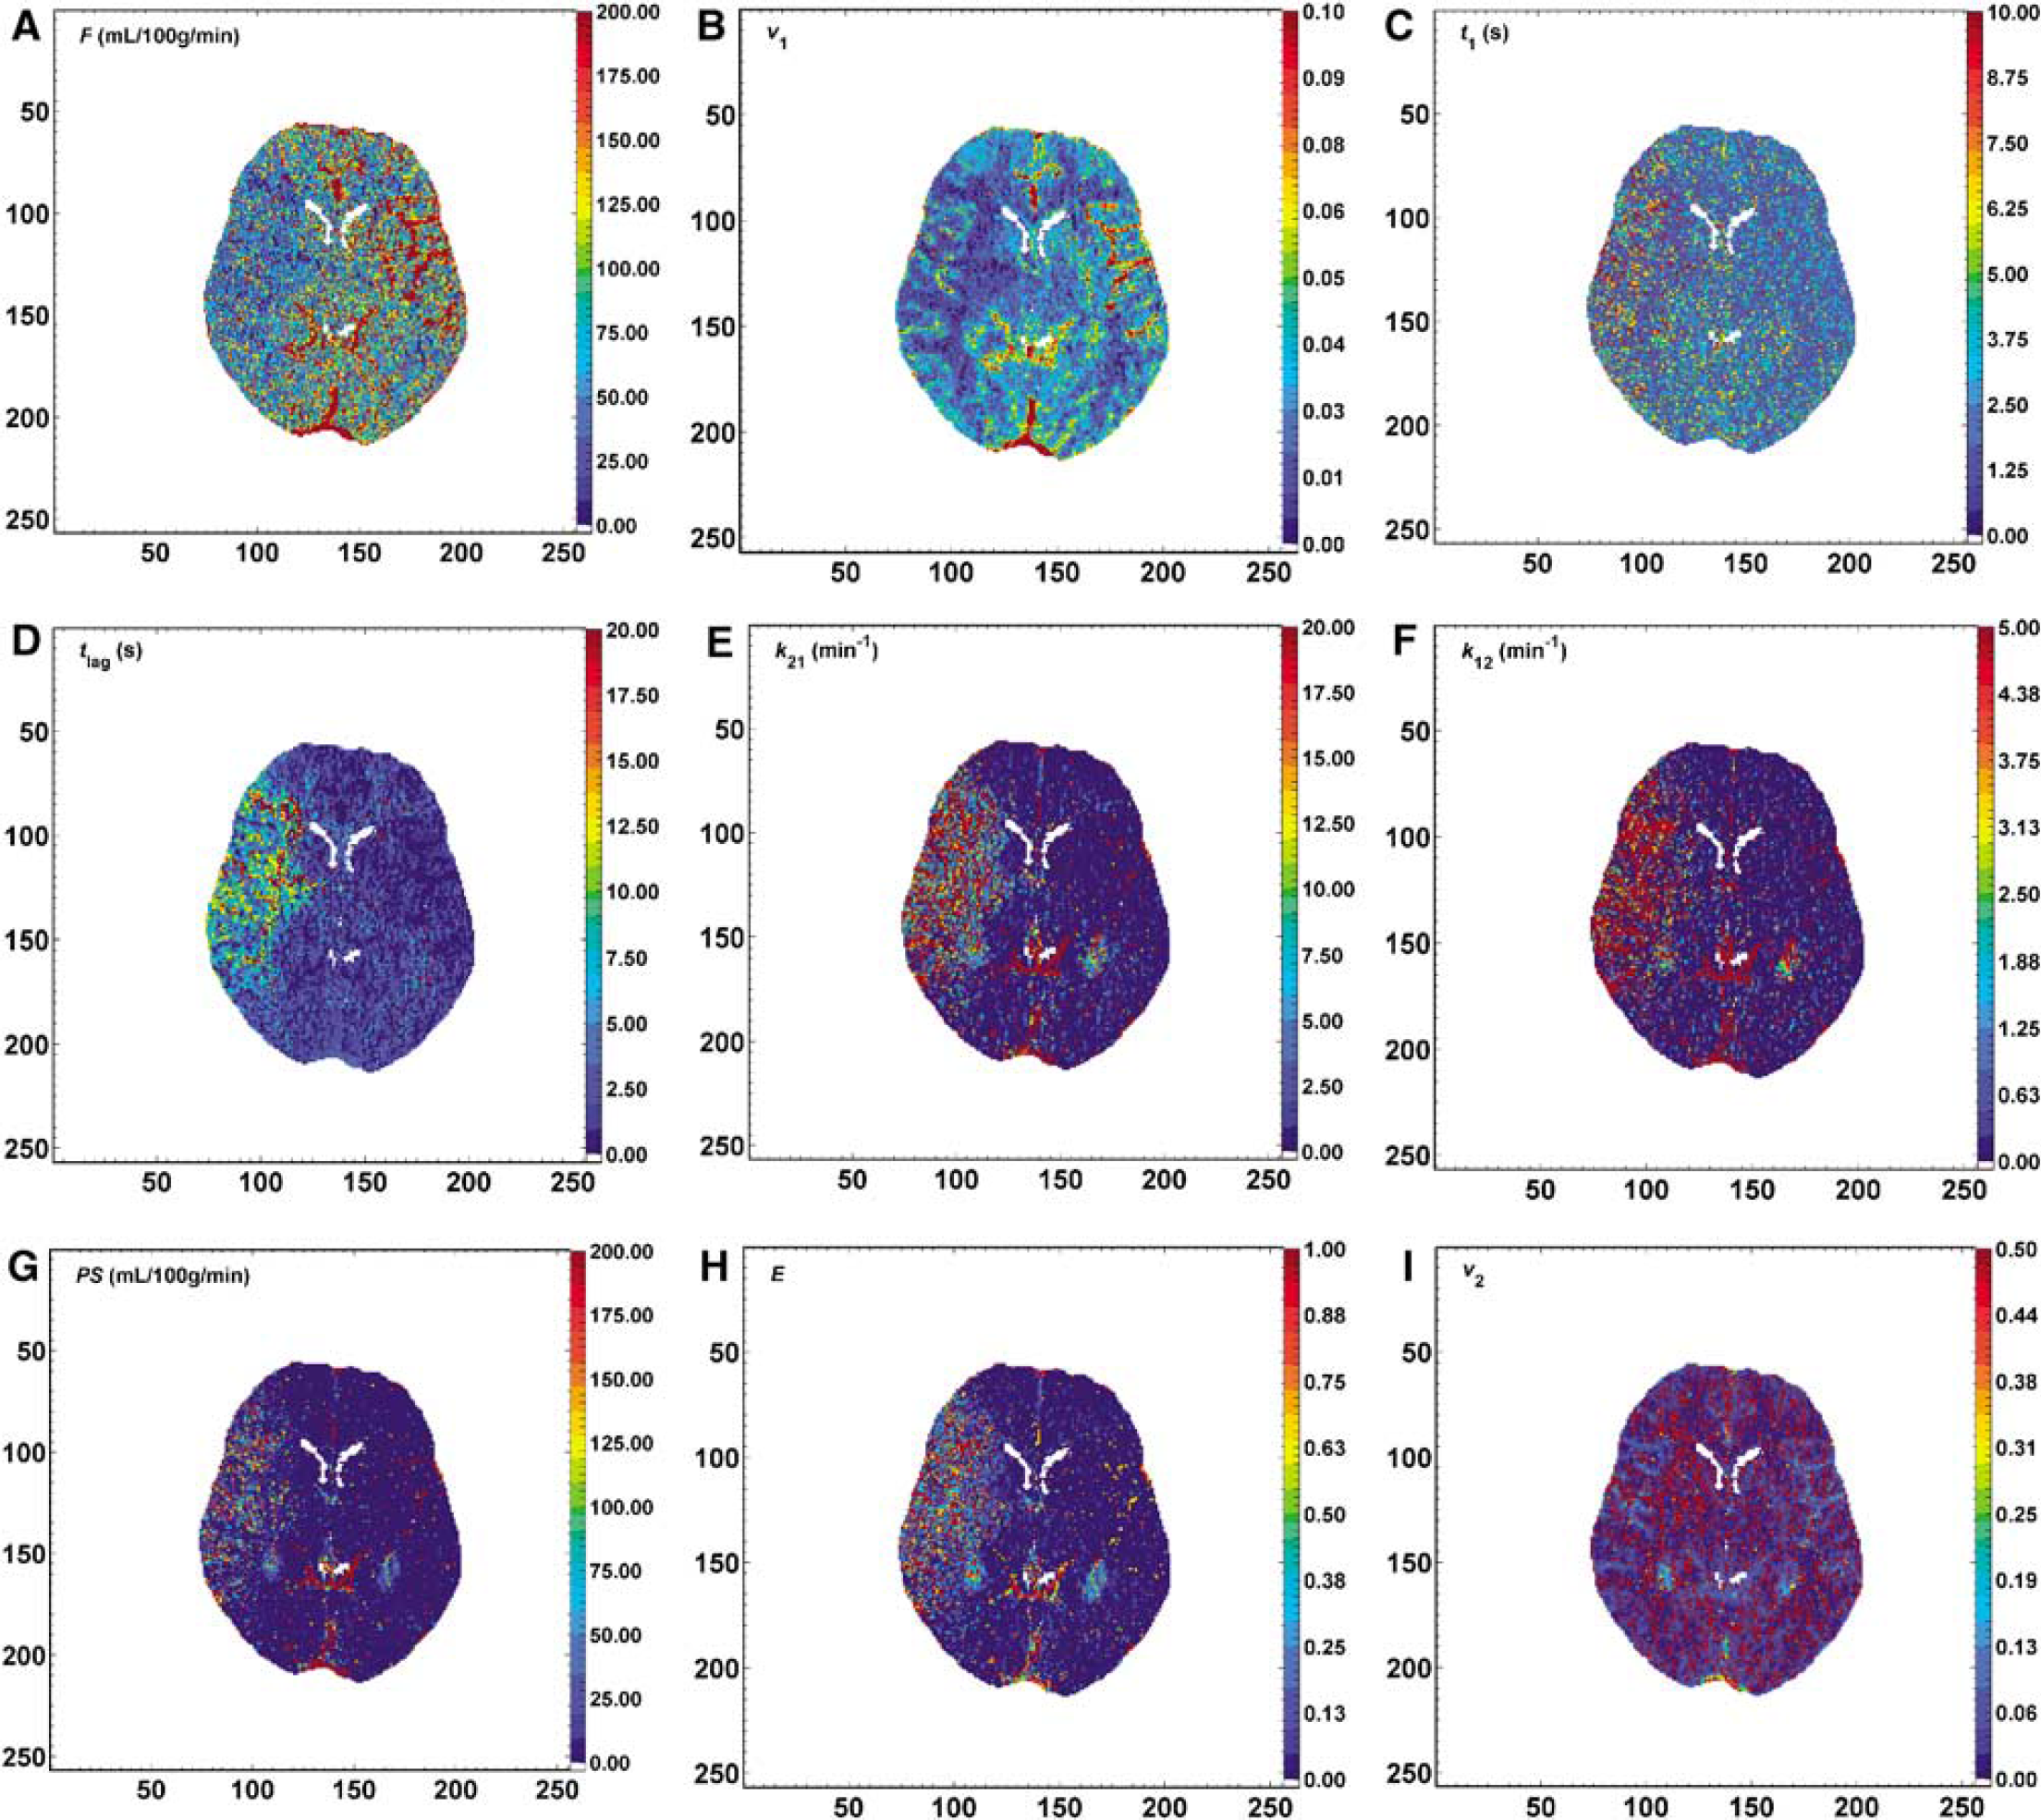
A set of parametric maps that corresponded to F (cerebral blood flow), t1 (intravascular mean transit time), v1 (intravascular blood volume), E (extraction ratio), PS (permeability—surface area product), k21 and k12 (rate constants for transfer of tracer from intravascular space to extravascular extracellular space and vice versa, respectively), and tlag were generated. The parameter maps in the patients with acute stroke were analyzed on an individual basis. Firstly, their quality in identifying the normal brain structures was assessed, that is the ability to differentiate white from grey matter, and on outlining the ischaemic lesion and, secondly, to compare the ischaemic with the contralateral healthy ROIs to observe statistically significant differences.
Positron Emission Tomography Analysis and Image Selection
The PET data sets were converted from the ECAT-7 file format to the Analyze format to allow for spatial normalization into the Talairach space and smoothing in SPM99 (Wellcome Department of Cognitive Neurology, London, UK). A single-subject anatomical template normalized to the same space was then used to facilitate visual selection of a PET slice corresponding to the CT slice. This selection was done in MPI-Tool (ATV GmbH, Kerpen, Germany). This standardized slice passing through the basal ganglia and including the midsection of the anterior horns of the lateral ventricles, nucleus caudatus, putamen, and thalamus was selected for investigation in perfusion-weighted CT and PET images. The matching section was selected by the same investigator in all patients to minimize false registration. For each standardized section, we identified the bilateral regions of each vascular territory, that is the areas fed by the ACA, MCA, and posterior cerebral artery. Three standardized ROIs were symmetrically positioned in each hemisphere on each transverse section of each patient. In ACA and posterior cerebral artery territories, an elliptical ROI of 200 mm2 was drawn in the subcortical white matter and in the MCA territory, a standardized 600 mm2 elliptical ROI was placed over cortical and subcortical brain parenchyma, not too close to the skull to avoid partial volume averaging with vessels.
Two of the three hemispheric regions contained subcortical white matter in ACA and posterior cerebral artery territories and the third region contained mixed cortical/subcortical brain parenchyma in the MCA territory. The ROIs were placed to avoid large vessels, skull, and cerebrospinal fluid-filled spaces. Finally, all the 54 ROIs measured perfusion parameters were subjected to the analysis.
Statistical Analysis
Results are presented as mean ± s.d. The linear correlation coefficient (Pearson's r) was calculated to estimate the correlation of F values obtained by perfusion CT and PET imaging. Regression analysis between the F values obtained by both modalities for every patient was also performed. Hypothesis testing was conducted by using the paired Student's t-test. Histogram analysis was performed to study the difference in perfusion estimates between the voxels within the ischaemic territory and those of the contralateral normal region in the patients with acute stroke. Owing to the large sample sizes of the voxels within pathologic and normal regions for every patient, the z-test was used to test for differences between the various parameter estimates. The linear correlation coefficient (Pearson's r) was also used to correlate the size of diffusion-weighted imaging hyperintense regions with the perfusion CT abnormalities. Significance was denoted by P < 0.05.
Results
Noncontrast Baseline Computed Tomography Scans of the Patients with Carotid Stenosis
The noncontrast cranial CT before the perfusion measurements revealed vascular lesions in all patients. Unilateral cortico—subcortical watershed infarcts were found in four patients, and bilateral subcortical infarcts were documented in six patients. All lesions were above the level of the basal ganglia, which was chosen as the matching slice between perfusion CT and PET examinations. None of the patients had either bilateral lacunar infarcts or extensive white matter lesions. No patient was excluded from the study due to artefacts caused by patient movement.
Correlation between F values Obtained by Perfusion Computed Tomography and Positron Emission Tomography Imaging in Patients with Carotid Stenosis
The mean F value for all patients in the pooled data (54 ROIs) was 37.9 ± 11.2 mL/min per 100 g in perfusion CT and 35.6 ± 9.8 mL/min per 100 g in perfusion PET imaging. The baseline difference of the F values between perfusion CT and PET imaging was not statistically significant (P > 0.05). The correlation coefficient between the F values obtained by the two modalities was r = 0.77 (P = 0.00) (Figure 1). When the F values of each cerebral territory were separately evaluated, the mean values between CT and PET were also significantly correlated (Table 2).
Mean values and correlation coefficients (P value) of the cerebral blood flow (F) measured in the territories of the ACA, PCA, and MCA by perfusion CT and PET examinations
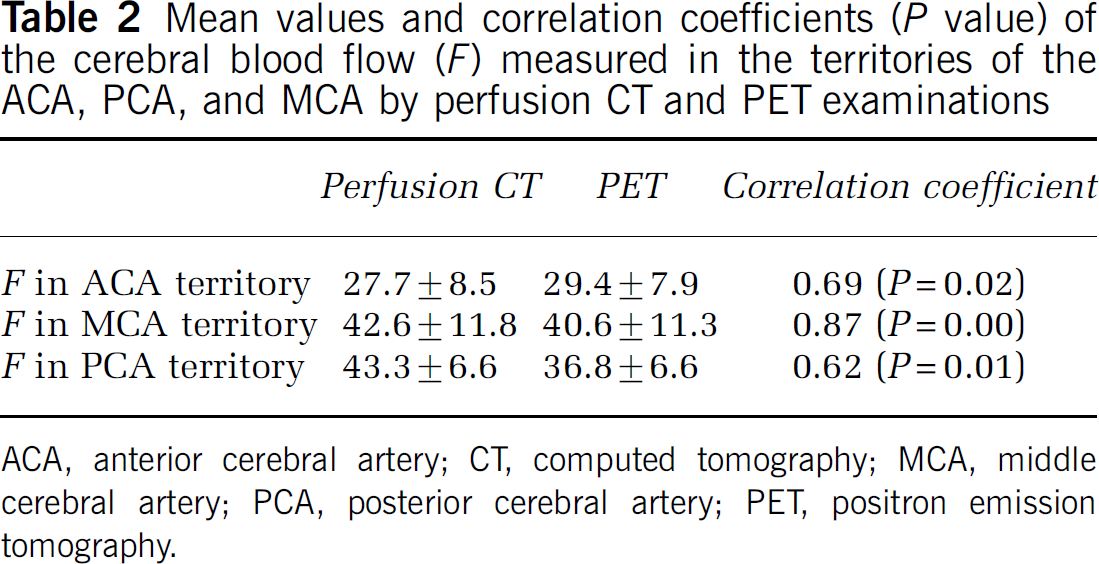
ACA, anterior cerebral artery; CT, computed tomography; MCA, middle cerebral artery; PCA, posterior cerebral artery; PET, positron emission tomography.
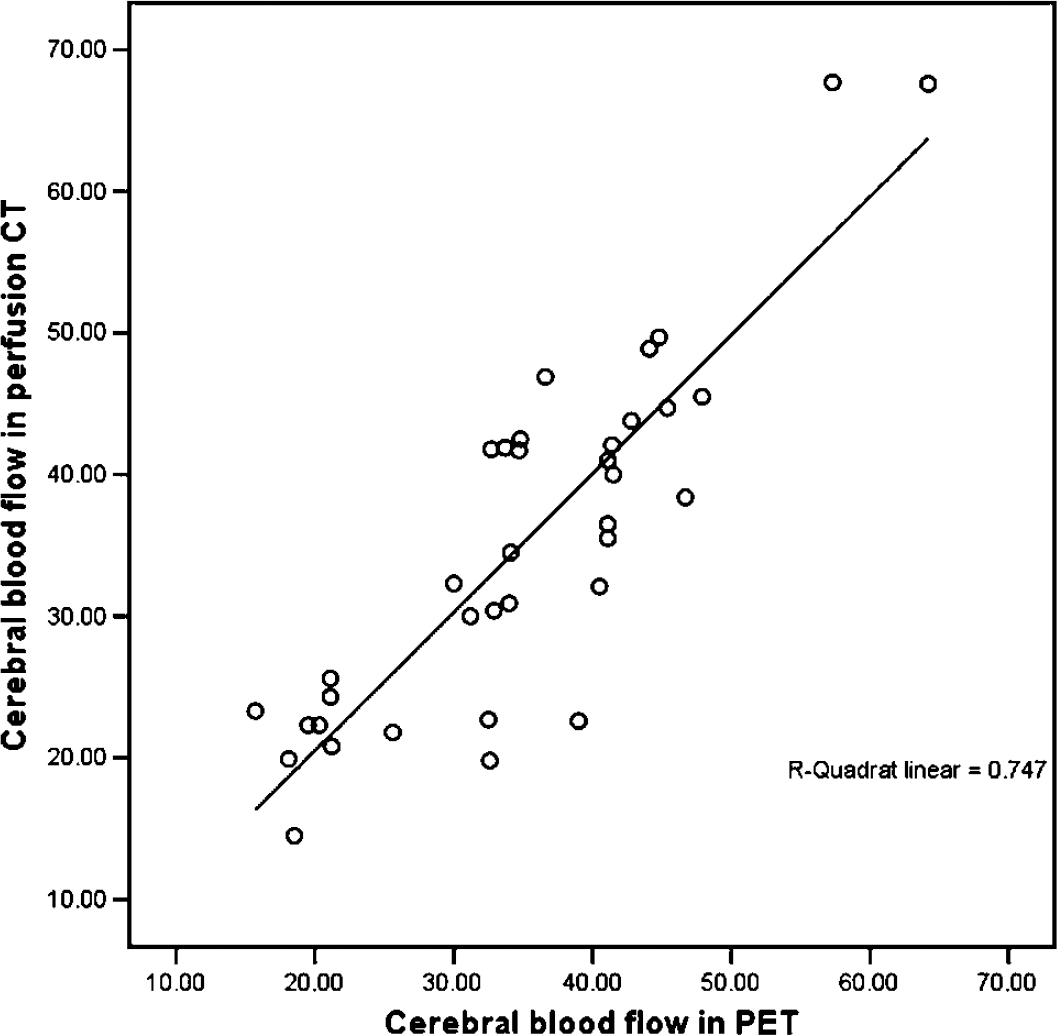
Scatter plot showing the correlation of the CBF in the pooled ROIs (54 ROIs) of both hemispheres between the perfusion CT and PET measurements. The correlation coefficient is r = 0.77 (r2 = 0.75, P = 0.00). The regression analysis showed that FCT = 0.87 &; FPET + 6.78.
Regression analysis of the pooled ROIs (both hemispheres) for every patient revealed significant correlation between F values measured by perfusion CT and PET imaging in seven patients. The linear correlation coefficients ranged from 0.50 to 0.79 (r2-values ranged from 0.45 to 0.79; 0.01 ≤ P ≤ 0.05).
Application of the Distributed Parameter Model Analysis in Perfusion Computed Tomographs of Stroke Patients
A set of parametric maps that corresponded to F, t1, v1, E, PS, k21, k12, and tlag can be generated (Figure 2) for every perfusion CT data set of the patients with acute stroke. As a whole, each set of maps provided a number of anatomical and functional information of the slice that was scanned in vivo. Blood vessels and differentiation between grey and white cerebral matter in the healthy hemisphere was clearly shown in the F and v1 maps. The ischaemic area was better delineated in F, v1, and tlag maps. In three patients, the whole ischaemic area demonstrated significantly elevated E, PS, k21, and k12 values. These patients had a subsequent cerebral haemorrhage in the follow-up imaging. None of them received intraarterial thrombolysis. The mean extent of the ischaemic lesions in the tlag maps was 1633.7 ± 231.3 mm2 (95% confidence interval: 727 to 2485 mm2).
(
Correlation of Perfusion Computed Tomographs with Follow-up Noncontrast Computed Tomograph Studies
Ischaemic lesions were demonstrated on follow-up images in all patients. The mean extent ofabnormalities was 1327.6 ± 360.2 mm2 (95% confidence interval: 759 to 2931 mm2). The correlation coefficient comparing the visually outlined regions of abnormality between the tlag parametric map and the follow-up CT scans was 0.81 (P = 0.003). The extent of the ischaemic lesion between perfusion CT and follow-up imaging did not reach statistical significance (P = 0.06).
Discussion
Validation studies of the applicability of DCE-CT for cerebral perfusion imaging have been attempted using two approaches: (a) correlation of the DCE imaging-derived haemodynamic parameters with the more established microspheres and nuclear medicine techniques (PET) and (b) correlation studies of the haemodynamic parameters obtained from DCE imaging with pathohistological indices. Previous studies (Cenic et al, 1999; Nabavi et al, 1999) found significant correlation between CBF estimates obtained from DCE-CT and fluorescent microspheres in animal studies. For DCE-CT imaging of cerebral tumours, the deconvolution-based analysis demonstrated a quantitative assessment of blood volume, blood flow, and microvascular permeability (Roberts et al, 2002a, b ).
The DP model-based tracer kinetic analysis could still benefit from further clinical validation studies, despite the good confidence in the parameter estimates of the model derived from Monte—Carlo simulations (Koh et al, 2006). In the first part of our study, a strong correlation was observed between CBF estimated by DP model-based analysis of perfusion CT data and PET imaging in the pooled ROIs of our human subjects. Furthermore, the regression analysis showed significant correlations on an individual base in seven patients. We believe that the nonsignificant correlations observed in the remaining two patients can be partly attributed to the different operator-dependent analysis in each study, resulting in inexact correspondence in ROI placement in the vascular territories. Generally, the discrepancies in CBF values' estimation between perfusion CT and PET might be anchored to the tissue characteristics in chronic cerebrovascular disease. A major assumption for the quantification of CBF in perfusion CT is the uniform value of haematocrit levels in both capillaries and large vessels. However, this does not hold true for the altered haematocrit levels in chronic cerebrovascular disease (Yamauchi et al, 1998). Regarding separately the vascular territories, the lower blood flow values in the ACA and posterior cerebral artery territories (compared to the MCA territory) observed in the PET imaging are consistent with our effort to place the ROI subcortically in the white matter. In these cases, the DP analysis of the perfusion data showed significant correlation coefficients; however, in the posterior vascular bed, the perfusion CT values were higher (P > 0.05) than those estimated by the PET. The latter pattern was also observed in the MCA territory; however, here, the larger size of the ROIs might have led to higher correlation coefficients between the two modalities. The overestimation of the CBF by the perfusion CT is a known problem that was found statistically significant by Kudo et al (2003), who tried to minimize this effect with a vascular pixel elimination method. The latter tendency can be attributed to the presence of large cerebral vessels on the surface of the brain; nevertheless, the overestimation in our study as well as in other studies (Bisdas et al, 2006) was not statistically significant, and it seems that by a careful placement of the ROIs, sources of error may be avoided.
In the second part of our study, we applied the DP model analysis in acute stroke patients, where the clinical feasibility of our model was demonstrated. The CBF and intravascular blood volume values were significantly lower in the ischaemic regions according to the pathophysiology of the ischaemic cerebrovascular disease. In the DP model, the new parameter t1 is the mean time of the tracer to transit across a volume of tissue through the capillaries. In other methods, a common term is the mean transit time, MTT, or mean residence time, namely how long the tracer stays within a volume of interest. In normal tissue with intact mature blood vessels, MTT = t1, and thus blood volume, BV = v1. In our patients with stroke, the t1 led to a satisfactory demarcation of the ischaemic region. However, there is an increasing evidence that even in the early acute stroke, a disruption of the blood—brain barrier is possible (Bisdas et al, 2007; Kassner et al, 2005; Latour et al, 2004); this early disruption seemed to be predictive of haemorrhagic transformation, independently of thrombolytic therapy and reperfusion. Our analysis of perfusion images provided detailed maps of the various physiologic parameters associated with the extravasation of tracer and offered the potential of visualizing possible defects in blood-brain barrier in the early stages of ischaemic stroke and to show that statistically significant permeability changes in acute ischaemic stroke. Our intention was not to verify the predictive role of these extravasation parameter values, because our sample was too small and, hence, large population studies are required. Nevertheless, in three patients, the E, PS, k21, and k12 appeared to be statistically significant indices for a blood—brain barrier disruption. The parameter E is dependent on both t1 and k21 in the DP model. This constraints R(t) and prevents nonphysiologic combination of E ≈ 1 and low values of t1 and k21. The efflux rate constant k12 may be used to estimate the volume of the interstitial space, if the partition coefficient is known or assumed. It is plausible to speculate that the absence of permeability abnormalities in the other patients may be characterized as an accidental finding or may be attributed to an inadequate permeability imaging. Specifically, a major issue on the calculation of the permeability disorders on CT perfusion studies is the signal strength of the infarcted area. In the hypoperfused areas with low signal strength due to low perfusion or sparse microvascular density, the tissue concentration curve will show little enhancement. Thus, in the stroke regions, apart from F and v1 that can be correctly found to be small, the other parameters become very error—prone, as their values will not have significant effect on the shape of the calculated Ctiss(t). Moreover, the 45-sec acquisition of the perfusion data might not be inadequate to monitor the whole extravasation of the contrast agent (Goh et al, 2005). Currently, such studies on scan duration for permeability imaging are lacking for the brain parenchyma. These considerations are less important in case of tumour imaging, because in the well-vascularized tumour regions, the signal strength is usually high, and the parameters can be calculated with good confidence.
A new perfusion parameter of physiological importance for stroke imaging is the tlag parameter, which aims to quantify the different time of arrival of the tracer at various locations of tissue, due to the fact that these regions in the DCE images begin to be enhanced at different times. Thus, the arrival time of the concentration curve at the artery (AIF) is different from various tissue regions of the slice in general, and the tlag map allows for visualization of the difference in arrival times between AIF and tissue. The applicability of tlag for stroke imaging is based on the fact that in certain stroke cases, blood supply to the stroked region arrived later (due to a different path or due to obstruction), and therefore the ability to assess this delay would be clinically useful. The deconvolution analysis of DCE images based on truncated singular value decomposition has proved extremely sensitive to tracer delay and requires both the AIF and the tissue concentration curves to begin at the same time instance, which is the time of arrival of the contrast bolus. However, since AIF is estimated from the concentration curve at an artery at a distance from the tissue or via a different pathway from the heart, these two curves could have different bolus arrival times. The delay and dispersal of the bolus of contrast agent in perfusion CT (and also for other methods using nondiffusible, intravascular tracer) is a recognized issue, which is diversely appraised by different investigators (Calamante et al, 2000; Greitz, 1956; Ibaraki et al, 2005; Yamamoto et al, 2004) and may arise from external factors, such as IV administration (injection rate, calibre of the venous cannula), or from host factors such as cardiac output, grade of the vessel stenosis, and collateral circulation. This difference might have been ignored previously when DCE or functional images (by nuclear medicine) were of temporal resolutions of a few seconds interval between data points. However, current DCE images by CT machines can have 1-sec (or less) temporal resolution, and this allows a better depiction of tlag, resulting in a better visualization of the delay and dispersion of the contrast agent, and, thus, in a better delineation of the ischaemic areas in acute stroke. Consistent with the tlag concept is the proposal for a local AIF, which will reduce the errors caused by the delay and dispersion of the contrast agent (Lorenz et al, 2006). Theoretically, the major benefit of the tlag analysis may be the delineation of the cerebral hypoperfusion regardless of the long term or acute underlying cause. The existing evidence shows that several parameters proposed to estimate transit time fail to depict reliably the hypoperfusion in presence of carotid disease (Yamada et al, 2002).
Concerning some technical issues of our measurements, in our perfusion CT measurements, we used the ACA for the placement of the AIF-ROI in contrast to the PET technique, where the radial artery is used as a surrogate input artery to the brain. The ACA has a relatively large calibre and offers the advantage of easy and reliable identification. Its course is nearly perpendicular to the axial plane in perfusion CT, and therefore errors due to volume-averaging artefacts can be minimal. Then, there are different underlying physiological mechanisms between perfusion CT and PET imaging. Cerebral blood flow measurement with PET uses diffusible tracer, and tissue perfusion can be directly measured. Dynamic perfusion CT uses iodinated contrast material, which acts as a nondiffusible intravascular tracer, and therefore absolute tissue perfusion cannot be directly measured. Moreover, both methods have certain restrictions: perfusion CT measurements depend on injection rate, cardiac output, and are based on a restricted slab of tissue section proacquisition, whereas PET measurements offer low spatial resolution and consider a priori that the time—activity curve of radiotracer in the radial artery is the same as in the intracranial arteries, which may not hold true in patients with carotid stenosis or occlusion and collateral channels of flow. As all our patients were power-injected at a standardized rate, variation in host factors may account for differences across the patients in the correlation coefficients of the perfusion CT- and PET-CBF values. Some changes in blood flow after a transfer from the CT to the PET scanner might also be expected. Consequently, the data obtained with the two methods may not be exactly interchangeable.
In the derived parametric maps, the stack of n DCE images could be perceived as an image, where each pixel has n features and be analyzed as a classification problem. As the DP model provides a number of parametric maps, which may be difficult for visual appreciation, a potential development could be to integrate some of the parametric maps to give better visualization of anatomical and physiological features of the tissue slice. Moreover, a major disadvantage of the DP model is its computational complexity, which results in long processing time. In our implementation, the processing time needed to compute the set of parameter maps using the DP model was approximately 2 h on a PentiumTM IV personal computer using Matlab. Some obvious solutions to decrease processing time would be to perform only ROI analysis, smaller map area, lower spatial resolution, and so on.
One possible limitation of our study is the lack of normative data from healthy subjects for perfusion CT and PET imaging, which did not allow us to compare the present blood flow values with those reported in the literature. Nevertheless, we believe that the correlation patterns found in our study are of clinical significance for the validation of the DP model perfusion CT analysis. Finally, the size of our population with acute stroke is small. Second, the infarct size on follow-up noncontrast CT may have been overestimated because of brain oedema compared with chronic tissue outcome or may be underestimated in patients with short follow-up images. A study of a greater number of patients may finalize how far DP model analysis and its physiologic parameters can accurately calculate the ischaemic region and predict the clinical course of the patient providing also valuable information for therapeutic options.
The proposed DP model can also be used to analyze DCE magnetic resonance imaging data, although we have only applied it on DCE-CT images in this study. The contrast agent (gadolinium compounds) typically used in DCE magnetic resonance imaging studies has a similar molecular size as the iodinated contrast medium used in DCE-CT, and the tracer kinetics of the two contrast agents are functionally similar (i.e., both are extracellular compounds and are not metabolized in the tissue bed). Hence, the clinical applicability of cerebral perfusion imaging using both modalities are probably to be similar (Lev and Nichols, 2000). However, for both the T1- and T2-weighted images acquired, the magnetic resonance signal is not linearly related to the concentration of gadolinium, in general. To derive the corresponding concentration—time curves Ca(t) and Ctiss(t) from the dynamic magnetic resonance images, appropriate transformations from the magnetic resonance signal to concentration have been proposed (Ostergaard et al, 1996; Tofts, 1997). Once Ca(t) and Ctiss(t) are estimated from the dynamic magnetic resonance images, they can again be modelled by the convolution integral in Calamante et al (2002) and Ostergaard et al (1996). Thus, the present DP model for R(t) can also be implemented to analyze such data sets when Ca(t) and Ctiss(t) have been appropriately estimated.
In conclusion, CT technology is providing high-resolution dynamic images suitable for the computation of functional images. Better analytical approaches, namely physiological model-based analysis using pharmacokinetics model with more realism, such as the DP model, are becoming more feasible. This work has validated the CBF measurements by means of DP model analysis and has demonstrated the feasibility and benefits of using the two-compartment DP model to analyze DCE-CT images in patients with acute stroke. The parametric maps from the DP model were more informative than the existing approaches available in commercial software packages and the commonly used lumped parameter compartmental models. The major hurdle to clear is to reduce the processing time.