
Abstract
An international group of experts in pharmacokinetic modeling recommends a consensus nomenclature to describe in vivo molecular imaging of reversibly binding radioligands.
Introduction
Imaging molecular targets such as receptors with positron emission tomography (PET) and single photon emission-computed tomography strongly relies on prior decades of research using in vitro radioligand techniques. These in vitro experiments are based on the equilibrium binding reaction between receptors R and free ligand F to form the bound ligand–receptor complex B, with reaction rate constants kon and koff.

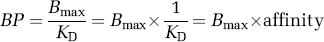
The term ‘binding potential’ was introduced for PET imaging and was also based on in vitro radioligand binding (Mintun et al, 1984). The concept was relatively simple and clarified the linear role of two parameters (receptor density and radioligand affinity) to determine the amount of radioligand uptake in brain. Specifically, Mintun et al (1984) defined binding potential as the ratio of Bmax (receptor density) to KD (radioligand equilibrium dissociation constant). Because affinity of ligand binding is the inverse of KD, BP can be equivalently viewed as the product of Bmax and affinity.
The binding potential concept was embraced by the expanding field of radioligand imaging and often used as the primary outcome measure of experiments. Over several years, binding potential was defined in different ways and noted with varying abbreviations. The lack of consensus on nomenclature continues to cause significant confusion and often necessitates redundant explanations in manuscripts to clarify the specific terms used by the author. We propose a nomenclature that has broad support among experts in quantitation of in vivo radioligand binding.
Background
All in vivo studies of binding potential seek to measure a target receptor in terms of specific radioligand binding. Specific binding is defined as that associated with the target and distinct from radioligand which is free in solution or nonspecifically associated with other macromolecular components. Furthermore, the radioligand should be administered at tracer doses and thereby occupy a negligible (often defined as < 5% to 10%) percentage of target sites. In this way, specific binding will reflect the entire population of target sites, without significantly perturbing the total number of available receptors. Finally, for the purpose of this presentation, we limit ourselves to radioligands that bind reversibly to a receptor, as the terms ‘volume of distribution’ and ‘binding potential’ are not useful for ligands that bind irreversibly. Note that by irreversible we mean a ligand that shows no clear evidence of dissociation over the time period of the PET or single photon emission-computed tomography study.
Cause of Discrepant Definitions
Binding potential quantifies the equilibrium concentration of specific binding as a ratio to some other reference concentration. The cause of the discrepant nomenclatures can be understood by the use of three distinct reference concentrations of the radioligand (Table 1). Because of these three reference concentrations, we recommend three abbreviations for binding potential measured in vivo.
Definitions of three in vivo binding potential values
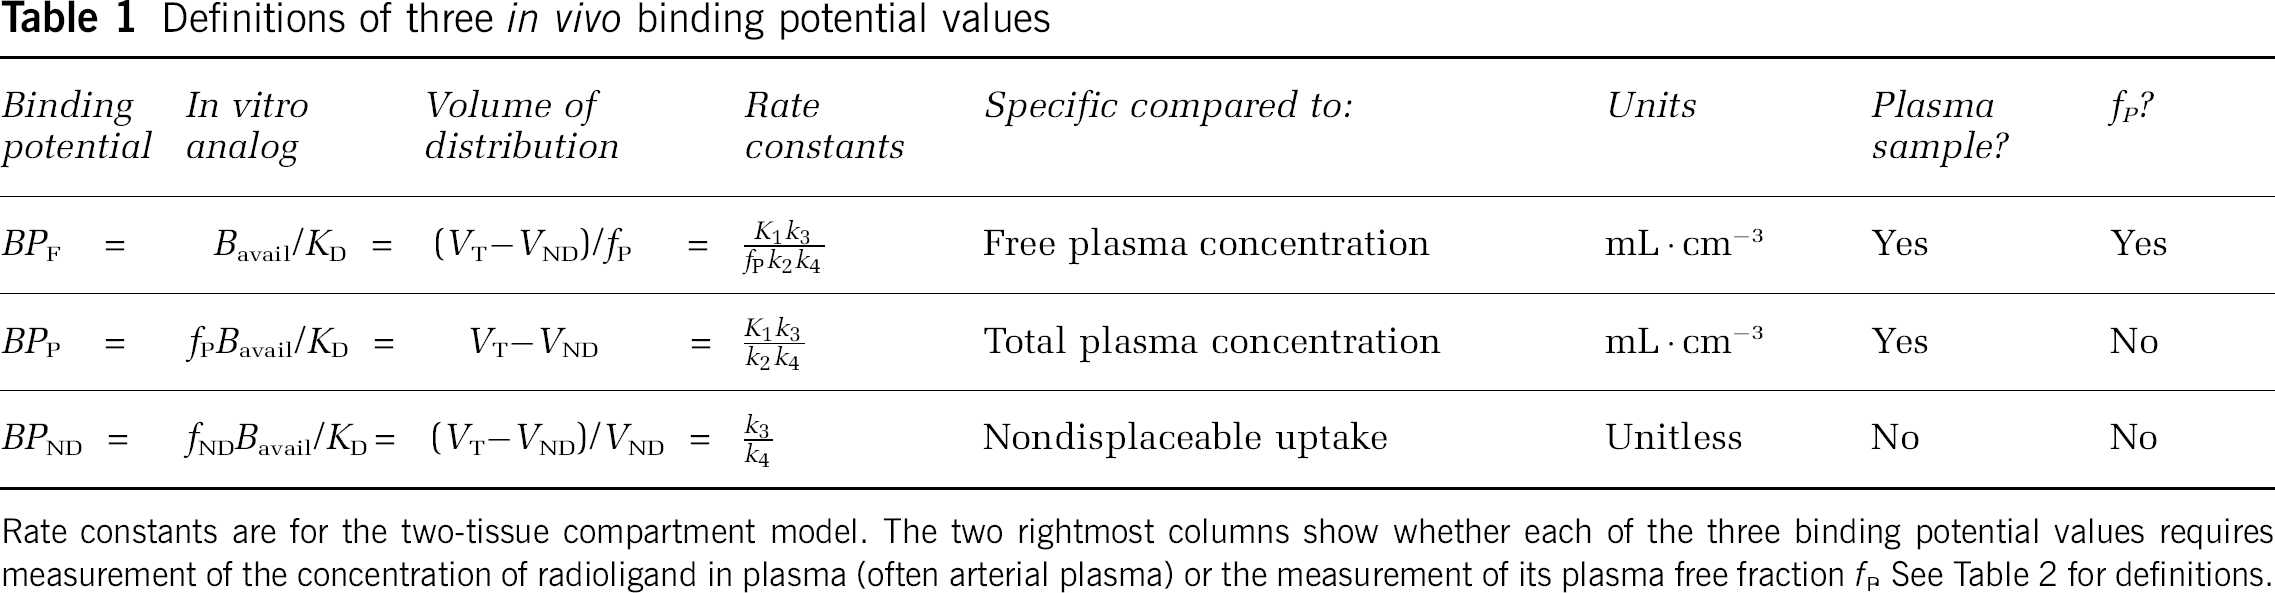
Rate constants are for the two-tissue compartment model. The two rightmost columns show whether each of the three binding potential values requires measurement of the concentration of radioligand in plasma (often arterial plasma) or the measurement of its plasma free fraction fP See Table 2 for definitions.
BPF refers to the ratio at equilibrium of the concentration of specifically bound radioligand in tissue to the concentration of free radioligand in tissue, which is assumed to equal the free concentration in plasma, if the ligand passes the blood–brain barrier only by diffusion (see discussion below).
BPP refers to the ratio at equilibrium of specifically bound radioligand to that of total parent radioligand in plasma (i.e., free plus protein bound, excluding radioactive metabolites).
BPND refers to the ratio at equilibrium of specifically bound radioligand to that of
With this nomenclature, BP without subscript refers to the ‘true’ in vitro measurement of Bmax/KD, and BP with subscripts refers to in vivo measurements that reflect, but typically do not equal, Bmax/KD. Specifically, these terms are proportional to the concentration of unoccupied or available receptor, Bavail. See below for discussion of in vitro versus in vivo measurements.
The motivation for this nomenclature is to remind the reader what factors are present in binding potential. The term BPF reflects the ratio of specific binding to free radioligand at equilibrium. BPP is not corrected for the fraction of ligand that is bound to plasma proteins (fP), that is, BPP equals the product of BPF and fP BPND is not corrected for the free fraction of ligand in the nondisplaceable tissue compartment (fND), that is, BPND equals the product of BPF and fND.
All three versions of binding potential have been used in different forms in the literature and have value depending on the particular application. For example, BPND does not require blood sampling and is relatively easy to implement. However, use of BPND as an outcome measure depends most heavily on the assumption that nondisplaceable uptake is independent of subject groups or treatment effects. BPF and BPP both require measurement of the arterial input function. While BPF may be most ideal from a theoretical view, BPP may be more appropriate if the plasma free fraction is difficult to measure accurately or has a small range with no difference between groups, that is correcting for protein binding differences could simply add more variability to the data.
Volumes of Distribution
In clinical pharmacology, ‘volume of distribution’ typically refers to the volume of blood (or plasma) that would be required to account for the amount of drug in the entire body. For example, if the concentration of drug in plasma is 200 ng · mL−1 and 10 mg of drug are in the entire body, then its volume of distribution would be 50 L. That is, 50 L of plasma contains the same amount of drug as the entire body.
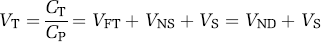
The field of in vivo imaging with radioligands adapted this concept in two ways. First, the target region was regarded as a particular organ (e.g., brain) rather than the entire body. Second, instead of referring to the amount of drug in the entire organ, the target was expressed as the amount of radioligand in a volume of tissue (i.e., a concentration). For example, if the concentration of a radiopharmaceutical at equilibrium is 100 kBq · cm−3 in striatum (CT) and 5 kBq · mL−1 in plasma (CP), then its volume of distribution (VT) is 20 mL · cm−3. That is, 20 mL plasma would be required to account for the radioligand in just 1 cm3 of brain. The units of this new ‘volume of distribution’ are not volume (mL) but a ratio of two volumes (mL and cm−3). Furthermore, although 1 cm3 = 1 mL by SI nomenclature (Taylor, 1995, Table 6, p. 8) and this ‘volume of distribution’ would appear to be strictly unitless, it is important to maintain the units. In summary, the volume of distribution used in most imaging studies is the ratio of the concentration of radioligand in a region of tissue to that in plasma. We express the volume of distribution in units of mL · cm−3 to clarify that it is a ratio of mL of reference fluid to a volume of tissue, where fluid volumes are measured in milliliter and physical volumes are measured in cubic centimeter from PET or single photon emission-computed tomography.
Tissue may contain radioligand that is specifically bound to receptors (S), nonspecifically bound (NS), or free in tissue water (F). Thus, the total concentration of radioligand in the tissue (CT) can be expressed as follows:

Furthermore, nondisplaceable (ND) uptake is the sum of nonspecific (NS) and free ligand in tissue.

The volume of distribution of these three components equals the ratio at equilibrium of each concentration to that of parent radioligand (CP) in plasma, separated from radiometabolites.


Free Fractions fP, and fND
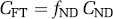
The free fraction of drug or radioligand in plasma is the fraction of the ligand that is not bound to plasma proteins at equilibrium, i.e., that which is freely diffusible in plasma water. The plasma free fraction is referred to as fP, and the concentration of free drug in plasma CFP can be calculated as

The comparable term fND is the fraction of drug that is freely dissolved in tissue water. This tissue free fraction fND is expressed relative to the nondisplaceable compartment.
The parameter fND is defined with respect to the nondisplaceable compartment and is, thereby, usually assumed to be equal in receptor-rich and receptor-free regions, assuming that nonspecific binding (NS) is the same in both areas.
Relation of Binding Potential to Volumes of Distribution
An important corollary of Mintun's formulation is that binding potential equals a particular volume of distribution, namely, that of the specific (receptor bound) radioligand. The equivalence of these two concepts can be seen from the Michaelis–Menten equation describing in vitro receptor binding under equilibrium conditions.

where B is the concentration of receptor bound ligand, Bmax the density of receptors, F the concentration of free radioligand, and KD is the dissociation constant. For low mass dose studies typical of radioligand imaging, F ≪ KD; thus, equation (11) reduces to
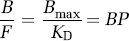
Thus, at tracer doses, Mintun's original definition of binding potential (Bmax/KD) equals the equilibrium ratio of specifically bound ligand (B) to its free concentration (F). In vitro radioligand binding contains only one compartment, and no distinction is appropriate for the free concentration in plasma compared with that in tissue. Conversion of the in vitro terms to in vivo imaging is as follows:


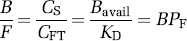
Equation (15) is valid if the ligand enters and leaves tissue by passive diffusion, so that at equilibrium the free concentration in plasma equals the free concentration in tissue, that is CFP = CFT.
Note that in vitro assays typically use homogenized tissue in which all receptors are available to bind to radioligand. In contrast, only a subset of these receptors (Bavail) are available in vivo to bind to radioligand, since some may be compartmentalized, in a low affinity state, or occupied by endogenous transmitter.
After the pattern of clinical pharmacology, the proposed nomenclature could have used only volumes of distribution and not binding potential. Instead, we elected to use portions of both nomenclatures. Binding potential was maintained because of widespread use in imaging and its important theoretical connection to in vitro receptor binding (equation (11)). As binding potential refers to specific binding, additional terms are necessary to describe nondisplaceable and total uptake of radioligand into tissue. We elected to use VT for the distribution volume of total ligand uptake in tissue relative to total concentration of ligand in plasma, since most clinical pharmacology studies use this definition. VND is the distribution volume of nondisplaceable compartment relative to total concentration of ligand in plasma, where VND = VF + VNS.
Because specific binding equals VT–VND,
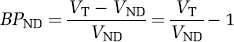
The term VT–VND is sometimes termed the ‘distribution volume ratio’ (DVR). BPND does not generally require arterial plasma measurements and, under typical assumptions, can be ‘directly’ calculated from only brain data using a variety of reference tissue methods (Gunn et al, 1997; Lammertsma and Hume, 1996; Logan et al, 1996). Nevertheless, BPND, can be ‘indirectly’ calculated from volumes of distribution measured with arterial plasma concentrations of radioligand, as shown in equation (16).
BP refers to specific binding as a ratio to other concentrations (free in plasma, total in plasma, and nondisplaceable). In contrast V can be used for specific, nondisplaceable, or total uptake but is always a ratio to total radioligand concentration in plasma. Thus, when numerator and denominator are the same, this nomenclature has two redundant terms, that is VS = BPP. Nevertheless, we recommend this redundancy, because a single document may need terms for only V and another for only BP.
Units of Rate Constants
The standard one- and two-tissue compartment models used in kinetic studies are shown in Figure 1. By common practice, we recommend that the rate constant for transfer from arterial plasma to tissue (K1) use upper case, whereas the remaining rate constants (k2, k3, and k4) are lower case. The primary reason for this special distinction is to note that the units of K1 are different from those of the other rate constants. K1 commonly has units to reflect volume of blood (or plasma) per volume of tissue per minute, whereas the other transfer rate constants (k2, k3, and k4) have units of min−1. K1 is often given in units of mL · mL−1 · min−1, which refers to mL plasma per mL tissue per minute. However, mL is generally reserved for fluids, whereas cm3 is used for solids (Taylor 1995, Section 8.2, p. 23). Thus, we elected units of K1 to be mL · cm−3 to distinguish mL plasma from cm3 tissue (Table 2).
Abbreviations and units
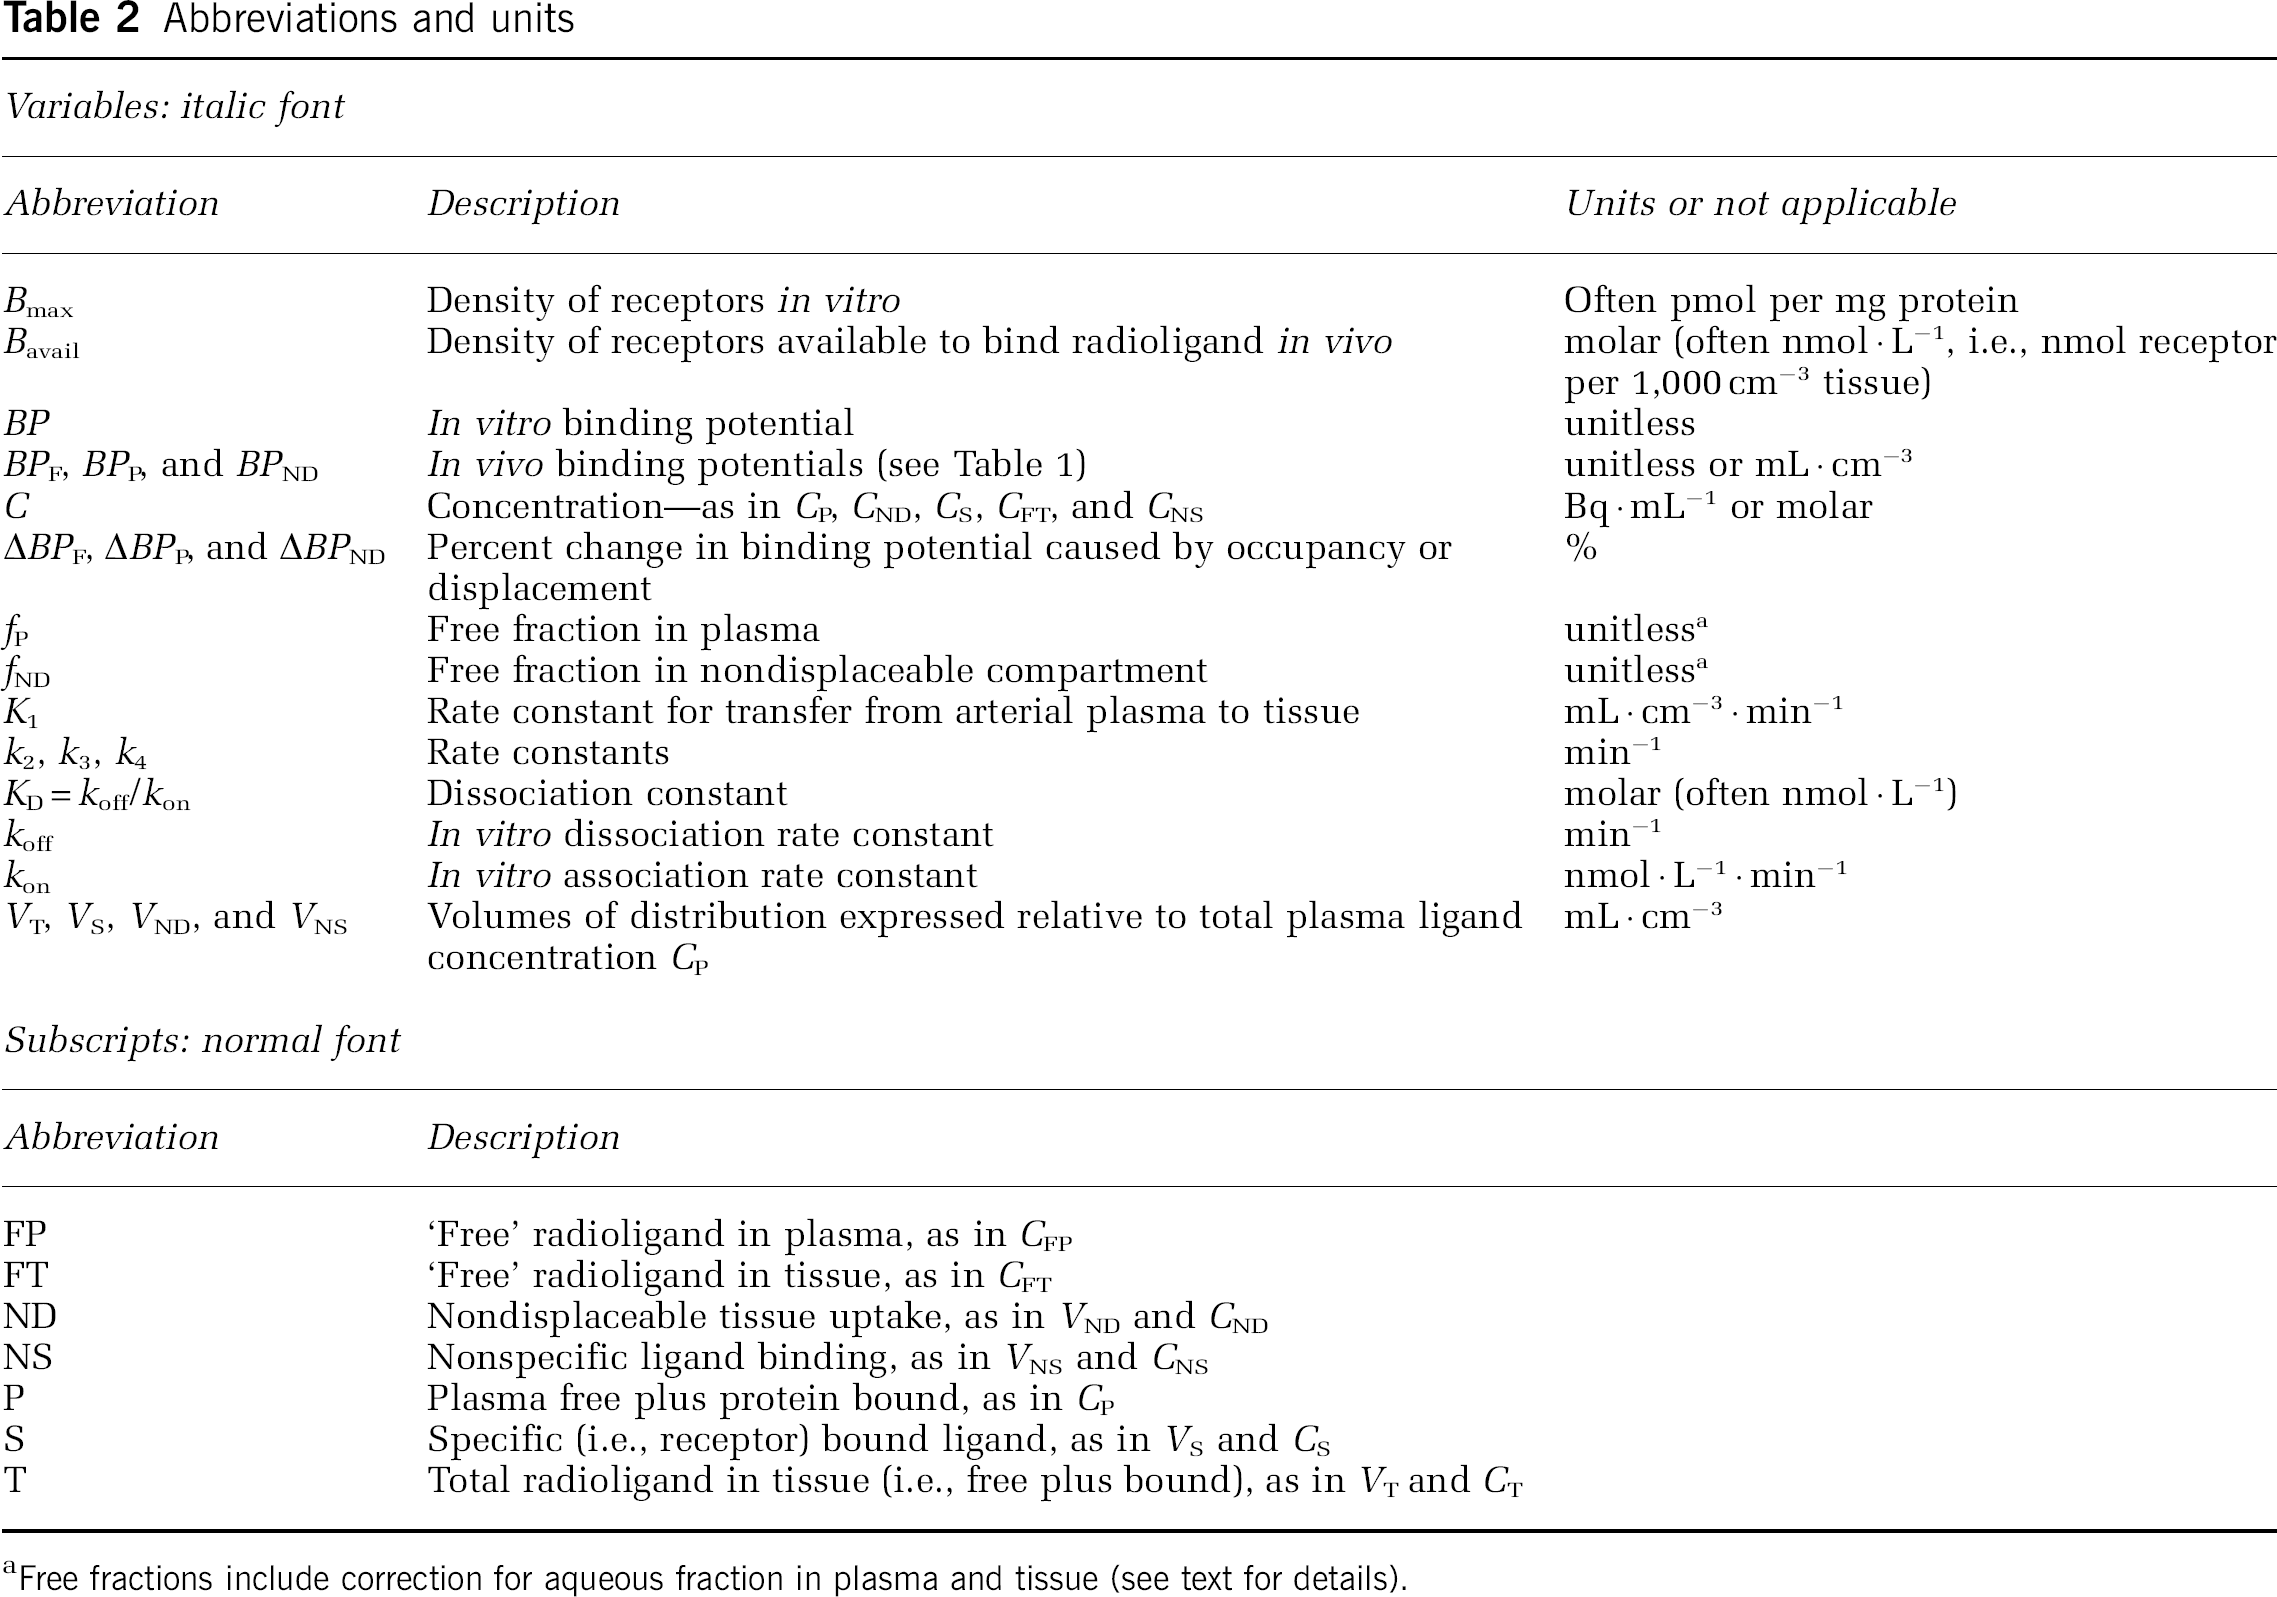
Free fractions include correction for aqueous fraction in plasma and tissue (see text for details).
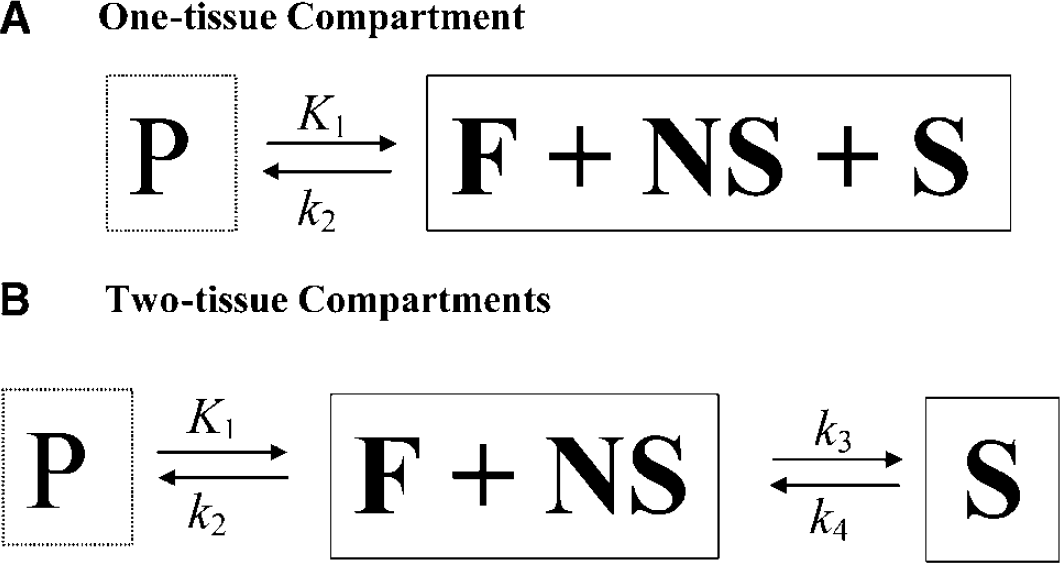
Common compartment models. (
The ratio of K1 to the remaining rate constants will have units of mL · cm−3. As shown below, such ratios determine binding potentials and volumes of distribution, which therefore can also be considered to have units of mL · cm−3. The use of separate units for plasma (mL) and brain (cm3) helps to clarify that the ‘volumes’ in volumes of distribution refer to the mL plasma required to account for ligand in 1 cm3 tissue.
Relation of Compartmental Rate Constants to Binding Potential and Distribution Volume
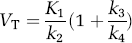
An important concept of pharmacokinetics is that the ratio of compartmental rate constants equals selected equilibrium distribution volumes. The derivation of these relationships is included in many publications (see, e.g., Koeppe et al, 1991; Lassen, 1992). Using the current nomenclature, the resulting equations for BP are included in Table 1 in terms of volumes of distribution. For one- and two-tissue compartment models, volumes of distribution can be calculated from rate constants as follows.
One-tissue compartment model:

Two-tissue compartment model:
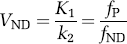
Equation (19) can be derived from equations (9) and (10) under the assumption that at equilibrium, if the ligand enters and leaves tissue by passive diffusion, the free concentration in plasma equals the free concentration in tissue, that is CFP = CFT. Note that strictly this is not the case, but rather the concentration at equilibrium in the aqueous phase of plasma is equal to the concentration in the aqueous phase of tissue. As the aqueous volume fractions in plasma and tissue differ, we should add these volume fraction terms to equation (19). However, we chose to leave equation (19) in this form, with the proviso that, strictly, fP and fND are not dimensionless, but include the correction for aqueous volume fractions in plasma and tissue. Note that both these fractions are close to 1.0.
Relation of In Vitro Receptor Binding to Kinetic Parameters
The central concept of the in vivo binding potential is that it measures the ratio of the available receptor density to the equilibrium dissociation rate constant, both of which had been investigated in prior decades using in vitro techniques. Most investigators think that radioligand measurements of binding potential reflect Bavail/KD, although the subtleties of the in vivo condition continue to be investigated actively. The in vivo rate constants have also been compared with in vitro rate binding constants. With the assumptions that the in vivo k4 equals the in vitro koff and that the free and nondisplaceable ligand are in rapid equilibrium, the relevant equations for the two-tissue compartment model are shown below.
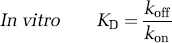


If these in vivo equations for k3 and k4 are substituted in Table 1 (column of rate constants), they do mathematically confirm that BPF = Bavail/KD, under the assumption of passive diffusion of the radioligand across the blood–brain barrier. Nevertheless, several radioligand studies suggest that the in vivo k4 is much smaller than the in vitro koff, as stated in equation (22). That is, the in vivo rate of dissociation (k4) is much slower than the in vitro rate (koff). This phenomenon has been shown for several neuroreceptor ligands in which displacement of the radioligand occurs far more rapidly than could be attributed to the slow k4 rate measured in typical baseline conditions of negligible receptor occupancy (Laruelle et al, 1994; Robertson et al, 1991). Despite this apparent discrepancy between k4 and koff, both k3 (which posited as a function of three variables) and k4 appear to be similarly decreased by a constant factor such that their ratio is proportional to the in vivo KD, which sometimes approximates that found in vitro. The cause of this apparent proportional scaling in k3 and k4 is unknown but has been ascribed to radioligand rebinding in a relatively isolated compartment referred to as the synaptic barrier (Delforge et al, 1996; Votaw et al, 1993).
The total available receptor concentration (Bavail) can be measured in vivo if imaging is performed at multiple specific activities, that is by varying the occupancy of the receptor by the radioligand. Such studies may be useful to help elucidate the differences between in vitro and in vivo conditions.
In summary, most researchers think that BPF reflects in vivo measurements of Bavail and KD. Nevertheless, conditions for in vivo radioligand binding may differ in many ways from the controlled in vitro environment, including temperature, multiple compartments, receptor trafficking, phosphorylation state, and competition with endogenous neurotransmitter. Although the result of complex conditions, in vivo radioligand binding can sometimes monitor important parameters like competition with the endogenous transmitter (Laruelle, 2000).
Receptor Occupancy and Displacement
A wide variety of imaging studies are aimed at measuring changes in occupancy of receptors owing to exogenous drugs or endogenous neurotransmitters. For example, in clinical pharmacology, the effects of drugs are related to the percentage of receptor sites occupied by the drug. This receptor occupancy can be defined as
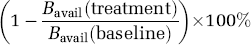
where Bavail(treatment) is the density of available receptors under the drug treatment condition. The in vivo experiment can be used to measure a percentage change in binding potential owing to reduced receptor availability and can be measured with BPF, BPP, or BPND:
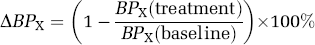
where BPX denotes one of the binding potential formulations. The percent change in BPX and receptor occupancy will be equivalent under ideal conditions if the other parameters contributing to BPX (e.g., KD or fP) do not change between control and treatment conditions. In addition, if ΔBPX is not asymptotic to 100% at progressively higher drug concentrations, then some correction is necessary to estimate receptor occupancy from ΔBPX.
Summary
The field of in vivo radioligand imaging has generated several different nomenclatures and abbreviations (see Table 2). We did not review these variations, so as not to confuse the reader. We think that these varying nomenclatures are confusing and detrimental to the field. Thus, we recommend the consensus nomenclature in this manuscript to improve the clarity of communications. We provide terminology for only two compartmental models (i.e., one- and two-tissue) and recognize that additional models and new discoveries will require additional terms. We hope that this basic structure will provide a useful pattern for future additions to this nomenclature.
Disclaimer
Although this article was written as part of Dr Innis's official duties as a government employee, the views expressed in this article do not necessarily represent those of NIMH, NIH, HHS, or the United States Government.