
Abstract
This is the first in vivo determination of the vesicular monoamine transporter (VMAT2) density (Bmax) and ligand–transporter affinity (Kdapp) in six unilaterally 6-hydroxydopamine (6-OHDA) lesioned rats using micro-positron emission tomography (PET) imaging with [11C]-(+)-α-dihydrotetrabenazine (DTBZ). A multiple ligand concentration transporter assay (MLCTA) was used to determine a Bmax value of 178 ± 32 pmol/mL and a Kdapp of 47.7 ± 9.3 pmol/mL for the non-lesioned side and 30.52 ± 5.84 and 43.4 ± 15.52 pmol/mL for the lesioned side, respectively. While Bmax was significantly different between the two sides, no significant difference was observed for the Kdapp. In addition to demonstrating the feasibility of in vivo Scatchard analysis in rats, these data confirm the expectation that a 6-OHDA lesion does not affect the affinity; a much simpler binding potential (BP) measure can thus be used as a marker of lesion severity (LS) in this rat model of Parkinson's disease. A transporter occupancy curve demonstrated negligible transporter occupancy (∼1%) at a specific activity (SA) of 1100 nCi/pmol (assuming an injected dose of 100 μCi/100 g), while 10% occupancy was estimated at 100 nCi/pmol. An indirect measurement indicated that the degree of occupancy as a function of SA is independent of LS. Finally, BP measurement reproducibility was assessed and found to be 11% ± 7% for the healthy and 8% ± 12% for the lesioned side. Quantitative PET results can thus be obtained even for severely lesioned animals with the striatum on one side not clearly visible provided accurate image analysis methods are used.
Introduction
Small animal positron emission tomography (PET) imaging is recognized to be a very powerful tool to investigate animal models of human disease in vivo. While extensively used in whole-body studies, small animal brain PET imaging presents its own intrinsic challenges; the small brain size requires a much higher imaging resolution compared with human scanning; a plasma input function is more difficult to obtain and to determine reliably because of the small blood volume available in these animals and the tracer mass effect needs to be taken into consideration more carefully, especially considering that the injected mass-specific dose of activity (typically 100 μCi/100 g in rodents) is often 50 to 60 times higher than in human subjects. Nevertheless, in light of an increasing number of animal models related to neurodegenerative mechanism, there is an increasing interest in using dedicated small animal PET imaging to assess their characteristics and their relation to human disease. While ideally suited to this task, small animal brain imaging needs to be very carefully performed to achieve sufficiently accurate results capable of quantitatively detecting treatment or disease induced changes.
Among the known neurodegenerative disorders, Parkinson's disease (PD), which affects the integrity of the dopaminergic system, is one of the more prevalent ones. Parkinson's disease is known to affect approximately 300/100,000 of the general population (Schoenberg et al, 1988), and the exact origin and mechanisms of disease progression are still not completely understood. The oldest and most commonly used model of parkinsonism in rats is obtained by 6-hydroxydopamine (6-OHDA) lesioning (Ungerstedt, 1968) of the ascending dopaminergic projections from the substantia nigra pars compacta through in situ stereotaxic injections of the toxin in the medial forebrain bundle or in the striatal tissue itself. While already extensively investigated with post-mortem methods and postsynaptic tracers, little is known about the feasibility of investigating presynaptic lesion-induced changes in vivo in this model.
In this study, we have explored the ability to investigate one aspect of the presynaptic function of this model in vivo using the monoamine vesicular transporter (VMAT2) tracer [11C](+)-α-dihydrotetrabenazine (DTBZ) in six unilaterally lesioned rats. The intact striatum was used as an internal control condition for each animal. Although tracers binding to VMAT2 such as DTBZ are not specific for the dopaminergic terminals alone, 90% of monoaminergic innervation in the striatum is of dopaminergic origin (Kish et al, 1992), thus making DTBZ an ideal tracer to assess lesion severity (LS) in a unilateral model of PD. Indeed, a previous study has shown a significant correlation between PET binding measures and post-mortem autoradiographic measurements using the racemic form of this tracer ([11C](±) dihydrotetrabenazine) (Strome et al, 2006). A very common outcome measure for a tracer with reversible trapping such as DTBZ is the binding potential (BP), defined here as Bmax/Kdapp, where Bmax is the total transporter density and Bmax is the ligand–transporter dissociation constant. The superscript ‘app’ (apparent) emphasizes that the dissociation constant is measured in vivo, where the environment (primarily the presence of the endogenous ligand) is not as tightly controlled as in an in vitro binding study, and thus may affect the measurement of the true affinity. The label further denotes the fact that the free ligand concentration estimated from the PET data is not the free ligand available for binding, owing to concentration gradients of the ligand throughout the various tissue components and the nonspecific binding of ligand to tissue proteins. A lesion-induced BP reduction was clearly expected; however, to correctly interpret such reduction it was necessary to verify the expectation that the 6-OHDA lesion would only induce a change in transporter density and not in affinity; since the lesioning had been performed several months before scanning, any residual effects of any acute change were unlikely to be present at the time of this study. The determination of Bmax and Kdapp requires a multiple scanning protocol, thus increasing the complexity of the study. Since this is, to our knowledge, the first application of this tracer to in vivo small animal imaging, several methodological issues needed to be addressed, such as the useful range of DTBZ specific activity (SA) that leads to negligible receptor occupancy, and the ability to correctly identify the position of the lesioned striatum in the PET images.
To determine Bmax and Kdapp, the multiple ligand concentration receptor assay method of Holden et al (2002), here renamed as the multiple ligand concentration transporter assay (MLCTA), was used with one procedural difference: in this study, a bolus tracer injection was used. The validity of this approach is addressed in both the Materials and methods and Results sections.
Materials and methods
Determination of Binding Potential and Multiple Ligand Concentration Transporter Assay
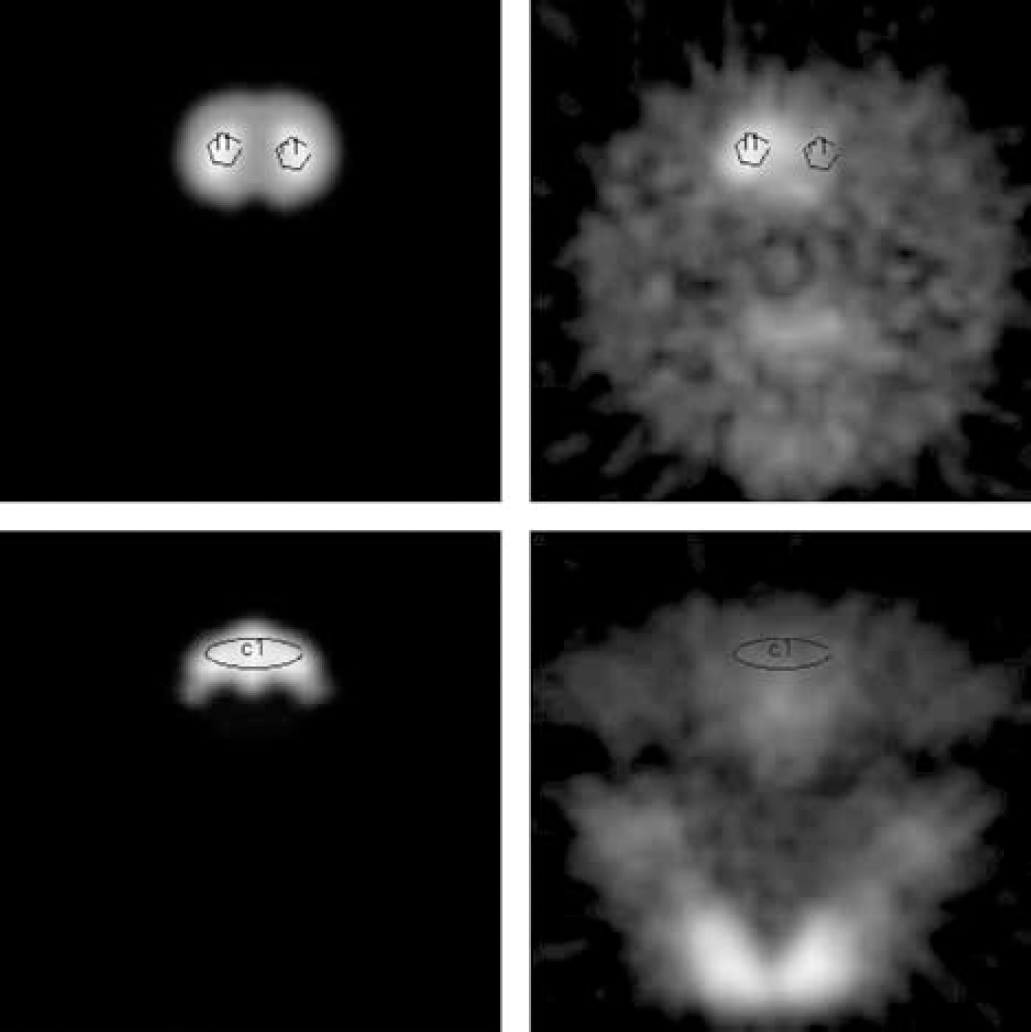
The MLCTA (MLCRA) method is described in detail in Holden et al (2002), where several approaches to the estimation of Bmax and Kdapp from the measured data were investigated. All approaches are based on the relation between the equilibrium concentration of bound ligand B and the concentration of free ligand F with which it is equilibrated:
While all examined approaches provided consistent values, a linear method corresponding to Equation (2) was found to be the most robust:
where (B/F)g is the BP as determined from the graphical Logan method (Logan et al, 1996) for each tracer SA value, BP is the binding potential extrapolated to zero transporter occupancy (vertical intercept) and B is the bound tracer concentration calculated as (S–C)/SA, where S and C are striatal and cerebellar radioactivity concentrations averaged from 30 to 60 mins after tracer injection, Bmax is obtained by extrapolating the fitted line to the (B/F)g zero value (horizontal intercept), which corresponds to the maximum possible bound ligand concentration. This value has been argued by Delforge et al (2001) to provide an accurate estimate of the true total concentration of binding sites in a tissue. A comment on the effect of the use of a bolus versus bolus + constant infusion injection to determine (B/F)g and B is in order. While the determination of (B/F)g with the Logan approach is not affected by the tracer administration method, a single bolus injection may results in the time dependence of both the bound and the free tracer concentrations, which would be potentially in contrast with the equilibrium assumption of Equation (1). To check how significant this effect might be, we compared the graphical method derived B/F values with those obtained by evaluating the ratio (S–C)/C. An agreement between the B/F values calculated with the two methods is interpreted as an indication of equilibrium between compartments (Logan et al, 1996).
Radiochemistry and Determination of the Specific Activity
A modification of the method described by Kilbourn and co-workers (Kilbourn et al, 1995; Adam et al, 1999) was used to synthesize [11C](+)-α-dihydrotetrabenazine. In brief, (+)-9-O-desmethyl-α-DTBZ trifluoroacetate (120 μg) was methylated with [11C]methyliodide in a solution of acetonitrile (400 μL) in the presence of tetrabutyl ammonium fluoride (420 μg). High SA [11C]methyl iodide is produced via the gas-phase reaction of [11C]methane with I2 (Larsen et al, 1997; Link et al, 1997) The high SA for DTBZ was greater than 1000 Ci/mmol. The product was purified by high-performance liquid chromatography and obtained with more than 95% radiochemical purity.
Stock Solution Preparation
(±)-α-DTBZ stock solutions were prepared by dissolving (±)DTBZ in the minimum of warm ethanol and diluted with saline to make a 0.75-mmol/L solution. This solution was used to prepare a 0.075-mmol/L stock solution. Stock solution concentrations were precisely determined from standard calibration curves on analytical high-performance liquid chromatography (HPLC) before use.
Specific Activity Adjustment and Measurement
The tracer production was initiated such that the final formulation was completed 23 mins (just over 1 half-life) before the anticipated time of injection. The yield (in mCi) was measured and the amount of stock solution to be added was calculated using the following formula:

where X is the yield at the time of formulation (mCi), Y is the desired (+)-enantiomer SA (Ci/mmol) at time of tracer injection, and Z is the racemic stock solution concentration (0.75 mmol/L).
The factor of 2.2 in the denominator accounts for the decay occurring between the time of formulation and the anticipated time of injection while the factor of 2 in the numerator corrects the formula for the calculation of the SA of the (+)-enantiomer only. Non-radioactive (+)-enantiomer existing in the DTBZ is insignificant compared with what is added for the purposes of the stock solution volume calculation. The requisite volume was added, the vial was weighed, and an aliquot for precise measurement of the SA was drawn. The remainder was delivered to the PET imaging center. An exact volume of the quality control sample was injected onto the previously prepared analytical HPLC system. The SA of the adjusted solution was confirmed, and the investigators were notified of any small adjustment of the injection time required to attain the exact desired SA.
The range of tracer DTBZ SA used in the study was between 5.54 and 5045 Ci/mmol (or alternatively expressed as 5.54 and 5045 nCi/pmol to make it more commensurate with the units used for Bmax and Kdapp). For the planning of the MLCTA studies, this range of SA was broadly categorized into three intervals: high SA (SA > 1200 nCi/pmol), medium SA (50 < SA < 1200 nCi/pmol) and low SA (SA < 50 nCi/pmol). The volume of the injected tracer never exceeded 0.5 mL.
Animals
Six 6-OHDA unilaterally lesioned male 400 to 450 g Sprague–Dawley rats were included into the study. The animals were anesthetised with isofluorane and placed in the stereotaxic headholder with the skull flat between Lambda and Bregma. A 2% solution of 6-OHDA hydro-bromide (8 μg in 4 μL 0.05% ascorbic acid in saline; Sigma-Aldrich, Canada Ltd., Oakville, Ontario, Canada) was infused at two sites along the medial forebrain bundle [site 1: AP −2.8 mm, ML −1.8 mm, DV −8.0 (all from Bregma); site 2: AP −4.7 mm (from Bregma), ML −1.5 mm (from midline), DV −7.9 mm (from skull) according to Paxinos and Watson (1998)]. Approximately 30 mins before the 6-OHDA infusion the subjects were given desipramine (25 mg/kg i.p.) to protect noradrenergic fibers (Breese and Traylor, 1971; Kelly and Iversen, 1976; Whishaw et al, 1994). The 6-OHDA solution was delivered at a rate of 1 μL/min using a 50 μl Hamilton syringe through a 26-gauge needle. After the injection of 6-OHDA, the needle was left in place for an additional 3 mins before withdrawal. After surgery, rats were monitored and placed in a recovery incubator for 2 to 4 h, and then returned to their home cage after full recovery from the anesthesia. The animals were allowed several weeks recovery before undergoing the PET studies.
Scanning
The rats were anesthetized with a 1% isoflorane gas mixture. All studies were performed on a SIEMENS/Concorde Focus 120 (Laforest et al, 2004), which has an approximately (1.8 mm)3 resolution and plane-to-plane separation of 0.79 mm. Each rat was positioned in a stereotaxic headholder similar to that used in the surgical procedures. This headholder was securely mounted to the scanner bed and allowed fairly accurate repositioning of the animal within the ear bars and the mouthpiece. An anesthetic cone fit over the nose, allowing smooth delivery of the gas without movement of the animal. After a 6-mins transmission scan with a 57Co source, a 1-h long emission scan was performed starting at tracer injection. Based on our earlier pilot studies, a radioactivity amount of 100 μCi/100 g of rat body weight was injected. Data were histogrammed into 6 × 30, 2 × 60, 5 × 300, 2 × 450, and 2 × 480 secs, and reconstructed using Fourier rebinning and filtered backprojection after applying normalization, scatter, attenuation, and sensitivity corrections. Attenuation correction factors were calculated after segmentation and energy scaling of the measured attenuation coefficients.
To limit the amount of time the rats were kept under anesthesia, each rat underwent a maximum of two scans per day, where the two tracer injections were administered 150 mins apart. The higher SA scan was always performed first to avoid potential residual tracer occupancy effects. Since the animals were not moved between these two scans, the low SA scan was always performed following either a medium or high SA to be able to re-use the same region of interest (ROI) placement as defined on the corresponding higher SA scan; on the low SA scan the striata were not as clearly visible. The standard scanning protocol thus involved either a high and a low SA, or a medium and a low SA on the same rat on the same day followed by a high or a medium SA on another day. In addition to the scans required for the MLCTA analysis, each rat underwent an additional high SA scan performed on a different day to assess scan-to-scan reproducibility. Three out of the six rats thus underwent a total of four scans (two high SA, a medium and a low), while one underwent two additional medium SA scans (two high SA, three medium SA and one low SA) and two underwent one additional medium SA scan (two high SA, two medium SA and one low SA). While only one of the two high SA scans was included into the MLCTA analysis, the additional medium SA scans were performed to verify the conformation of the data to a linear model (Holden et al, 2002). Care was taken to reposition the animals as accurately as possible between separate scanning sessions. All studies were approved by the UBC Animal Care Committee.
Data Analysis
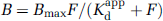
For the first high (or medium) SA tracer scan, the entire acquired data set was first reconstructed into a single time-integrated image frame to facilitate the placement of regions of interest. A brain atlas (Rubins et al, 2001), which contains the delineation of the structures of interest, in particular the striata and the cerebellum, was manually realigned to the brain area. Using the realigned atlas as guidance, a 6 mm2 circular ROI was placed on each striatum on five consecutive planes and a 16 mm2 ROI was placed on the cerebellum on three consecutive planes. Since the realignment was not always perfect, it was found that a manual placement of the ROIs on the PET images using the realigned atlas as guidance was more accurate than transporting atlas defined ROIs onto the PET images. Figure 1 shows an example of PET images and coregistered brain atlas. The ROIs thus placed on the integrated image were then replicated on each frame of the dynamic sequence. The same ROIs were placed on the second scan of each rat, since it was performed on the same day without moving the rat. Scans of the same rat performed on different days were co-registered between themselves using Automatic Image Registration (AIR) (Woods et al, 1993). AIR realignment was carried out using masks to isolate the brain volume and exclude non-brain regions of the images. Masking eliminated possible alignment errors because of inconsistent position and orientation, between images, of brain areas (of interest) and highly visible non-brain structures such as the rats' mouths or throat-adjacent glands. With this procedure the realignment was found to be accurate to approximately a single pixel (< 0.8 mm) for brain regions near easily identifiable non-lesioned striatal bright spots in images and only slightly worse for the cerebellar regions. For each ROI a time activity curve (TAC) was obtained; for each structure of interest (healthy and lesioned striatum and cerebellum) the TACs were averaged over planes and used as input to the graphical and MLCTA analyses.
Example of PET image planes corresponding to the striata (top right) and the cerebellum (bottom right) and corresponding realigned digitized brain atlas planes (left top and bottom). The black circles and ellipses indicate the location of the ROIs. The importance of using the atlas as guidance is especially clear when trying to identify the position of the lesioned striatum on the PET image.
Determination of Transporter Occupancy and Lesion Severity
Transporter occupancy was defined as Occ = 1–BPSA/BPhigh SA and was plotted as a function of log10(1/SA) and fitted to the expression
The occupancy analysis was performed for the healthy side, as the higher variability of the data from the lesioned side made a meaningful occupancy plot difficult to obtain. An estimation of transporter occupancy was however obtained indirectly using an LS measure defined as LS = 1-BPlesioned side/BPhealthy side. Lesion severity was estimated for each rat for each SA scan. If the occupancy induced by a given SA were to be significantly different for each side, the LS estimate would change as a function of SA. The behavior of LS as a function of SA was thus considered an indirect estimate of the effect of tracer SA on transporter occupancy for the lesioned side.
Reproducibility
Scan-to-scan reproducibility was calculated for three outcome measures, the BP for the lesioned and healthy sides and the LS. Reproducibility, expressed in percent values, was defined as the absolute value of the ratio of the difference between the outcome values obtained in the two scans and their mean, multiplied by 100.
Results
Transporter Density and Ligand-Transporter Affinity
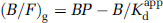
The Bmax and Kdapp values obtained for each rat are listed in Table 1 for each side together with the correlation coefficient r2 for each case. In one rat (rat 5), the noise in the data for the lesioned side was too large to obtain meaningful results. However, the low SA used for this rat was 5.54 nCi/pmol, which was by far the lowest SA attempted and therefore the signal on the lesioned side was extremely low. An example of the images obtained at different SA values is shown in Figure 2, while the linear plots obtained with the MLCTA method are presented in Figure 3. For the healthy side the correlation coefficients are extremely high (r2 > 0.94), even for the rat that was scanned at five different SA values (rat 3) on different days (r2 = 0.99) indicating that the data conform very well to a linear model. As expected, the correlation coefficients are worse for the lesioned side, likely due to a much lower signal in the striatal region and greater difficulty to exactly reposition the ROIs from scan to scan. The LS values shown in Table 1 were calculated from the scan performed with the tracer at the highest SA. Five of the six rats were rather severely lesioned (LS > 70%), while one was only mildly lesioned (9%). The effect of the lesion on Bmax and Kdapp was therefore investigated by comparing Bmax and Kdapp values between the healthy and the lesioned side for the four severely lesioned rats for which the data were available. For these four rats, the Bmax and Kdapp for the healthy side were 164.9 ± 21.7 and 49.0 ± 10.4 pmol/mL respectively, while for the lesioned side the corresponding values were 30.5 ± 5.8 and 43.4 ± 15.5 pmol/mL. The Bmax values were significantly different (P = 0.002), while no difference was found for Kdapp (P = 0.5). When the results from the healthy side of all six rats were included in the parameter estimate, Bmax and Kdapp were found to be 178 ± 32 and 47.7 ± 9.3 pmol/mL, respectively. These findings indicate that the long-term effects of 6-OHDA lesioning are restricted only to transporter density, while leaving the affinity unchanged; the studies were performed several months after lesioning when residual effects of any acute changes are unlikely to be present.
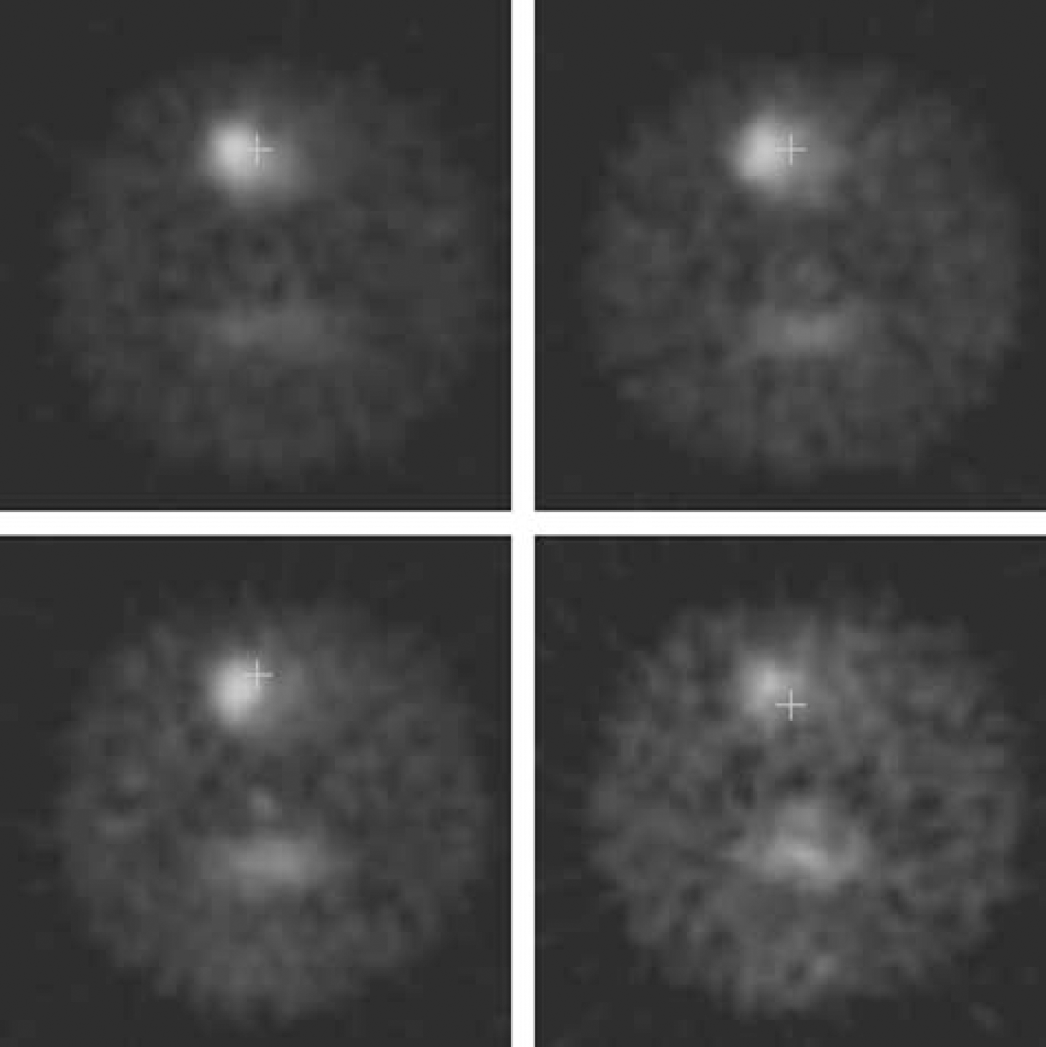
Image from the same rat scanned at an SA of 1445 nCi/pmol (top left), 83 nCi/pmol (top right), 35.4 nCi/pmol (bottom left), and 9.9 (bottom right). The effect of decreasing effect on DTBZ signal is clearly visible as a reduced contrast between the striatal image and the background.
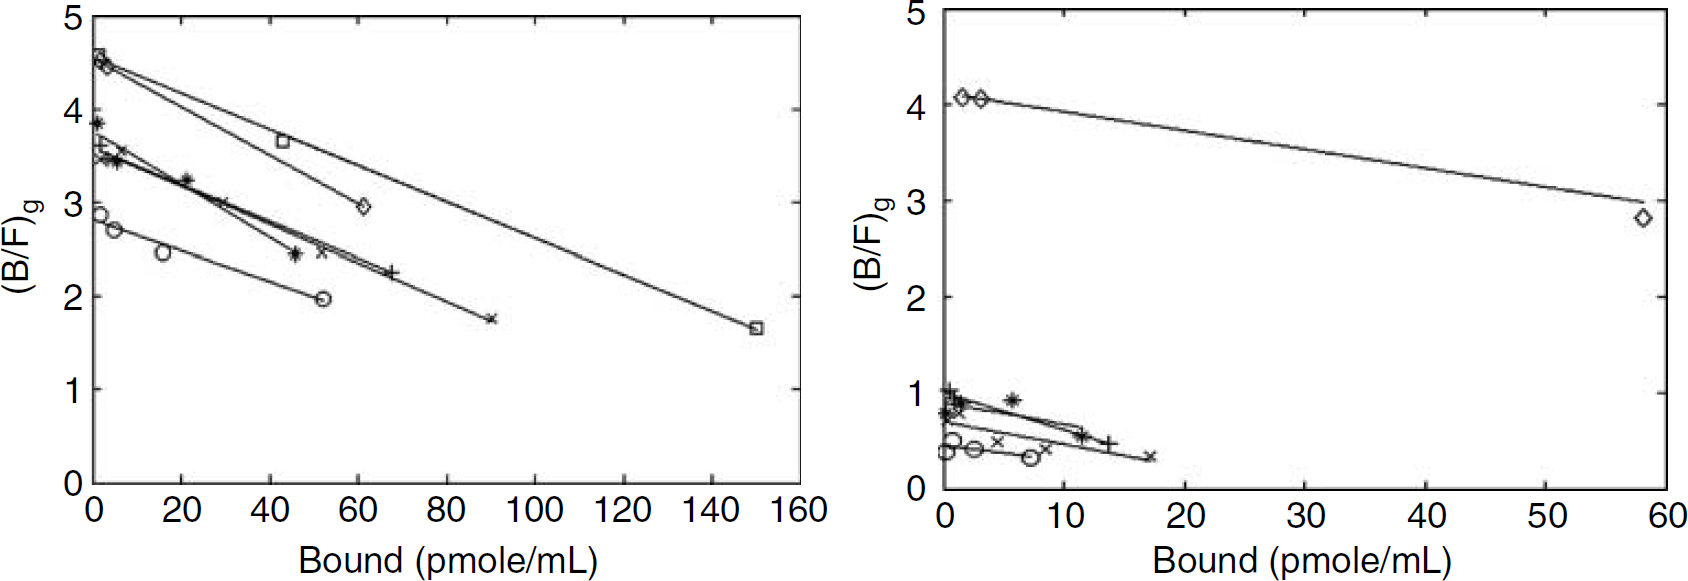
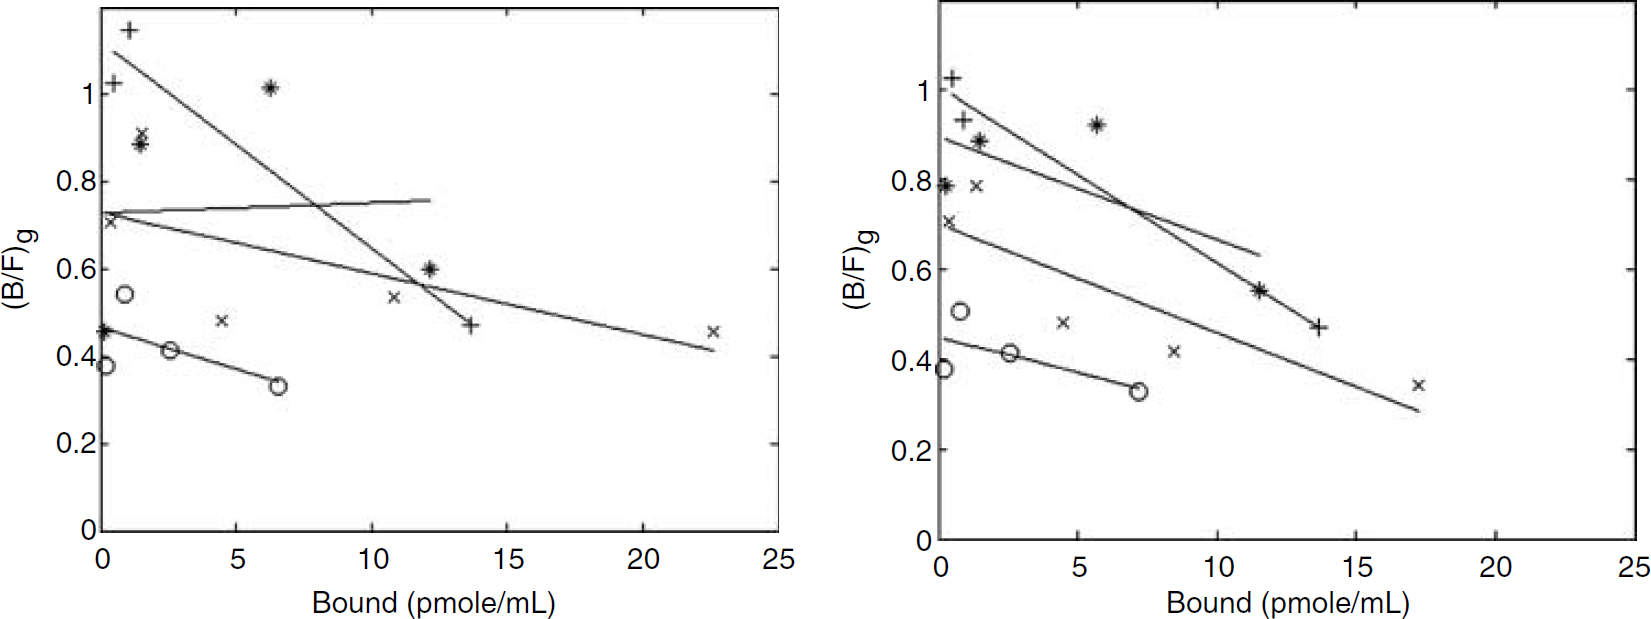
MLCTA analysis plots: (B/F)g as a function of B (pmol/mL). Healthy side on the left and lesioned side on the right (five out of the six rats). The same symbol corresponds to the same rat.
Bmax and Kappd values for the six rats together with the correlation coefficients of the MLCTA linear fit (see Figure 2) and assessment of lesion severity (LS)
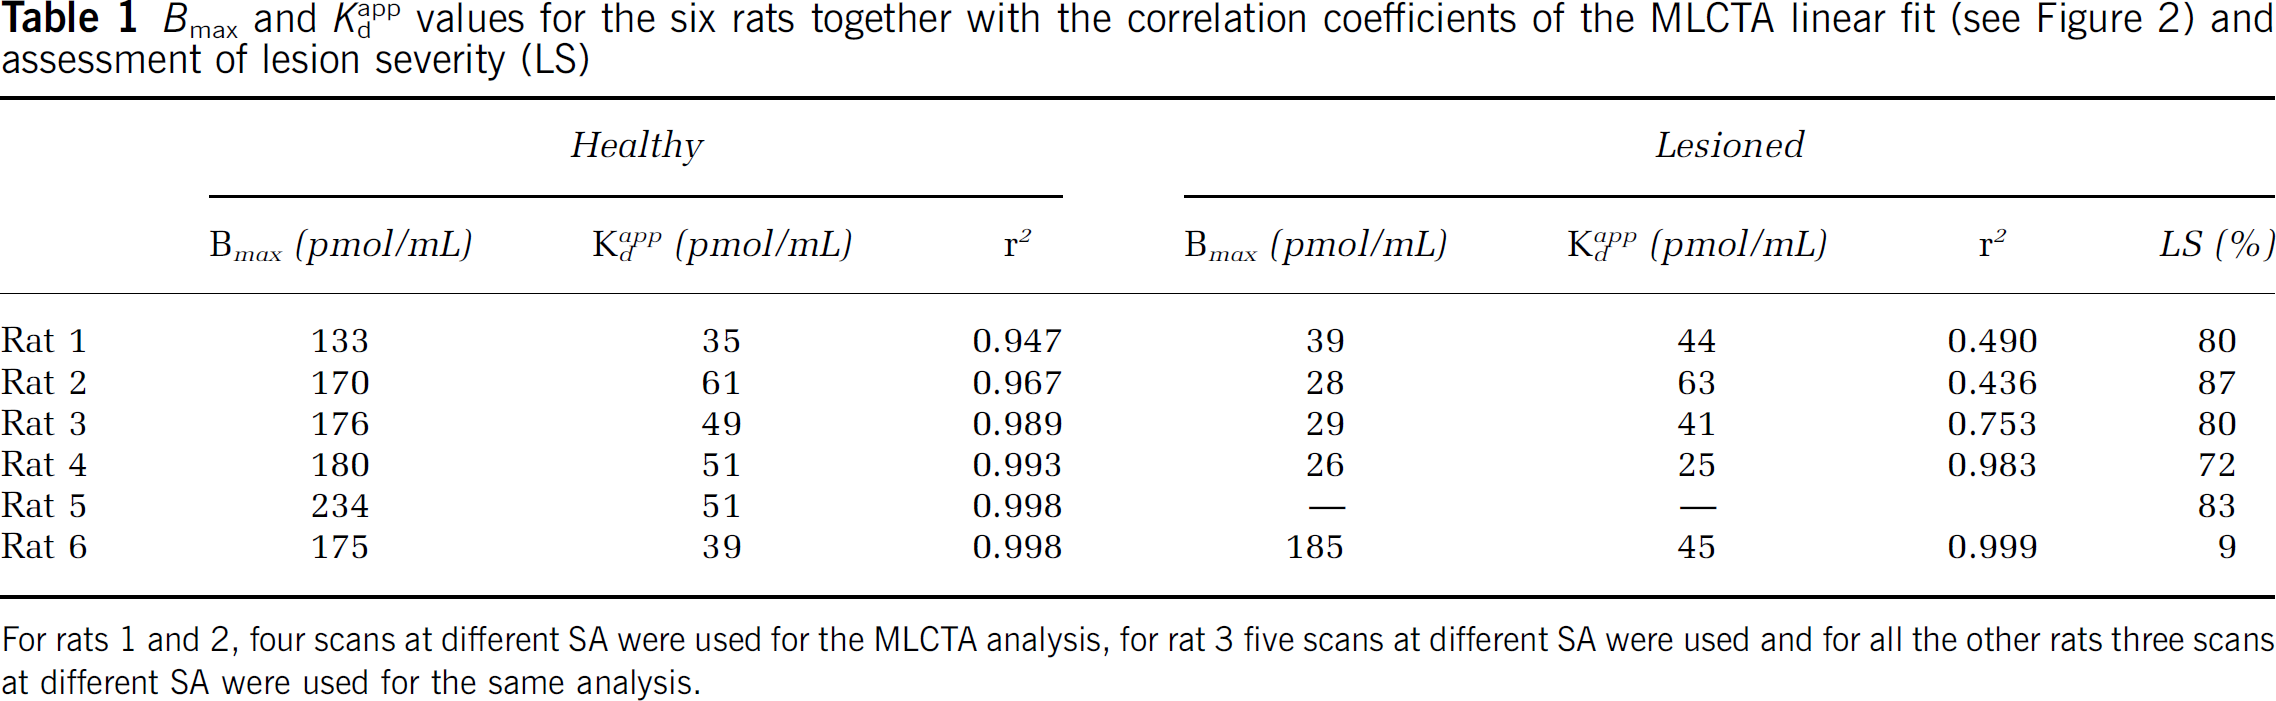
For rats 1 and 2, four scans at different SA were used for the MLCTA analysis, for rat 3 five scans at different SA were used and for all the other rats three scans at different SA were used for the same analysis.
Transporter Occupancy and Lesion Severity
Transporter occupancy curves together with the corresponding fits are shown in Figure 4. It can be observed that an SA of approximately 1100 nCi/pmol leads to less than 1% occupancy while an SA as low as 100 nCi/pmol still only induces an occupancy of approximately 10% (assuming an injected dose of 100 μCi/100 g, these values correspond to 0.028 μg of tracer/100 g of animal weight and 0.31 μg of tracer/100 g of animal weight, respectively).
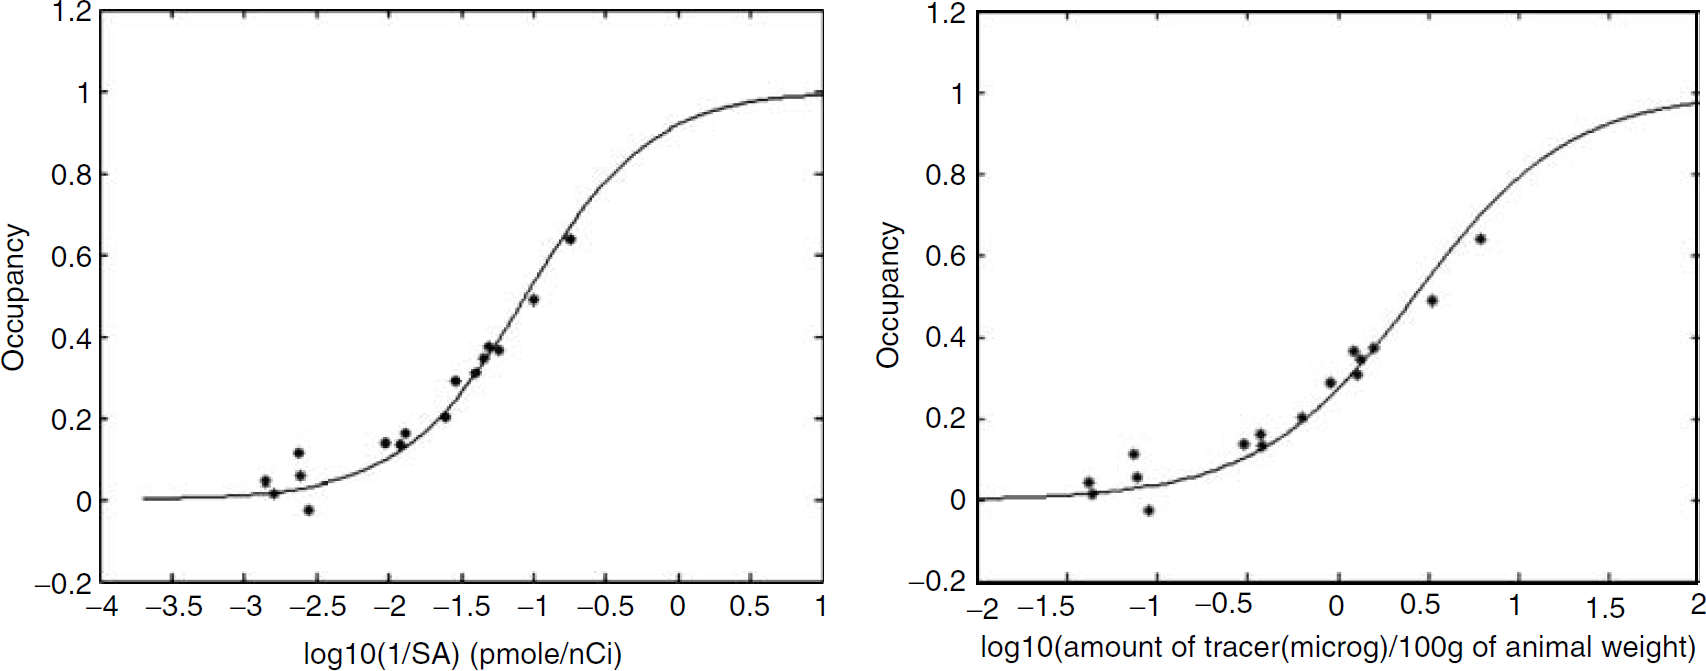
Occupancy curves as a function of 1/SA (left) and amount of tracer injected (μg/100 g of animal weight) (right).
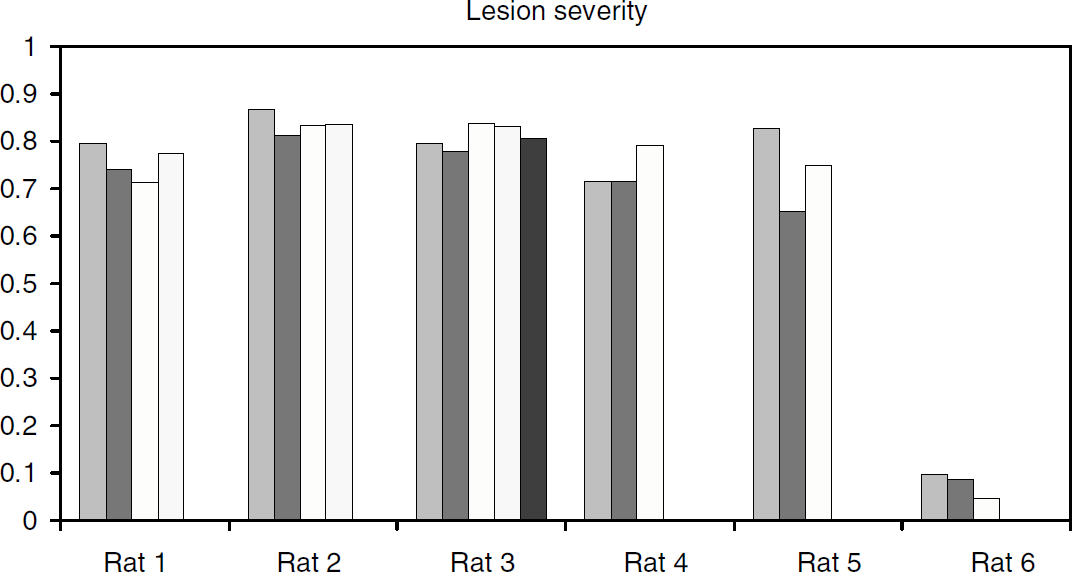
Lesion severity estimate for each rat: the value for each column belonging to the same rat is obtained from a scan at a different SA in decreasing order from left to right.
Tracer Administration Method
Linear regression analysis between the (B/F) values obtained by averaging the striatal and cerebellar time courses over the last 30 mins and calculating (S–C)/C and the (B/F) values obtained with the Logan method yielded the equation (B/F)ratio = 1.10 (B/F)Logan–0.056 with an r2 = 0.99. The B/F values spanned the range 0.5 to 5.0 and included the results from the studies performed at all SA values for both the healthy and lesioned side. Since the ratio derived B/F values are slightly higher than the corresponding Logan derived B/F values, the use of bolus administration rather than bolus followed by infusion may introduce a small positive bias into both the Bmax and Kdapp values estimated from the data. However, given the excellent correlation between (B/F)ratio and (B/F)Logan, such bias is very consistent and independent of LS and SA value.
Reproducibility
The reproducibility for the BP was 11% ± 7% for the healthy and 8% ± 12% for the lesioned side, while LS reproducibility was 8% ± 14%. The large variability in the LS reproducibility is entirely due to the very mildly lesioned animal, where LS was estimated to be 6% and 9% in the two scans. If the LS reproducibility estimate is limited to the five more severely lesioned animals it is found to be 2.2% ± 2.6%.
Discussion
Several image analysis issues needed to be carefully addressed to obtain these results. The use of the brain atlas in guiding ROI placement on both the lesioned side and the cerebellum as well as the realignment between scans of the same rat performed on different days was found to be essential. The impact of this procedure is presented in Figure 6, where the (B/F)g values obtained as SA varied are shown for the lesioned side for the four severe lesions. For the data on the left, ROIs were placed as accurately as possible when visually comparing PET scans, but no realignment or use of brain atlas as guidance was utilized. The right panel repeats the data in Figure 3 for these four cases. Clearly no sensible parameter values could be obtained from the less refined analysis. Careful analysis was also essential to obtaining good reproducibility values and enabled the identification of the region corresponding to the lesioned striatum, which would otherwise not have been easily or reproducibly defined.
Multiple ligand concentration transporter assay analysis plots: (B/F)g as a function of B (pmol/mL) for the lesioned side of the four more severely lesioned rats; before (left) and after (right) image realignment and use of atlas defined regions as guidance.
The bolus injection method was indirectly found to satisfy the equilibrium requirements fairly well, thus allowing the estimation of binding parameters from bolus administration experiments with only a small positive bias. This finding is however tracer specific and therefore cannot be immediately generalized to other tracers.
The Bmax values obtained here agree reasonably well with a post-mortem measurement by Rehavi et al (1998) where [3H]TBZOH autoradiography was used to determine the density of [3H]TBZOH binding sites in the striata of female rats. They determined a density of approximately 95 fmol/mg of tissue equivalent, which, considering the many intrinsic differences between in vivo and post-mortem measurements (presence of a fully functional central nervous system in the first case, and preparation of samples in the second case), can be deemed consistent with our data. To the best of our knowledge no in vivo transporter density and ligand/transporter affinity measurements have been performed as yet so a direct comparison to existing similar data is not possible.
A potential confound intrinsic to the MLCTA method is a possible dependence of Kdapp on SA because of a potential competition between the test ligand and endogenous ligand mobilized by high concentrations of the test ligand. Such interactions between high mass of test ligand and subsequent changes in concentration of the endogenous ligand have been suggested in another receptor system: pharmacological doses of neuroleptics, such as raclopride or haloperidol in in vivo MLCRA studies may lead to increase in endogenous dopamine and an artificial shift in Kdapp by competition with the test ligand at the D2 receptor site. It is unknown if pharmacological doses of DTBZ can induce similar changes in intracellular DA and alter DTBZ binding to the VMAT2 through competition. Some evidence argues against this: indeed, pharmacological doses of drugs known to modify endogenous dopamine (Wilson and Kish, 1996, Kilbourn et al, 1996, Kemmerer et al, 2003) appear to have no significant effects on tetrabenazine or DTBZ binding to the transporter. In addition, as previously discussed in detail by Holden et al (2002) in the context of an MLCRA study performed with the D2 receptor antagonist 11C-Raclopride in an MPTP PD model in non-human primates, the conformation of more than three points to a linear fit would suggest that in the range of the SA evaluated Kdapp is relatively constant and that the method provides a robust estimate of Bmax and Kdapp. Both our four and five data point fits for the healthy striatum conformed very well to a linear relationship (r2 = 0.95, 0.97 and 0.99 respectively) between (B/F)g and B, thus supporting the hypothesis of a constant Kdapp in this particular SA range. It is harder to provide similar evidence for the lesioned side, since the data are overall noisier; however, the similarity of the Kdapp value between the two sides would argue against SA effects on Kdapp for the lesioned side as well.
The similarity of Kdapp values between the two sides together with a highly significant detected change in Bmax indicates that in this chronic 6-OHDA model of PD, the lesion causes only reduction in transporter site density consistent with neuronal death, and loss of dopaminergic terminals. As a consequence, changes in BP values can be directly attributed to changes in Bmax values and BP can be justifiably used as an index of disease severity in this animal model of PD.
Finally, the reproducibility of repeated studies supports the usefulness of the BP and LS measures for tracking the progress of experimental therapies in animal models of PD. The difference between repeated measurements of LS in the mildly lesioned animal was the same 2% or 3% difference in absolute LS value as seen in the severely lesioned animals. While this would represent a 30% uncertainty in a lesion of less than 10% severity, this degree of reproducibility would certainly be adequate for monitoring the repair of a lesion of 20% severity. This is an important consideration, as many proposed therapies will be intended for the treatment of very mild or even presymptomatic disease.
Conclusion
We have demonstrated the feasibility of performing an MLCTA study in a 6-OHDA rat model of PD. The lesioning was found to reduce transporter density while leaving the affinity unchanged thus justifying the use of the much simpler BP measure in assessing LS. Accurate image analysis methods were applied to enable the determination of these parameters even in severely lesioned striata. Binding potential and LS values estimated from repeated studies on the same rats showed very good reproducibility. Transporter occupancy curves as a function of SA indicated that less than 1% occupancy is achieved at a DTBZ SA of approximately 1100 nCi/pmol, while an SA as low as 100 nCi/pmol induces only a 10% bias in the BP estimate. In addition to providing information on this particular rat model of PD, these studies also show the suitability of using DTBZ to image the presynaptic integrity of the dopaminergic system in rats and the ability to perform rather complex scanning protocols provided that accurate image analysis is applied to the data.
Footnotes
Acknowledgements
The authors acknowledge the help received from the UBC/TRIUMF PET group.