
Abstract
Glial glutamate transporter-1 (GLT-1) plays an essential role in removing glutamate from the extracellular space and maintaining the glutamate below neurotoxic level in the brain. To explore whether GLT-1 plays a role in the acquisition of brain ischemic tolerance (BIT) induced by cerebral ischemic preconditioning (CIP), the present study was undertaken to observe in vivo changes in the expression of GLT-1 and glial fibrillary acidic protein (GFAP) in the CA1 hippocampus during the induction of BIT, and the effect of dihydrokainate (DHK), an inhibitor of GLT-1, on the acquisition of BIT in rats. Immunohistochemistry for GFAP showed that the processes of astrocytes were prolonged after a CIP 2 days before the lethal ischemic insult, which could protect pyramidal neurons in the CA1 hippocampus against delayed neuronal death induced normally by lethal ischemic insult. The prolonged processes extended into the area between the pyramidal neurons and tightly surrounded them. These changes made the pyramidal layer look like a ‘shape grid’. Simultaneously, the prolonged and extended processes showed a great deal of GLT-1. Western blotting analysis showed significant upregulation of GLT-1 expression after the CIP, especially when it was administered 2 days before the subsequent lethal ischemic insult. Neuropathological evaluation by thionin staining showed that DHK dose-dependently blocked the protective role of CIP against delayed neuronal death induced normally by lethal brain ischemia. It might be concluded that the surrounding of pyramidal neurons by astrocytes and upregulation of GLT-1 induced by CIP played an important role in the acquisition of the BIT induced by CIP.
Keywords
Introduction
Transient sublethal cerebral ischemia could protect hippocampal neurons against delayed neuronal death (DND) induced normally by lethal ischemic insult. The transient cerebral ischemia is usually referred to as cerebral ischemic preconditioning (CIP). The phenomenon was first found by Kitagawa et al (1990) and proved by many other studies (Chen et al, 1996; Kirino, 2002). The protective effect of CIP was related to many factors, such as immediate early genes and their proteins (Tomimoto et al, 1999), adenosine receptors and ATP-sensitive K+ channels (Heurteaux et al, 1995; Zhou et al, 2004), nitric oxide (Atochin et al, 2003; Liu et al, 2006), heat shock proteins (Nishino and Nowak, 2004), mitogen-activated protein kinase (MAPK) family members (Garcia et al, 2004), release of glutamate (Kawahara et al, 2005; Kosugi et al, 2005), etc.
Many studies have proved that excitotoxicity of glutamate is an important mechanism for DND induced by transient global ischemic insult. Glutamate uptake is transiently reduced and the extracellular glutamate is increased after hypoxia–ischemia insults in brain (Benveniste et al, 1984; Nicotera and Bano, 2003; Yeh et al, 2005). Excitatory amino-acid transporters (EAATs) are essential for maintaining normal extracellular levels of glutamate. Five distinct high-affinity, sodium-dependent EAATs are identified in the rat brain, which include EAAT1 (glial glutamate/aspartate transporter, GLAST), EAAT2 (glial glutamate transporter-1, GLT-1), EAAT3 (excitatory amino acid carrier-1, EAAC1), EAAT4, and EAAT5. GLAST (Storck et al, 1992) and GLT-1 (Pines et al, 1992) are localized primarily in astrocytes. Excitatory amino-acid transporter 1 is widely distributed in neurons (Rothstein et al, 1994). Excitatory amino-acid transporter 4 is localized mainly in cerebellar Purkinje cells (Fairman et al, 1995). Excitatory amino-acid transporter 5 is mainly localized in retina (Arriza et al, 1997). Excitatory amino-acid transporters normally remove glutamate into cells and are driven by sodium, potassium, and possibly by hydroxide ion gradients. Conversely, when the ion gradient or membrane potential drops, for instance during ischemia or epileptic activity, EAATs may reverse and release glutamate into the extracellular space in a calcium-independent manner, and then lead to excitotoxicity (Rossi et al, 2000).
Although both neurons and glia contain EAATs, it is generally accepted that the uptake capacity of astrocytes is much higher than that of neurons (Rothstein et al, 1996). Within many brain regions, the dominant glutamate transporter is GLT-1. Early immunocytochemical studies (Lehre et al, 1995; Levy et al, 1993; Rothstein et al, 1994) demonstrated that GLT-1 was restricted to glia and normally absent from neurons, the few exceptions being in retina, cultured neurones, and developing brain (Rauen and Kanner, 1994; Yamada et al, 1998). Many studies have shown that GLT-1 plays a principal role in removing the released glutamate from the extracellular space and maintaining the extracellular glutamate below neurotoxic level in the brain (Rothstein et al, 1996; Rao et al, 2001). Considering the importance of GLT-1 in removing glutamate, it is reasonable to hypothesize that GLT-1 may play an important role in the acquisition of the brain ischemic tolerance induced by CIP. Unfortunately, there were limited reports until now concerning the role of GLT-1 in the induction of brain ischemic tolerance (Kawahara et al, 2005; Kosugi et al, 2005; Romera et al, 2004). Although they came to a similar conclusion that GLT-1 was involved in the induction of brain ischemic tolerance, the underlying mechanisms were just reversal. Romera et al (2004) reported that ischemic preconditioning diminished the increase in extracellular glutamate caused by oxygen–glucose deprivation and increased cellular glutamate uptake by upregulating expression of EAAT2 and EAAT3 glutamate transporters. Conversely, in neuron/astrocyte co-culture models, Kosugi et al (2005) and Kawahara et al (2005) found that preconditioning induced downregulation and reversal operation of GLT-1 that released glutamate to extracellular space and induced slight increase in the concentration of extracellular glutamate. The increased glutamate induced neuronal ischemic tolerance via N-methyl-
Materials and methods
Animal and Grouping
Male Wistar rats (280–320 g in weight) provided by The Experimental Animal Center of Hebei Medical University were used. Before experiment, the animals were fed in the experimental room for 2–3 days to habituate to the environment of the laboratory. Animal care and use conformed to guidelines for care and use of laboratory animals.
Part 1: Expression of glial glutamate transporter-1 and glial fibrillary acidic protein during the induction of brain ischemic tolerance
Immunohistochemistry assay: One hundred and forty-five adult male Wistar rats were divided into five groups randomly: control group (n = 5), vertebral artery occluding (VAO) group (n = 35), CIP group (n = 35), ischemic insult group (n = 35), and CIP + ischemic insult group (n = 35). The observations were performed at time 0 (immediate), 3 h, 1 day, 2 days, 3 days, 5 days, and 7 days after the last operation or treatment (n = 5 in each time point), except for the control group. The details of the protocols are indicated in Figure 1A. Two sets of sections were made, one set for immunohistochemical staining and the other for neuropathological evaluation.
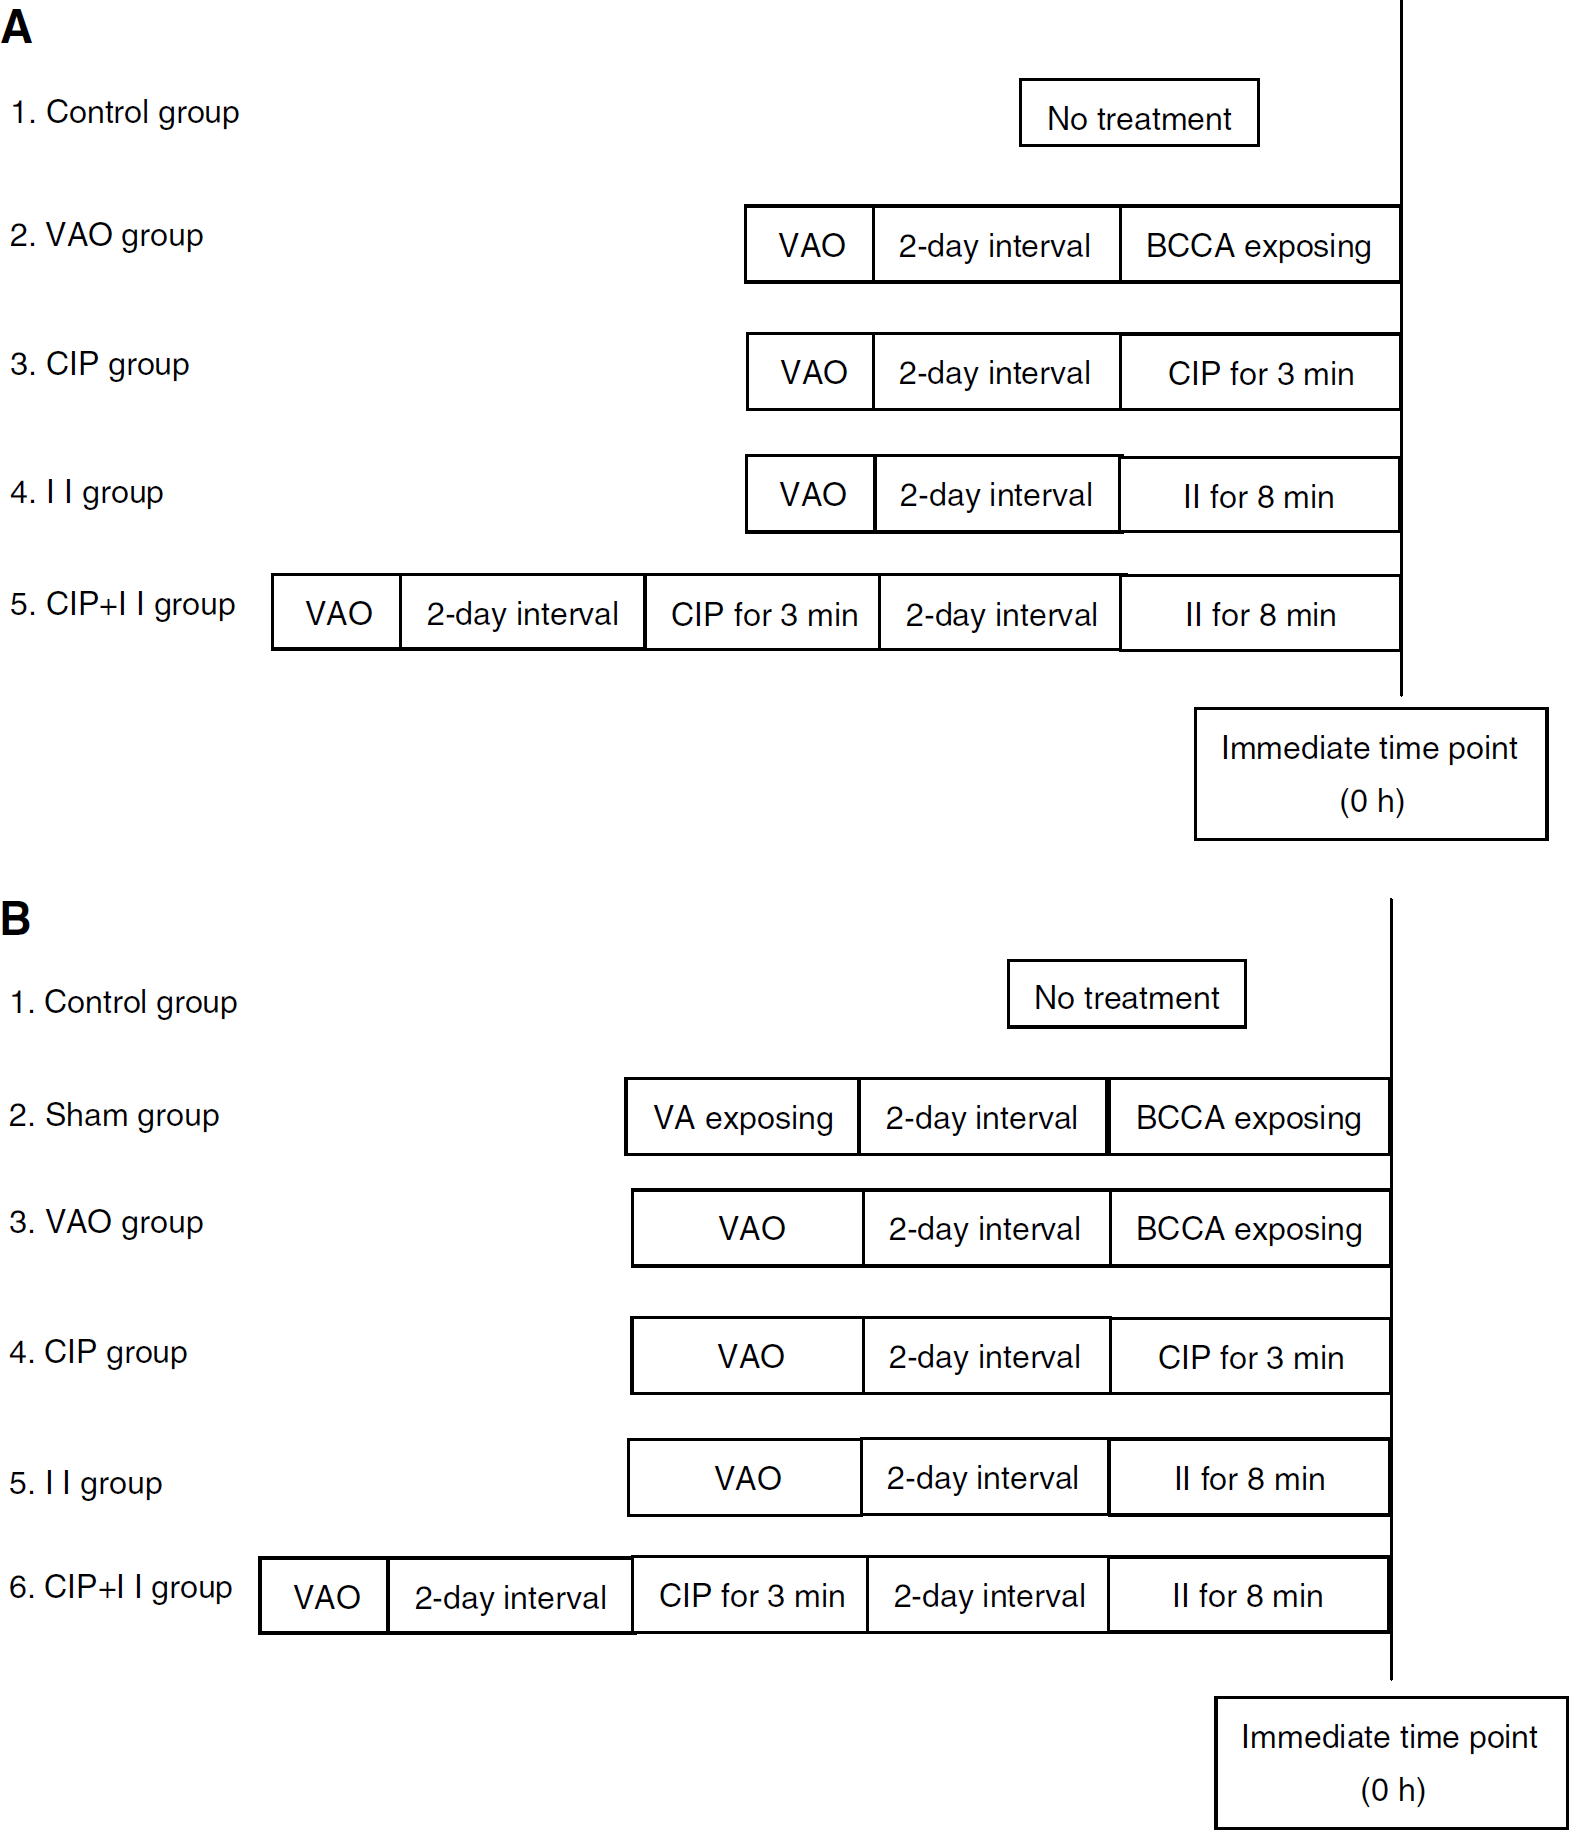
Experimental protocols for immunohistochemistry assay and thionin staining (
Western blotting analysis: Two hundred and five adult male Wistar rats were divided into six groups randomly: control group (n = 5), sham group (n = 20), VAO group (n = 45), CIP group (n = 45), ischemic insult group (n = 45), and CIP + ischemic insult group (n = 45). The Western blotting analysis in the sham group was performed at time 0 (immediate), 3, 12 h, and 2 days, whereas in the other groups it was performed at time 0 (immediate), 3, 6, 12 h, 1 day, 2 days, 3 days, 5 days, and 7 days after the last operation or treatment (n = 5 in each time point). In our preliminary experiment, some changes in expression of GLT-1 and GFAP were observed after VAO. To clarify whether the changes were induced by surgical procedures or by VAO, the sham group was designed in Western blotting analysis. The details of the protocols were indicated in Figure 1B.
Part 2: Effect of dihydrokainate on the induction of brain ischemic tolerance: Eighty-four adult male Wistar rats were divided into eight groups randomly: VAO group (n = 6), CIP group (n = 6), ischemic insult group (n = 6), CIP + ischemic insult group (n = 6), artificial cerebrospinal fluid group (n = 6): 20 μL artificial cerebrospinal fluid was administered by intraventricular injection 30 min before exposure of bilateral common carotid arteries. Other procedures were the same as those in the VAO group; DHK group (n = 18): 10, 100, and 200 nmol DHK dissolved in 20 μL artificial cerebrospinal fluid was administered by intraventricular injection 30 min before exposure of bilateral common carotid arteries. Other procedures were the same as those in the VAO group (n = 6 in each dose of DHK); DHK + CIP group (n = 18): 10, 100, and 200 nmol DHK dissolved in 20 μL artificial cerebrospinal fluid was administered by intraventricular injection 30 min before CIP for 3 min. Other procedures were the same as those in the CIP group (n = 6 in each dose of DHK); DHK + CIP + ischemic insult group (n = 18): 10, 100, and 200 nmol DHK dissolved in 20 μL artificial cerebrospinal fluid was administered by intraventricular injection 30 min before CIP for 3 min. Other procedures were the same as those in the CIP + ischemic insult group (n = 6 in each dose of DHK). All the animals were killed 7 days after the last operation or the last time of ischemia for neuropothological evaluation.
Establishment of Global Cerebral Ischemic Model
The rat global cerebral ischemic model was established by four-vessel occlusion (Pulsinelli and Brierley, 1979).
Occluding of vertebral arteries: First, the bilateral vertebral arteries were electrocauterized under chloral hydrate anesthesia (350 mg/kg) administered by abdominal injection. An incision of skin, 1.5 cm in length, directly overlying the first cervical vertebra was made on the dorsal side of the neck behind the occipital bone. The paraspinal muscles were separated from the middle, and the bilateral alar foramina of the first cervical vertebra were exposed. An electrocautery needle burned in advance was inserted into the alar foramen and the bilateral vertebral arteries were electrocauterized permanently. Silver ball electrodes were mounted on the parietal bone to record the electroencephalogram (EEG). The animals were used for further experiments 2 days after the operations.
Global brain ischemia: Animals with permanent occlusion of the bilateral vertebral arteries were subjected to global cerebral ischemia. The bilateral common carotid arteries (BCCAs) of the rats were exposed under ether anesthesia and local anesthesia with 1% procaine solution. After the rats recovered from the ether anesthesia, the BCCAs were clamped using clips. An occlusion in a short period of 3 min was normally used as CIP, or a relative long one for 8 min was used as ischemic insult, which is lethal for CA1 pyramidal neurons and usually results in DND. When the CIP was followed by the 8 min ischemic insult, the interval between them was 2 days. Changes in pupils and EEG were observed to determine whether the brain ischemia was induced. Global cerebral ischemia was considered successful only in cases of animals in which the pupils enlarged, the EEG showed decreases in frequency and amplitude or even approached isoelectric level, and the righting reflex disappeared during the four-vessel occlusion.
Rats in the control group were just fed in the experimental room to habituate them to the environment of the laboratory without any treatment.
Rats in the sham group were subjected to a sham operation consisting of anesthesia and all surgical procedures, except occluding of the vertebral arteries and bilateral common carotid arteries.
Rats in the VAO group were subjected to separation and exposure besides the occluding of the bilateral vertebral arteries, but without occlusion of the bilateral common carotid arteries.
The wounds were sutured after each operation. The body temperature of the animals was kept at approximately 37°C by irradiating the whole body of animals with a heating lamp during the above operations and treatments until the rats returned to normal.
Injection of Lateral Ventricle
The heads of rats were secured in a stereosopic frame under general anesthesia of chloral hydrate (350 mg/kg, i.p.). A needle of 0.4 mm out-diameter connected with a microsyringe was inserted into the right lateral ventricle. The coordinates were 2 mm lateral and 2 mm posterior to the bregma. Twenty microliters of the DHK solution or artificial cerebrospinal fluid were injected over 15 min, and the needle was kept for an additional 2 min after the injection and then drawn out slowly. Dihydrokainate was dissolved in artificial cerebrospinal fluid in concentrations of 0.5, 5, and 10 nmol/μL, respectively.
Neuropathological Evaluation
At the determined end point of the experiment of related groups, the animals were deeply anesthetized and perfused through the ascending aorta with normal saline and followed by 4% paraformaldehyde. The brain was then removed and a 3 mm-thick brain slice, including the bilateral hippocampus, was excised coronally behind the optical chiasm. The slices were embedded in paraffin after post-fixation overnight with the same fixative, dehydration with alcohol, and transparence with xylene. The paraffin-embedded brain tissues were sectioned in 6 μm thickness. Some sections were used for thionin staining and the others for immunohistochemical staining. The histologic changes of the hippocampal CA1 subfield were divided into four histologic grades (HG) under the light microscope according to the methods described by Kitagawa et al (1990) and Kato et al (1991). The standard of the division was as follows: grade 0, no neuron death; grade I, scattered single neuron death; grade II, mass neuron death; grade III, almost complete neuron death. The neuronal density (ND) of the hippocampal CA1 subfield was determined by counting the number of surviving pyramidal neurons with intact cell membrane, full nucleus, and clear nucleolus within 1 mm linear length of the CA1. The average number of pyramidal neurons in six areas of the hippocampal CA1 subfield was calculated as the value of ND.
Immunohistochemistry Assay
After deparaffinization, the sections of 6 μm were treated with 3% H2O2 in methanol for 30 min to inhibit endogenous peroxidase activity, and in microwave for 15 min in 0.01 mmol/L citrate buffer (pH 7.2). After a preincubation in 10% normal goat serum for 30 min to inhibit nonspecific reactions, the sections were incubated for 24 h at 4°C with the primary antibodies to either guinea-pig anti-GLT-1 polyclonal antibody (1:5000, Chemicon International Inc., Temecula, CA, USA, Catalog no.: AB1783, Lot no.: 25040166) or rabbit anti-GFAP polyclonal antibody (1:80, Sigma-Aldrich Inc., St. Louis, MO, USA, Catalog No.: G9269, Lot No.: 113K4808). After being washed with phosphate-buffered saline for 15 min, they were subsequently incubated for 60 min at 37°C with secondary antibodies to either biotin-labeled anti-guinea-pig immunoglobulin G for GLT-1 (1:2000, Chemicon International Inc., USA, Catalog No.: AP108B, Lot No.: 25010395) or biotin-labeled anti-rabbit immunoglobulin G (from a commercial avidin–biotin–peroxidase complex (ABC) kit (Zymed Labs Inc., CA, USA, Catalog No.: 85-6743 Histostain-Plus kit, Lot No.: 50581654)) for GFAP, followed by washing with phosphate-buffered saline. The sections were then incubated for 50 min at 37°C with horseradish peroxidase-conjugated streptoavidin (Zymed Labs Inc., USA, Catalog No.: 85-6743 Histostain-Plus kit, Lot No.: 50581654). After being washed with phosphate-buffered saline, the sections were treated with 3,3-diaminobenzidine-tetrachloride-H2O2 (DAB-H2O2) (Zymed Labs Inc., USA, Catalog No.: 00-2114; Lot No.: 60282165). All immunohistochemical staining was performed with negative controls using phosphate-buffered saline to replace primary antibodies.
A computer-assisted image analysis system (HPIAS-1000, Tongji Medical University, Wuhan, China) was used for quantitative analysis of the immunohistochemical staining of GLT-1 and GFAP. Five sections were randomly selected for the quantification per rat. Values of the background staining were obtained and subtracted from the immunoreactive intensities. Since GLT-1 displayed a rather diffuse staining pattern, we chose to determine average optical density of immunostaining. While GFAP immunostaining displayed a clear outline of astrocytes, thus the number, total area, and average optical density of GFAP immunoreactive cells were included.
Western Blotting Analysis
Rats were killed by decapitation at determined times. The hippocampal CA1 subfield were quickly separated from the hippocampus, placed in liquid nitrogen, and then stored at −80°C. Hippocampal homogenates were prepared by homogenization (700 r.p.m.) in a potter-Elvejhem tube in 10 volumes of lysis buffer (containing 100 mmol/L Tris–HCl, 1 mmol/L ethyleneglycol tetraacetate, 1 mmol/L ethylenediamine tetraacetate, 1 μg/ml leupeptin, 250 μmol/L phenylmethylsulfonyl fluoride, 1 μg/mL aprotinin, and 50 μg/mL soybean trypsin inhibitor). The homogenates were centrifuged at 12 000 g for 5 min at 4°C, and the supernatant was used. The protein concentration of the supernatant was determined using the method of Lowry. Forty micrograms protein of each sample mixed with loading buffer containing 0.125 mol/L Tris–HCl (pH 6.8), 20% glycerol, 4% sodium dodecyl sulfate, 10% mercaptoethanol, and 0.002% bromphenol blue was loaded in each lane, and heated at 100°C for 5 min before gel loading. The samples were electrophoresed on a 10% sodium dodecyl sulfate-polyacrylamide gel electrophoresis and transferred to a polyvinylidene difluoride membrane at 100 V for 3.5 h. Then, ponceau S staining was used to detect the separation of protein to verify whether protein of samples was transferred to the polyvinylidene difluoride membrane. Marker of molecular weight was also electrophoresed to confirm the aim bands, the molecular mass of which was 71 kDa for GLT-1, 51 kDa for GFAP, and 42 kDa for β-actin, respectively. Nonspecific binding was blocked with Tris-buffered saline (Tris-buffered saline (TBS): 100 mmol/L Tris, 150 mmol/L NaCl, pH 7.5)+ 0.1% Tween + 5% normal goat serum + 5% skim milk for 1 h at room temperature. Membranes for GLT-1 analysis were subsequently incubated with primary antibody against GLT-1 (1:20,000, the same antibody as that used in immunohistochemistry assay) in TBS/0.1% Tween-20/5% normal goat serum at room temperature for 1 h, whereas membranes for both GFAP and β-actin analysis were subsequently incubated with primary antibody against GFAP (1:1250, the same antibody as that used in immunohistochemistry assay) as well as antibody against β-actin (1:200, goat-anti-β-actin polyclonal antibody, Santa Cruz, CA, USA, Catalog No.: SC-1616, Lot No.: H0904) applied together in TBS/0.1% Tween-20%/5% normal goat serum at 4°C for 24 h. After washing with Tris-buffered saline Tween-20, the membranes were incubated at 37°C for 1 h with secondary antibodies to either biotin-labeled anti-guinea-pig immunoglobulin G (1:70 000, the same antibody as that used in immunohistochemistry assay) for GLT-1 or horseradish peroxidase streptavidin-conjugated goat-anti-rabbit immunoglobulin G (1:1000, Jackson ImmunoResearch Labs Inc., Baltimore Pike, USA, Cat No.: 111-035-003; Lot No.: 67166) for GFAP and β-actin, respectively, followed by washing with Tris-buffered saline Tween-20. The blots for GFAP and β-actin were developed with DAB detection system (Zymed Labs Inc., USA, Cat No.: 00-2114; Lot No.: 60282165), whereas the membranes for GLT-1 were incubated with horseradish peroxidase-conjugated streptoavidin at 37°C for 50 min (1:500, Vector Labs Inc., USA, Cat No.: SA-5004; Lot No.: R0927), followed by washing with Tris-buffered saline Tween-20, and then the blots were developed with DAB detection system (Zymed Labs Inc., USA, Cat No.: 00-2114; Lot No.: 60282165). Integrated optical density of each band was measured using Gel-Pro Analyzer 3.1 image analysis system. The changes in relative content of GLT-1 or GFAP expression were represented with the ratio of integrated optical density of the band of objective protein to that of β-actin.
Statistical Analysis
Statistical analysis was performed using SPSS 13.0. All data were presented as mean ± s.d. (standard deviation). Kruskal–Wallis analysis of variance (ANOVA) on ranks with Dunn's test as multiple comparison was performed to test difference in HG between groups. Other data were tested by one-way ANOVA, combined with Student–Newman–Keuls test as a multiple comparison method to test differences between groups. P < 0.05 was considered significantly.
Results
Neuropathological Evaluation
In the hippocampal CA1 subfield of the control rats, pyramidal neurons were arranged in order with 2–3 cell layers; the outline of the neurons was intact, the nucleus was full, and the nucleolus was clear (Figure 2A). The HG was 0 and ND was 210 ± 5.7 mm−1 (Table 1). No significant neuronal damage was observed in the CA1 subfield at all time points observed after VAO (Figure 2B). Neither the HG nor the ND was different from that of the control group (Table 1). Change in ND or HG was not found at all time points after CIP when compared with that of the control or VAO group (Figure 2C, Table 1). During the first 2 days after the lethal ischemic insult for 8 min, no significant pyramidal neuronal damage was observed in the hippocampal CA1 subfield. However, obvious DND, such as decrease in ND and increase in HG (Table 1), was observed from the third day after the ischemic insult (Figure 2D). The damage deteriorated with time. Almost complete neurons died at the fifth and seventh days after the lethal ischemic insult (Figure 2E), represented by more significant decrease in ND and increase in HG compared with that of the third day after the lethal ischemic insult (Table 1). When the animals were pretreated with the CIP 2 days before the lethal ischemic insult, the above injured changes were prevented clearly (Figure 2F, Table 1), which indicate that the CIP protected the pyramidal neurons in the CA1 hippocampus against the DND induced normally by the lethal ischemic insult.
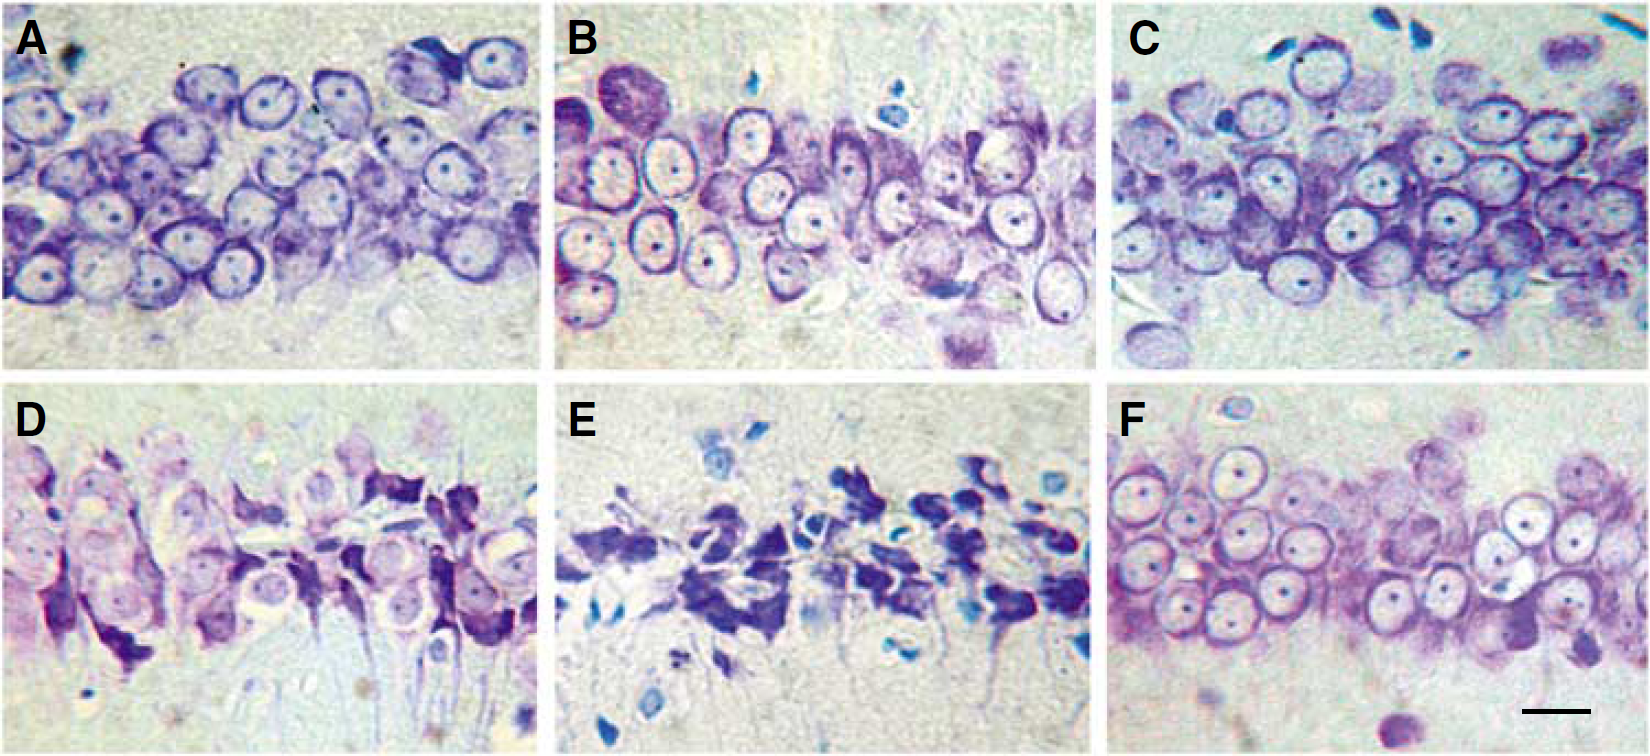
Representative thionin-staining photomicrographs show histologic changes of the hippocampal CA1 subfield at 7 days (except for D in which it was 3 days after the lethal ischemic insult) after last brain ischemia or treatment in each group. The abbreviations were the same as those in the Figure 1. (
Changes in histological grades (HG) and neuronal density (ND) in the hippocampal CA1 subfield in rats during the induction of brain ischemic tolerance (̅x ± s, n = 5)
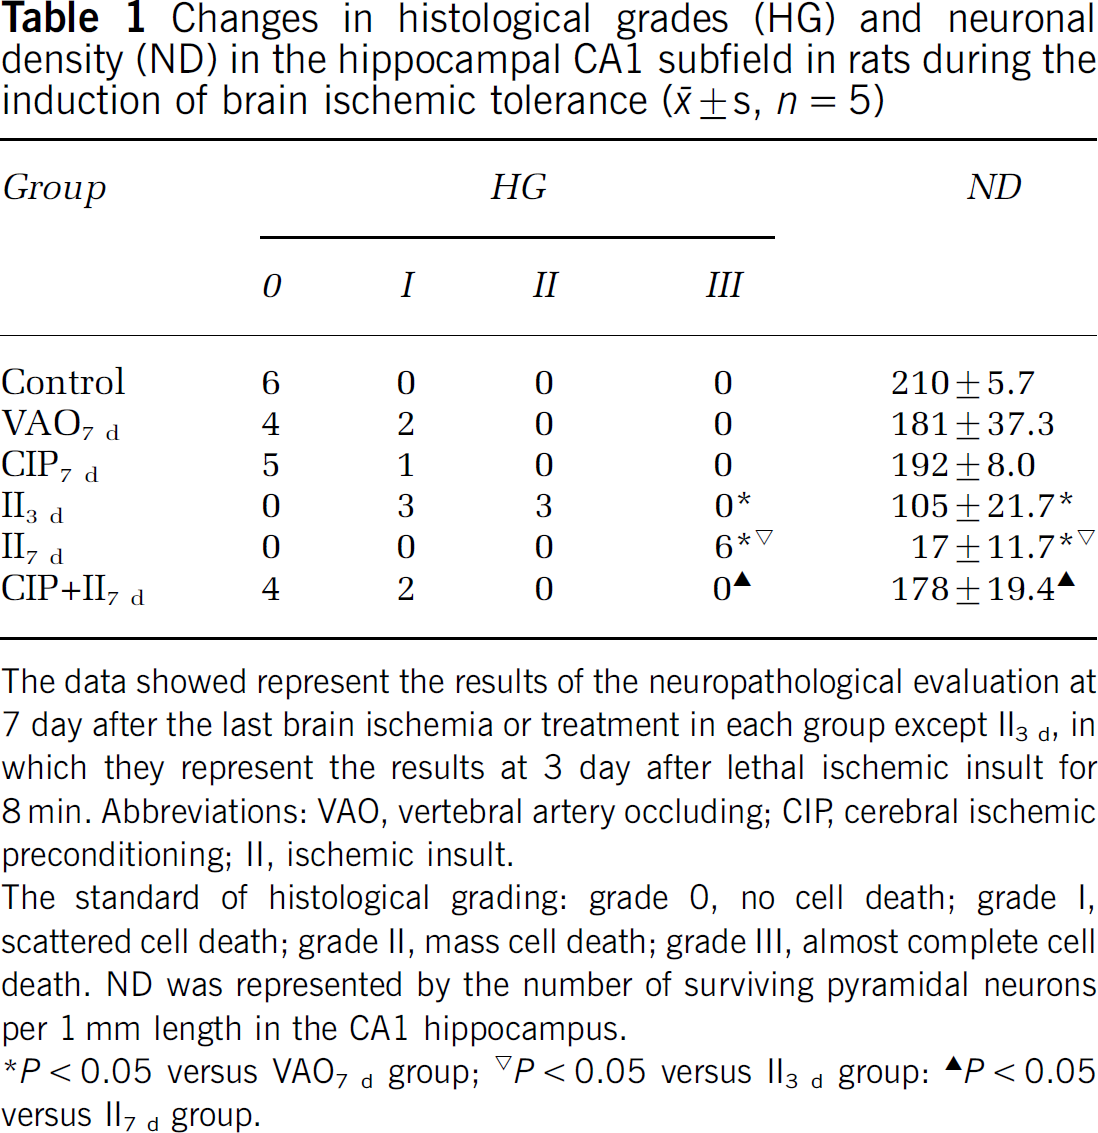
The data showed represent the results of the neuropathological evaluation at 7 day after the last brain ischemia or treatment in each group except II3 d, in which they represent the results at 3 day after lethal ischemic insult for 8 min. Abbreviations: VAO, vertebral artery occluding; CIP, cerebral ischemic preconditioning; II, ischemic insult.
The standard of histological grading: grade 0, no cell death; grade I, scattered cell death; grade II, mass cell death; grade III, almost complete cell death. ND was represented by the number of surviving pyramidal neurons per 1 mm length in the CA1 hippocampus.
P < 0.05 versus VAO7 d group;
P < 0.05 versus II3 d group:
P < 0.05 versus II7 d group.
Expression of GLT-1
Immunohistochemistry assay: There were very weak but diffuse immunoparticles distributed in the peri-pyramidal neuronal structure in the hippocampal CA1 subfield in the control group (Figures 3A1–3A3, 3F). The staining pattern is consistent with other reports (Milton et al, 1997; An et al, 2002). Compared with the control group, the intensity of GLT-1 immunoreactivity was markedly increased at almost all time points and showed morphologic characters of astrocytes in the VAO group (Figures 3B1–3B3, 3F). The intensity of GLT-1 immunoreactivity was further increased after CIP when compared with that of the VAO group. Very interestingly, some GLT-1 immunoreactive particles were observed in the area between the pyramidal neurons, which tightly surrounded pyramidal neurons and made the pyramidal layer look like ‘shaped grade’ (Figures 3C1–3C3, 3F). When compared with the VAO group, the GLT-1 expression was markedly decreased at all time points after the lethal ischemic insult for 8 min, especially in the area where almost complete pyramidal neurons died, and the neighboring area of the pyramidal layer even appeared as a sheet absence of GLT-1 immunoreactivity (Figures 3D1–3D3, 3F). But when the animals were pretreated with the CIP 2 days before the lethal ischemic insult, the decrease of the GLT-1 immunoreactivity induced by the lethal ischemic insult was prevented thoroughly. Moreover, there were more GLT-1 immunoreactive particles that tightly surrounded the pyramidal neurons, which made the ‘shaped grid’ observed in the CIP group more clear (Figures 3E1–3E3, 3F).
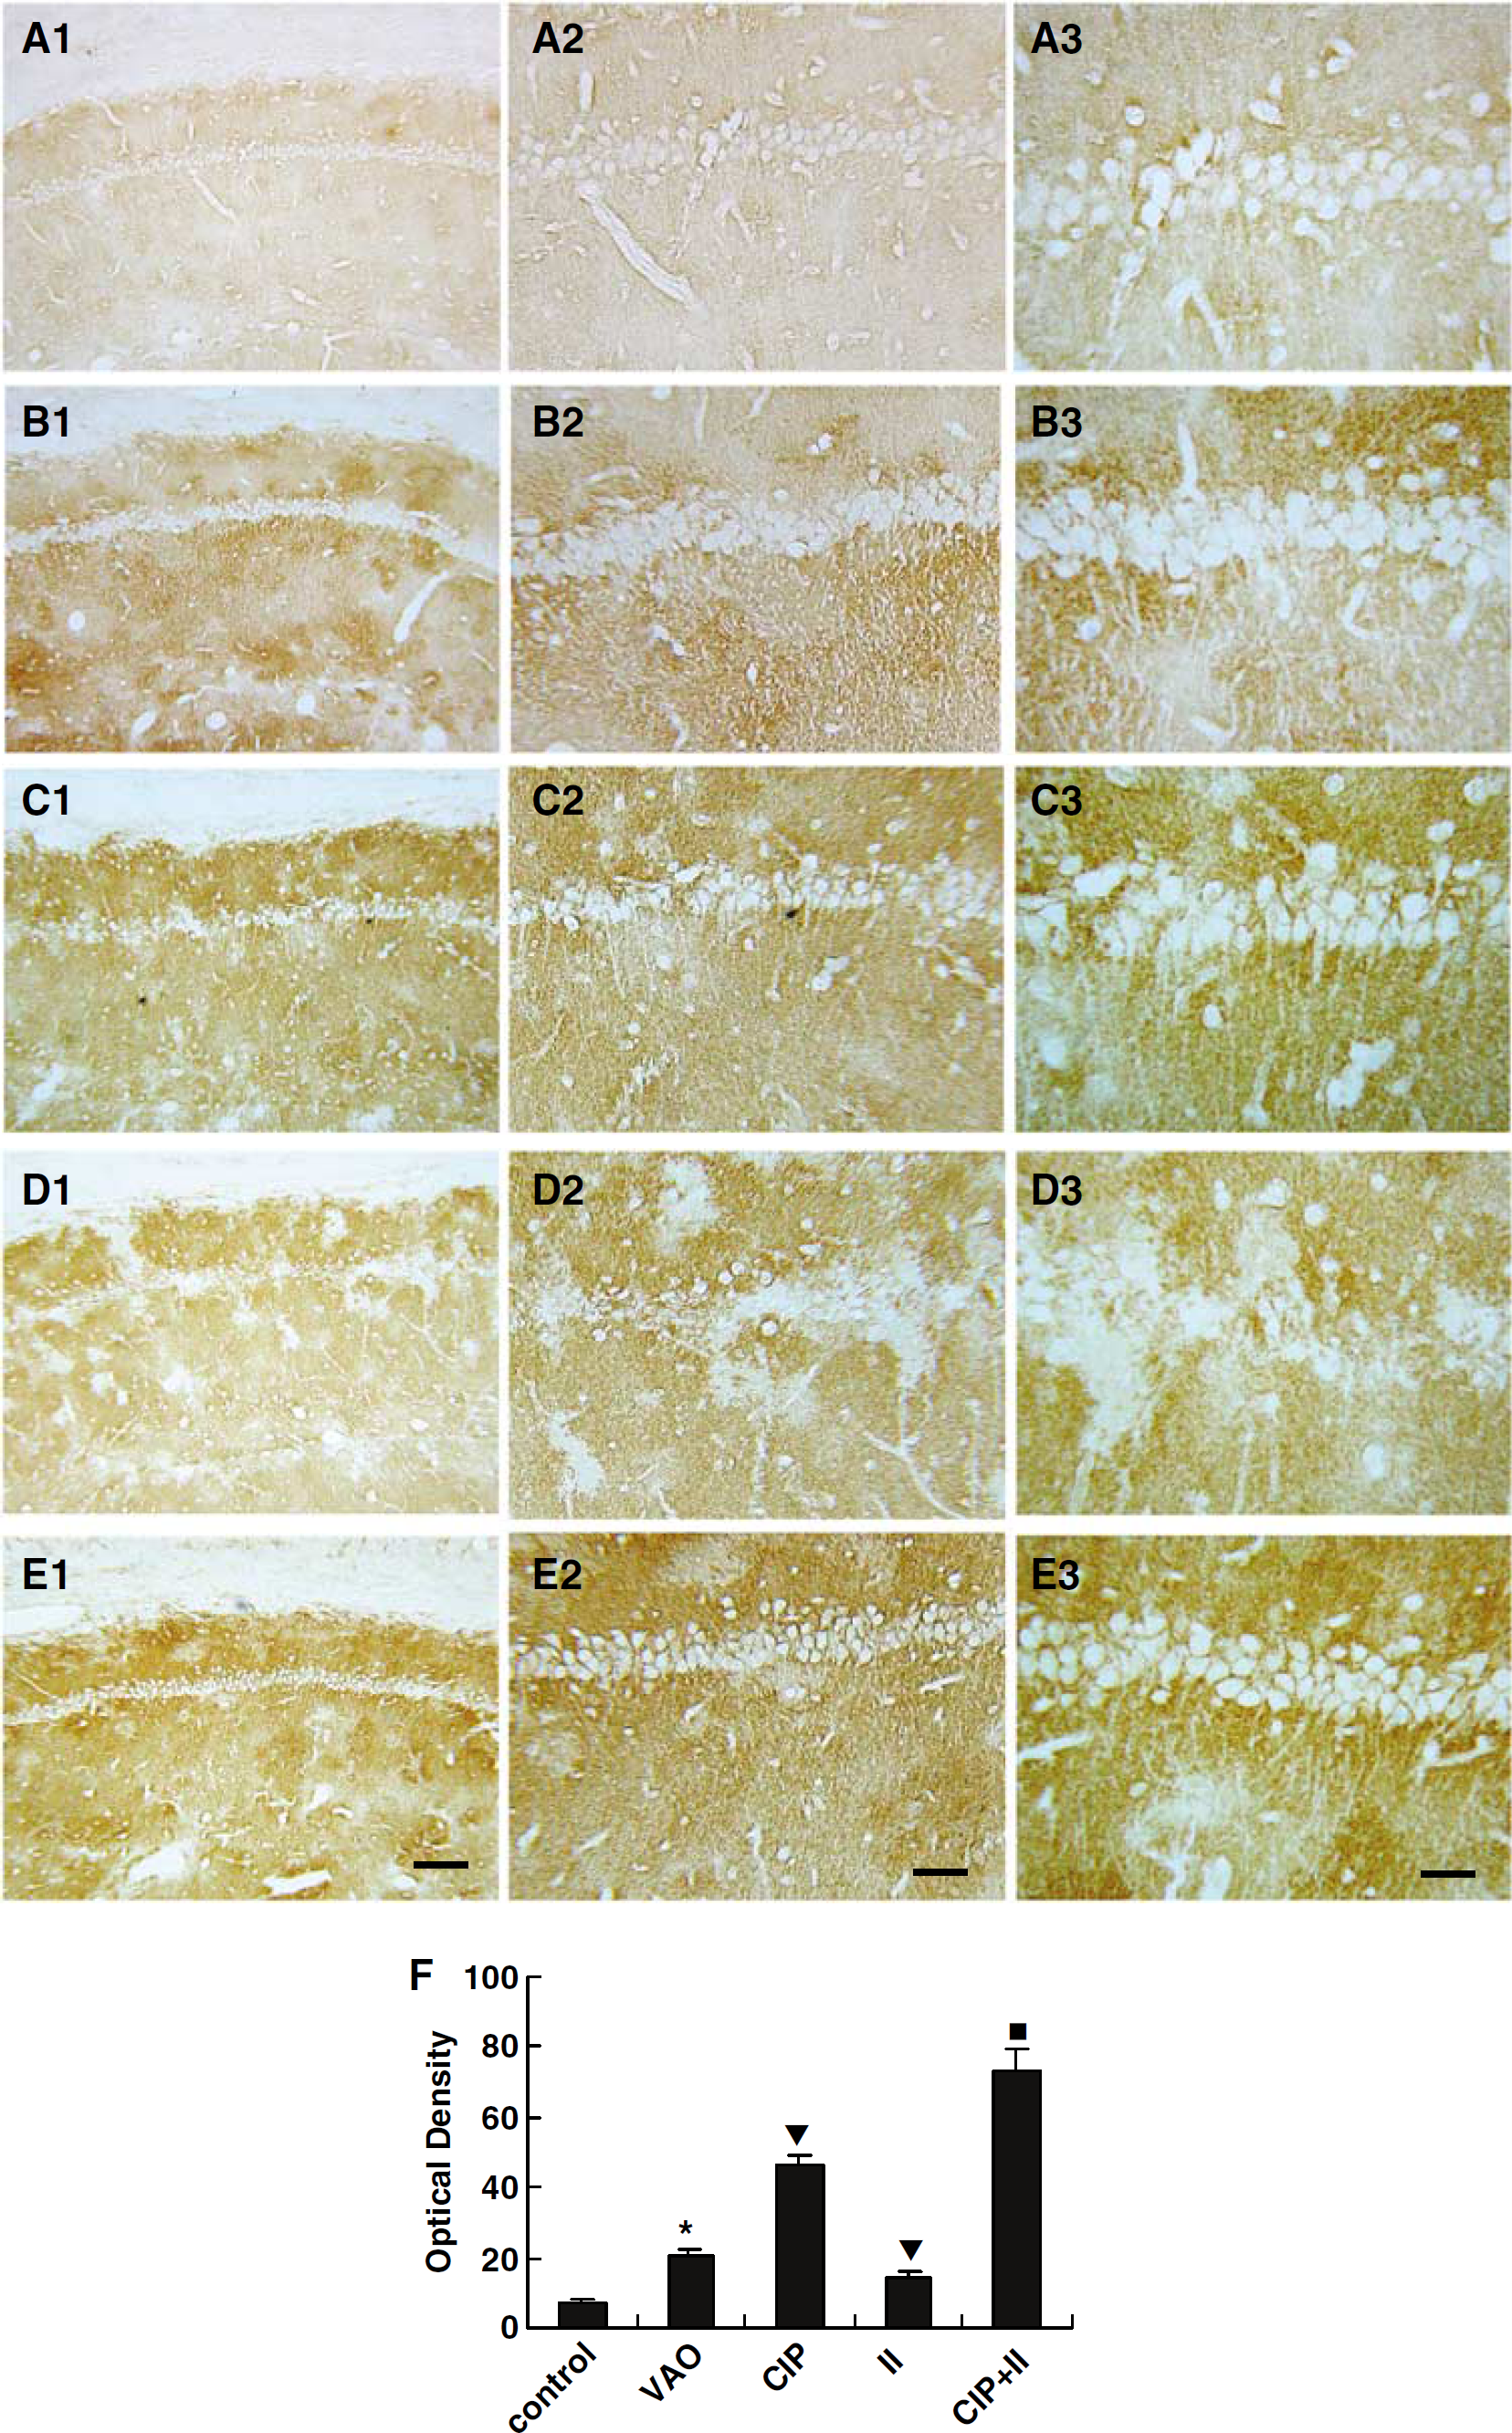
Representative immunohistochemical staining photomicrographs show changes in expression of GLT-1 in the hippocampal CA1 subfield at 7 days after last brain ischemia or treatment in each group. The abbreviations are the same as those in the Figure 1. (
Western blotting analysis: As a general principle of Western blotting analysis, only data obtained from the same gel electrophoresis, in which the major procedures including electrophoresis, incubation with antibodies, and developing with DAB are performed simultaneously, can be compared directly. Therefore, we designed our experimental protocols to show the time course of GLT-1 expression in each group (Figure 4), and to compare the expression of GLT-1 as well as GFAP between different groups (Figure 5).
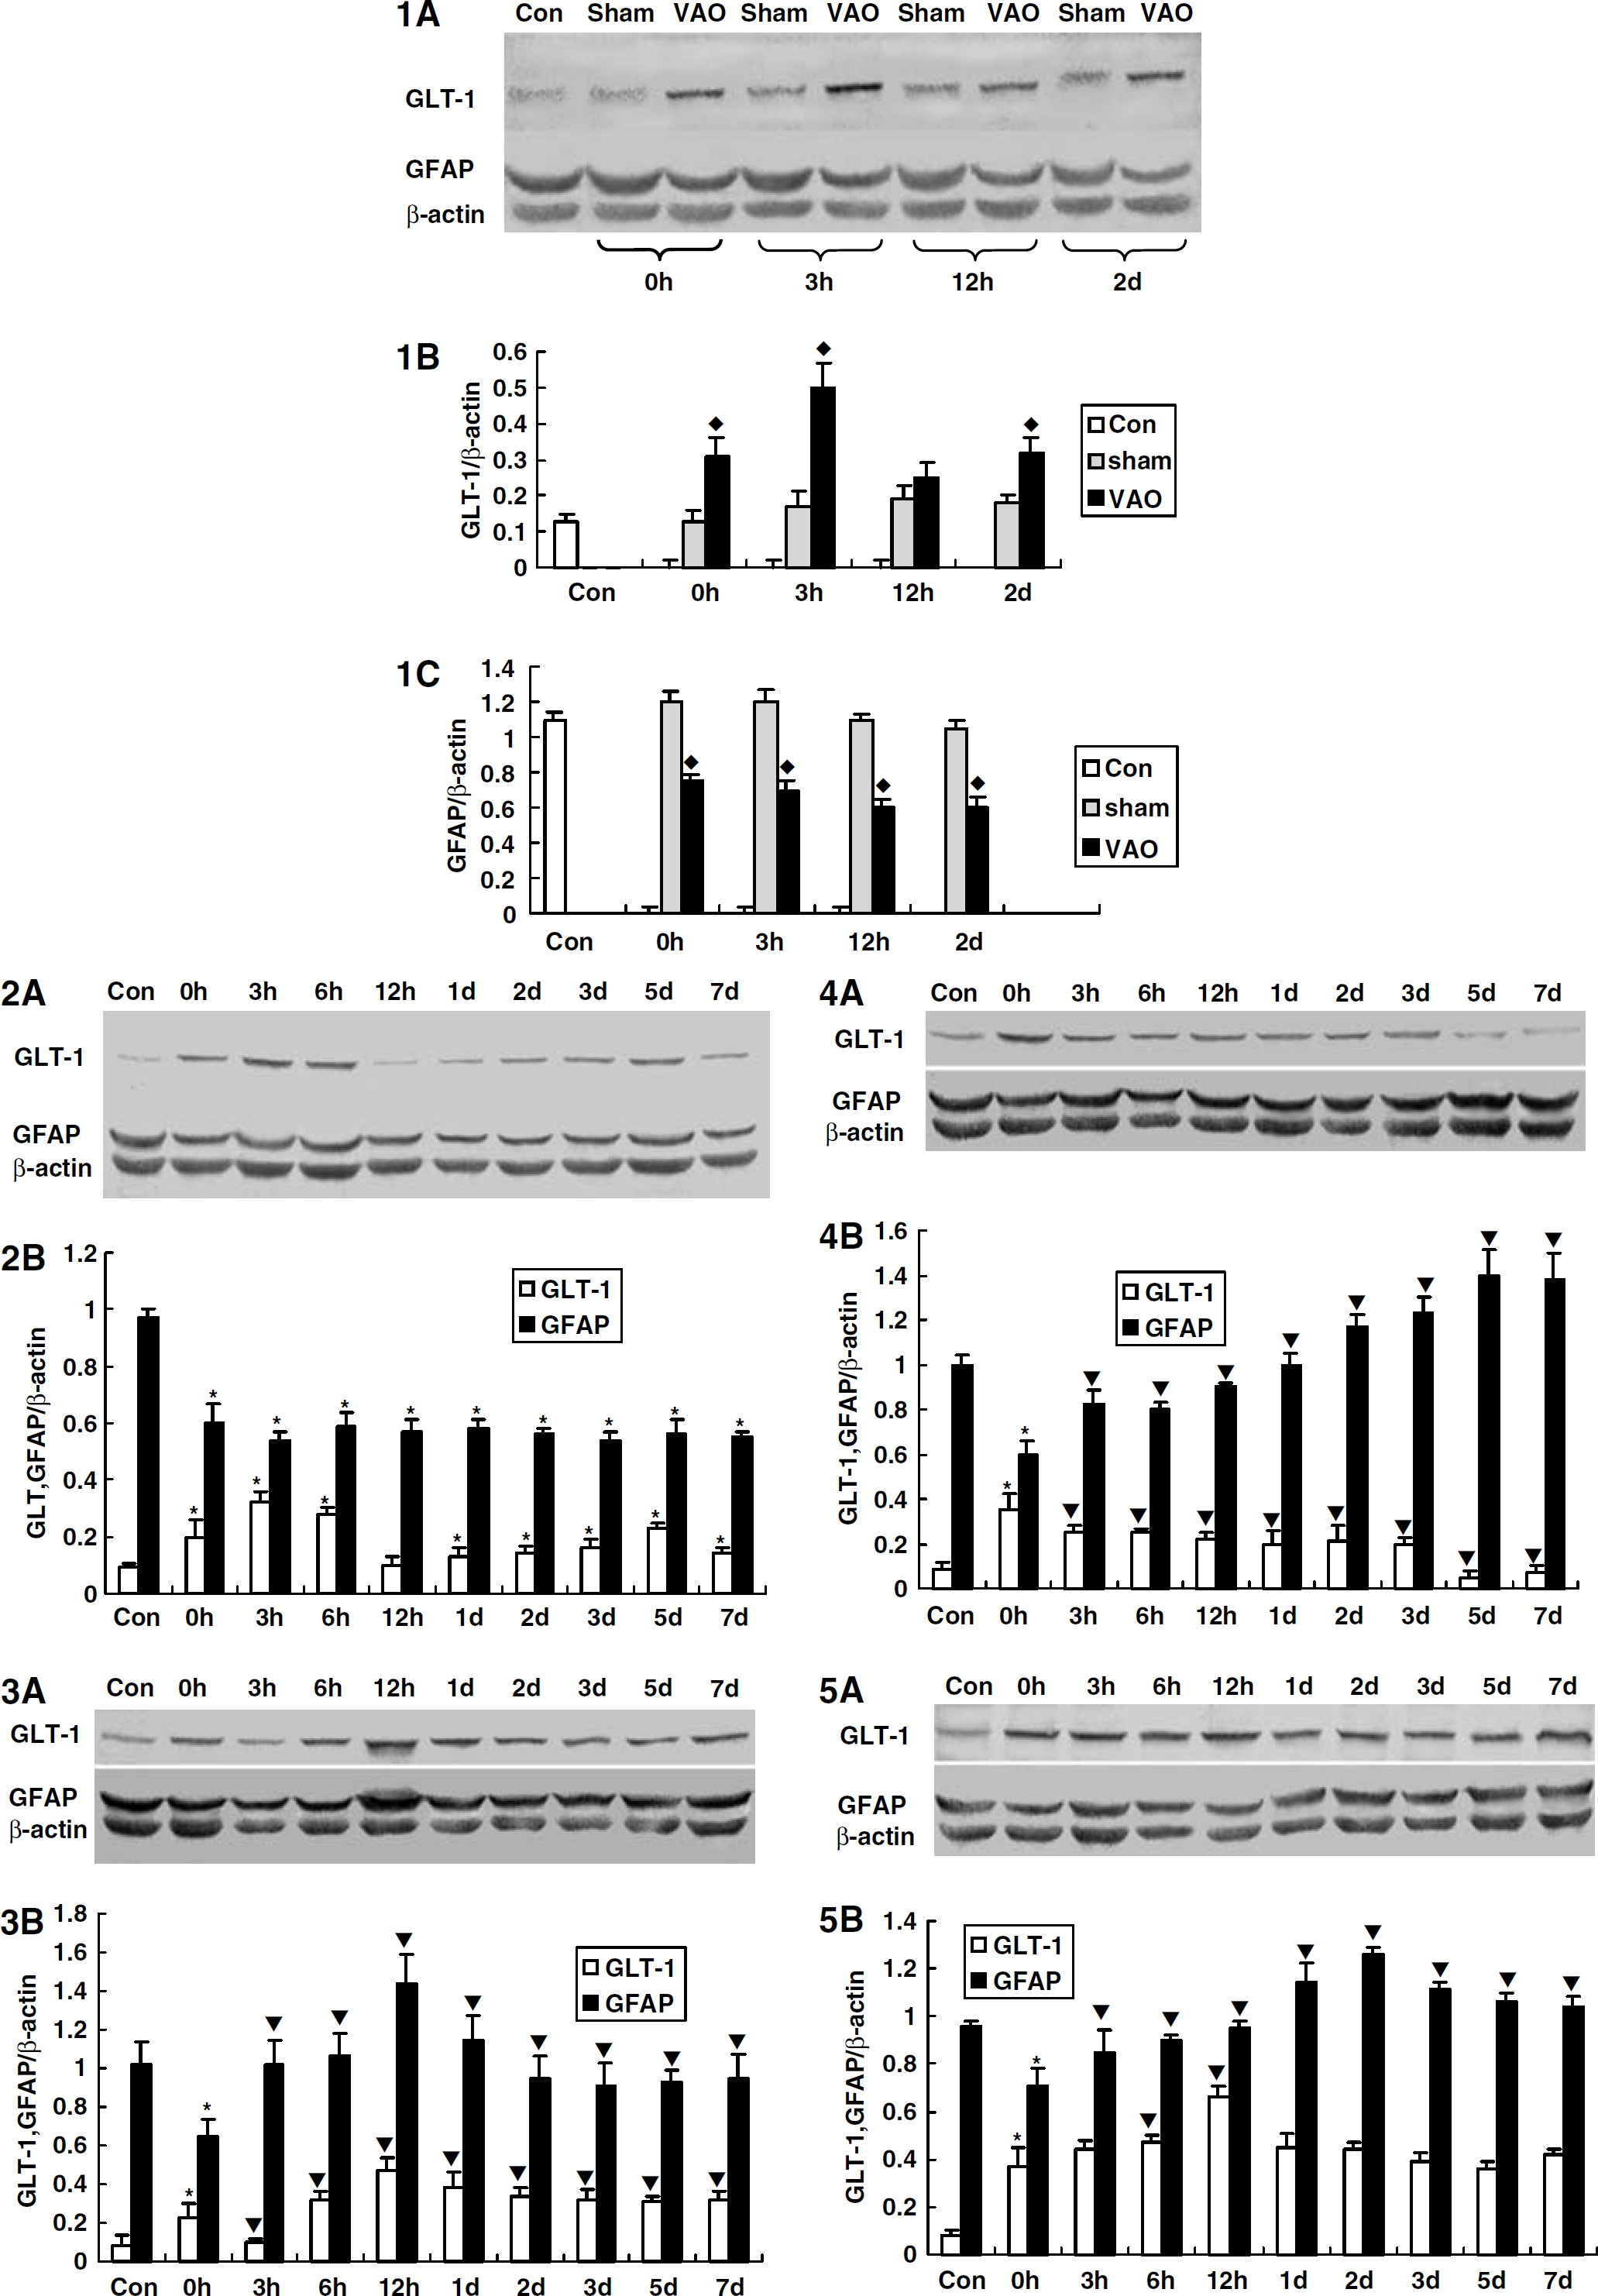
The time courses of the expression of GLT-1 and GFAP in CA1 hippocampus in each group by Western blot analysis. The abbreviations are the same as those in the Figure 1. (4.1
Compared with the control group, no difference of GLT-1 levels was found at each time point observed in the sham group (Figures 4.1A and B). However, the levels of GLT-1 expression were significantly upregulated in CA1 subfield at almost all time points from time 0 h, which corresponds to 2 days after occlusion of vertebral arteries (Figure 1), to 5 days in the VAO group compared with that of the control group (Figures 4.2A and B). There was a double-peak pattern in the upregulation. The first one appeared at 3 and 6 h, and the second one was at 5 days after the occlusion of vertebral arteries (Figures 4.2A and B).
To understand whether the upregulation of GLT-1 in the VAO group was induced by the occlusion of vertebral arteries or by the surgical procedures and anesthesia, we compared the expression of GLT-1 of the VAO group with that of the sham group. It was found that the GLT-1 levels were upregulated at time 0 (immediate), 3 h, and 2 days in the VAO group, which indicated that the GLT-1 upregulation in the VAO group was induced by the occlusion of vertebral arteries themselves, rather than the anesthesia or surgical procedures (Figures 4.1A and B).
In the CIP group, the GLT-1 level at immediate time point was much higher than that of the control group (Figures 4.3A and B). Because the immediate time point, that is to say no interval after the CIP for 3 min in fact, is too short to induce any change in protein level, the upregulation of GLT-1 ought to result from the occlusion of vertebral arteries rather than from the CIP. On the base of the upregulated level of GLT-1 at the immediate time point, the expression of GLT-1 was further upregulated after CIP for 3 min, especially at 12 h, 1 day (Figures 4.3A and B), although a temporal downregulation of GLT-1 was observed at 3 h after the CIP. Moreover, when compared with the VAO group, the expression of GLT-1 was also upregulated from 12 h to 7 days (Figures 5A1–5A4, and Figures 5B1–5B9).
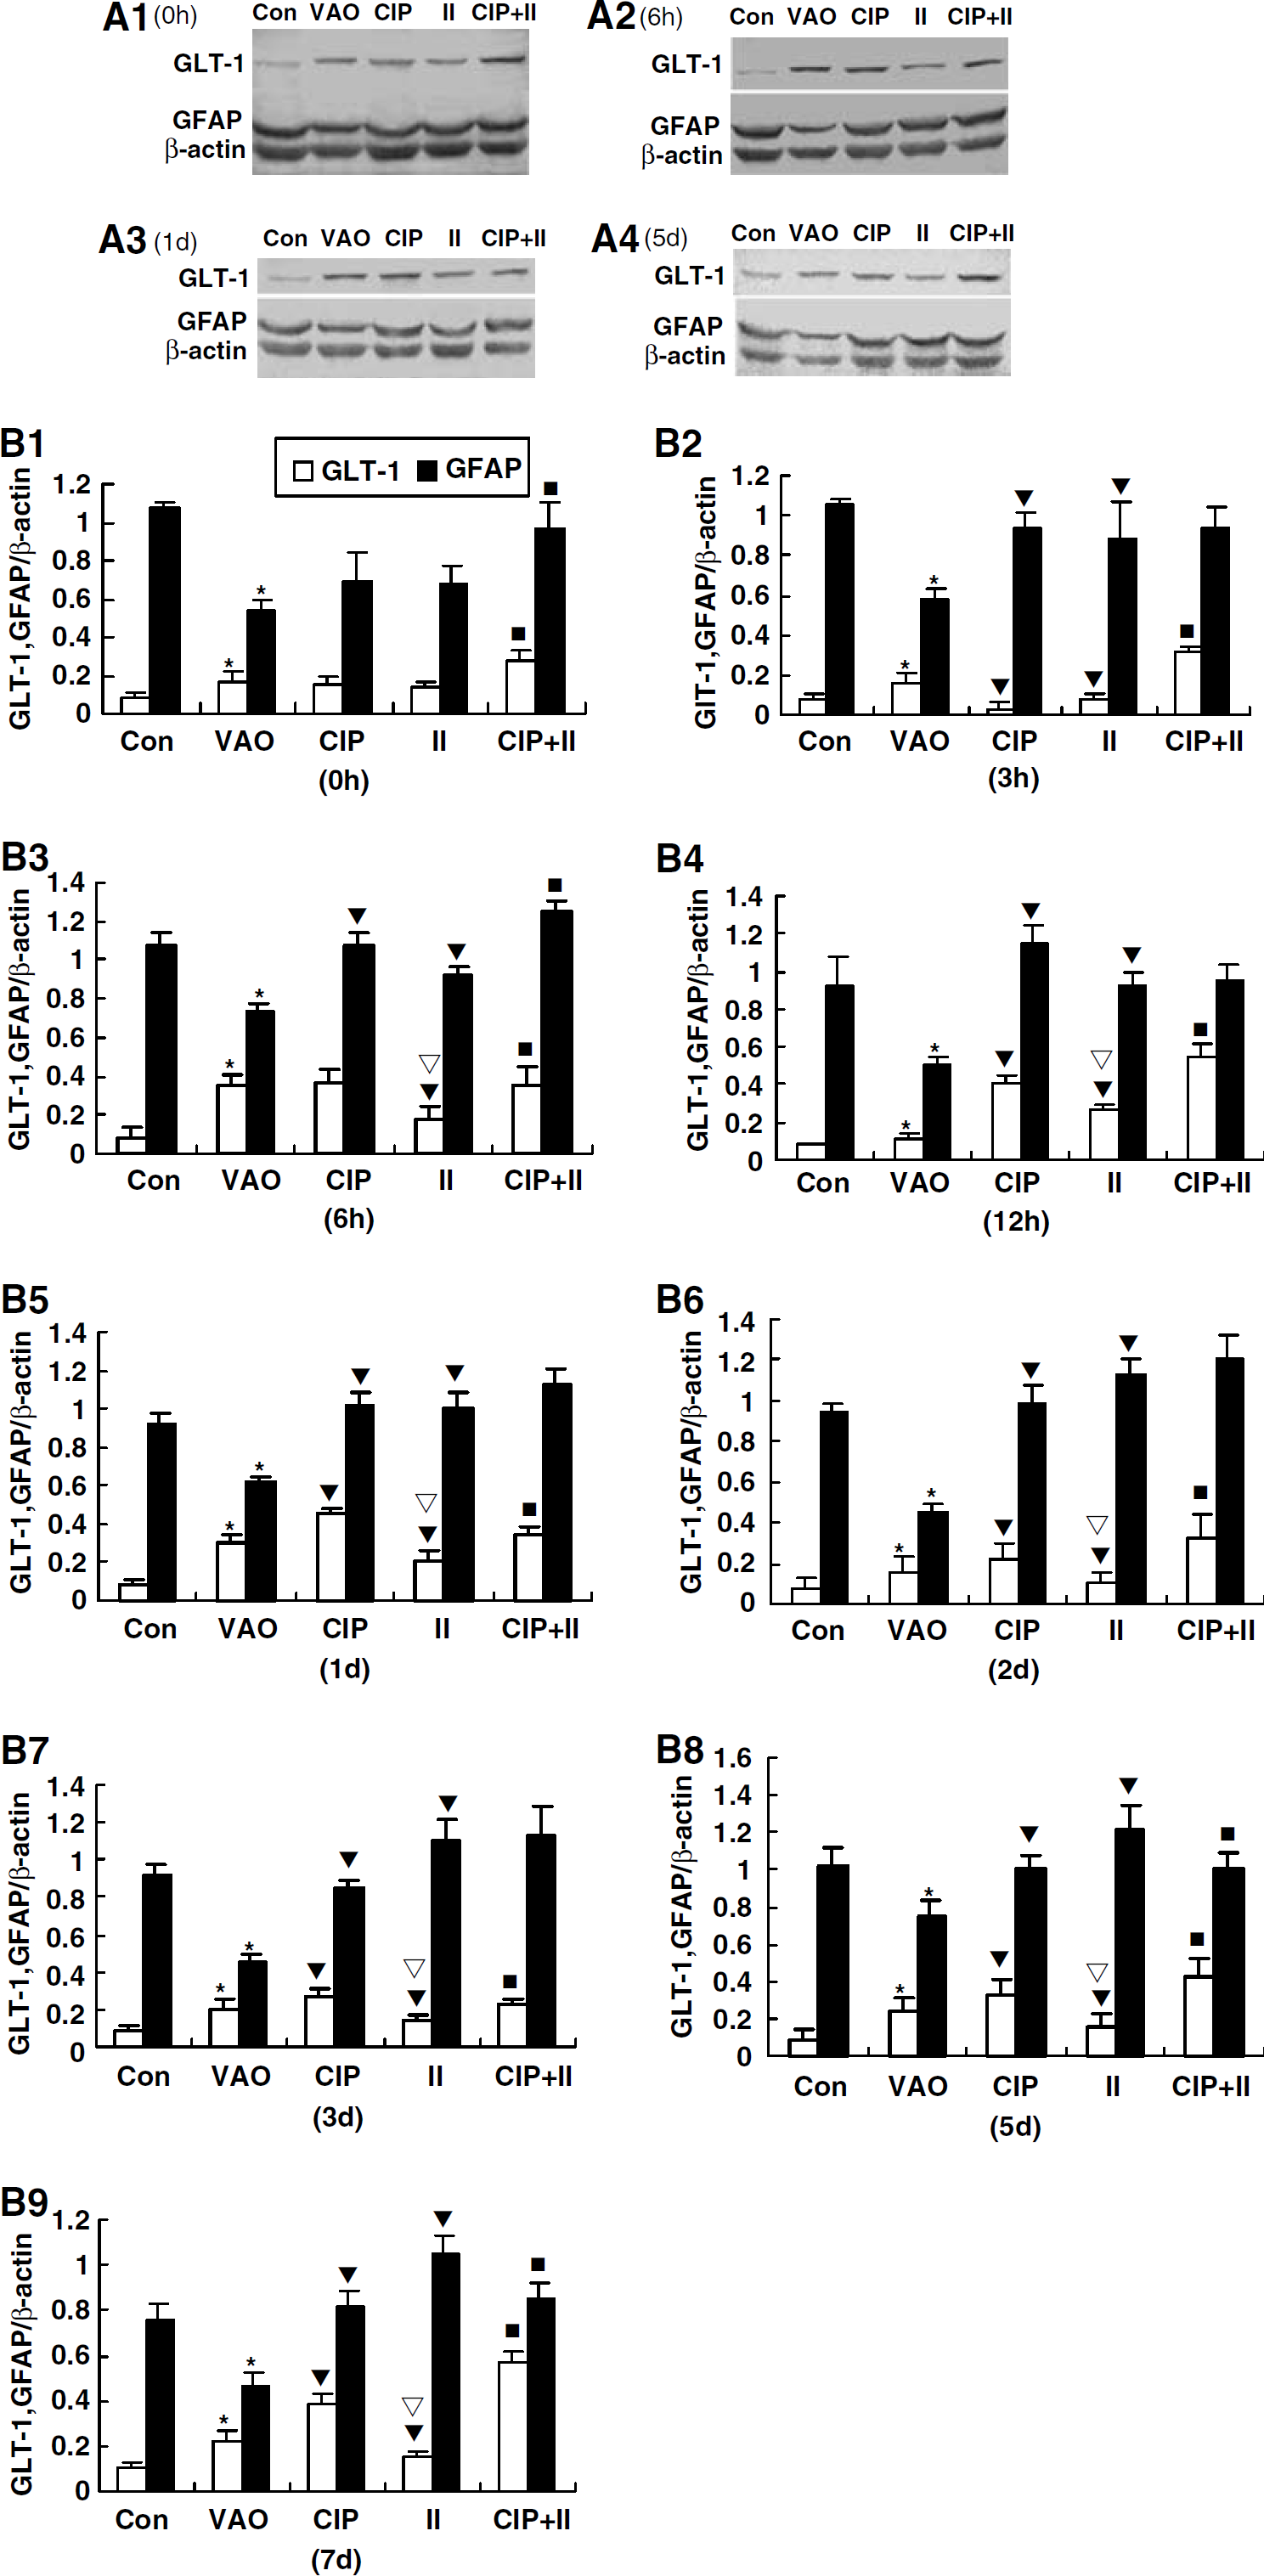
Comparison of the expression of GLT-1 and GFAP between different groups at observed time points by Western blotting analysis.
In the ischemic insult group, the amount of GLT-1 at time 0 h was also increased. The time 0 h in this group is the immediate time point just after the end of the procedure of the lethal ischemic insult for 8 min. It means that there is no interval after the lethal ischemic insult in fact (as shown in Figure 1). Therefore, the upregulation of GLT-1 at time 0 h in this group ought to result from the occlusion of vertebral arteries 2 days before, rather than being induced by the lethal ischemic insult for 8 min. The influence of the lethal ischemic insult ought to be reflected by other time points after the lethal ischemic insult rather than time 0 h. The GLT-1 levels were significantly downregulated from 3 h to 7 days compared with that of the immediate time point of the same group (Figures 4.4A and B). Compared with the VAO group, the GLT-1 expression was significantly downregulated at almost all time points except 0 h and 12 h in the ischemic insult group (Figures 5A and 5B). Moreover, when compared with the CIP group, the GLT-1 expression was also significantly downregulated at almost all time points except 0 and 3 h in the ischemic insult group (Figures 5A1–5A4, and Figures 5B1–5B9).
When the animals were pretreated with the CIP for 3 min 2 days before the lethal ischemic insult, the downregulation of GLT-1 induced by lethal brain ischemic insult was prevented thoroughly by the CIP. Compared with the immediate time point of the same group, the GLT-1 expression was significantly upregulated at 6 and 12 h in the CIP + ischemic insult group (Figures 4.5A and B). Compared with the ischemic insult group, the GLT-1 level was significantly upregulated from 0 h to 7 days (Figures 5A1–5A4, and Figures 5B1–5B9).
Expression of GFAP
Immunohistochemistry assay: In the control group, GFAP immunostaining showed that astrocytes took on a star or spider-like shape with prominent processes. Very few GFAP immunoreactive particles were observed in the area between the pyramidal neurons (Figures 6A and 6G). Compared with the control group, significant downregulation of GFAP immunoreactivity was observed at all time points in the VAO group, and few GFAP immunoreactive particles were observed in the area that tightly surrounded the pyramidal neurons (Figures 6B and 6G). After a CIP for 3 min, the GFAP expression was significantly upregulated at almost all time points compared with that of the VAO group. Very interestingly, some GFAP immunoreactive particles were observed in the area between the pyramidal neurons, which tightly surrounded the pyramidal neurons and made the pyramidal layer look like a ‘shaped grade’ (Figure 6C). The characteristics of immunostaining were similar to those of GLT-1 immunostaining mentioned above. Moreover, both the total area and average optical density of GFAP immunostaining after the CIP were significantly upregulated compared with those of the VAO group (Figure 6G). After the lethal ischemic insult for 8 min, astrocytes hypertrophied in soma with thickened processes and more intensive staining, which reached a peak at 3 days. However, no GFAP immunoreactive particles were observed in the area between the pyramidal neurons or the neighboring area of the pyramidal layer at all (Figure 6D). From the fifth day after the lethal ischemic insult, the body of the astrocytes became more hypertrophic, whereas the processes of the hypertrophic astrocytes began to collapse and fragment (Figure 6E). Although the number, total area, and average optical density of immunoreactive cells were increased significantly after the lethal ischemic insult compared with those of the VAO group (Figure 6G), they were accompanied by severe DND as showed by thionin staining (Figures 2D and 2E). All the above indicated that the morphologic changes of the astrocytes did not protect pyramidal neurons against DND when the brain suffered from lethal ischemic insult. When the animals were pretreated with a CIP 2 days before the lethal ischemic insult, there were many GFAP immunoreactive particles that tightly surrounded the pyramidal neurons thoroughly, which made the ‘shaped grid’ observed in the CIP group more clear (Figure 6F). The phenomenon reached peak at 2 days and constantly lasted to 7 days (the end of the study). However, both the number and average optical density of the GFAP immunoreactive cells were significantly decreased compared with those of the ischemic insult group (Figure 6G).
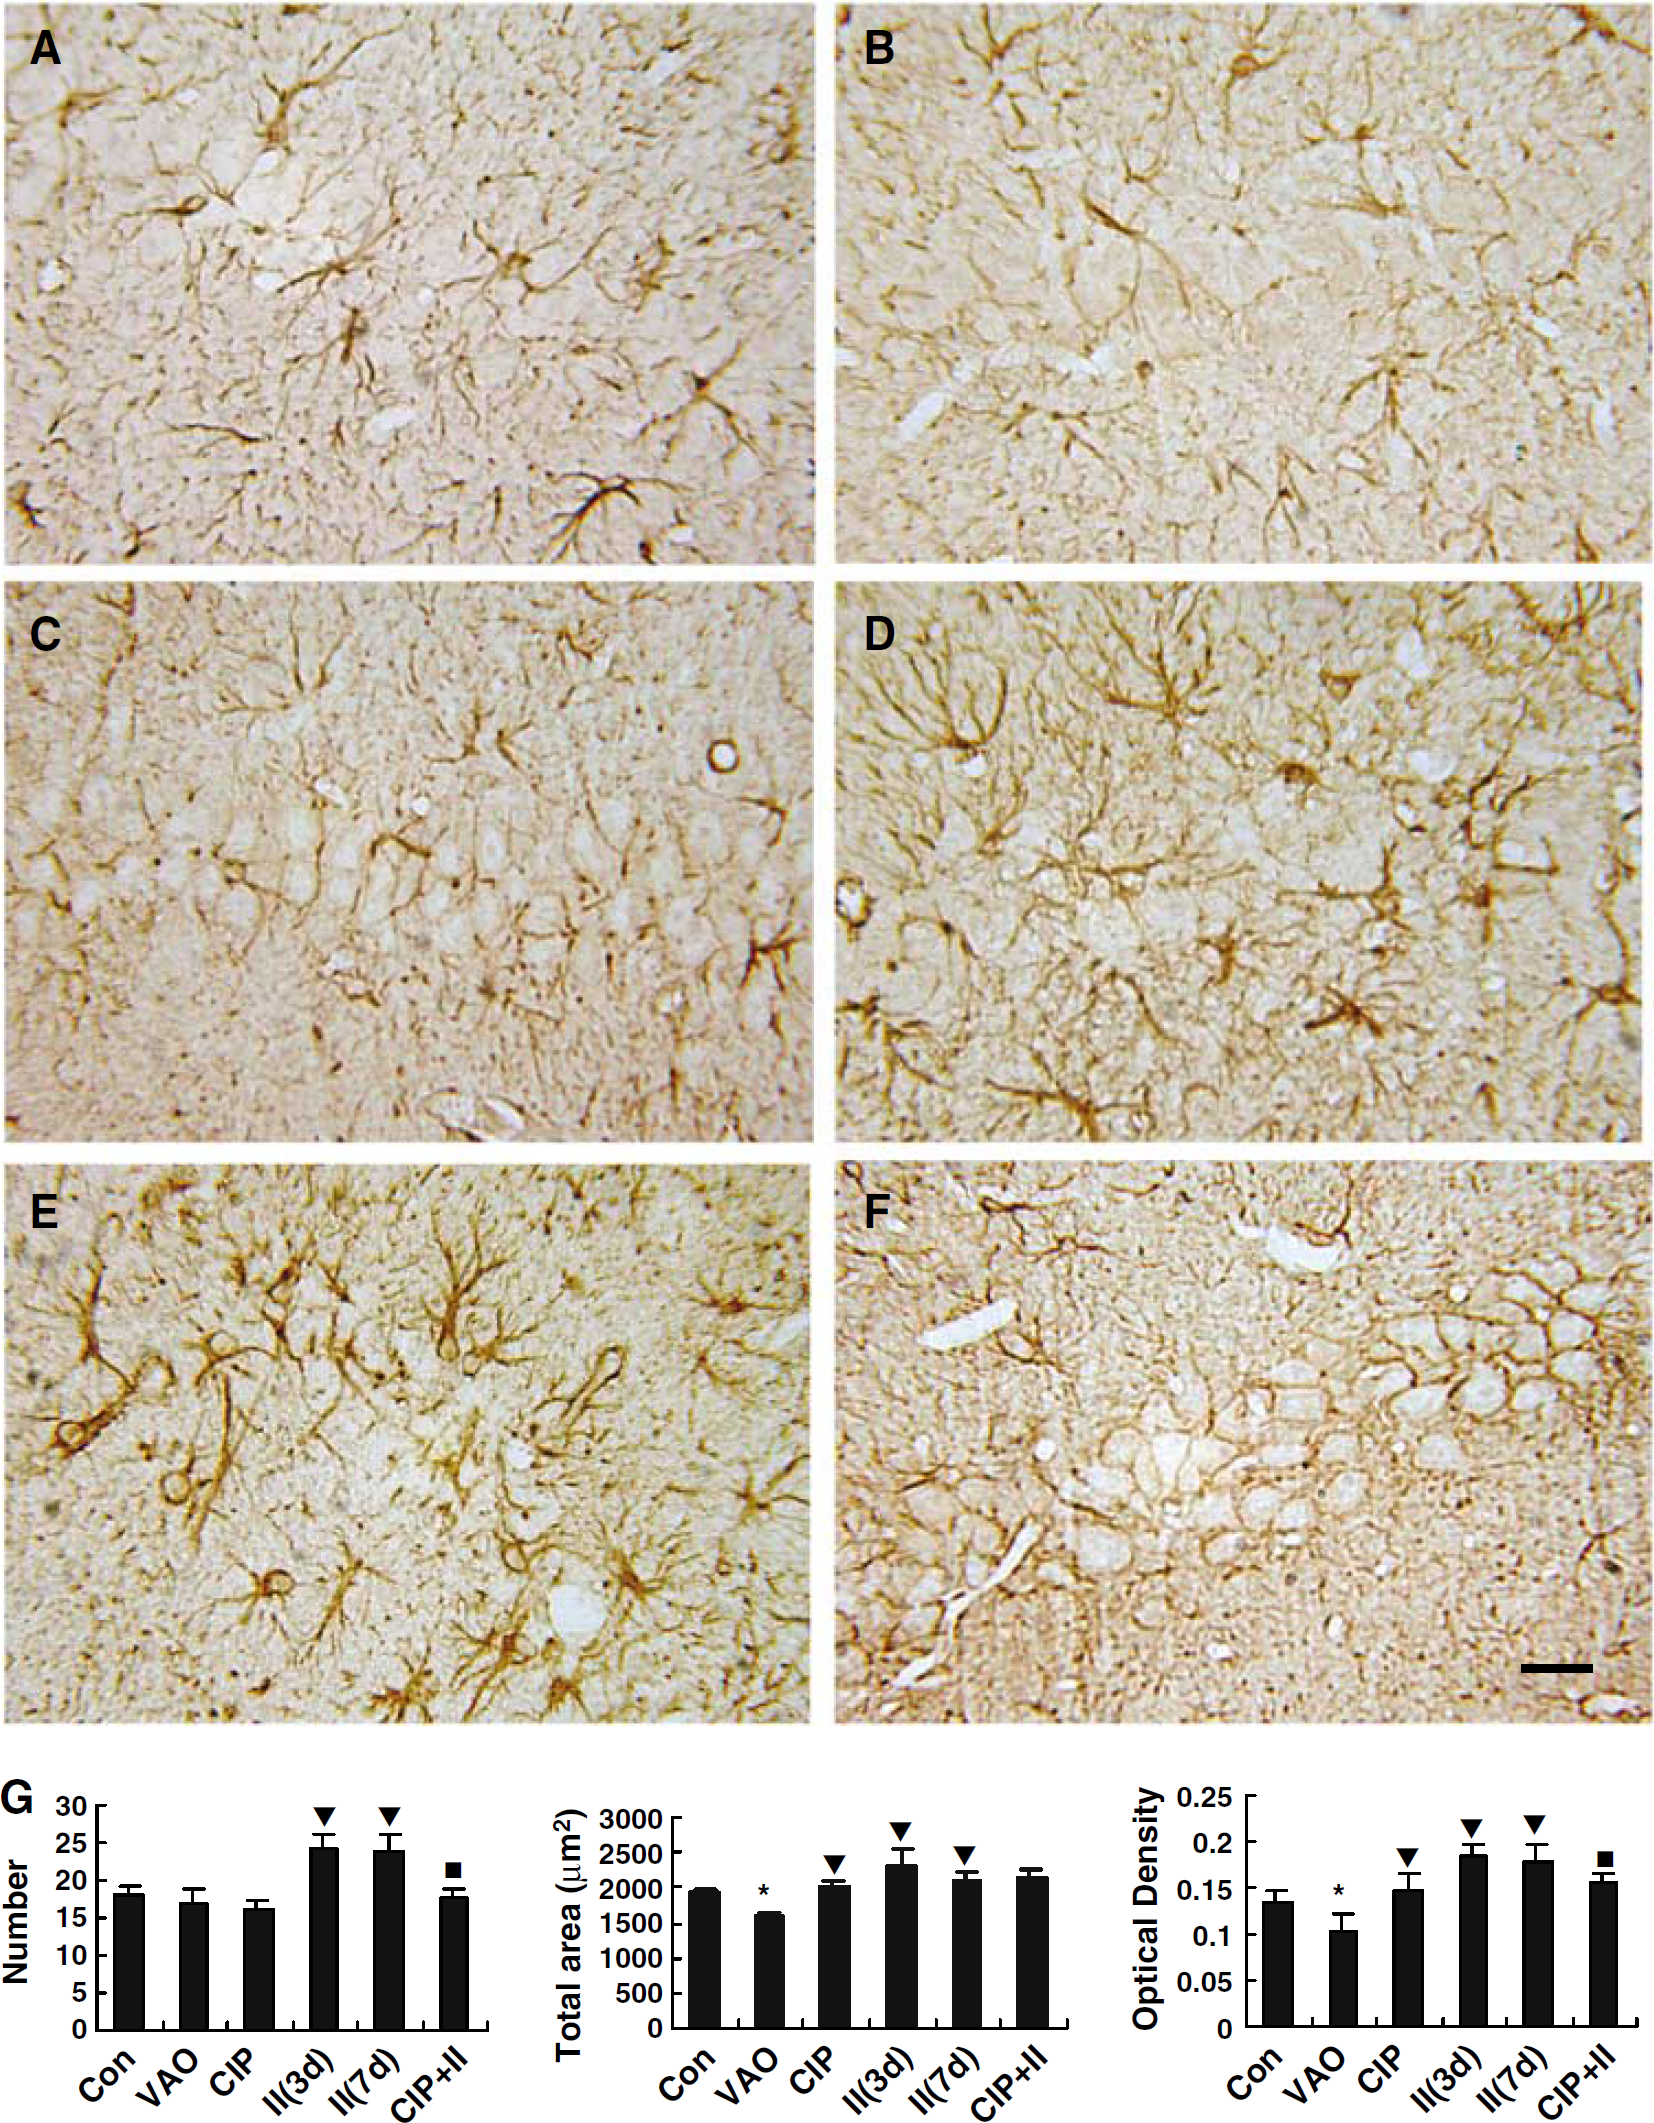
Representative immunohistochemical staining photomicrographs show changes in the expression of GFAP in the hippocampal CA1 subfield at 7 days (except for
Western blotting analysis: No difference of GFAP levels was found at every time point in the sham group compared with that of the control group (Figures 4.1A and C). However, compared with the control group, the GFAP levels were significantly downregulated at all time points in the VAO group (Figures 4.2A and B, Figures 5A and 5B). Moreover, we compared the expression of GFAP of the VAO group with that of the sham group (Figures 4.1A and C). It was found that the GFAP levels in the VAO group were significantly lower than those of the sham group at all time points (Figures 4.1A and C), which indicated that the GFAP downregulation in the VAO group was induced by the occlusion of vertebral arteries themselves rather than anesthesia or surgical operation.
In the CIP group, the GFAP levels were significantly upregulated at all time points compared with the immediate time point in the same group (Figures 4.3A and B). Compared with the VAO group, the GFAP levels were significantly upregulated at almost all time points except the immediate time point after CIP (Figures 5A and 5B).
In the ischemic insult group, the GFAP levels were significantly upregulated at all time points compared with the immediate time point in the same group (Figures 4.4A and B). Interestingly, there was an opposite change in the expression of GFAP and GLT-1 after the lethal ischemic insult. It meant that the upregulation of GFAP was accompanied by a downregulation of GLT-1 expression (Figures 4.4B). Compared with the VAO group, the GFAP levels were significantly upregulated at almost all time points (Figures 5B2–5B9) except the immediate time point after lethal ischemic insult for 8 min (Figures 5A1 and 5B1).
In the CIP + ischemic insult group, the GFAP levels were significantly upregulated at all time points compared with the immediate time point in the same group (Figures 4.5A and B). Compared with the ischemic insult group, the GFAP levels were significantly downregulated at 5 and 7 days (Figures 5B8 and 5B9), while being upregulated at time 0 and 6 h (Figures 5B1 and 5B3).
Effect of DHK on the Induction of Brain Ischemic Tolerance
In the hippocampal CA1 subfield of the VAO group, the pyramidal neurons were untouched (Figure 7A), the HG was 0, and ND was 208 ± 7.2 mm−1 (Table 2). No significant neuronal damage was observed at 7 days after CIP for 3 min (Figure 7B, Table 2). However, obvious DND was observed at 7 days after the lethal ischemic insult for 8 min (Figure 7C, Table 2). When the rats were pretreated with CIP 2 days before the lethal ischemic insult, the DND normally induced by lethal ischemic insult was prevented clearly (Figure 7D, Table 2). The above data indicated that CIP for 3 min effectively protected pyramidal neurons in the CA1 hippocampus against DND normally induced by lethal ischemic insult. There was no apparent DND in artificial cerebrospinal fluid group (Figure 7E, Table 2). Dihydrokainate in doses of 10, 100, and 200 nmol just caused slight DND of pyramidal neurons in the CA1 hippocampus (Figures 7F, 7G and 7H and Table 2). No obvious DND was found in DHK + CIP groups (Figures 7I, 7J, 7K and Table 2). Compared with the CIP + ischemic insult group, significant DND was observed in DHK + CIP + ischemic insult groups (Figures 7L, 7M and 7N), which was represented by significantly decreased ND and increased HG (Table 2). The damage in DHK + CIP + ischemic insult groups worsened with the increase in the dose of DHK used (Figures 7L, 7M and 7N and Table 2). These results indicated that DHK could dose-dependently block the protective role of CIP against DND of pyramidal neurons in the CA1 hippocampus normally induced by lethal brain ischemic insult.
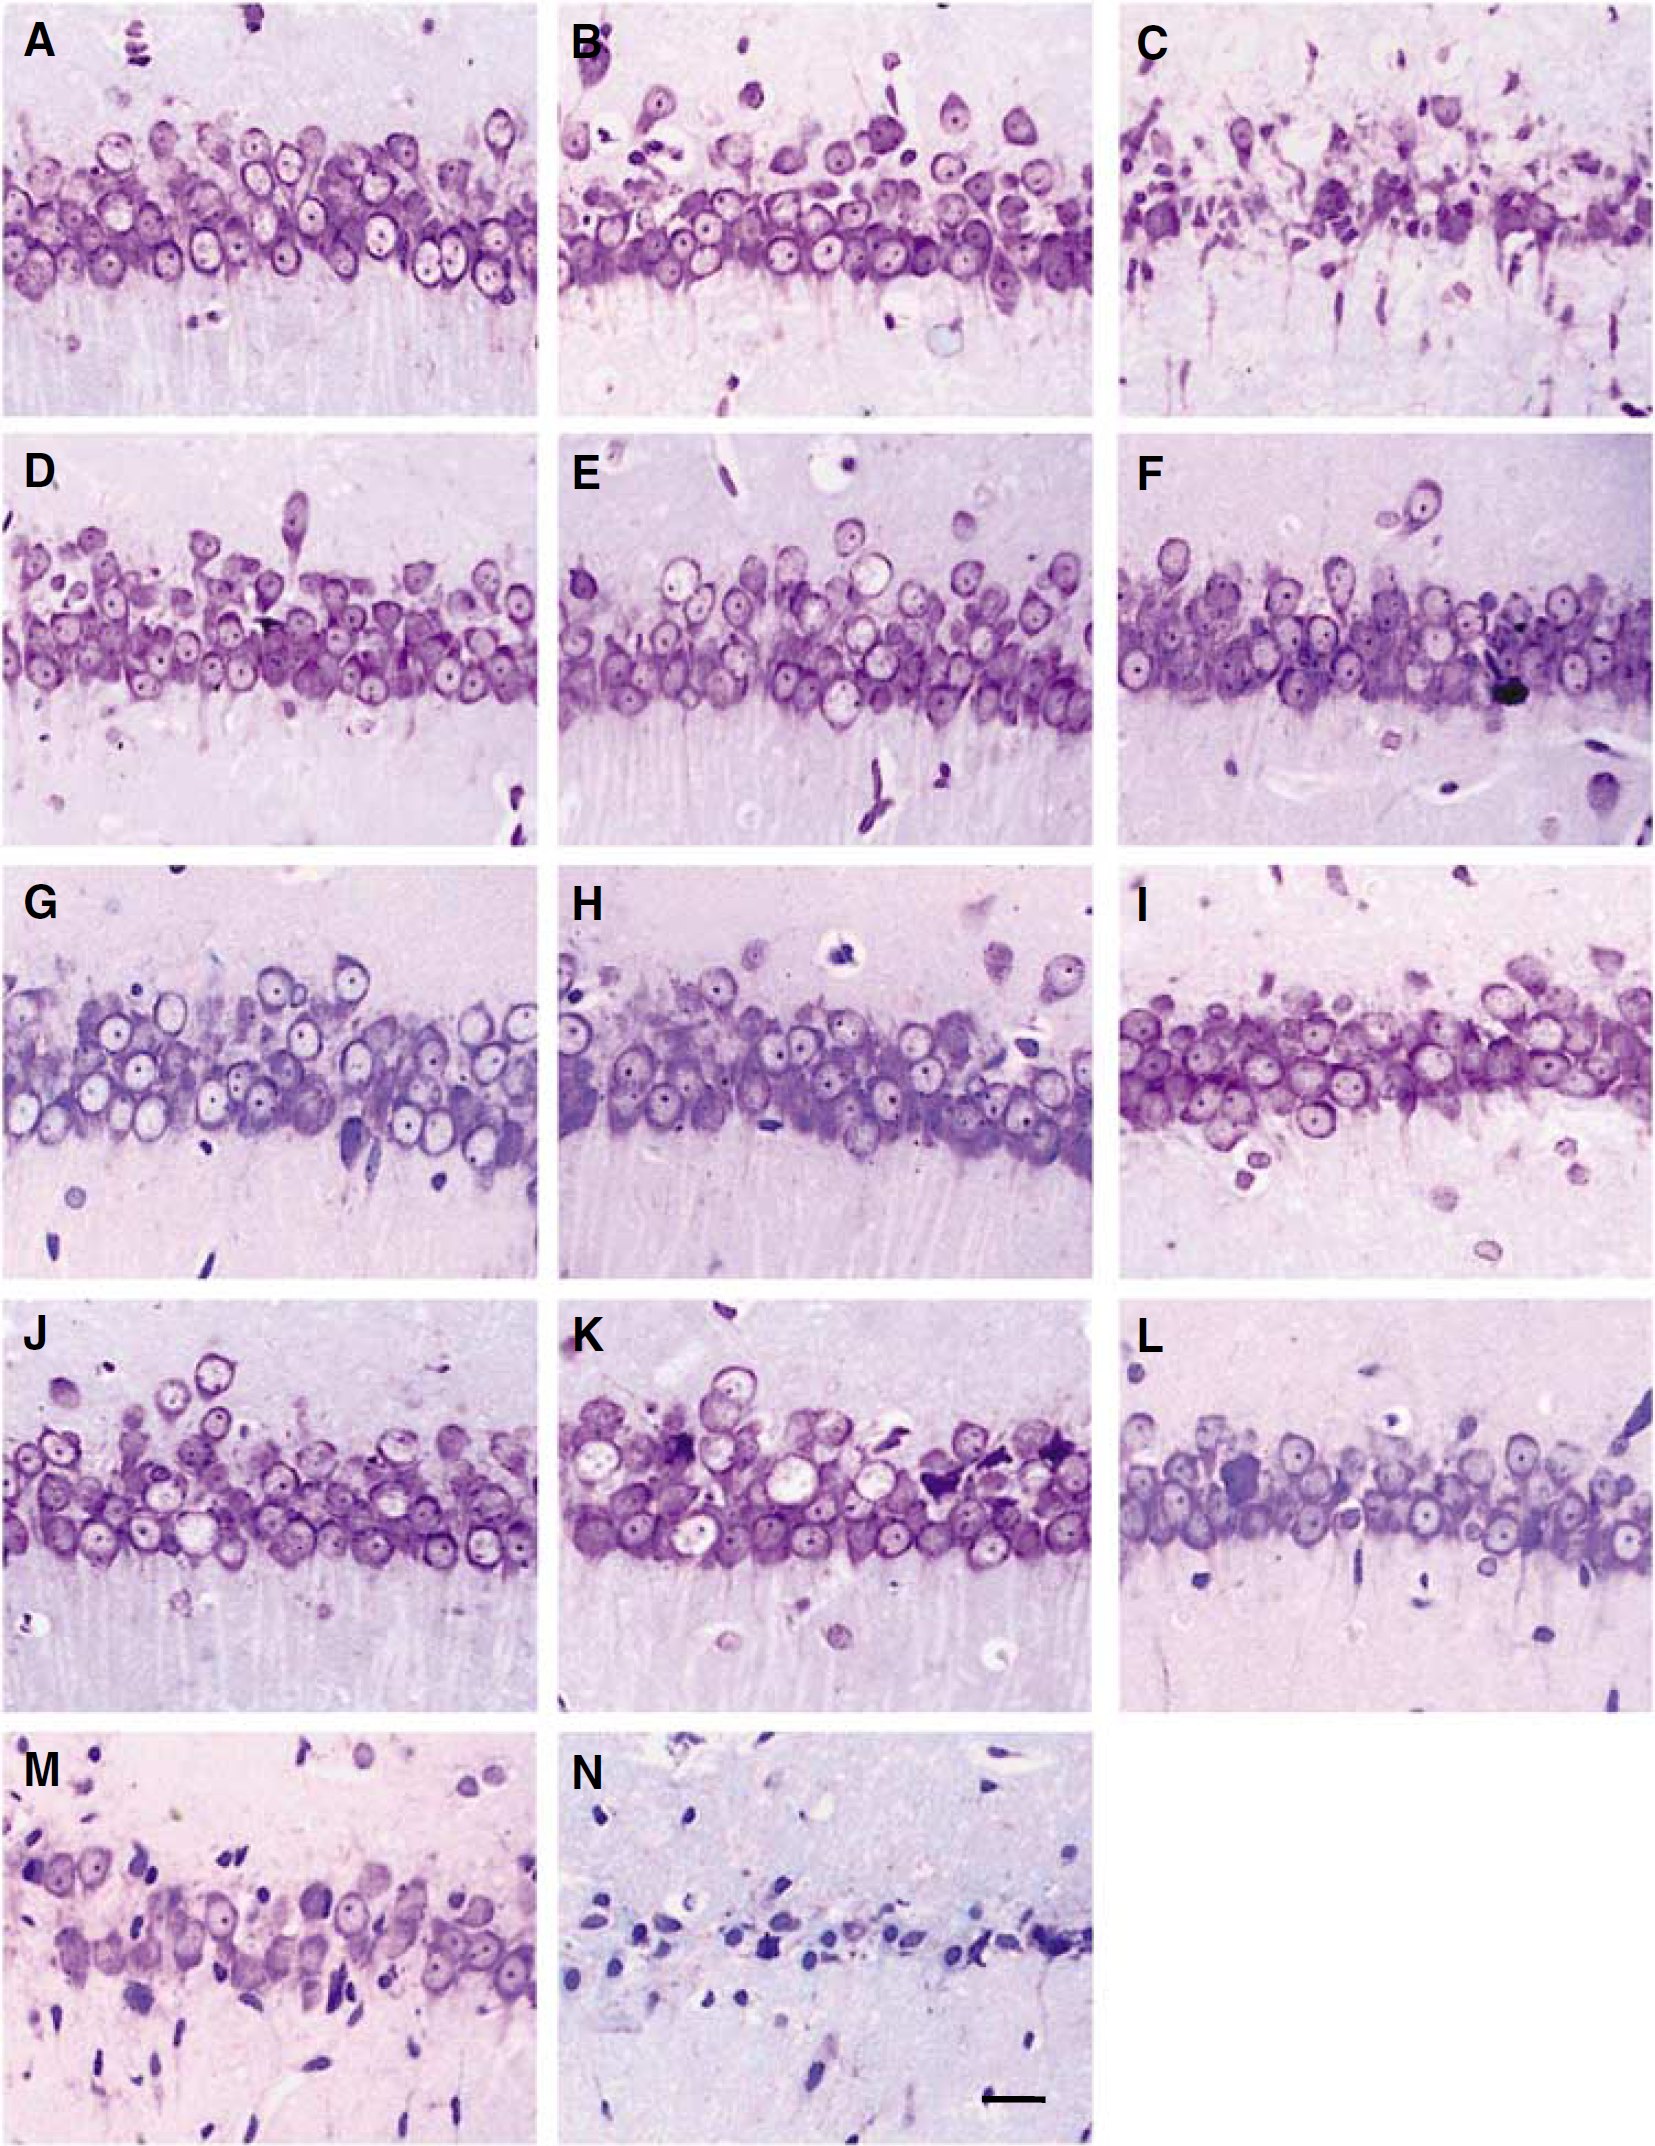
DHK dose-dependently blocked the neuroprotective role of CIP against DND in the CA1 hippocampus normally induced by lethal brain ischemic insult (thionin staining). The abbreviations are the same as those in the Figure 1.
Effect of DHK on the neuronal density (ND) and histological grade (HG) in the CA1 hippocampus during the induction of brain ischemic tolerance by cerebral ischemic preconditioning (CIP)
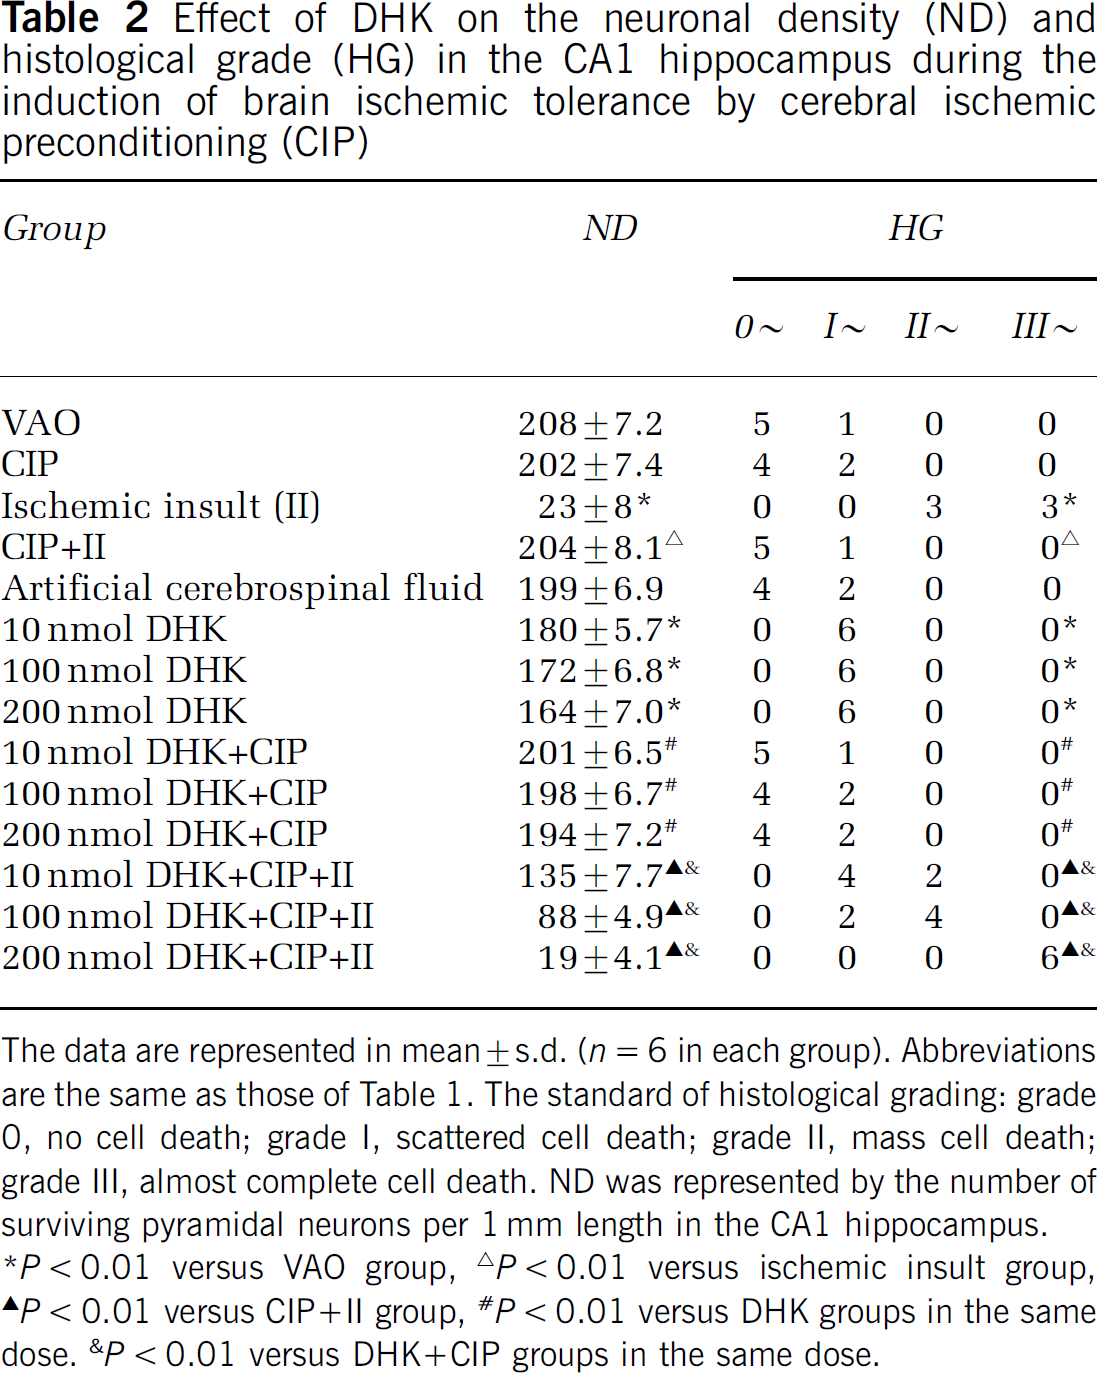
The data are represented in mean ± s.d. (n = 6 in each group). Abbreviations are the same as those of Table 1. The standard of histological grading: grade 0, no cell death; grade I, scattered cell death; grade II, mass cell death; grade III, almost complete cell death. ND was represented by the number of surviving pyramidal neurons per 1 mm length in the CA1 hippocampus.
P < 0.01 versus VAO group,
P < 0.01 versus ischemic insult group,
P < 0.01 versus CIP + II group,
P < 0.01 versus DHK groups in the same dose.
P <0.01 versus DHK + CIP groups in the same dose.
Discussion
In the present study, lethal brain ischemic insult for 8 min caused serious DND in the CA1 hippocampus. But when the animals were pretreated with the CIP for 3 min 2 days before the lethal ischemic insult, the above injury was prevented, which indicated that the CIP protected the pyramidal neurons against the DND induced normally by the lethal ischemic insult. The above result was the same as described in previous studies (Chen et al, 1996; Liu et al, 2006; Kirino, 2002; Kitagawa et al, 1990; Zhou et al, 2004). All the above indicated that the model was successful.
Surrounding of pyramidal neurons by astrocytes and upregulation of GLT-1 induced by CIP for 3 min in the present study may play an important role in protecting pyramidal neurons against DND induced normally by lethal ischemic insult. Immunohistochemistry showed similar characteristic changes in the expression of GLT-1 and GFAP after CIP in the present study. It was found that many immunoreactive particles of GLT-1 and GFAP distributed in the area between the pyramidal neurons, and tightly surrounded the pyramidal neurons after the CIP. The immunoparticles made the pyramidal layer characteristically look like a ‘shape grid’. The above changes became clearer in the CIP + ischemic insult group. The morphologic characteristics of the immunostaining indicated that the immunoparticles manifested the processes of astrocytes. This feature is consistent with previous reports that GLT-1 mainly distributes in astrocytes (Lehre et al, 1995; Levy et al, 1993; Rothstein et al, 1994). At the same time, there was significant upregulation of GLT-1 after the CIP was found by Western blotting analysis. The CIP not only prevented the downregulation of GLT-1 induced by lethal ischemic insult for 8 min, but induced further upregulation of the GLT-1 expression, especially when the animals were pretreated with the CIP 2 days before the lethal ischemic insult. Based on the above result and analysis, it could be indicated that the astrocytes extended their processes into the area between pyramidal neurons, tightly surrounded the pyramidal neurons and expressed a great deal of GLT-1 after CIP. Although the level of extracellular glutamate was not detected in the present study, another study showed that cellular glutamate uptake was increased by the upregulation of EAAT2 (GLT-1) and EAAT3 after a short oxygen–glucose deprivation preconditioning (Romera et al, 2004). Payet et al (2004) found that a short period of hypoxia stimulated glutamate uptake in whole rat retinal cells in vitro that protected them from excitotoxicity by maintaining the extracellular glutamate at low level. Additionally, significant downregulation of GLT-1 expression was accompanied by severe DND after lethal ischemic insult for 8 min in the present study.
Furthermore, Part 2 in the present study clearly showed that DHK in doses of 10, 100, and 200 nmol just caused slight DND of pyramidal neurons in the CA1 hippocampus (Figures 7F, 7G and 7H and Table 2), which indicated that the doses of DHK were safe to the pyramidal neurons in CA1 hippocampus. No obvious DND was found in DHK + CIP groups (Figures 7I, 7J and 7K and Table 2), which showed that DHK, together with CIP, was also safe to the pyramidal neurons in CA1 hippocampus. Interestingly, compared with the CIP + ischemic insult group, significant DND was observed in DHK + CIP + ischemic insult groups (Figures 7L, 7M and 7N), which showed that DHK dose-dependently abolished the protective effect of CIP by inhibiting the function of GLT-1. Further, these results indicated the role of GLT-1 in the induction of the brain ischemic tolerance.
Therefore, based on the above results and analysis, it could be concluded that both the morphologic characteristic changes and the upregulation of GLT-1 expression in astrocytes, induced by CIP for 3 min, should lead to an increase in the capacity of removing extracellular glutamate, thus playing an important role in protecting pyramidal neurons against DND normally induced by lethal ischemic insult. Further studies addressing the extra-cellular glutamate level after CIP will help reinforce our above conclusion.
The GLT-1 has already upregulated at 0 h time point in the CIP + ischemic insult group (Figures 5A1 and 5B1). This characteristic is particularly important in the induction of brain ischemic tolerance. Many studies have proved that the early release of glutamate is critical to ischemic neuronal damage (Benveniste et al, 1984; Kato and Kogure, 1999; Lipton, 1999). Although lethal ischemic insult leads to the DND, the release of glutamate has begun just at the beginning of the lethal ischemic insult. For example, Benveniste et al (1984) have observed that the extracellular contents of glutamate and aspartate increased during ischemic period eight- and three-fold, respectively. After transient middle cerebral artery occlusion, the extracellular glutamate concentrations increased immediately and returned to baseline range within 5 min after recirculation (Mitani and Tanaka, 2003). Seki et al (1999) have observed that glutamate and aspartate concentrations in striata increased immediately, following the beginning of ischemia, and returned to baseline values after reperfusion. In the present study, the immediate time point after lethal ischemic insult in the CIP + ischemic insult group was corresponding to 2 days after the CIP for 3 min (as shown in Figure 1). At that time, induced by the prior CIP, GLT-1 had already upregulated and tightly surrounded the pyramidal neurons. Therefore, it is possible to sufficiently uptake extracellular glutamate by the upregulated GLT-1 at the immediate time point after the lethal ischemic insult. This could maintain the extracellular glutamate below neurotoxic level and protect the neurons against DND normally induced by lethal ischemic insult. However, besides the immediate glutamate increase during and following brain ischemia, Mori et al (2004) observed delayed extracellular glutamate increases after focal cerebral ischemia, which occurred at about 5 h or from 15 to 24 h under different conditions. In our present study, the relatively long lasting upregulation of GLT-1 (Figures 4.5 A and B, and Figures 5B1–5B9) after the CIP might also play an important role in the induction of the brian ischemic tolerance by preventing the delayed increase of extracellular glutamate after lethal ischemic insult.
In the ischemic insult group, the hypertrophic astrocytes without upregulation of GLT-1 expression could not protect pyramidal neurons against DND after lethal ischemic insult for 8 min. By GFAP immunostaining, many hypertrophic astrocytes with thickened processes at early stages or collapsed processes at late stages were observed clearly in the hippocampal CA1 subfield, whereas no immunoreactive particles were found in the pyramidal layer. At the same time, the expression of GLT-1 was significantly downregulated, especially in the area where almost complete pyramidal neurons died, and the neighboring area of the pyramidal layer, even appeared as a sheet absence of GLT-1 immunoreactivity. All the above showed that the hypertrophic astrocytes neither extended the processes into the area between the pyramidal neurons nor upregulated the expression of GLT-1. Because obvious DND was accompanied by the morphologic changes of astrocytes mentioned above after ischemic insult for 8 min, it suggested that the hypertrophic astrocytes with less GLT-1 could not protect pyramidal neurons in CA1 subfield against DND induced by the lethal ischemic insult. The suggestion was supported by some previous reports. For example, after transient cerebral ischemia, glutamate transporter function of hippocampal CA1 astrocytes was downregulated by decreasing the protein level of GLT-1, which led to the abnormal increase of extracellular glutamate and initiated DND in CA1 pyramidal layer (Chen et al, 2005; Raghavendra Rao et al, 2000; Yeh et al, 2005). Furthermore, some studies have proved that either downregulation of GLT-1 expression or inhibiting GLT-1 function could aggravate ischemic injury. For example, Tanaka et al (1997) demonstrated increased extracellular glutamate levels and spontaneous lethal epileptic seizures in GLT-1 knockout mice. Transient middle cerebral artery occlusion in rats infused with either GLT-1 antisense oligodeoxy nucleotides or inhibitors of the GLT-1 transporter (dihydrokainate, DHK) led to increased infarct volume, worsened neurologic status, and increased mortality rate (Rao et al, 2001a, b).
Why did the astrocytes prolong and extend their processes into the area between the pyramidal neurons and tightly surround the pyramidal neurons during the induction of brain ischemic tolerance? We presume that the pyramidal neurons may be releasing some cytokines or neurotransmitters that can induce the processes of astrocytes growing during the cerebral ischemic preconditioning. Neary et al (1998) reported that extracellular ATP, acting via P2 receptors, stimulated proliferation of rat cortical astrocytes in primary cultures and in human fetal astrocytes by a pathway that involves extracellular signal-regulated protein kinase (ERK), a member of a key protein kinase cascade that mediates proliferation and differentiation of cells (Neary et al, 1998). Furthermore, Neary et al (2006) reported that both ATP (released from damaged or dying cells) and fibroblast growth factor 2 contribute to the formation of reactive astrocytes by P2Y receptors and increased cyclin expression in CNS injury.
In the present study, the occlusion of vertebral arteries did not cause any neuronal injury. However, the expression of GLT-1 was significantly upregulated at almost all time points, especially during the initial 6 h after the occlusion of vertebral arteries. Conversely, the expression of GFAP was significantly downregulated at all time points. Why did the expression of GFAP and GLT-1 show opposite changes after the occlusion of bilateral vertebral arteries, which just led to a slight decrease in brain blood flow? The present study could not explain the detailed mechanism of the phenomenon. Glial fibrillary acidic protein is expressed in cytoplasm, whereas GLT-1 is expressed on the membrane of astrocytes. This difference may be associated with the phenomenon.
Footnotes
Acknowledgements
This work was supported by the Natural Science Foundation of Hebei Province, PR China (No: C200500720) and the Special Foundation for Doctor Education in University from Ministry of Education, PR China (No: 20050089001).