
Abstract
Substantial controversy persists in the literature concerning the physiologic consequences hypocapnia, or low partial pressure of carbon dioxide (PaCO2). Invasive animal studies have demonstrated large pH increases (>0.25 U), phosphocreatine (PCr) decreases (>30%), and adenosine triphosphate (ATP) decreases (>10%) after hyperventilation (HV) (20 mm Hg PaCO2). However, using magnetic resonance spectroscopy, HV studies in awake humans have demonstrated only small pH changes (∼0.05 U) and no changes in PCr or ATP. It remains important to ascertain whether this failure to detect PCr changes in human studies reflects a true absence of changes, or a limitation in data fidelity. The present study used a rapidly interleaved phosphorus-proton spectroscopy acquisition from large samples at high magnetic field (4 T), to measure pH, PCr, inorganic phosphate, β-ATP, and lactate changes with high temporal and signal sensitivity. Five of six subjects had usable data. During 20 mins HV, PaCO2 reached a minimum at 16 mins (17 mm Hg); however, the maximum pH change (+0.047) peaked earlier (14 mins). Maximal lactate increases were measured at 15 mins. By 10 mins, maximum changes were observed for PCr (−3.4%) and inorganic phosphate (+6.4%). No changes in β-ATP were observed. The peak in pH, despite continued decreases in PaCO2, suggests active buffering during HV. These data, and the small magnitude of early PCr and inorganic phosphate changes, do not support substantial energy compromise during HV. Other mitigating factors, such as anesthesia-induced deregulation of the cerebrovasculature, might have contributed to the exaggerated metabolic changes observed in previous animal investigations.
Introduction
It remains controversial whether lowering the partial pressure of carbon dioxide, (PaCO2), also called hypocapnia, has dangerous consequences for the brain (Cruz, 2002). In awake human studies, phosphorus (31P) magnetic resonance spectroscopy (MRS) at 1.5 Tesla (T) has been used to measure intracellular pH and phosphocreatine (PCr) averaged over blocks of minutes during hypocapnia induced by hyperventilation (HV) (Friedman et al, 2006; Jensen et al, 1988; van Rijen et al, 1989). After 20 mins of HV, small increases in pH (0.05 to 0.1 U) were observed but no measured decreases in PCr or adenosine triphosphate (ATP) levels were measured (Friedman et al, 2006; Jensen et al, 1988; van Rijen et al, 1989).
In contrast, animal models using invasive measurement techniques and anesthesia find much greater increases in tissue pH (both intra/extracellular contributions) (0.27 U (Fritz et al, 2001, 2004)) after 1 h of HV (to 20 mm Hg). As the induced pH increase during sustained HV is greater at 20 mins than at 30 mins or over hours (Albrecht et al, 1987), these reported values are likely less than the maxima. Accompanying these pH increases was 30% to 38% decreases in PCr (Fritz et al, 2001, 2004) that was correlated with DNA fragmentation (Fritz et al, 2001). In the more recent study, reductions in ATP (13%) were also demonstrated along with an increase in calcium-ATPase flux, the latter interpreted as evidence for hypoxia (Fritz et al, 2004). Isolated cell preparations have also been used to test the consequences of hypocapnia, demonstrating marked pH increases (0.36 U), caspase activation and apoptotic changes after 3 h of low CO2 challenge (Xie et al, 2004). Taken together, these studies suggest that the brain (or cellular units) cannot adequately compensate for hypocapnia-induced alkalosis.
From MRS studies of humans, it is not clear whether a failure to detect PCr changes reflects a true absence of physiologic changes or limitation of data sensitivity. For example, prior human studies have been limited by the intrinsic low signal-to-noise of 31P at 1.5 T magnetic field strength, and data collected as blocks of minutes may obscure changes if they are rapidly occurring or of small magnitude. To overcome these potential limitations, this study used rapid interleaved 31P-hydrogen (1H) spectroscopy acquired from large sample volumes at high magnetic field strength (4 T) with the aim of measuring pH, high-energy phosphates (e.g., PCr, β-ATP), and lactate with enhanced temporal and signal sensitivity (Jensen et al, 2002). The measurement of lactate, which demonstrates a several-fold increase in signal intensity during comparable HV at 1.5 T (Dager et al, 1995; van Rijen et al, 1989), was included for descriptive purposes to compare the time-courses of induced pH and PaCO2 changes. With an accurate characterization of the magnitude and time-course of intracellular changes during HV in human subjects, we anticipated the ability to comment on possible mitigating factors influencing previous animal studies.
Materials and methods
Subjects
Six healthy control subjects (three males, three females, aged 29. 7±6.6 (range 25 to 40 years) were studied using interleaved 31P–1H MRS on a whole-body, 4 T MR scanner equipped with multinuclear/multichannel capabilities and running VNMRj 1.1b at the console (Varian Inc., Palo-Alto, CA, USA). Subjects had no history of cardiovascular disease and were free from anxiety and other DSM IV-R Axis I disorders. No subject was taking any medication at time of study. All subjects gave written informed consent for participation in the study, which was approved by the Harvard University/McLean Hospital Review Committee.
Hyperventilation Procedures
The MRI protocol consisted of a 10-mins baseline period in which subjects were instructed to ‘relax and breathe normally’. Next, subjects paced their breathing to an 18 breath-per-minute tone, played over headphones, for a 20 mins HV period. A nasal cannula was used to sample PaCO2 and a finger probe measured heart rate throughout the experiment using a MedRad (Pittsburgh, PA, USA) model 9500 multigas monitor. Both physiologic channels were recorded in real-time using LabView version 6 (National Instruments, Austin, TX, USA) for the Macintosh.
All subjects completed prescan training when they were trained to inhale through their mouth and exhale fully through their nose (ensuring cannula PaCO2 measurement), and to inhale and exhale deeply during the HV period using the tone pacing. This latter instruction was aimed to avoid shallow breathing during HV, which, by primarily clearing the dead-space in the lungs, may impact accurate measurement of end-tidal PaCO2. A 20 mins HV phase was used to elicit near maximum alkalosis (Albrecht et al, 1987). During the HV phase, frequent feedback for all subjects at 30-secs intervals was provided to aid in the maintenance of a PaCO2 near 20 mm Hg. At the end of the HV period, subjects were instructed to resume normal breathing without further feedback during a 20-mins recovery period.
Magnetic Resonance Spectroscopy Procedures
All brain measurements were performed on a 4 T Varian, UnityINOVA, whole-body MR system running VNMRj 1.1b. (Varian Inc., Palo Alto, CA, USA), using a dual-tuned volumetric TEM design (Bioengineering Inc., Minneapolis, MN, USA) RF head coil operating at 170.3 MHz for 1H and 68.9 MHz for 31P. A rapid 2D gradient-recalled echo imaging sequence (TR/TE=30/10 ms, NEX=1, matrix=128 × 256, FOV=240 mm, slice-thickness=5 mm) acquired images in all three spatial dimensions (sagittal, coronal, axial), which served to guide the prescription of the 1H 3 × 3 × 5 cm single-voxel and 5 cm thick 31P MRS axial slab (see Figure 1). The 1H voxel was localized centrally in the occipital lobe and chosen to both maximize gray matter inclusion and optimize field homogeneity by avoiding sinus inclusion. The 31P axial slab overlapped with this sample and improved signal-to-noise for this less abundant nucleus.
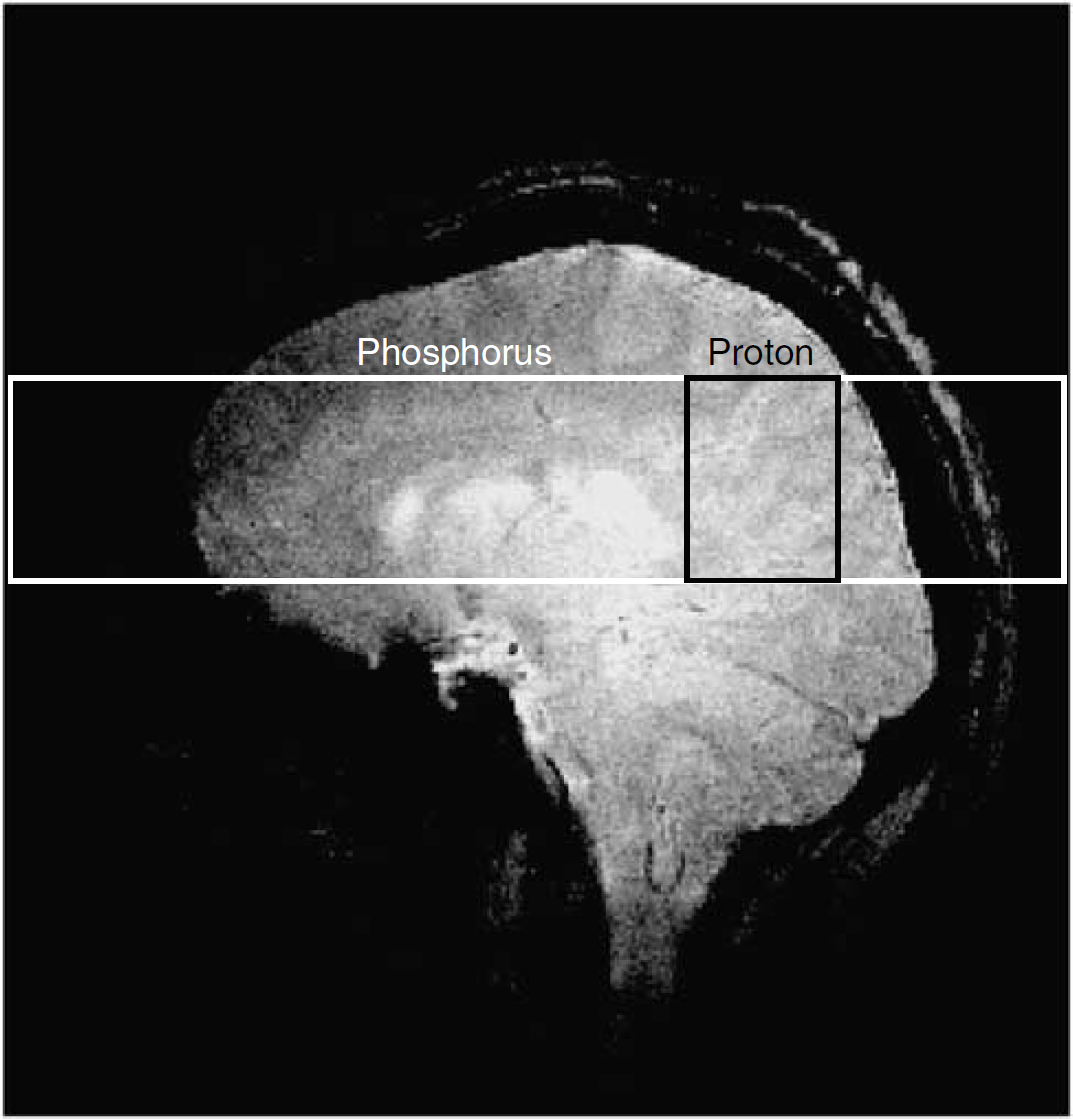
A sagittal prescription image with overlay of the phosphorus and proton spectroscopy regions is shown.
After voxel localization, manual shimming was performed on H2O with the aim of achieving a line-width <10 Hz. Next, an unsuppressed 1H spectrum was collected for 1H quantification (16 scans). Then across the entire experimental protocol (10 mins baseline, 20 mins HV, 20 mins recovery), 1H (PRESS TE=30/136 ms, TR=4 secs) and 31P slab-selective, pulse-acquire acquisitions (0.5 secs pre-acquisition delay, 90° tip-angle, TR=4 secs) were interleaved using a macro loop to load separate protocols each requiring a different hardware channel configuration. The 1H pulse was routed through the 4 kW radio-frequency amplifier and the primary observe channel for transmission, whereas the 31P pulse was routed through the 1 kW radio-frequency amplifier and the decoupling channel, with the primary observe channel swapped with software to setup, execute, and record the signal from each acquisition automatically in an interleaved fashion. 1H MRS was acquired at two echo times (which halved spectral number) during HV to investigate lactate measurement at 4 T.
After acquisition, unfiltered 31P spectral time-domain data were converted to text files for fitting using a nonlinear, time-domain Marquardt-Levenberg fitting routine (Jensen et al, 2002). 1H-MRS time-domain data were converted to LCModel format and fitted in the frequency domain (Provencher, 1993). An initial processing run corrected all spectra for frequency shift and phase. Next, real and imaginary pairs were added across 128-secs blocks (16 spectra 31P, 8 spectra 1H) in a moving average approach (e.g., for 31P, 1+2+3…16; 2+3+4…17; etc.) to enhance signal-to-noise. This number was determined empirically to avoid blurring of the Pi line-width, which shifts in position over time corresponding to pH changes. Similarly, since 2,3-diphosphoglycerate (2,3-DPG) on the shoulder of Pi does not shift during alkalosis, we added the Pi and 2,3-DPG amplitudes together for measurement of Pi to avoid potential artifact. Example spectra and line fitting from a single subject are shown in Figure 2.
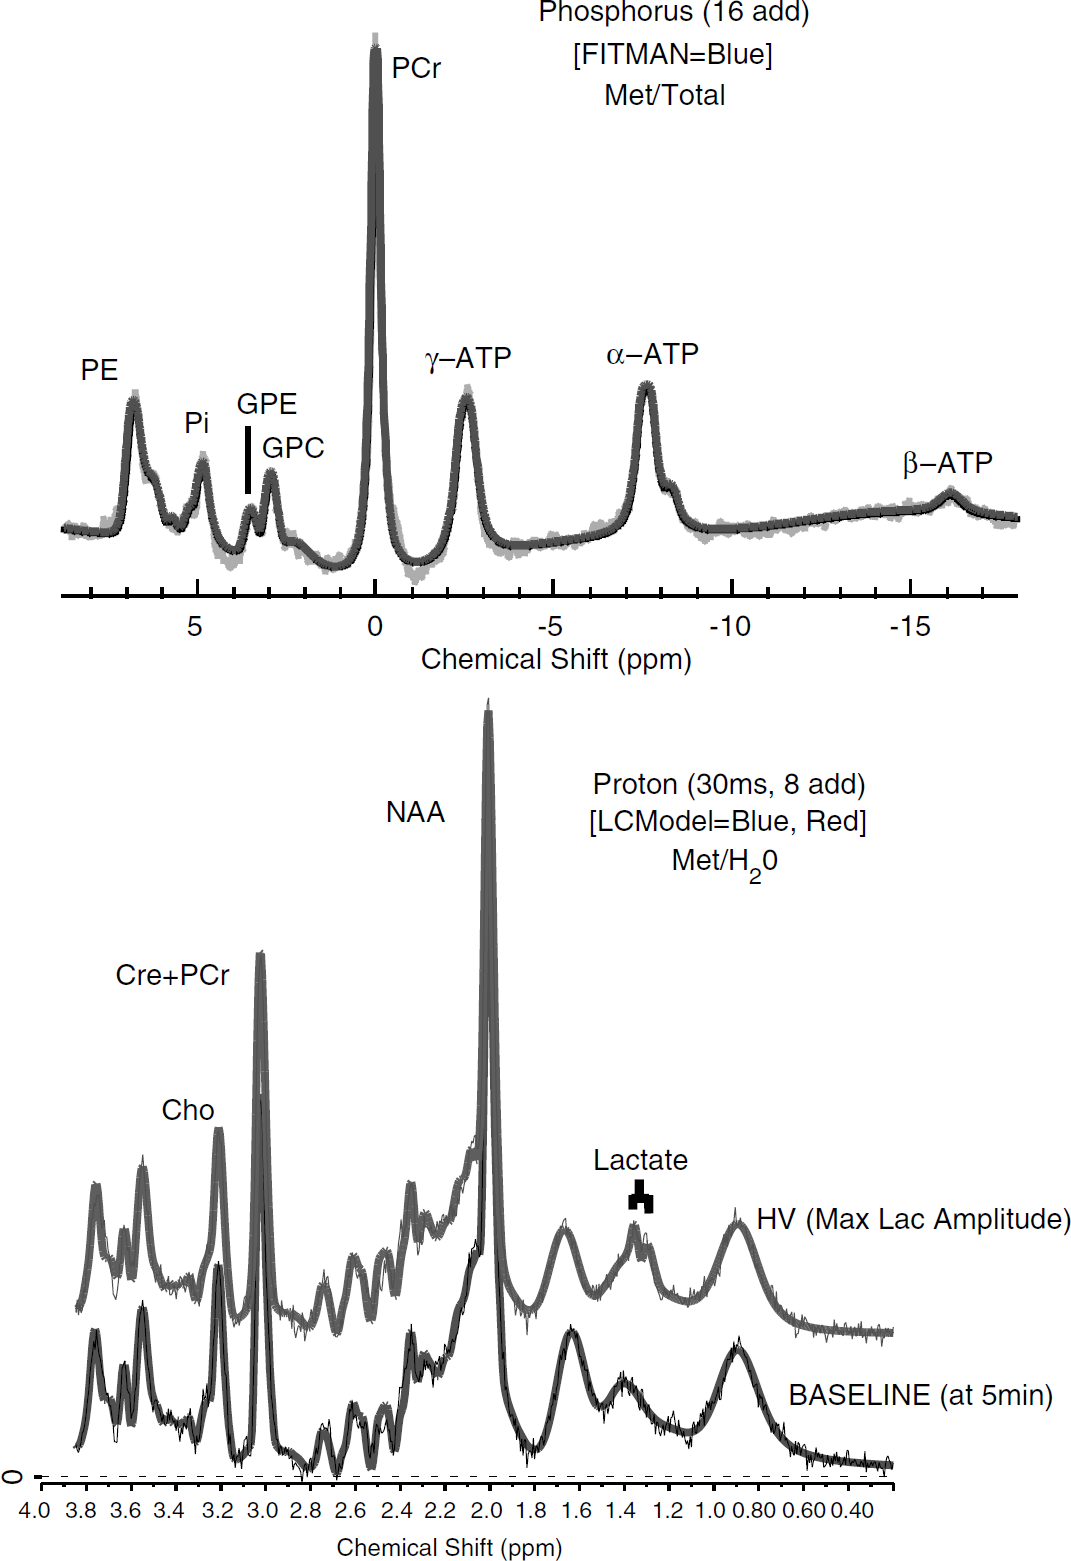
Spectra are shown from an individual subject at baseline (16 spectra added for phosphorus (31P), eight for proton (1H)). The bold lines correspond to line fitting in FITMAN and LCModel. At 15 mins, the maximum lactate amplitude, a doublet is clearly shown at 1.33 p.p.m. 31P Labels correspond to phosphoethanolamine (PE), inorganic phosphate (Pi), glycerophosphoethanolamine (GPE), glycerophosphocholine (GPC), phosphocreatine (PCr), adenosine triphosphate (γ, α, β). pH was computed from the shift between PCr and Pi. 1H labels correspond to choline containing compounds (Cho), creatine+phosphocreatine (Cre+PCr), N-acetyl aspartate (NAA), and lactate.
Study Measures
Physiologic measurements of PaCO2, respiratory rate (RR), and heart rate (HR) was smoothed by a 128 secs moving average filter to make the time-courses identical to MRS data.
For PCr, Pi, and β ATP, the labile component of ATP, fitted amplitudes were expressed as ratios of the total fitted 31P signal. The chemical shifts of Pi and PCr were used to compute pH (pH=6.75+(log10((Pi−PCr)−3.27)/(5.63−(Pi−PCr))) (Petroff et al, 1985). Lactate was referenced to each subject unsuppressed water signal to derive a concentration estimate. The 30 ms 1H data were used for measuring lactate, measured as an upright doublet during the HV period (e.g., at 15 mins see Figure 2). Lactate data at 136 ms, an inverted doublet, were obscured by residual lipid and macromolecule peaks.
Across the experimental protocol, descriptive statistics were used to characterize changes in peripheral physiology and brain MRS measures.
Baseline: The mean and s.d. were computed from the last 2 mins of baseline (minutes 6 to 8). This interval avoided inclusion of the smoothed HV period from the moving average filter (as depicted in Figure 3 top).
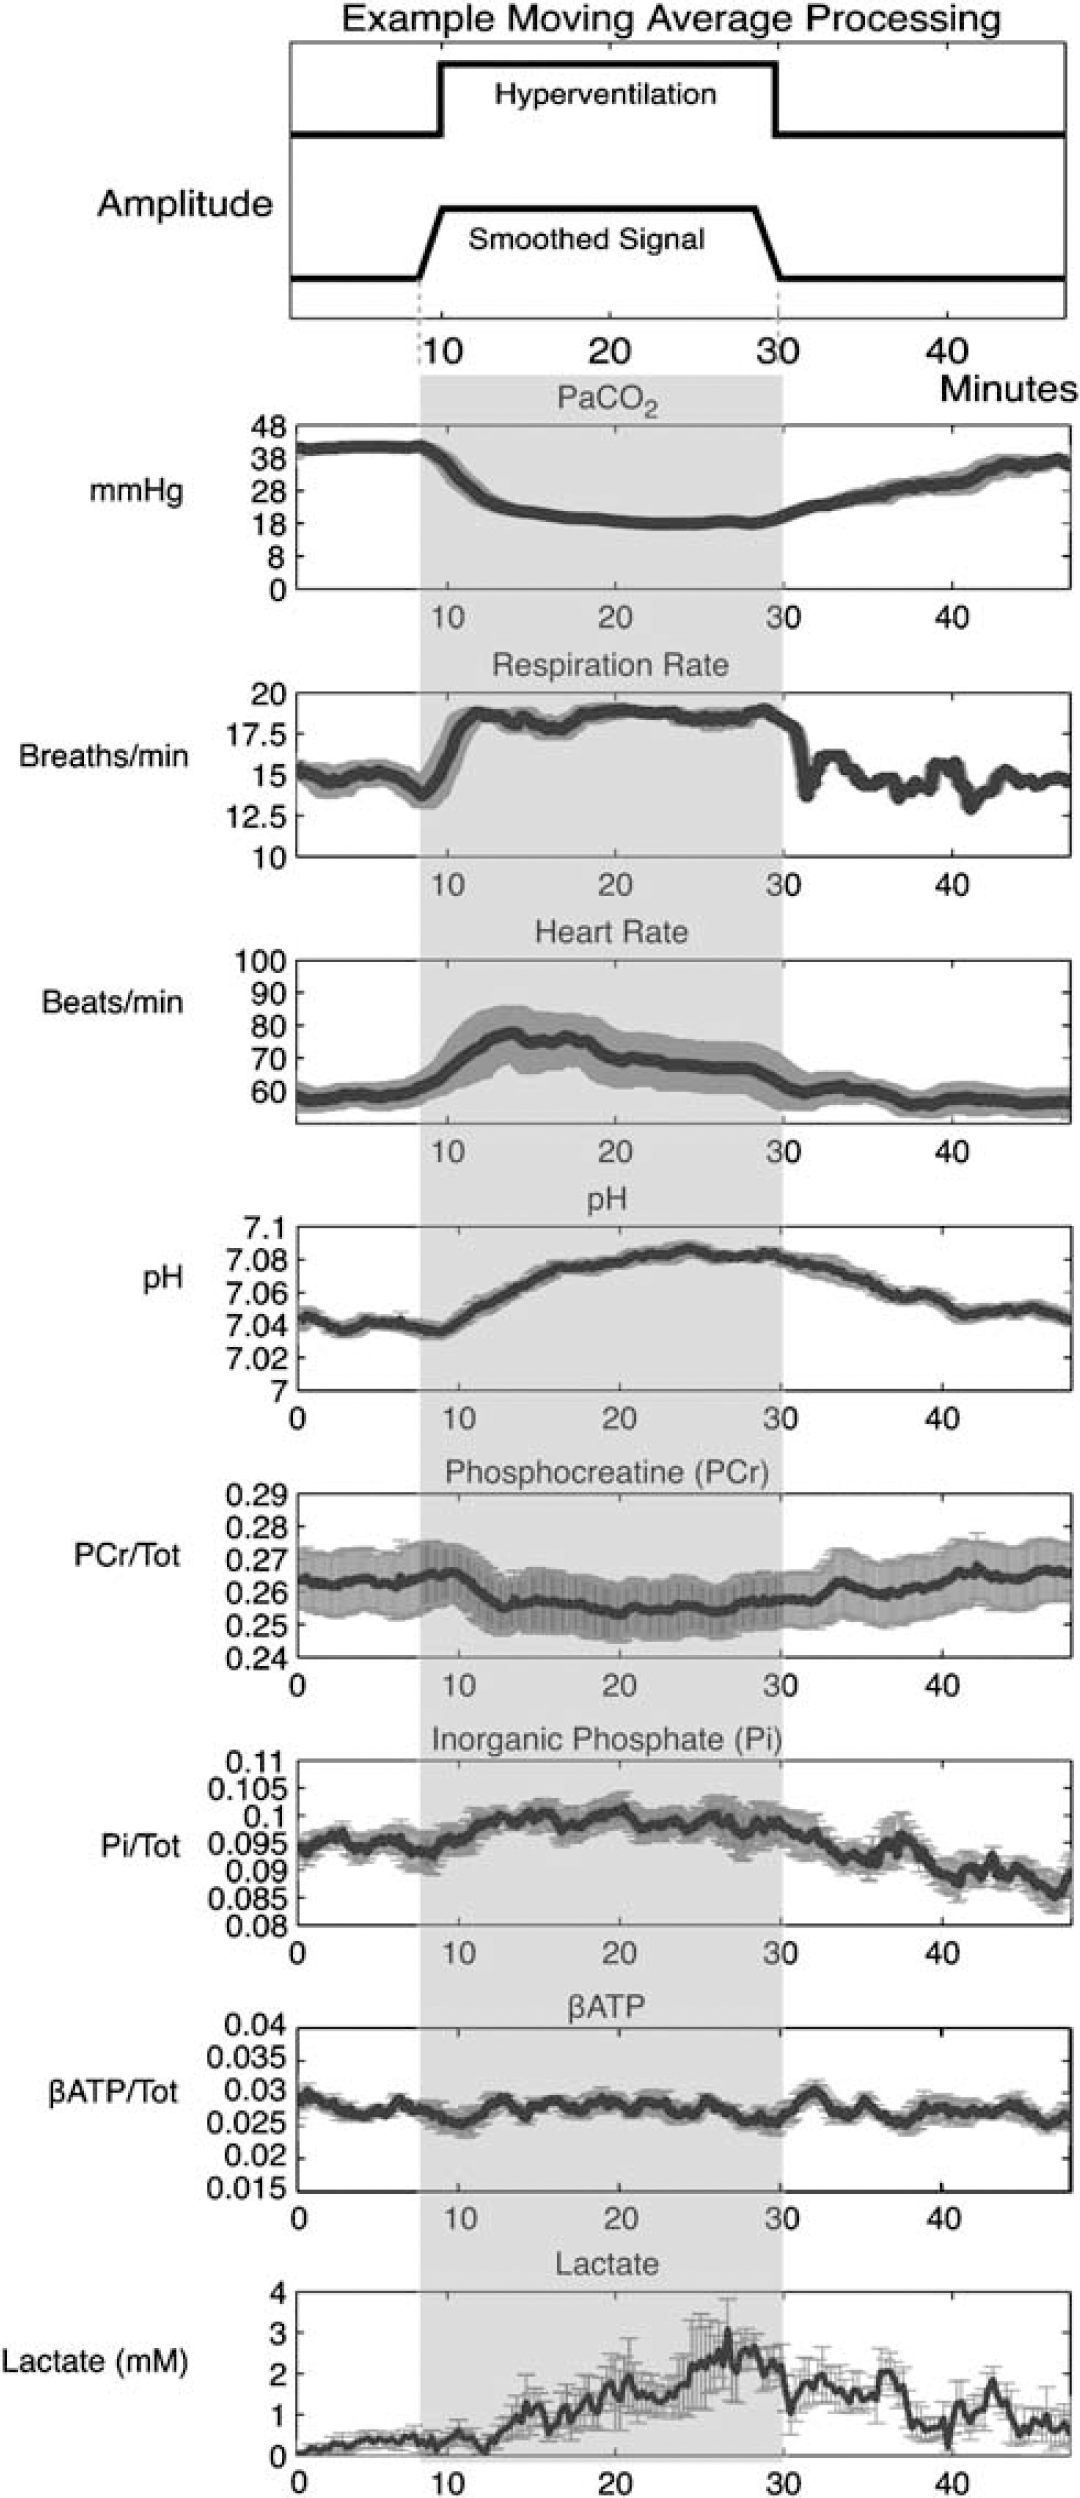
Summary of the five subjects (mean±s.e.) data are shown. A demonstration of the moving average filter smoothing signal intensity is shown at top. Phosphorus metabolites were expressed as a ratio to the total 31P signal. Lactate was referenced to internal brain water. During the hyperventilation (HV) protocol, a progressive reduction in PaCO2 was shown, reaching a maximum at 16 mins after initiating HV. The Respiration rate had a similar time course, whereas heart rate showed an early spike at 4 mins. For pH, a progressive but small increased was observed (+0.047 U) reaching a maximum 2 mins earlier than PaCO2 changes (14 mins). Lactate increased across the HV period reaching a maximum at 15 mins. Both PCr decreases (−3.4%) and Pi increases (+6.4%) were observed using this rapid acquisition approach and 4 T field strength, reaching the inflection point of change at 10 mins. No evidence for β-ATP decreases was observed. In the recovery period, PCr, and lactate had returned to baseline levels, whereas pH and PaCO2 had not yet fully normalized. By contrast, a Pi undershoot of control levels by 7.5% was present at the end of the recovery phase, suggesting a reliance on this pathway for ATP synthesis.
Hyperventilation change: During HV, the maximal change was computed from a 2-mins interval centered on the group inflection point. The inflection point was used to characterize the time point of maximal change for each variable (minutes). The a priori expected directions of change were as follows: HR-increase, RR-increase, PaCO2-decrease, pH-increase, PCr-decrease, Pi-increase, β-ATP-decrease, and lactate-increase.
Posthyperventilation recovery: To evaluate whether physiologic measures returned to baseline by the end of the recovery period, the mean and s.d. from the last 2 mins of the recovery phase were computed.
Statistical handling: To evaluate the significance of measured changes during HV and at the end of the recovery period, 99% confidence intervals were computed from baseline mean and s.d. measurements. These confidence intervals corrected for multiple comparisons by dividing the criterion value (α=0.05) by the physiologic measures (N=8) to yield a two-tailed interval (Bonferonni α=0.05/8=0.00625, corresponding to a confidence interval of ±99.375%). For HV and recovery measures, values exceeding these confidence intervals were reported as statistically significant.
Results
One subject had broad line-width data for both 31P and 1H MRS and was excluded from analyses. An additional subject had artifactual HR data; these data were omitted. Summary plots for each physiologic measurement are shown in Figure 3 (mean±s.e.). Descriptive statistics from the baseline period (minutes 6 to 8), 99% confidence intervals, the maximum change during HV (2 mins span surrounding inflection point), the time point of inflection, and the last 2 mins of the recovery period is shown in Table 1.
Descriptive means and s.d. at baseline (minutes 6 to 8), the 2 mins surrounding the maximum change during hyperventilation (HV), and the last 2 mins of the recovery period
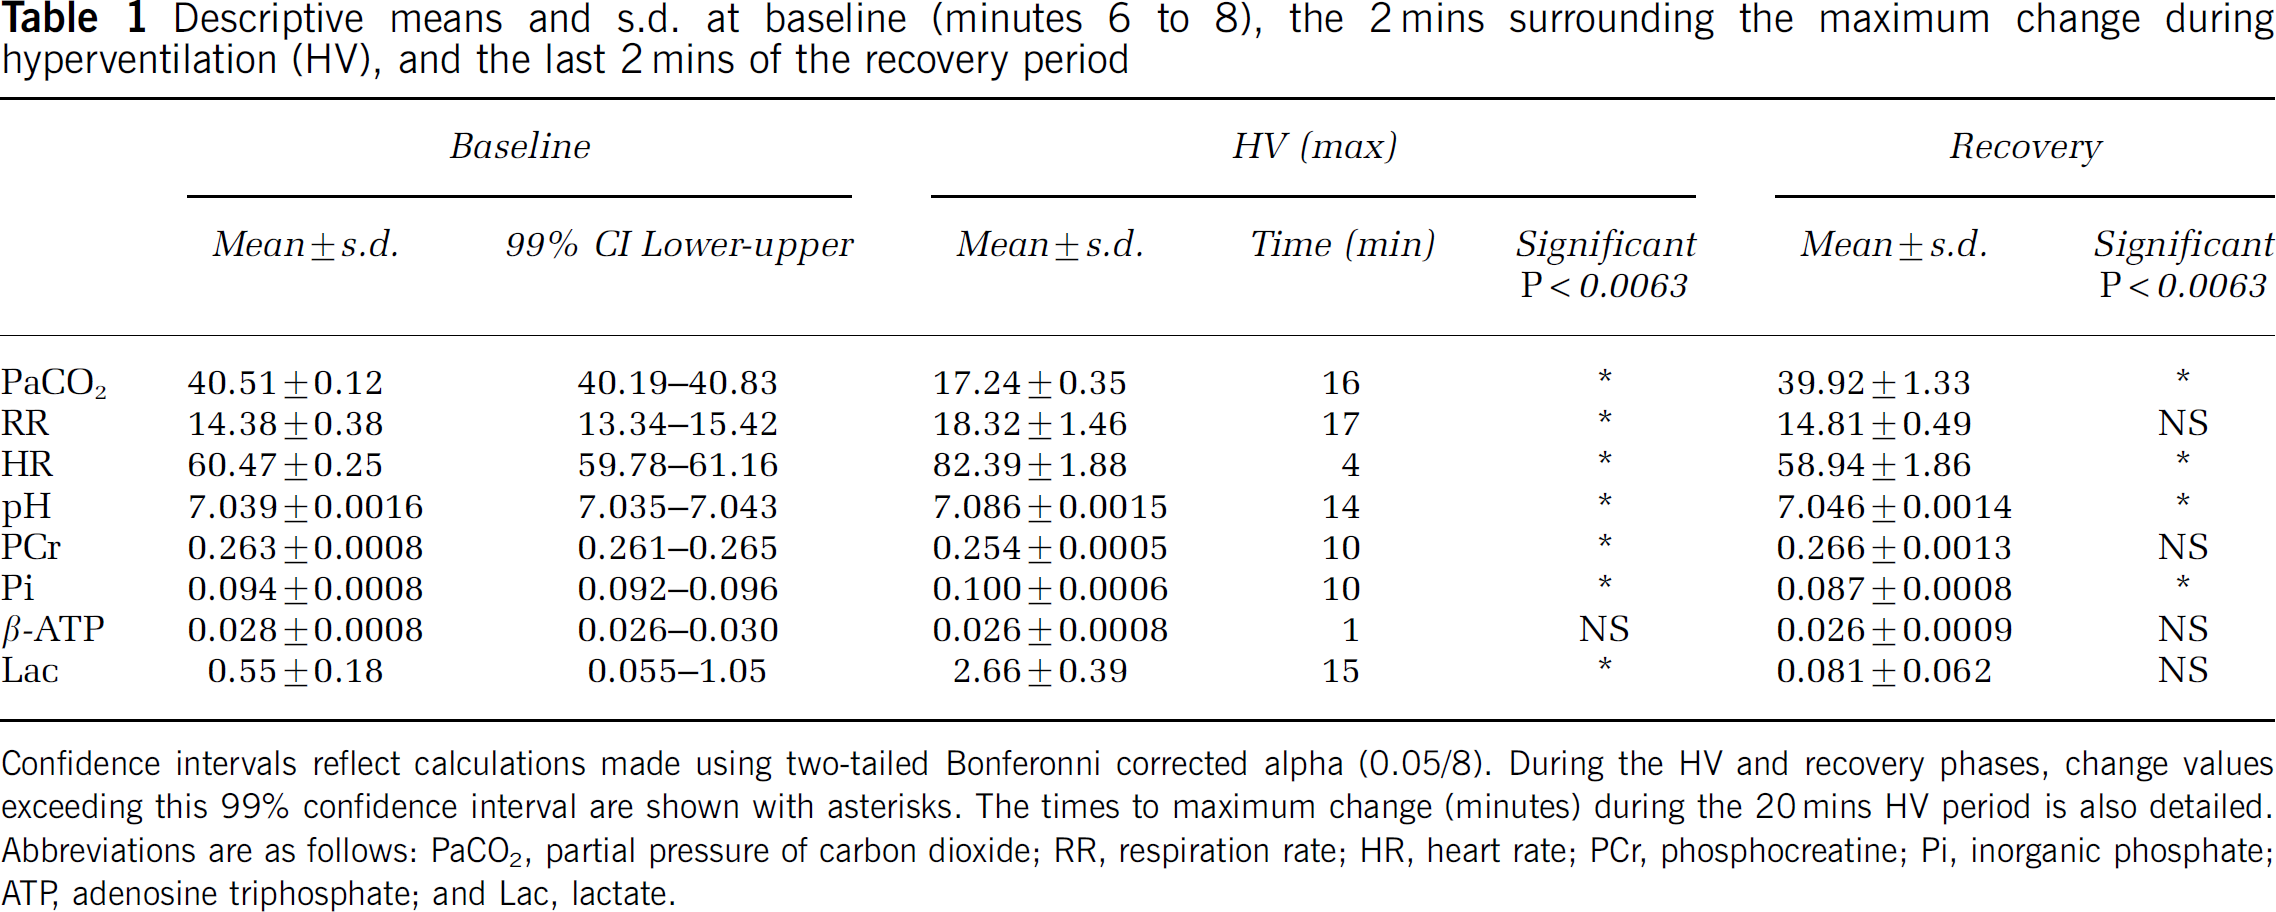
Confidence intervals reflect calculations made using two-tailed Bonferonni corrected alpha (0.05/8). During the HV and recovery phases, change values exceeding this 99% confidence interval are shown with asterisks. The times to maximum change (minutes) during the 20 mins HV period is also detailed. Abbreviations are as follows: PaCO2, partial pressure of carbon dioxide; RR, respiration rate; HR, heart rate; PCr, phosphocreatine; Pi, inorganic phosphate; ATP, adenosine triphosphate; and Lac, lactate.
Hyperventilation Changes
During the HV period, PaCO2 reached a significant minimum (17.24 mm Hg) at 16 mins. A similar time-course was shown for the linked measure of RR (17 mins), having a significant maxima of 18.32 BPM, demonstrating subject adherence to the tone-based protocol for guiding breath rate. In contrast to these changes, HR demonstrated a significant maximum 4 mins after initiating HV.
For pH, a progressive increase was observed during HV, with a significant maximum (+0.047 U) measured at the 14 mins time point. PCr demonstrated a significant small decrease (−3.4%) reaching maximum change at the 10 mins time point. The initial drop in PCr was related in time to the HR spike. A progressive increase in Pi was also observed reaching maximum change (+6.4%) at 10 mins after initiating HV. For β-ATP, a minimum was found in the first minute of HV, however, this change did not exceed the lower confidence interval bound. A significant maximal increase in lactate was shown at 15 mins, a 382% change from the baseline signal.
Recovery Response
By the last 2 mins of the recovery period, PaCO2 had not yet recovered to baseline levels, whereas RR had normalized. By contrast, HR was decreased below baseline levels.
Similar to PaCO2, pH remained significantly elevated at the end of the recovery period, whereas PCr and lactate were no longer statistically different from baseline. By contrast, Pi had decreased significantly below baseline levels in the recovery period (−7.5%).
Discussion
A characteristic pattern of biologic changes to HV can be measured with high sensitivity and temporal resolution at 4 T. While PaCO2 reached a minimum after 16 mins of HV, maximum pH change was observed 2 mins earlier. The magnitude of pH changes (+0.047) was lower than mean values previously reported at 1.5 T (Friedman et al, 2006; Jensen et al, 1988; van Rijen et al, 1989). We believe this lower magnitude of change is accurate. The higher signal-to-noise at 4 T combined with frequency correction of each spectrum before moving average addition reduces error in shift estimation, the basis for pH measurement. Although gray and white matter was not differentiated in our MRS slab, pH values do not differ significantly by tissue type (Barker et al, 1999). It remains unknown whether the two compartments have an equivalent pH change to HV. At the least, in a large volume of brain, cellular buffering processes limit pH from continuing to climb after 14 mins of sustained HV.
Although unlikely a direct buffer because its activity lies outside the intracellular pH range, lactate increased over a similar time-course (15 mins) consistently with past work (Dager et al, 1995; van Rijen et al, 1989). Obtaining an accurate measure of change for lactate is complicated by the low signal-to-noise ratio of lactate at baseline. For example, if a baseline estimate of 1 mmol/L were used (Frahm et al, 1989), the first appearance of lactate would not occur until several minutes after initiating HV, and the maximal increase would only be 166% (as compared with 382% estimated using the measured baseline value of 0.55 mmol/L). Future work using phased array coils to ensure signal measurement of lactate at baseline will be necessary to obtain a more accurate estimate of percentage change.
For the primary focus of this study, robust but small PCr (−3.4%) reductions were demonstrated using rapid MRS acquisition from large sample volumes at 4 T. The initial decrease in PCr had a rapid time-course, suggesting that brain PCr may parallel phosphate utilization of the heart during tachycardia (Pluim et al, 1998). The maximum response for Pi (+6.4%) also occurred at the same time point as PCr (10 mins), although a fast component corresponding to the HR change was not indicated. No significant changes in β-ATP were observed during the HV period. Taken together, these pH and energetic changes observed during HV are, as suggested by others, indicative of increased metabolic flux toward glycolysis, without evidence for substantial energy compromise or failure (Albrecht et al, 1987; Diringer et al, 2002; Kogure et al, 1975; Young and Yagel, 1984).
At the end of the recovery period, both PaCO2 and pH had not yet reached baseline values, with a longer recovery period likely necessary to observe this return. Despite having the maximum response at 10 mins, PCr had returned to baseline levels by the end of the recovery period. In contrast, Pi had significantly decreased below baseline levels by 7.5%. This may indicate a reliance on Pi as a phosphate donor for ATP synthesis during recovery. Measuring enzyme kinetics in future studies, for example creatine kinase (Chen et al, 1997), will help to more completely describe these changes (Iotti et al, 2005).
If the magnitude and time-course of pH and PCr changes found in the current study are correct, then additional factors must be contributing to the exaggerated metabolic findings reported in animal work (Fritz et al, 2001, 2004). Animal age (newborn piglets used in animal studies versus adult humans) is an unlikely factor underling these differences in metabolic result severity. This point is supported by the similarity in cerebral buffering capacity, measured as the change in brain pH to the buffer base during ischemia, across the piglet age range (Corbett et al, 1992). Further, when comparing newborn and 1-month old piglets response to hypoxia (18 mins), an equivalent magnitude of PCr decrease (63%) is observed, suggesting that the energetic systems are similarly vulnerable to such an insult (Corbett et al, 1996). For some challenges, such as hypercarbia, younger age may be an advantage (Corbett et al, 1995), owing to newborn piglets having an enhanced resiliency for acid clearance (Corbett et al, 1999).
One of the most likely factors contributing to these exaggerated metabolic results are the experimental use of anesthesia, which alters the natural response of the vasculature (Alexander et al, 1964). As cerebral blood flow (CBF) decreases over time during anesthesia (Raichle et al, 1970), this could effectively compound the CBF decrease induced by HV. Consistent with this point, HV-induced CBF decreases measured in awake male (34% (Raichle et al, 1970)) and nonanesthetized goats (38% (Albrecht et al, 1987)) are much less than that measured in anesthetized dogs (60%, (Raichle et al, 1970)). This point is supported by a recent study which used a 1 h anesthesia baseline before a HV challenge (20 to 30 mm Hg) in pigs (Clausen et al, 2004). Results demonstrated severe CBF decreases (∼55%) in two of nine animals during the first 30 mins HV period, to 30 mm Hg, and three of nine animals (∼75%) during the second 30 mins HV period (to 20 mm Hg), reaching the conclusion that HV cannot be considered safe. As sufentanil, which has dose related vasoactive properties (Hanel et al, 1997), was used in that study, it is very likely that CBF decreases had occurred before HV-initiation, leading to the observed highly variable CBF effects. As the other described animal studies (Fritz et al, 2001, 2004) also used a 1 h anesthesia (halothane 0.8%) baseline before HV, the possibility of such a confounding factor exaggerating CBF seems likely. Although control groups (anesthesia baseline plus normocapnia) were included for comparison (Fritz et al, 2001, 2004), a third control group, brain measures from animals that have had no anesthesia, would be necessary to interrogate this factor.
Another important point to consider when evaluating the metabolic effects of HV on the brain is the compartment of measurement. While 31P MRS provides a sensitive measure of the intracellular environment, techniques such as microdialysis measure the extracellular environment. Other approaches, such as histologic assays (Fritz et al, 2001, 2004), measure both compartments combined, plus additional pH sources (e.g., blood). As these compartments have different baselines and normalize at different rates during sustained HV (Arieff et al, 1976), it may not be possible to directly infer the intracellular compartment from an extracellular measure. As the most striking demonstration of this, acetazolamide, which dramatically acidifies the extracellular space, does not alter intracellular pH as measured by MRS (Vorstrup et al, 1989). If the common aim of these studies were to understand whether HV causes metabolic compromise, we would argue that the intracellular compartment is the most appropriate. On a related point, although cell studies provide exquisite control for examining isolated physiology (Xie et al, 2004), the compensatory response to hypocapnia cannot be approximated without the functional coupling between astrocytes and neurons. Future work investigating brain slices or in vitro preparations containing these coupled units would ensure generalizability to the in vivo system.
Characterizing whether HV has beneficial, marginal, or deleterious effect remains very important. Much of the fuel for the deleterious argument comes from indirect clinical evidence of poorer outcomes across numerous populations (as reviewed by Laffey and Kavanagh (2002)). While this evidence is compelling, it is not causal. Causality is inferred by equating HV with anoxia, which does not seem to occur in human subjects (Diringer et al, 2002). In that study, the cerebral metabolic rate of oxygen, as measured by the gold-standard of PET imaging, was unchanged during HV, supporting the conclusion that tissue metabolic needs are being fully met despite CBF reduction. A similar conclusion was reached in a recent study investigating HV-effects in rats having undergone subarachnoid hemorrhage (Ma et al, 2006). Despite reductions in CBF (20% to 35%), cerebral metabolic rates were maintained during HV (22 to 27 mm Hg) by increasing cerebral oxygen extraction (Ma et al, 2006). Nonetheless, physiologic measures continue to be used to support the potential deleterious consequences of HV, with the noted problem that they fail to add quantitative information to the scientific discussion (Cruz, 2002).
In summary, although animal work using various anesthesia protocols concluded that HV alone has severe metabolic consequences, the magnitude of high-energy phosphate changes to HV within the intact and awake human brain does not support this notion. Temporal differences in the metabolite maxima also support that the human brain adaptively responds to HV; a larger sample will be helpful to more precisely define these metabolite time points. As HV is often performed clinically under anesthesia, a critical consideration for future studies is to establish whether specific anesthetic agents or dose ranges deregulate the intact HV response.