
Abstract
The cerebrovascular coupling under neuronal nitric oxide synthase (nNOS) inhibition was investigated in α-chloralose anesthetized rats. Cerebral blood flow (CBF), cerebral blood volume (CBV), and blood oxygenation level dependent (BOLD) responses to electrical stimulation of the forepaw were measured before and after an intraperitoneal bolus of 7-nitroindazole (7-NI), an in vivo inhibitor of the neuronal isoform of nitric oxide synthase. Neuronal activity was measured by recording somatosensory-evoked potentials (SEPs) via intracranial electrodes. 7-Nitroindazole produced a significant attenuation of the activation-elicited CBF (P < 10−6), CBV (P < 10−6), and BOLD responses (P < 10−6), without affecting the baseline perfusion level. The average ΔCBF was nulled, while ΔBOLD and ΔCBV decreased to ~30% of their respective amplitudes before 7-NI administration. The average SEP amplitude decreased (P < 10−5) to ~60% of its pretreatment value. These data describe a pharmacologically induced uncoupling between neuronal and hemodynamic responses to functional activation, and provide further support for the critical role of neuronally produced NO in the cerebrovascular coupling.
Introduction
Modern functional neuroimaging methods, such as positron emission tomography (PET) and functional magnetic resonance imaging (fMRI), rely on the coupling of neuronal activity to focal metabolic supply and hemodynamics. A detailed understanding of the signaling mechanism linking local neuronal activity to vascular state is thus necessary for proper interpretation of the surrogate signals obtained via these techniques (Attwell and Iadecola, 2002). While a wide range of vasodilators has been implicated in the neurovascular coupling (Lauritzen, 2005), nitric oxide (NO) has been frequently suggested as the most prominent signaling molecule in this process (Iadecola, 1993).
Nitric oxide is a ubiquitous gas with a myriad of physiologic and pathologic functions—here, most notably, that of a potent cerebral vasorelaxant (Marshall et al, 1988). It is short-lived, with a half-life of 5 to 15 secs (Lancaster Jr, 1996). Because of its solubility in both aqueous and lipid media, it readily diffuses through the cytoplasm and across plasma membranes, covering, under physiologic conditions, a distance of 150 to 300 μm over 4 to 15 secs (Lancaster Jr, 1996). Nitric oxide is synthesized endogenously by nitric oxide synthase (NOS), an enzyme that catalyzes the conversion of
Previous studies in anesthetized rodent models reported significant, yet varying degrees of attenuation (by 30% to 90%) of the CBF response to somatosensory stimulation after NO inhibition (Northington et al, 1992; Dirnagl et al, 1993; Irikura et al, 1994; Bonvento et al, 2000; Lindauer et al, 1996, 1999; Ngai et al, 1995; Cholet et al, 1997; Ma et al, 1996). The wide range of attenuation reported likely resulted from differences in the pharmacological paradigms employed and the relative degrees of neuronal versus endothelial NOS inhibition achieved in addition to varying sensitivities of the different techniques for CBF estimation. At the same time, the effect of NOS inhibition on neuronal activity and thus neurovascular coupling remains unclear: some studies reported no concomitant changes in cerebral glucose metabolism (Cholet et al, 1997) or somatosensory evoked potentials (Lindauer et al, 1996), while others observed a 40% to 60% decrease in somatosensory-evoked potential (SEP) amplitudes after NOS inhibition (Ngai et al, 1995).
In the present work, we set out to investigate the effect of the inhibition of neuronally derived NO on the spatial and temporal profiles of hemodynamic and neuronal responses to functional brain stimulation. Cerebral blood flow, volume (CBV), blood-oxygenation level dependent (BOLD) signal, and SEP to forepaw stimulation were recorded in α-chloralose anesthetized rats via MRI and epidural EEG before and after administration of a bolus of 7-nitroindazole (7-NI), a potent in vivo inhibitor of neuronal nitric oxide synthase (nNOS) (Bush and Pollack, 2000).
Methods
Animal Preparation
The experiments were conducted on 16 male adult Sprague—Dawley rats, weighing 245 ± 10 g. Five rats participated in the BOLD/CBF fMRI experiments; another five rats in CBV fMRI studies; and the remaining six in the benchtop electrophysiology recordings. The experimental protocol was approved by the Animal Care and Use Committee of the National Institutes of Health. The experimental procedures have been described in detail earlier (Silva et al, 1999, 2000; Silva and Koretsky, 2002). Briefly, to decrease bronchial secretions and salivation during anesthesia, atropine sulfate was administered subcutaneously (0.54 mg/mL; 0.02 mL/kg) about 30 mins before surgery. During the surgical procedures, the animals were anesthetized with isoflurane (5% for initial induction and 2% for maintenance) in O2 enriched medical air, orally intubated, and mechanically ventilated for the remainder of the experiments. The right femoral artery and the right femoral veins were cannulated using PE-50 catheters for blood gas analysis and intravenous administration of anesthesia, respectively. Another PE-50 catheter was inserted in the intraperitoneal cavity for administration of 7-NI. After surgery, all wounds were treated with 2% lidocaine and closed. Rectal temperature was monitored via thermistor rectal probe and maintained at 37.0°C ± 1.0°C by means of a feedback-controlled warm water bath. Isoflurane was discontinued and anesthesia switched to α-chloralose (80 mg/kg in initial bolus, followed by a constant infusion of 26.7 mg/kg/h) for the remainder of the experiment. Respiratory parameters, including end-tidal CO2 levels, were monitored via a capnograph (BCI 300 Capnocheck, BCI, Inc., Waukesha, NI, USA). Tidal pressure of ventilation, arterial blood pressure, and heart rate were monitored and recorded via a BIOPAC MP system (Biopac Systems, Inc., Goleta, CA, USA) throughout the experiments. Data recorded when temperature, blood pressure, or heart rate were outside of the physiologic range were excluded from the analysis.
Forepaw Stimulation
Two needle electrodes were inserted under the skin of the left forepaw (in the space between digits 2 and 3, and 4 and 5). The functional paradigm comprised 45 epochs of 45 secs off/30 secs on/45 secs off blocks. Each 30-secs stimulation interval consisted of 90 0.3-ms, 2-mA pulses, played out at a frequency of 3 Hz (Silva et al, 1999).
Pharmacological Perturbation
No pharmacological agents were administered for the first 15 mins of the experiment to allow robust estimation of the physiologic hemodynamic and neuronal responses in each animal. Thereafter, a 7-NI bolus (50 mg/kg b.w. suspended in 1.5 mL/kg peanut oil) was administered intraperitoneally. This dosage was selected to produce pronounced (> 90%) but stable nNOS inhibition based on earlier 7-NI pharmacokinetic studies (Bush and Pollack, 2000; Montecot et al, 1998; Moore and Bland-Ward, 1996).
Functional Magnetic Resonance Imaging Experiments
The animals were positioned and strapped in a semi-cylindrical cradle, with the head secured in a home-built head holder. All CBF images were acquired using a 7T Bruker BioSpec/AVANCE system (Bruker Biospin, Ettlingen, Germany), equipped with a 11.6 cm gradient set capable of generating 36 G/cm within 120 μs rise time. A 72-mm birdcage body coil was used for transmission and actively decoupled from a home-built 1.6-cm diameter receive-only surface coil, placed just above the bregma. Continuous arterial spin labeling (CASL) was achieved by applying a 2.253 secs RF pulse (0.63 W) in the presence of a 10 mT/m longitudinal gradient, 2 cm proximal to isocenter (Zhang et al, 1992; Silva et al, 1997a). The postlabeling delay was set to 200 ms (Alsop and Detre, 1996). The sign of the labeling offset frequency (–8515.44 Hz) was reversed in the control images.
The CBV studies were performed in an upgraded 7T Bruker BioSpec/AV system (Bruker Biospin, Ettlingen, Germany), having a 15 cm gradient set (Resonance Research, Billerica, MA, USA) capable of generating 30 G/cm within 150 μs rise time. A 120-mm birdcage body coil was used for transmission and a quadrature receive-only coil (Rapid Biomedical, Rimpar, Germany) for reception. To enable the estimation of CBV changes, an intravenous bolus (20 mg/kg b.w.) of ferumoxtran-10, an iron oxide nanoparticle (Weissleder et al, 1990) was administered ~7 mins into the experiment.
The imaging slice was positioned coronally over the somatosensory cortex, about 0 to 1 mm rostral to bregma, based on tri-pilot spin-echo scout images. Single-average, single-shot gradient-echo echo-planar images were obtained from a 2-mm-thick coronal plane, with a 2.56 × 1.28 cm2 field-of-view and a 128 × 64 matrix, corresponding to nominal in-plane resolution of 200 × 200 μm2 with TR/TE set to 2500/25 ms for BOLD/CBF, and 500/15 ms for CBV acquisitions. Local shimming was performed manually on the chosen slice proton linewidth.
Functional Magnetic Resonance Imaging Data Analysis
In-plane motion correction of the CBF and CBV data sets was performed using AFNI's 2dImReg software (Cox and Hyde, 1997). Within each pharmacological condition, drift was removed by subtracting, from each voxel's time course, the low-frequency components of its discrete cosine transform. The cutoff frequency was one half of the stimulation paradigm frequency. Quantitative CBF images were formed by a weighted subtraction of control and labeled series (sinc-interpolated to mid-TR time instants), as described previously (Zhang et al, 1992; Silva et al, 1997b; Silva and Kim, 1999). Blood oxygenation level dependent responses were estimated from the control series, sinc-interpolated to mid-TR time instants, to ensure temporal alignment of BOLD and CBF estimates.
The stimulation-induced changes in CBV were calculated as described previously (Mandeville et al, 1998). Although the CBV signal did not reach steady-state during the 30-s stimulation period, as observed earlier (Mandeville et al, 1998), mean CBV changes (given by the average signal amplitude during the stimulus-on interval) were evaluated to keep the analysis consistent with that used for the CBF/BOLD data. The 80 secs after each stimulus-on period were excluded from the analysis to ensure a complete return of the CBV signal to baseline.
For both CBF and CBV data, the generalized linear model (Worsley et al, 2002) was used to identify areas of statistically significant task correlation at the omnibus significance level of 0.05 (after correction for multiple comparisons). A region of interest was defined by thresholding the t-map corresponding to the functional responses before 7-NI treatment (i.e., the initial 15 mins of the experimental session) in each animal. Two-way ANOVA was performed on the average data before and after the 7-NI bolus administration to test for statistically significant effect of 7-NI on the hemodynamic responses while controlling for inter-subject variability.
The generalized linear model (Worsley et al, 2002) was also used to identify areas of statistically significant pharmacological perturbation correlation of the baseline CBF data (i.e., CBF data recorded during stimulation off intervals) at the omnibus significance level of 0.05 (after correction for multiple comparisons). Notably, the drift was not removed from these data for the purpose of this analysis and hence no assumptions were made about the pharmacokinetics of 7-NI.
Electrophysiology Experiments
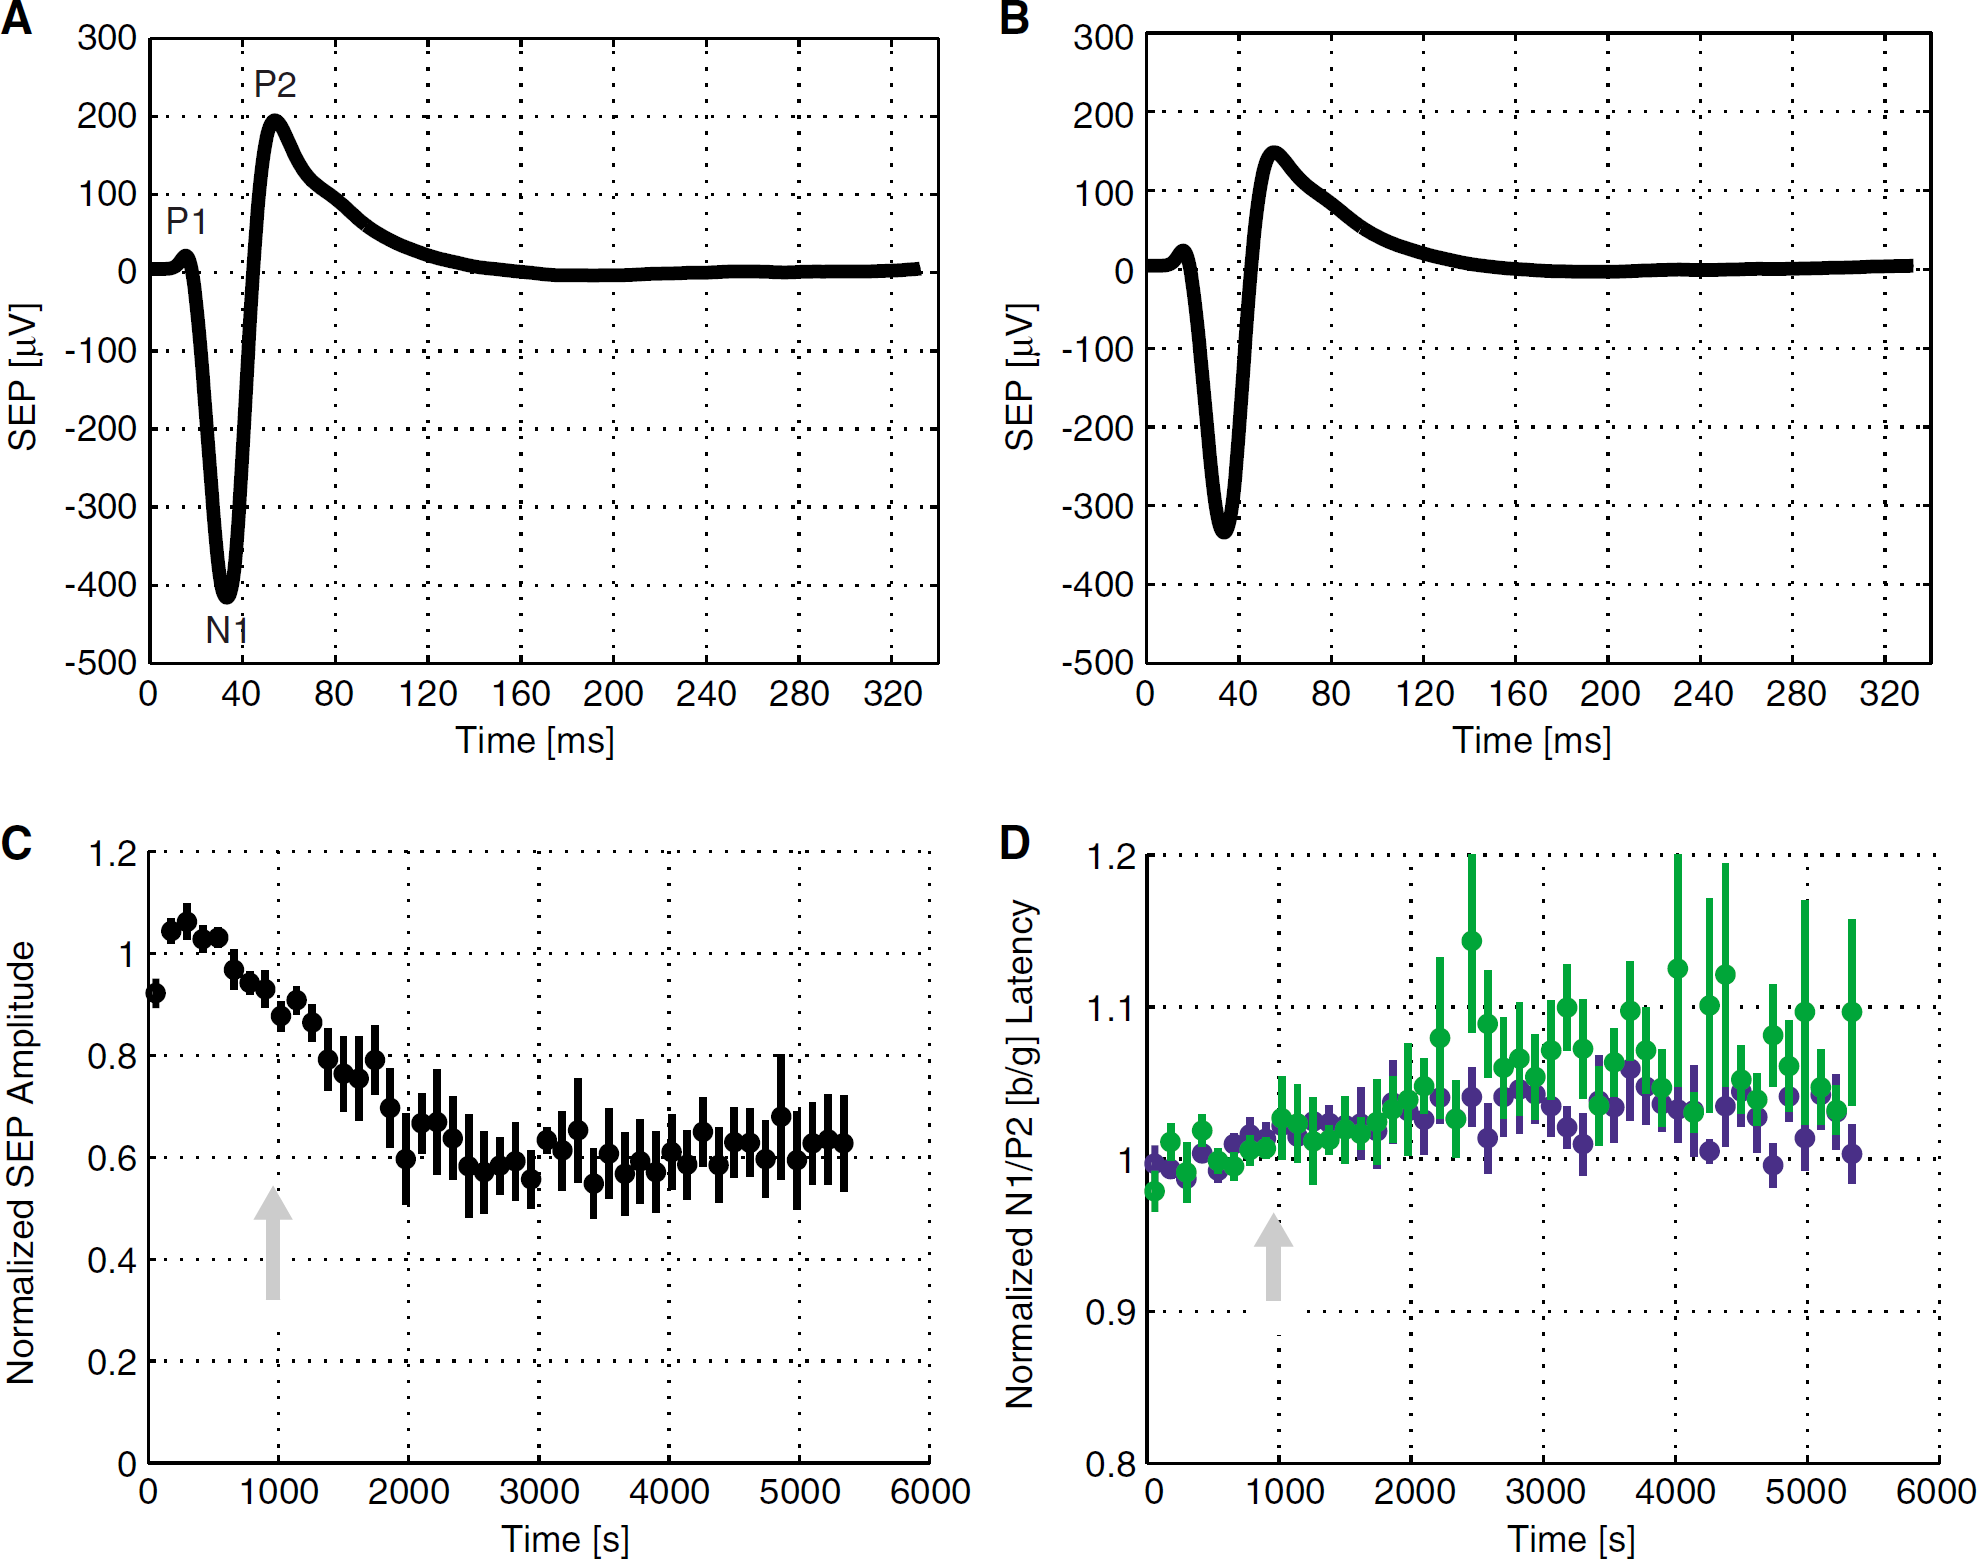
The animal heads were positioned in a stereotaxic frame (Stoelting Co., Model No. 51900, Wood Dale, IL, USA) and secured via earpieces, a bite bar, and a nose bar. To record the SEPs with maximal sensitivity and specificity but without compromising the cerebral vasculature, a modified intracranial recording technique was utilized (Ngai et al, 1998a). Three burr holes (0.3 mm diameter; 1 mm depth from the surface of the skull) were made over the left and right forelimb areas of the primary somatosensory cortices (S1FL, ± 3.5 mm lateral to bregma) and the midline of the cerebellum (reference electrode, ~10 mm posterior to bregma) with a hand-driven drill. Care was taken to avoid perforating the dura mater. A 100 μm diameter platinum electrode (with impedance of 1.1 MΩ at the sampling frequency of 2.5 kHz) was next inserted into each of these holes (tripolar recording electrode, Plastics 1, FL, USA). Finally, the burr holes and the body of the epidural electrodes were sealed with bone wax, cyanoacrylate gel and dental cement. Using a BIOPAC MP system (Biopac Systems, Inc., Goleta, CA, USA), the SEPs were amplified 20,000-fold, bandpass filtered between 0.5 and 500 Hz, digitized at a sampling rate of 2.5 kHz, and transferred to a computer.
Electrophysiology Data Analysis
Due to the high-frequency noise in the SEPs to individual 0.3-ms 2-mA pulses, the 333 ms of data after each pulse were averaged across each epoch before peak detection was performed. The amplitude and latency of the first three peaks (P1, N1, P2) were estimated for each epoch, and average SEP trace calculated for each pharmacological condition. Two-way ANOVA was performed on the average amplitude and latency data to test for statistically significant effect of 7-NI on the SEPs while controlling for inter-subject variability.
Results
Animal Physiology
The animals were maintained under normal physiologic conditions by careful and continuous monitoring and control of the ventilation parameters, rectal temperature, arterial blood pressure, heart rate, and arterial blood gases. Arterial blood gases were assessed periodically throughout the duration of the experiments, and did not vary as a result of the pharmacological manipulation. Across-subject average arterial blood pH was 7.4 ± 0.0; PaCO2, 38.9 ± 2.1 mm Hg, and PaO2, 124.7 ± 5.3 mm Hg. 7-Nitroindazole bolus administration did not produce a statistically significant change in the mean arterial blood pressure, heart rate or rectal temperature, in accordance with earlier reports (Cholet et al, 1996, 1997; Moore and Bland-Ward, 1996).
Functional Magnetic Resonance Imaging
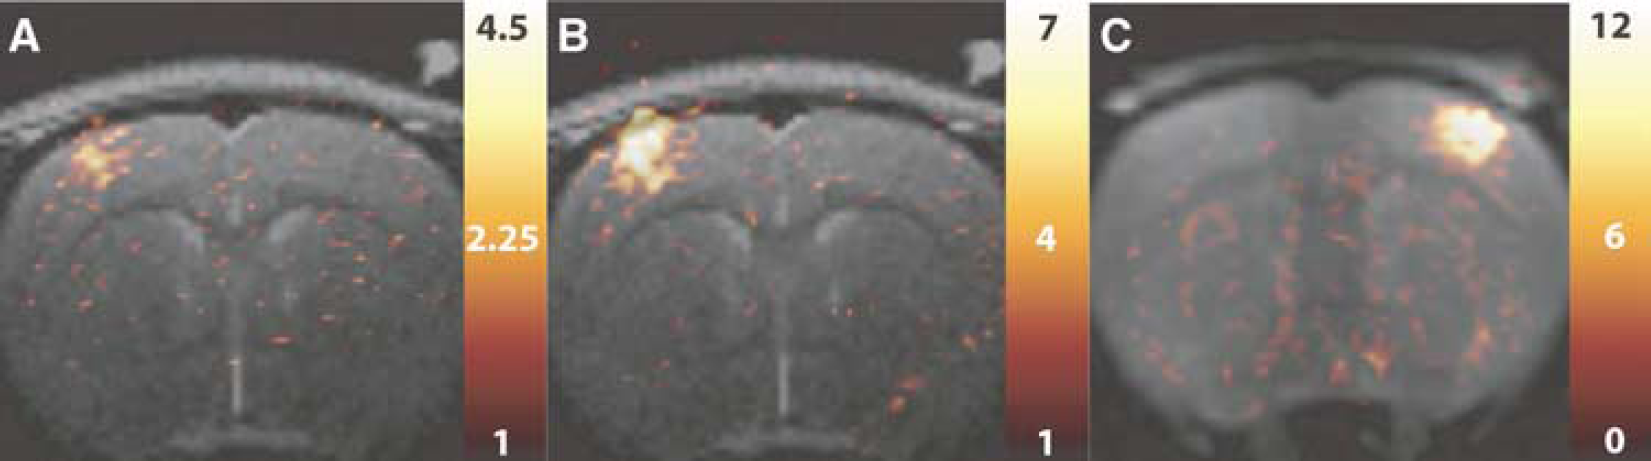
Electrical stimulation of the rat forepaw produced robust CBF, BOLD, and CBV responses before 7-NI administration. Figure 1 shows typical t-value maps corresponding to the CBF (Figure 1A), BOLD (Figure 1B), and CBV (Figure 1C) responses before 7-NI treatment. In agreement with earlier work (Silva et al, 1999, 2000; Silva and Koretsky, 2002; Keilholz et al, 2005), most of the activated pixels were in the forelimb area of primary somatosensory cortex. In each subject, the CBF and CBV t-value maps were thresholded (at P of 0.05 after correction for multiple comparisons) to define the ROIs used in the CBF/BOLD and CBV data analysis, respectively. The average (nominal) fMRI ROI volume was 3.8 ± 1.0 mm3.
(
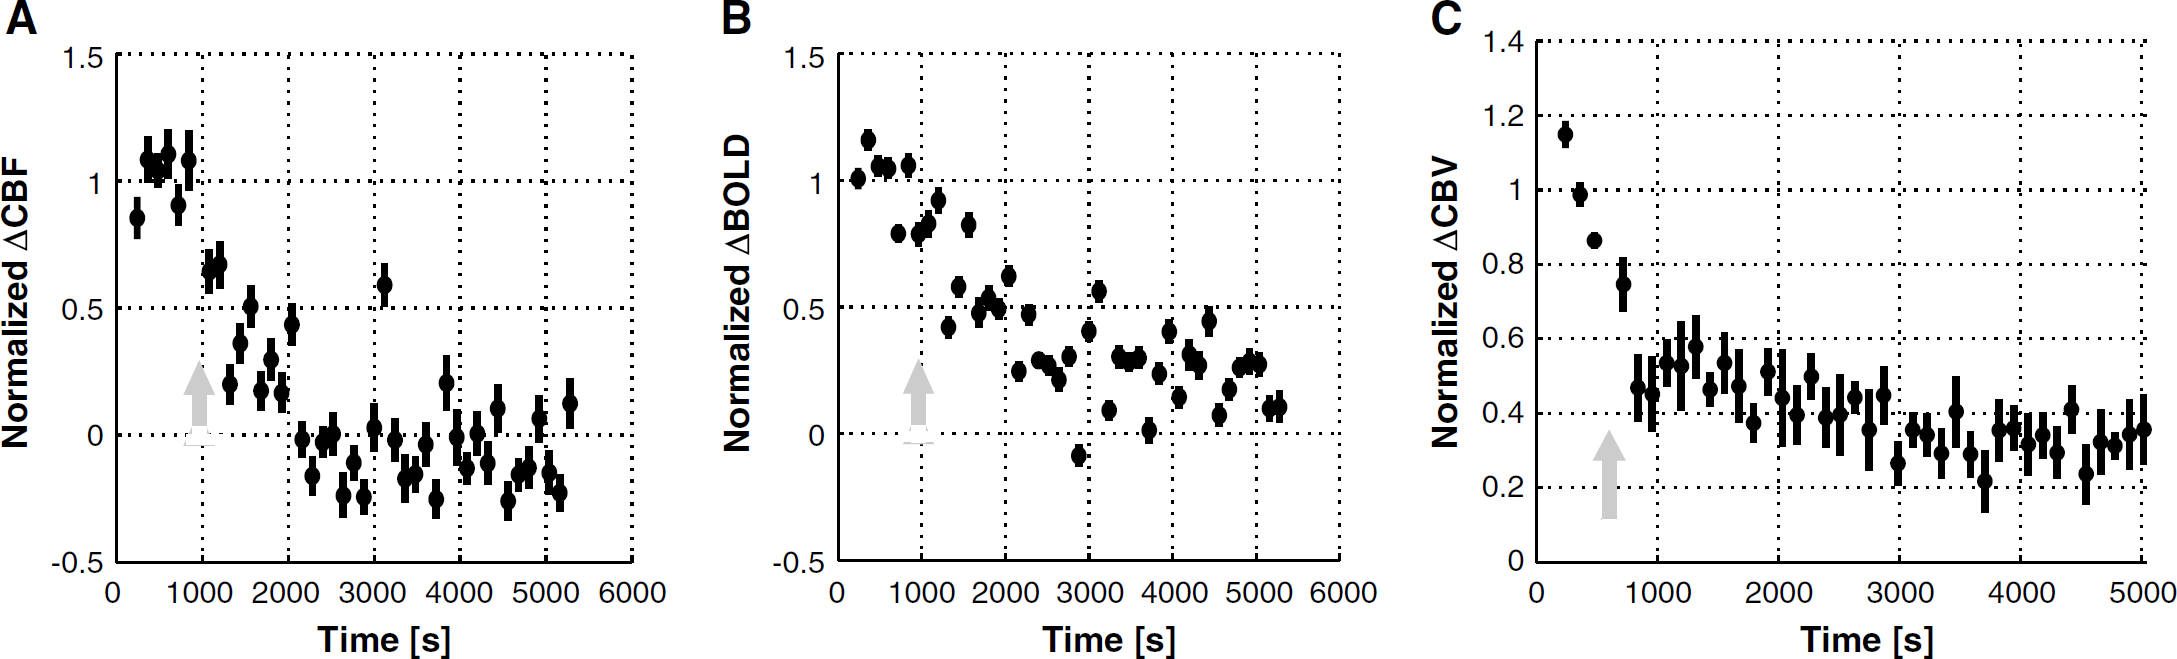
Administration of 7-NI caused a significant attenuation of the CBF, BOLD, and CBV responses to stimulation. In contrast, it did not produce a statistically significant effect on the resting perfusion. Moreover, at all times, the variation of the baseline perfusion was within the standard error of the CBF estimate (i.e., below 10%). Figure 2 displays percent change maps of the CBF response to forepaw stimulation, obtained before (Figure 2A) and after (Figure 2B) administration of 7-NI in the same subject as in Figures 1A and B. The corresponding time courses of the average CBF responses to functional stimulation before and after 7-NI treatment in this subject are shown in Figures 2C and D, respectively. As for the other animals in this study, the CBF response was nulled by the 7-NI treatment, with ΔCBF of this subject dropping from 67.7 ± 4.7% before treatment to −0.8 ± 1.7% after treatment. Note from Figure 2D that the CBF response to stimulation showed only minor transient changes that were not significantly different from the baseline variation in the CBF estimate.
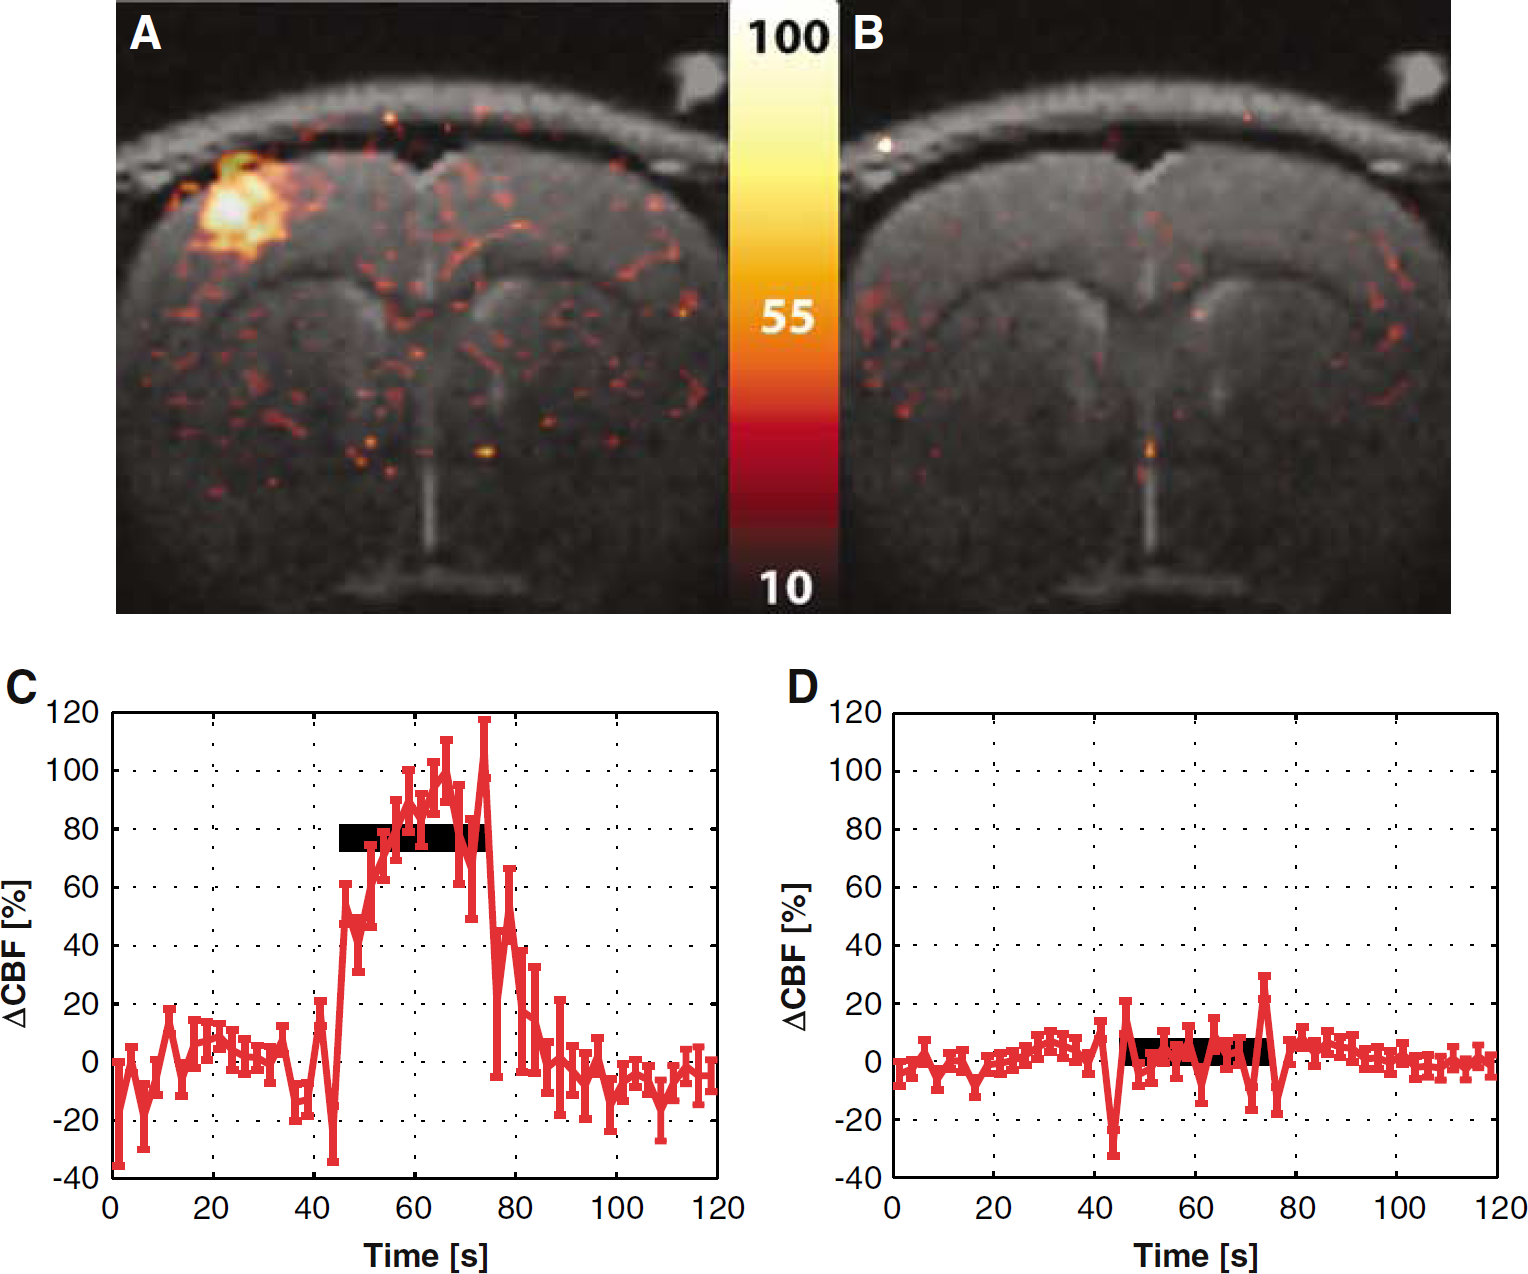
Percent difference map of the average CBF signal changes elicited by stimulation before the 7-NI administration (
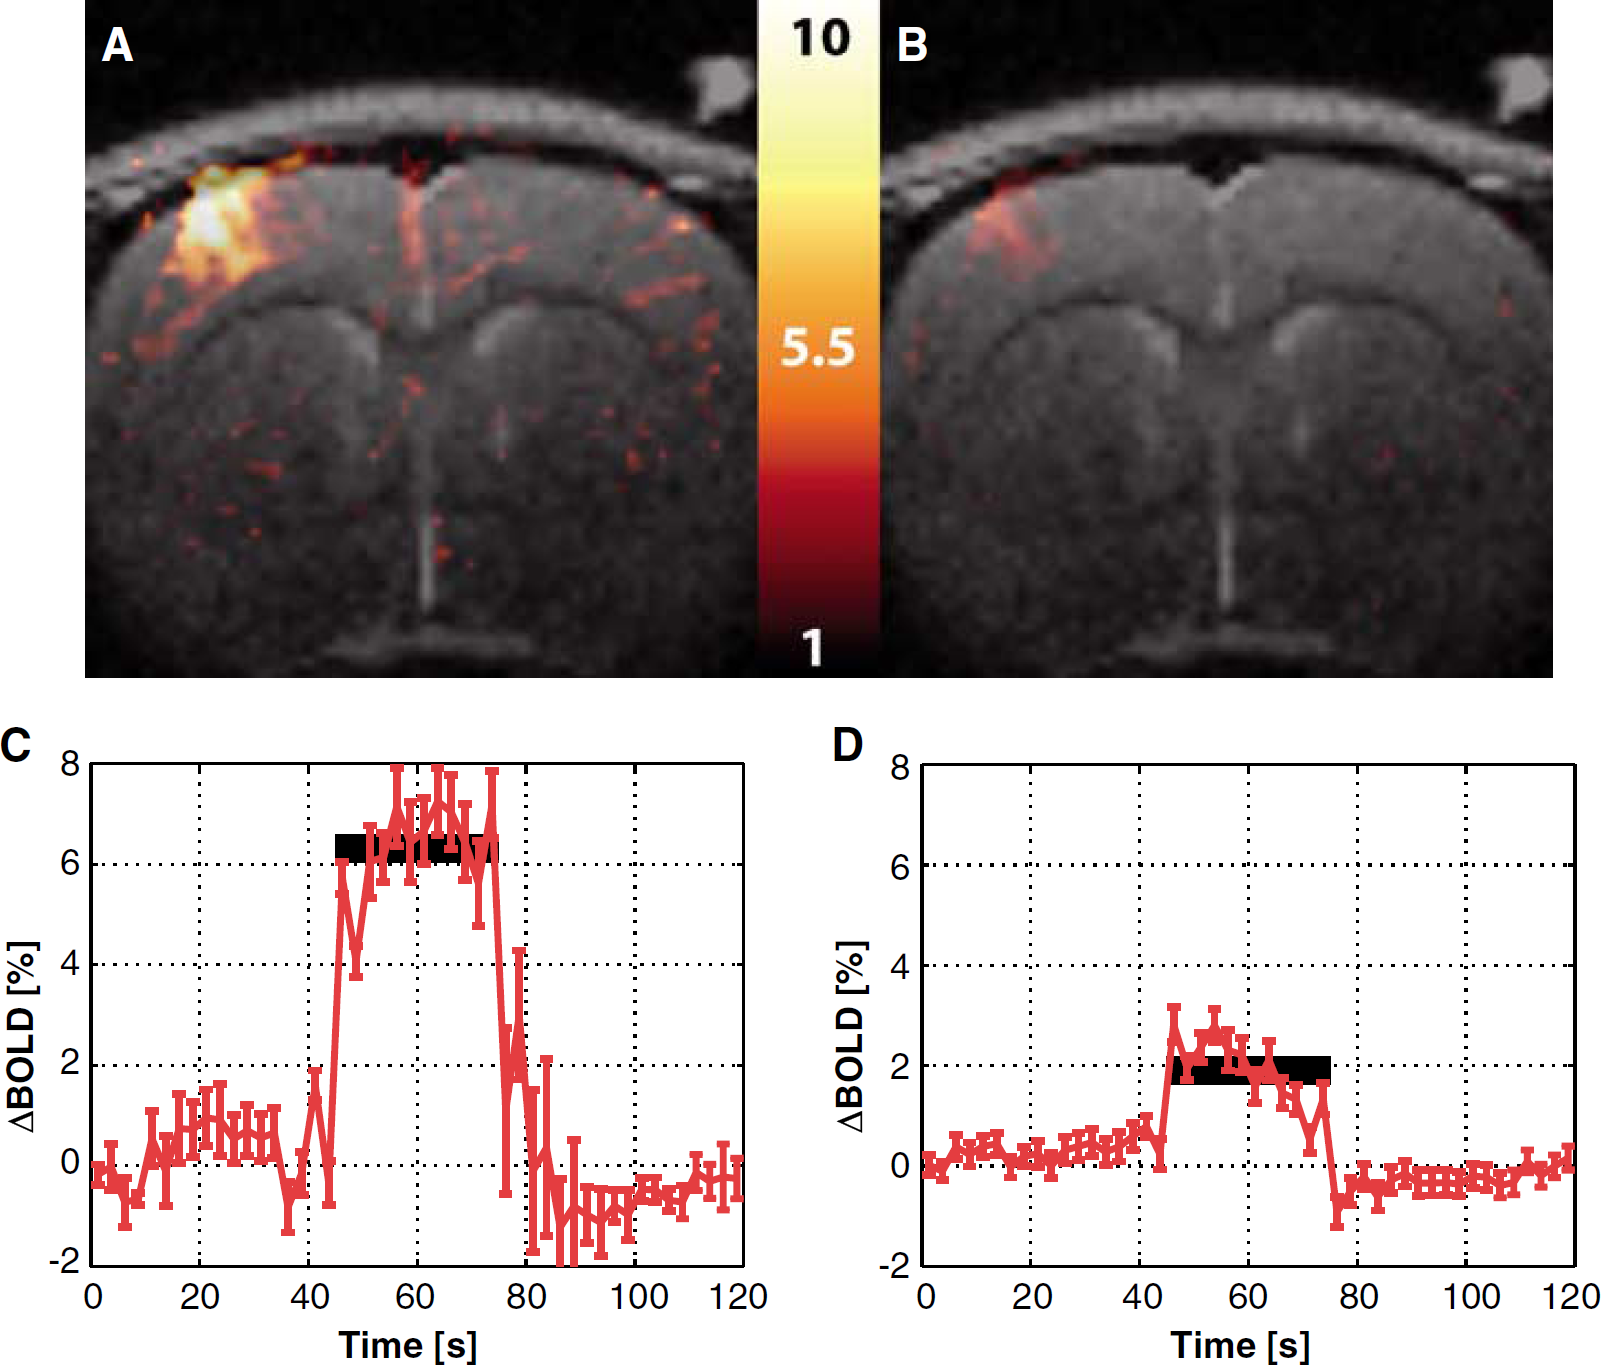
Figure 3 shows the corresponding maps for the BOLD response in the same subject of Figure 2. The BOLD signal change was significantly reduced by the 7-NI treatment, though not nulled (Figures 2A and B). The time courses of the BOLD response are shown in Figures 2C and D. The average BOLD percent signal changes dropped from 5.9% ± 0.2% before treatment to 1.9% ± 0.1% after treatment in this subject.
Percent difference map of the average BOLD signal changes elicited by stimulation before the 7-NI administration (
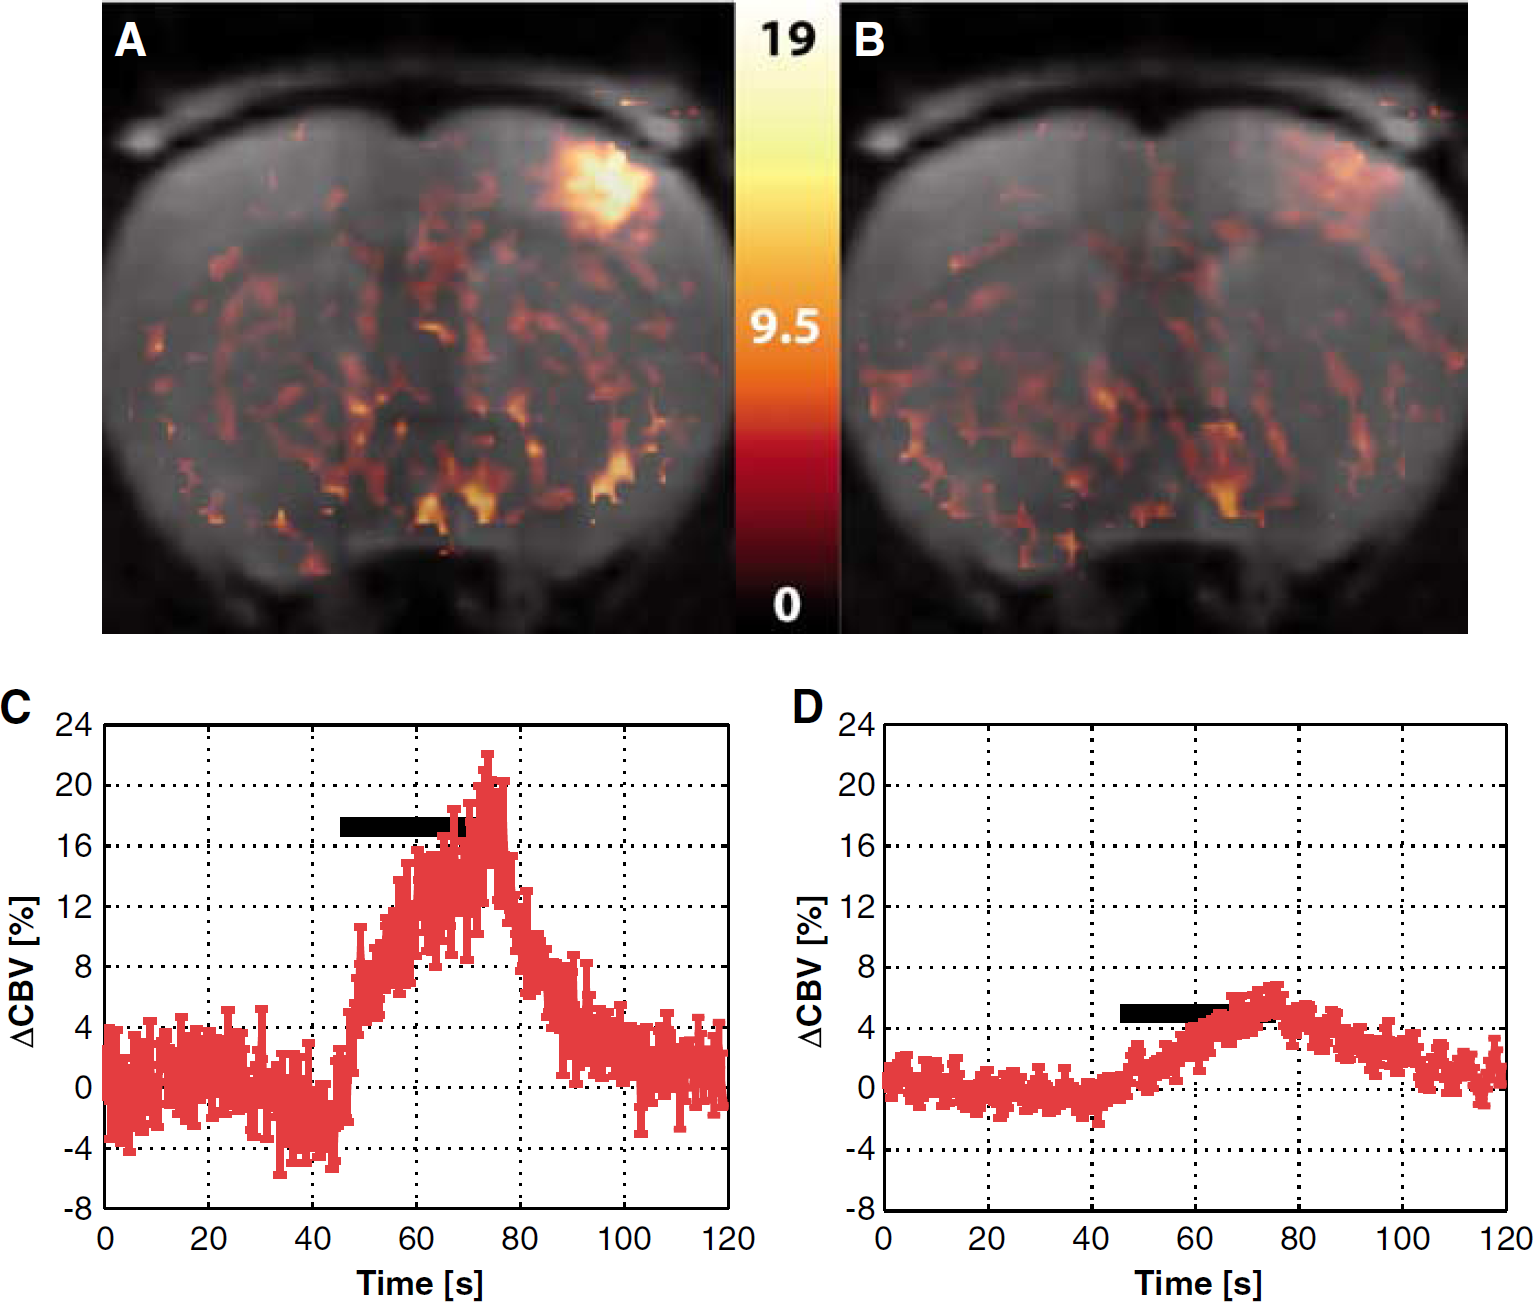
Figure 4 shows the equivalent maps for the CBV response in the animal of Figure 1C, which was stimulated at the left forepaw. Figures 4C and D show the time courses of the average CBV responses before and after 7-NI treatment, respectively. Attenuation of the CBV response by 7-NI was robust, but not complete. For this subject, the average CBV response dropped from 12.9% ± 1.1% before treatment to 4.1% ± 0.4% after treatment. In addition, there was a noticeable change in CBV dynamics after 7-NI. Before treatment, the CBV response was biphasic, with a rapid initial rate of increase to ~50% of the peak, followed by a slower rate of increase to the peak (Figure 4C), in agreement with an earlier report (Mandeville et al, 1999). After treatment, only the slow component persisted (Figure 4D). In three out of five subjects, there was a significant increase in the degree of baseline CBV variation, with an across subject average change in baseline CBV oscillation of 40% ± 24% after the 7-NI treatment.
Percent difference map of the average CBV signal changes elicited by stimulation before the 7-NI administration (
Figure 5 shows epoch-to-epoch CBF (Figure 5A), BOLD (Figure 5B), and CBV (Figure 5C) responses to somatosensory stimulation, normalized to their respective predrug magnitudes and averaged across subjects. In all subjects, 7-NI had a significant effect (P < 10−6) on the stimulation-induced hemodynamic responses. The average across subject CBF response was 53 ± 6% before treatment and it was nulled by 7-NI, with the average post-drug CBF response (discounting the ~1500 secs of transient after the 7-NI bolus administration) of −0.6% ± 3.1%, for an ~100% attenuation. Meanwhile, the average across subject BOLD response was reduced from 4.9% ± 0.6% before 7-NI to 1.3% ± 0.6% after 7-NI (~70% attenuation) and the average across subject CBV response, decreased from 14% ± 1% before treatment to 4.6% ± 0.5% after nNOS inhibition (~65% attenuation).
CBF (
Electrophysiology
The SEPs were composed of three major components: an early small positive peak (P1), followed by a strong negative peak (N1), and a third positive peak (P2). A typical set of EEG traces from a subject, averaged across all epochs, is shown before and after 7-NI administration in Figures 6A and 6B. Figures 6C and 6D show epoch-to-epoch SEP amplitudes (here defined as the difference between N1 and P2 amplitudes) and latencies, averaged across all subjects and normalized to their respective magnitudes before 7-NI bolus. The SEP component amplitudes underwent a pronounced drop (P < 10−3) over the course of the experiment. The P1 peak decreased by 15% ± 12%; the N1 peak, by 41% ± 7%; and the P2 peak, by 37% ± 6% after 7-NI bolus. The SEP amplitude thus dropped by 40% ± 6%. This SEP amplitude drop started immediately after administration of 7-NI, and stabilized after about 1500 secs after treatment, consistent with the gradual attenuation of the hemodynamic responses observed in Figure 5. The SEP component latencies exhibited a small, though statistically significant (P < 10−6) increase: the P1 latency rose by 5% ± 3%; the N1 latency, by 3% ± 2%; and the P2 latency, by 7% ± 2%.
SEP traces in a typical subject, averaged over the epochs before the 7-NI treatment (
Coupling Between Hemodynamic and Neuronal Responses
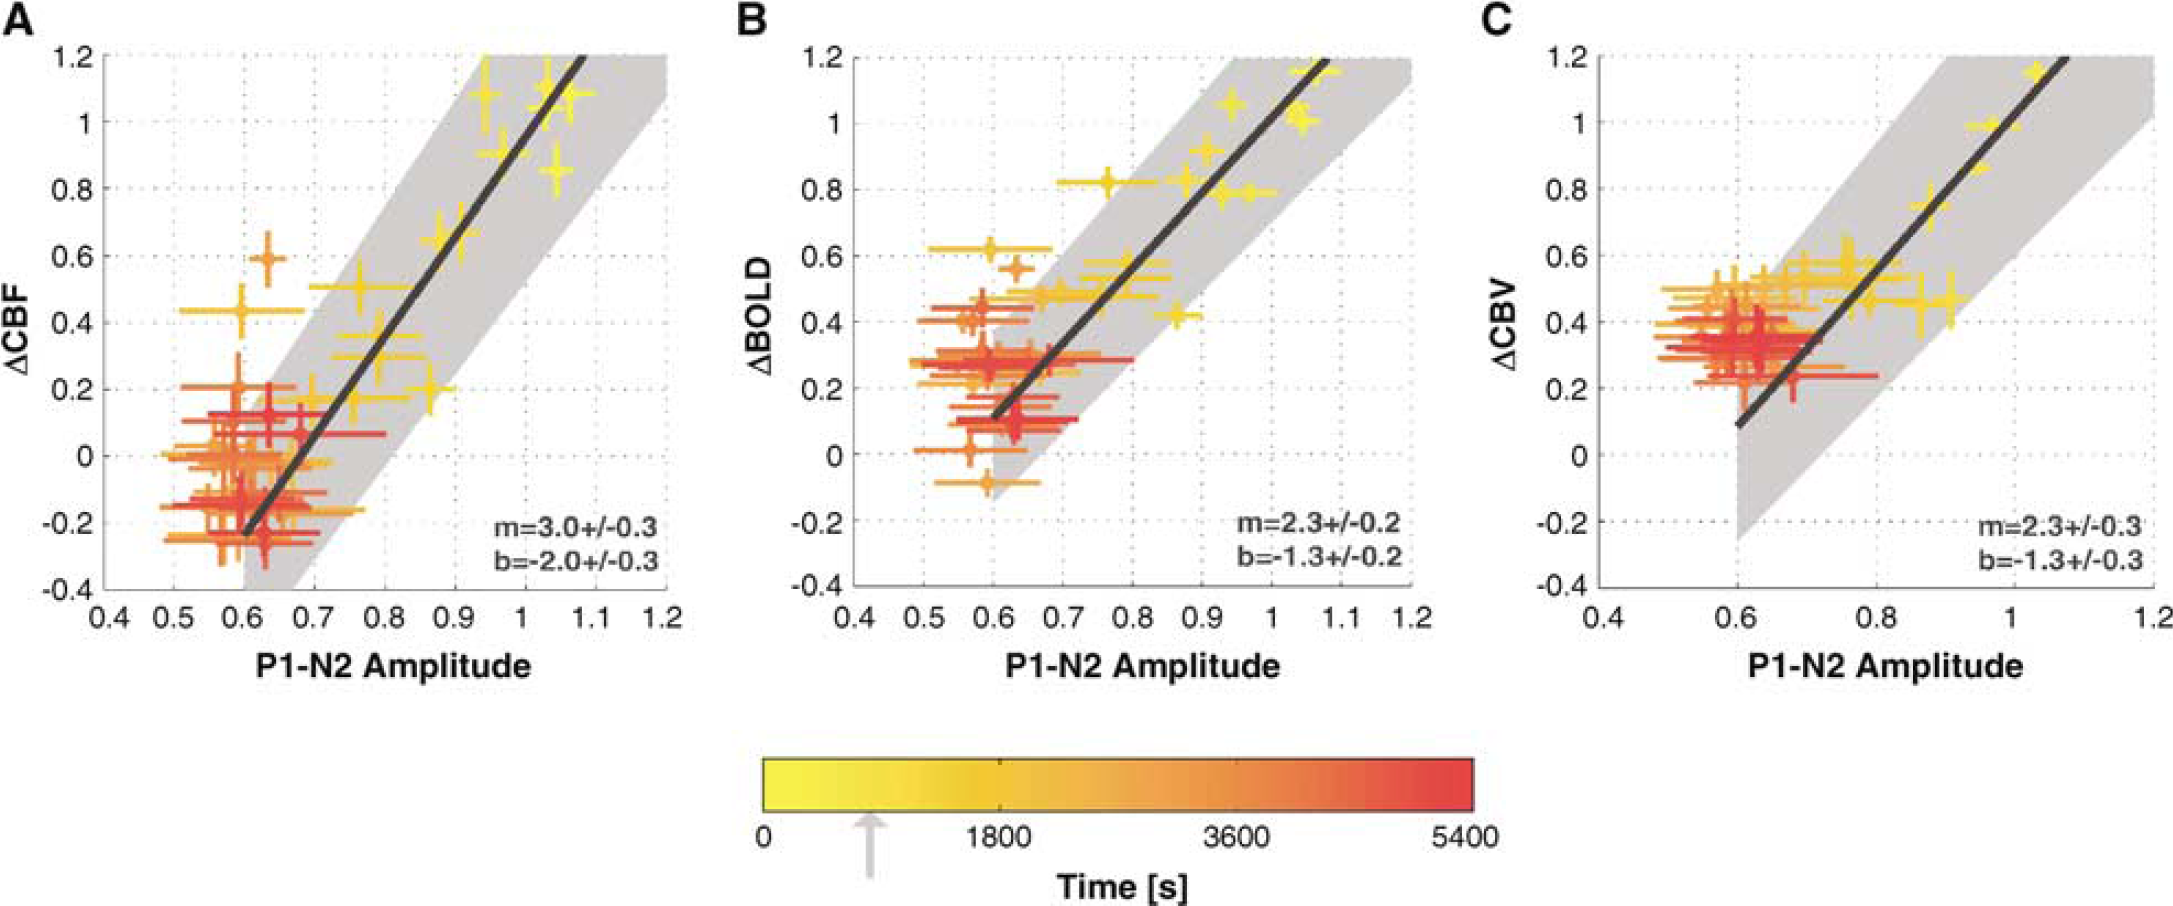
To evaluate the relationship between the hemodynamic and neuronal responses to somatosensory stimulation after treatment with 7-NI, all the responses were plotted in Figures 7A to 7C. Within each subject, the ROI data were normalized to the mean response magnitude before drug treatment. Thereafter, an average across subjects was taken at each epoch. The color intensity indicates the half-point into the epoch acquisition (see color bar in Figure 7). The functional uncoupling of the hemodynamic from neuronal responses is seen in the saturation regime of the hemodynamic versus neuronal response plots (red clouds of Figures 7A to 7C). The optimal linear fit (Press, 1992) to the data collected before the saturation (i.e., time interval including pre-7NI epochs and first 1500 secs after the 7-NI bolus) is displayed in each case, with the slope (b) and intercept (m) parameters shown on bottom right. The slopes of the optimal linear fits to these data (3.0 ± 0.3 for CBF; 2.0 ± 0.1 for BOLD; and 2.3 ± 0.3 for CBV) are significantly larger than unity, reflecting the larger attenuation of the hemodynamic response when compared with that of the neuronal response. While each of these three straight line fits has an intercept estimate that is negative and significantly different from 0, it should be noted that the crossing of the ordinate occurs either before (CBV, BOLD) or in (CBF), the saturation regime making the intercept estimation particularly difficult. Unsurprisingly, the level of noise and the spread of data are much higher in the saturation regime.
Average across subject CBF (
Discussion
The present work characterizes the functionally specific effects of nNOS inhibition on hemodynamic and neuronal responses to stimulation. The intraperitoneal administration of 50 mg/kg 7-NI, previously shown to cause over 90% nNOS inhibition (Bush and Pollack, 2000; Montecot et al, 1998; Moore and Bland-Ward, 1996), suppressed the CBF response and caused a ~70% decrease in ΔBOLD and ΔCBV, with only a ~40% decrease in the SEP amplitude. These declines in the stimulation-induced signal changes occurred in the absence of any perturbations in the resting perfusion level. In view of the disproportionately large decline of the hemodynamic response relative to the attenuation of the neuronal response, the data describe a prolonged, pharmacologically induced disruption of the cerebrovascular coupling. Moreover, the results support a critical role of NO of neuronal origin in the elicitation of functional hyperemia.
Systemic Effects of 7-Nitroindazole
No effects of the intraperitoneal administration of 7-NI (50 mg/kg) were detected on any of the physiologic variables monitored, including mean arterial blood pressure, heart rate, or rectal temperature. This result is in agreement with previous reports (Moore et al, 1993; Moore and Bland-Ward, 1996), and is consistent with 7-NI's in vivo specificity for nNOS (Moore and Bland-Ward, 1996), which likely results from cell-type specificity (Alderton et al, 2001). Nonspecific inhibition of NOS, in contrast, has been reported to produce increases in systemic blood pressure (Rees et al, 1989) or induce rhythmic blood pressure, flow or capillary red blood cell velocity oscillations, commonly associated with vasomotion (Lindauer et al, 1999; Hudetz et al, 1995; Morita-Tsuzuki et al, 1993; Dirnagl et al, 1993). A heterogeneous increase in the baseline signal oscillations was observed in some of our CBV studies. Such an enhancement of vasomotion may have been mediated by a concomitant influence of 7-NI on the endothelial NOS, which is the NOS isoform frequently promulgated to be involved in the regulation of resting vascular tone (Arnal et al, 1999). (Note that the CBV experiments had an order of magnitude higher temporal resolution than the CBF acquisitions, the latter being restricted by labeling and differencing requirements.) Nonetheless, no effects on the blood pressure were seen in any experiments, in agreement with other studies that found no effect of 7-NI on the tonic resistance of pial vessels (Pinard et al, 2000; Faraci and Brian Jr, 1995; Yoshida et al, 1994; Wang et al, 1995).
While we observed no significant changes of resting CBF in S1FL after 7-NI administration, other studies have reported heterogeneous 7-NI-induced drops in baseline CBF (by 10% to 60%) and decreased erythrocyte velocity and flux in capillaries have been reported (Pinard et al, 2000; Montecot et al, 1997, 1998; Kelly et al, 1995; Cholet et al, 1996). However, even in those studies, the 7-NI elicited changes in the resting CBF in the somatosensory cortex (Cholet et al, 1996) and frontoparietal cortex (Grome et al, 1995) of anesthetized rodents typically did not reach statistical significance. Due to the limitations of the presently employed techniques, the effects of 7-NI on the resting BOLD and CBV signals could not be reliably separated from other sources of low-frequency drifts in the baseline GRE signals. Future studies are needed to establish the precise sources of the NO involved in the resting CBF regulation across the different brain regions.
7-Nitroindazole Effect on Cerebral Blood Flow Response
Earlier studies in anesthetized rodent models reported a wide range of attenuation (from 30 to 90%) of the CBF response to somatosensory stimulation after NO inhibition (Northington et al, 1992; Dirnagl et al, 1993; Irikura et al, 1994; Ngai et al, 1995; Ma et al, 1996; Lindauer et al, 1996, 1999; Cholet et al, 1997; Bonvento et al, 2000). However, a number of these findings was confounded by the use of nonselective inhibitors of NOS (such as
7-Nitroindazole Effect on Neuronal Response
The first component of the SEP, P1, represents cortical depolarization from thalamic afferents, while the P1 and N2 components represent local intracortical processing (Jones and Barth, 1999). While N1 and P2 amplitudes decreased by ~41% and ~37%, there was a much smaller decrease in the P1 amplitude, of 15%, following 7-NI administration. The smaller effect of 7-NI on the P1 amplitude is consistent with a sparse presence of nNOS in thalamus (Kidd et al, 1995; Hara et al, 1996) and is in agreement with previous studies that found no influence of NO inhibition on the prethalamic and precortical areas (Kelly et al, 1995).
In agreement with the current findings, decreased NMDA receptor stimulation-induced O2 consumption after 7-NI administration has been reported (Chi et al, 2003). Similarly, nonspecific NOS inhibition by
7-Nitroindazole Effect on Cerebrovascular Coupling
The decrease in N1 and P2 amplitudes after the 7-NI bolus may have resulted from a direct effect of NO on electrical activity. Nitric oxide has been reported to play a role in glutamate neurotransmission, with NOS inhibition leading to decreased NMDA receptor mediated release of glutamate (Oh et al, 1999; Montague et al, 1994). In addition, NOS inhibition has been found to increase basal and NMDA evoked GABA release (Getting et al, 1996). However, both excitatory and inhibitory effects of NO have been reported (Ferraro and Sardo, 2004), the two leading to distinct changes in the associated energetic costs (Hyder et al, 2006), and only limited reduction of SEP magnitudes (~10%) after NMDA receptor blocking has been observed (Gsell et al, 2002). Alternatively, the SEP reduction could have been secondary to the hemodynamic response attenuation. Nulling of the blood flow response to stimulation may have led to a decrease in the ‘metabolic reserve' of the tissue, thereby limiting the CMRO2 increase and the maximum neuronal response (Aubert and Costalat, 2002; Buxton and Frank, 1997; Hyder et al, 1998; Gjedde, 2002). There were no apparent differences in the time course of decay of the CBF responses (Figures 5A to 5C) relative to the decay in SEP amplitude (Figure 6C). Extending the stimulation period to as much as 5 mins, moreover, was not found to produce any further decreases in the SEP magnitude after the 7-NI bolus administration (data not shown), suggesting an independence of the neuronal response over the present range on the stimulation-induced CBF increase (Ueki et al, 1988; Cholet et al, 1997; Gjedde et al, 2005).
Conversely, the absence of the CBF increase after stimulation may have been secondary to the decrease in the neuronal responses. However, the relationship between the CBF and the neuronal response under varying stimulus parameters in rat somatosensory cortex has been studied extensively by several different laboratories (Ureshi et al, 2004; Ngai et al, 1999; Bakalova et al, 2001; Hewson-Stoate et al, 2005) and a linear dependence demonstrated over the present range. The saturation of the hemodynamic versus neuronal response plots observed here (red clouds in Figures 7A to 7C) supports a critical role of NO in ensuring the normal hemodynamic response to focal neuronal activation. At the same time, the persistence of SEPs in spite of the dramatic decrease in the hemodynamic responses provides further evidence against neuronal dependency on blood flow increases after stimulation (Ueki et al, 1988).
The spatial sensitivity profile of an electrode is dependent on its impedance, which is a function of both material and size. Whereas no attempts were made in the current work to measure the volume of sensitivity for the current electrode configuration, it should be noted that the epidural electrode placement in combination with a small (~ 7 mm) distance between the two electrodes ensure sensitivity profiles akin to those achieved with intracerebral placements of the electrodes (Mitzdorf, 1987) rather than those obtained with surface EEG electrodes (Ngai et al, 1998b; Malmivuo and Plonsey, 1995). This translates into a half-sensitivity volume on the order of the S1FL volume (~8 mm3). Accordingly, we consistently see that small misplacements of the electrodes over S1 can lead to substantial attenuation of the SEPs. While the SEPs reflect neuronal activity over a broader volume of tissue than the fMRI ROI averages, the two regions are comparable to the volume of cortical representation of the forelimb. However, estimation of the neuronal response via SEPs is different from the estimation of the hemodynamic responses via fMRI as no measurements of electrical activity are made during the stimulation-off periods. Thus, there is a serious—albeit not easily overcome—difference in reference points for the neuronal versus hemodynamic response measures. Due to the distinct referencing of the respective measures, the plots of Figure 7 are meant to illustrate the general trend of the saturation of the neuronal relative to the hemodynamic response: no quantitative interpretation of the fits, such as slope and/or intercept comparisons, is intended. Efforts are currently underway in our laboratory to perform the estimation of the responses in more analogous fashion and thus facilitate the quantitative analysis of the results.
As illustrated in Figure 4, even after the CBF signal change was no longer detectable, small, positive BOLD and CBV responses persisted, clearly indicating that the 7-NI treatment did not entirely abolish the vascular response. Since both BOLD and CBV measurements have a higher CNR than that of CASL CBF, the post-7-NI CBF response might simply have been too low for reliable assessment by CASL. If the coupling between BOLD, CBF, and CBV were preserved after 7-NI administration, a 15% average, stimulus-induced CBF increase would have been expected post-7-NI. It is unlikely that this signal change is below CASL detectability. (Note, also, that no significant changes in T1 were observed after 7-NI administration.) The data thus suggest a change (however limited) in the relative CBF versus BOLD/CBV relationship.
The small (4.6% ± 0.5%) post-7NI CBV response to stimulation may be compensatory, akin to the CBV increases observed in the viable brain tissue after infarction (Powers and Raichle, 1985; Muizelaar et al, 1997). The persistence of a positive, though small, BOLD response to stimulation under nNOS inhibition is less clear. Since a BOLD signal increase results from the decrease in the net deoxyhemoglobin content of the voxel, it is directly proportional to CBF and inversely proportional to both CMRO2 and the deoxygenated blood volume. The larger than expected BOLD response thus could have resulted from a decrease in oxygen consumption during stimulus-on relative to stimulus-off periods after 7-NI administration. While BOLD signal models were derived under steady-state, physiologic conditions and are hence not applicable to the current circumstance, it is interesting to consider their predictions. Given the measured BOLD and CBF changes and assuming an average 25% increase in CMRO2 after forepaw stimulation α-chloralose anesthetized rats (Hyder et al, 2001) before 7-NI treatment, a conventional BOLD signal model (cf. Equations (13) and (14) in Hoge et al, 1999) at 7T calls for an ~1% decrease in O2 consumption after stimulation relative to stimulus-off baseline after the 7-NI treatment. While no attempts were made at quantifying the oxygen consumption in this study, a tonic, competitive, reversible, and dose dependent inhibition of cytochrome c oxidase by NO at physiologic relevant levels has been demonstrated (Brown, 2001; Brown and Cooper, 1994; Cleeter et al, 1994; Schweizer and Richter, 1994), so that baseline mitochondrial O2 consumption may have been upregulated by nNOS inhibition. Furthermore, there are data suggesting an involvement of nNOS in CMRO2 increase after direct exogenous stimulation of NMDA receptors (Chi et al, 2003). However, much uncertainty surrounds these data, in part due to the complexity of mapping NO and O2 concentrations in vivo and the intrinsic instability of NO. Finally, larger than expected BOLD responses (given flow and electrophysiologic responses to forepaw stimulation) have been observed in the course of recovery from cardiac arrest (Schmitz et al, 1998). Moreover, disturbances in the usual coupling between neuronal, metabolic and hemodynamic variables have been reported both in pathologic states and after pharmacological perturbations (Ueki et al, 1988; Nehlig et al, 1992; Cholet et al, 1997). Notwithstanding, the influence of nNOS inhibition on O2 extraction and metabolism warrants further investigations, especially in view of the limited accompanying decrease in the SEP amplitude.
Other Agents
The present findings do not exclude significant contributions of other vasodilating agents in engendering functional hyperemia, particularly under nonphysiologic conditions. For instance, normal stimulation-induced CBF responses were recorded in the somatosensory cortex of nNOS−/− mice, suggesting an existence of NO independent compensatory mechanisms that ensure normal cerebrovascular coupling in the absence of NO (Ma et al, 1996). Similarly, normal cortical CBF increases after NMDA receptor activation were observed during chronic NOS inhibition (Pelligrino et al, 1996), indicating compensation mechanisms can be rapidly activated.
Finally, it is not clear whether α-chloralose affects the signaling pathway linking neuronal to hemodynamic changes. No effects of nonselective NOS inhibition on the somatosensory stimulation elicited CBF responses have been observed in a number of awake rodent models (Wang et al, 1993; Adachi et al, 1994; Greenberg et al, 1999), though the lower degree of NOS inhibition and/or method sensitivity may well account for the lack of an effect (Iadecola et al, 1994). Further investigations in awake animal models are necessary to address this issue.
In conclusion, we have observed a strong decoupling between hemodynamic and neuronal responses to functional stimulation after systemic administration of an inhibitor of nNOS. 7-Nitroindazole suppressed the CBF response and caused a ~ 70% decrease in BOLD and CBV responses, without affecting the baseline perfusion. While the amplitude of somatosensory evoked potentials also exhibited an immediate decline after the 7-NI bolus, this decrease saturated at ~60% of the pre-7NI SEP amplitude. The data thus describe a prolonged, pharmacologically induced disruption of the cerebrovascular coupling and support a critical role of NO of neuronal origin in the elicitation of functional hyperemia.
Footnotes
Acknowledgements
The authors would like to thank Dr Alan Koretsky for enlightening scientific discussions and Sachy E Sato for her invaluable help in animal preparation and surgery.